E GYPT - UNECE Central Agency for Public Mobilization & Statistics Km: Kilo meter LE: Egyptian Pound...
41
ECONO for Cli POLICY OMIC AND United N Promot mate Chan REFORMS T SOCIAL C Nations De ting Energ nge Mitigat C E S TO PROM TRANSPOR Dev Ham I COMMISSIO velopment y Efficienc tion and Su Case study EGYPT MOTE ENE RTATION S veloped by med Korko ON FOR W Account pr cy Investm ustainable ERGY EFFI SECTOR y: r WESTERN A roject ments e Developm ICIENCY IN ASIA ment N THE
Transcript of E GYPT - UNECE Central Agency for Public Mobilization & Statistics Km: Kilo meter LE: Egyptian Pound...

ECONO
for Cli
POLICY
OMIC AND
United N
Promot
mate Chan
REFORMS
T
SOCIAL C
Nations De
ting Energ
nge Mitigat
C
E
S TO PROM
TRANSPOR
Dev
Ham
I
COMMISSIO
velopment
y Efficienc
tion and Su
Case study
EGYPT
MOTE ENE
RTATION S
veloped by
med Korko
ON FOR W
Account pr
cy Investm
ustainable
ERGY EFFI
SECTOR
y:
r
WESTERN A
roject
ments
e Developm
ICIENCY IN
ASIA
ment
N THE

II
CONTENTS Page
Abbreviations...................................................................................................................................... III
Introduction......................................................................................................................................... 1
Chapters
1. Introduction..................................................................................................................................... 1 2. Transport Sector Main Characteristics............................................................................................ 1
2.1. Road Transport.................................................................................................................... 2 2.2. Railways Transport...…..…………………………………………………………………. 2 2.3. River Transport…................................................................................................................ 2 2.4. Energy Consumption and GHGs Emission by the Transport Sector…......………………. 3
3. Current Policy.................................................................................................................................. 4 4. Energy Efficiency Potential………………………………………………………………........... 7
4.1. Energy Efficiency Potential of OVSRP................................................................................ 8 4.2. Energy Efficiency Potential for the usage of CNG as a fuel for vehicles.……………….. 10 4.3. Energy Efficiency Potential of Cairo Metro……………………….……………………... 12
5. Assessment Methodology……………………………………………………………………….. 13 5.1. OVSRP Assessment Methodology….……………………………………………………. 13
5.2. CNG Assessment Methodology.......................................................................................... 15 5.3. Cairo Metro Assessment Methodology................................................................................ 15
6. Economic, Environmental and Policy Analysis……………………………………………....... 15 6.1. OVSRP Economic, Environmental and Policy Analysis.................................................... 15
6.1.1. OVSRP Finance Support by the Ministry of Finance (MoF)...................................... 15 6.1.2. OVSRP Financial Support through the WB Carbon Finance Programme…....…..... 16
6.1.3. OVSRP Incentives and Economic Benefits and Revenues......................................... 17 6.1.3.1. OVSRP Incentives........................................................................................17
6.1.3.2. OVSRP Economic Benefits and Revenues...................................................18 6.1.4. Environmental and Socio-Economic Impacts of the OVSRP.................................... 18
6.2. The use of CNG as a fuel for vehicles Economic, Environmental and Policy Analysis............................................................................................................................ ...20
6.2.1. The use of CNG as a fuel for vehicles Economic Issues and Consideration.....…… 20 6.2.2. The use of CNG as a fuel for vehicles Environmental Issues and Consideration..... 21 6.2.3. The use of CNG as a fuel for vehicles Policy Analysis…......................................... 22
6.3. Economic, Environmental and Policy Analysis of Cairo Metro………………................ 22 6.3.1. Economic Analysis of Cairo Metro………………………………………….......... 22 6.3.2. Environmental and Socio-Economic Impacts of Cairo Metro………………......... 23
7. Policy Design Consideration…………………………………………………………………..... 24 7.1. OVSRP Policy Design Consideration…………………………………………………….. 24 7.2. The Usage of CGN as a Fuel for Vehicles Policy Design Consideration..……………... 25 7.3. Cairo Metro Policy Design Consideration......................................................................... 27
8. Barriers / Obstacles against Implementation and Lessons Learned……………………………... 27 8.1. OVSRP Barriers/ Obstacles against Implementation and Lessons Learned…………… 27
8.2. The Usage of CGN as a Fuel for Vehicles Barriers/ Obstacles against Implementation And Lessons learned …...............………………………………………………………… 28
8.3. Cairo Metro Barriers / Obstacles against Implementation and Lessons Learned………..... 29 9. Conclusions and Recommendations……………………………………………………………... 29

III
CONTENTS (continued) Page
9.1. Conclusions ....................................................…………………… …………………....... 29 9.2. Recommendations…….......................................................................................................... 31
10. References..................................................................................................................................... 32 Appendices………………………………………………………………………………………... 33
Appendix (1) Transport Sector Planned Projects..……………………….................................. 33 Appendix (2) Cairo Metro lines Map......................................................……............................ 34 Appendix (3) OVSRP Stakeholders and their Role and Responsibilities................................... 35 Appendix (4) Vehicles Scrapping and Recycling Program Worldwide…….............................. 36 Appendix (5) Examples of Implemented VSRP Worldwide…………………………………… 37
LIST OF TABLES Table 1 Passengers and freight transport activity development (1981/1982-2011/2012)...................... 2 2 Transport sector petroleum energy consumption (1981/1982-2012/2013)............................................ 4 3 Development of motor transport during the period (1970-1998)............................................... 6 4 Average age of registered taxis in GCR and in Egypt....................................................................... 9 5 Summary of GHGs reduction as a result of implementing the OVSRP………………………. 9 6 Proposed future plan for old taxi vehicles scrapping and recycling……………………………10 7 OVSRP Gasoline saving and GHGs emission reduction (2013 - 2018).................................... 10 8 CO2 emission reduction due to the use of CNG as a fuel for vehicles (1997/98-2012/13)…... 11 9 some of the assumptions considered in estimating fuel saving and GHGs emissions reduction
for the OVSRP in GCR……………………………………………………………………….. 14 10 Estimated Project Cost (2010-2018)……………………………………………………………16 11 Estimated average benefit for vehicles owners…………………………………………………17 12 Economical Benefits (Saving) to Car Owners………………………………………………….21 13 Cairo Metro lines main characteristics and associated investments..............................................23
LIST OF FIGURES
Figure Page
1 Simlified presentation of the smart card framework…………………………………………. 20
ABBREVIATIONS mtoe: million tons of oil equivalent CO2: Carbon Dioxide USD: United States Dollar GCR: Greater Cairo Region OVSRP: Old Vehicles Scrapping and Recycling Program CNG: Compressed Natural Gas ESCWA: East and South Countries of West Asia CAPMAS: Central Agency for Public Mobilization & Statistics Km: Kilo meter LE: Egyptian Pound CH4: Methane

IV
N2O: Nitrogen Oxide CO: Carbon Monoxide HC: Hydro Carbons GHGs: Green House Gases CDM APU: Clean Development Mechanism Awareness and Promotion Unit EEAA: Egyptian Environmental Affairs Agency UNFCCC: United Nation Framework Convention on Climate Change CO2e: Carbon Dioxide equivalent MoP: Ministry of Petroleum NGVC: Natural Gas Vehicles Company CERs: Certified Emissions Reduction Units PoA: Program of Activities CPA: Component Project Activities SSC-CPA-DD: Small-Scale CPA Design Document CBA: Cost Benefit Analysis SSM: Soft System Methodology MoF: Ministry of Finance WB: World Bank IBRD: the International Bank for Restructuring and Development PPP: Public Private Partnership GDP: Gross domestic Product MSEA: Ministry of State for Environmental Affairs M3: Cubic Meter NOx: Nitrogen Oxides ISO: International Standards Organization TCF: Trillion Cubic Feet EIB: European Investment Bank AfD: Agence Française de Développement JBIC: Japan Bank for International Cooperation EU: European Union SME: Small and Medium Enterprises Environics: Egyptian Environmental Consultancy Company EIA: Environmental Impact Assessment NAT: National Authority for Tunnels PVC: Poly vinyl Chloride MoI: Ministry of Interior MoE: Ministry of Environment SOx: Sulphur Oxides Hr: Hour SEC: Supreme Energy Council BOT: Build Own Transfer

1
1. Introduction:
The transport sector is considered as one of the main drivers for social and economic development in Egypt. Meanwhile, it is considered as one of the major energy consuming sectors and sources of pollutants emissions. During the year 2012/2013, transport sector total energy consumption accounted for about 16.6 million tons of oil equivalent (mtoe) representing 23% of Egypt’s total final energy demand and 48% of total petroleum energy consumption. As a result, total carbon dioxide CO2 emissions from transport sector accounted for 49 million tons during the same year representing 26% of total CO2 emissions by all economic sectors. The continuous escalating energy demand for transport sector resulted also in the increase of both gasoline and diesel imports that accounted for about 1.1 and 6.9 million tons during the same year respectively. Furthermore, it contributed to the drastic increase of total petroleum energy subsidy that reached more than LE 128 billion (USD 18 billion) in 2012/2013.[1] Unless effective energy efficiency measures and policy reforms be taken that situation is expected to be worsen.
The current paper highlights some of the most important energy policy reforms that have been performed in the transport sector in Egypt during the last few decades in order to develop energy efficiency and air quality improvements projects. Particular emphasis has been made to policy reforms, programmes and projects eligible to attract energy efficiency investments and make it bankable of which are the Greater Cairo Region (GCR) Old Vehicles Scrapping and Recycling Programme (OVSRP), the utilization of Compressed Natural Gas (CNG) as a fuel for vehicles, and the construction and development of Cairo Metro. It worth mentioning that these programmes and projects represent three main transport sector energy efficiency and air quality improvements policy reforms which are the improvement of vehicles fuel consumption efficiency, fuel switching to cleaner fuels, and the development and encouragement of public transport utilization.
In addition, the paper highlights the main characteristics of the transport sector in Egypt, the relevant policies in place before the previous mentioned policy reforms and programmes were implemented, an assessment of expected energy saving and associated CO2 emissions reduction, environmental, social and economic impacts of their implementation, policies design consideration and the barriers, obstacles against their materialization. Moreover, the paper presents the future development of such programmes and policies nationally and the implications for their adoption in some countries of the ESCWA and the Arab regions.
2. Transport Sector Main Characteristics:
The transport sector in Egypt is characterised by relying mainly on roads for both passengers and freight transport. As shown from table (1), total passengers activity increased from about 65.4 billion passengers-km in 1981/1982 to about 264.1 billion passengers-km in 2011/2012 with an average annual average growth rate of about 4.8% during that period with road transport share accounted for about 68% compared to 32% for railways and almost 0% for river transport.
During the same period, total freight transport activity increased from about 18.3 billion tons-km in 1981/1982 to about 68.3 billion tons-km in 2011/2012 with an average annual average growth rate of about 4.5% with road transport share accounted for about 86% compared to 9% for railways and 5% for river transport. [2]

2
Table (1) Passengers and freight transport activity development (1981/1982-2011/2012) [2]
Year Road Railways River Total Passenger Activity (billion passengers-km)
1981/1982 47449 17903 7 65359 1991/1992 77494 46517 12 124023 2001/2002 112815 39083 15 151914 2011/2012 180340 (68%) 83730 (32%) 24 (0%) 264094 (100%)
Average Annual Growth Rate (%) 4.6% 5.3% 4.2% 4.8% Freight Activity (billion ton-km)
1981/1982 13890 2307 2114 18311 1991/1992 26261 3229 1761 31251 2001/2002 40605 4188 3712 48505 2011/2012 58776 (86%) 6280 (9%) 3277 (5%) 68333 (100%)
Average annual Growth rate (%) 4.9% 3.4% 1.5% 4.5% Source: Central Agency for Public Mobilization & Statistics (CAPMAS) and State Information Service Annual Reports.
2.1. Road Transport: Egypt has a road network of a total length of 121.4 thousand km of which 108.8 thousand km as paved roads with a share of 90% and 12.6 thousand km as unpaved roads with a share of 10%. The total number of vehicles in Egypt has increased from 1.1 million in 1990 to 6.6 million vehicles in 2012 with an average annual growth rate of 8.8% during that period. The private cars represented 49% of total vehicles fleet compared to 4.6% for taxies, 14.2% for trucks, 1.6% for buses, 26.1% for motorcycles and three wheel vehicles (tuk tuk) with other types representing the reminder which is 4.5%. More than 56% of total vehicles fleet exist in Cairo, Giza, Kalyoubia, and Alexandria governorates. Of total vehicles fleet volume about 26% of age of more than 27 years old and 25% of age between 17 to 26 years which result in inefficient use of fuel and higher rates of pollutants emissions.
2.2. Railways Transport:
Egypt railways are considered as one of the oldest railway systems worldwide. The establishment of the first line that connects Cairo to Alexandria started in 1851 and became in operation by the year 1854. Currently, there are 28 railway lines extends for more than 10 thousands kilometres and cover most of the inhibited areas of the country. However and as previously mentioned, the share of railways system represented 32% of total passengers transport activity and only 9% of total freight transport activity in 2011/2012. The lack of effective and efficient policies and plans for the development of the railways system and infrastructure coupled with poor maintenance, failure to integrate them effectively to other modes of transport in addition to reach and connect most of the economic, industrial and commercial zones by ports. are the main reasons for that relatively low share.
2.3. River Transport: Since its existence, the Nile River with total length of 3500 kilometres is being utilized in Egypt for both passengers and freight transport. Till the end of the 1960s, river transport had a considerable share of both passengers and freight transport as a result of the government involvement in the development of the necessary infrastructure and the control of transport prices. Since then and due to the lack of government policies to raise the efficiency and effectiveness of river transport in addition to the poor maintenance of its infrastructure and facilities, significant portion of both passengers and freight transport switched away, mainly to road transport which resulted in the continuous increase of both gasoline and diesel consumption and consequently the drastic increase of pollutants emissions and air quality degradation. Currently, the river navigation lines extend for a length of 3136 km.

3
There are 44 river ports with storage capacity of 1.2 million tons of freight. Most of the ports are connected to the main roads and only two connected to the railways system at Alexandria and the High Dam ports. Molasses, petroleum products, phosphates and stones are the main freight transported by the river representing more than 80% of total river transport freight. The decline share of river for both passengers and freight transport could be attributed to several factors which include the absence of the government subsidy and support to river transport activities, the lack of the government role and coordination in assigning specific volumes of freight to different transport modes including river transport, and the lack of proper maintenance, adequate development and modernization of the river transport infrastructure.
2.4. Energy Consumption and GHGs Emission by the Transport Sector:
Combustible energy commodities consumed by the transport sector in Egypt comprise gasoline, diesel and natural gas. In addition, lube oils are used as lubricant for vehicles engines while fuel oil is used for road paving activity. The increased passengers and freight activities during the last three decades since the early 1980s resulted in a tremendous increase in energy consumption by transport sector and accordingly pollutants emissions.
As shown from table (2), total transport sector petroleum energy consumption has increased from 3.8 million tons in 1981/1982 to 16.6 million tons in 2012/2013 with an average annual growth rate of 5% during that period. Therefore, transport sector share of total petroleum energy consumption (petroleum products and natural gas) increased to reach 23% in 2012/2013 and 48% of total petroleum products consumption during the same year.
During the period (1981/1982-2012/2013), gasoline consumption increased from 1.3 million tons in 1981/1982 to 6.1 million tons in 2012/2013 with an average annual growth rate of about 5%. The period (2001/2002-2012/2013) has witness the largest growth of gasoline consumption that accounted for 9% annually with about 20% of gasoline consumption is currently imported. Furthermore, diesel fuel consumption has increased from 1.7 million tons in 1981/1982 to 8.5 million tons in 2012/2013 with an average annual growth rate of 5.2% during that period representing 67% of total diesel consumption by all sectors during the same year (2012/2013) with almost 50% of diesel is imported. Natural gas consumption by transport sector has also increased from 0.6 thousand tons in 1995/1996, at the beginning of its utilization as a fuel for vehicles in Egypt to reach 0.4 million tons in 2012/2013 representing only 1% of total natural gas consumption by all sectors during the same year.
The prevailing heavily subsided petroleum energy pricing scheme resulted in massive increase of petroleum energy subsidy that reached more than LE 128 billion (more than USD 18 billion) in the year 2012/2013 of which transport sector share accounted for about 45%. Besides, the escalating energy consumption by transport resulted in pollutants emissions increase from that sector to reach more than 49 million tons of CO2 in 2012/2013 representing 26% of total CO2 emissions by all sectors during the same year in addition to 2.1 thousand tons of CH4 and 0.4 thousand tons of N2O.
From transport sector activity perspective, total energy consumption by both passenger and freight transport activities estimated at about 14.9 million tons oil equivalent (mtoe) in 2011/2012 of which 10.7 mtoe by passenger transport activity (representing about 72% of total energy consumption) and about 4.2 mtoe by the freight transport activity (representing about 28% of total energy consumption).

4
Table (2) Transport sector petroleum energy consumption (1981/1982-2012/2013) - (‘000 tons) 1981/1982 1991/1992 2001/2002 2012/2013 Average Annual Growth Rate %
Gasoline 1349 2041 2386 6079 5%
Turbine 337 453 402 590 1.8%
Gas oil 1740 2908 5284 8462 5.2%
Fuel Oil 103 155 750 279 3.3%
Others 227 215 1099 820 4.2%
Total Petroleum Products 3756 5772 9921 16230 4.8%
Natural Gas 0 0 244 400 5%
Grand Total 3756 5772 10165 16630 4.9%
Source: EGPC & EGAS.
3. Current Policy:
Despite the vital role that transport sector plays in achieving both economic and social development in Egypt and although several energy efficiency policy reforms had implemented during the last decades; energy consumption levels by that sector are still high reflecting the inefficient use of energy in addition to the need for more reform of the existing and implemented energy efficiency policies and measures. In that regard, it worth to mention that the social and economic development in Egypt in addition to population growth particularly in major crowded cities and regions like GCR resulted in severe problems of which putting more pressure on existing transport traffic systems and infrastructure. The limited capacity of existing public transport fleet by the early 1970s that relayed mainly on buses and trams for intra-city passenger transport and on railways and busses for intercity public transport in addition to its inconvenient and lack of appropriate maintenance led to the switch of a significant volume of passengers from public transport to private cars. A similar switch of freight transport occurred from railways and river transport to road transport, mainly trucks. That situation resulted in turn to more traffic jams and consequently more fuel consumption and pollutant emissions. Other consequent negative impacts include the increase of gasoline and diesel imports, the tremendous escalation of energy subsides and more economic returns loss. Among the various policy reforms and measures that have been considered by the government of Egypt to promote energy efficiency in the transport sector and reduce pollutants emissions are the promotions and development of public transport, fuel switching to cleaner fuels (the use of CNG as a fuel for vehicles), upgrading of vehicles fleet, the development of transport infrastructure, traffic management, enhancing engine maintenance and tuning up.
In addition, prevailed policies before the implementation of the three investigated transport sector energy efficiency programmes and measures (OVSRP, the use of natural gas or CNG as a fuel for vehicles, and the construction and development of Cairo metro system) include the following: [5]
1. Vehicles emissions testing and engine tuning programme that comprise two main activities, the first with the objective to increase public awareness of the importance of periodic vehicles inspection. Through that activity inspection is made free of charge as an incentive to encourage vehicles owners to participate in the programme. The second activity of the programme aimed at testing vehicles emissions through 26 sites in GCR. About 50 thousand vehicles have been tested through that programme and about 66% of vehicles inspected were found to comply with the Egyptian national pollutants emissions standards. In addition, the inspection and tuning of the engines of a sample of 1286 vehicles in 1995 showed that Carbon Monoxide (CO) emissions were reduced on average by 62% compared to 35% for HC and 15% for fuel consumption.
2. Improving traffic management that aims at achieving smoothly traffic flow and consequently more efficient fuel consumption and less pollutants emissions. Three main approaches for implementing

5
that policy were followed that include: (1) redesigning traffic signals, (2) eliminating obstructions to traffic (such as organizing on-street parking, clearing sidewalks, enhancing shared taxi movements and introducing simple geometric designs at selected intersections), and (3) grade separation and public transport solutions. While the first is considered as the cheapest approach (of almost no cost) the last or the third approach is considered as the most expensive measure. Based on the results of a performed study to assess the impacts of implementing the three previous mentioned options for traffic management on two of GCR corridors, fuel saving ranged between 42% to 45% and the reduction of CO emissions ranged between 5.5% - 23%. The third approach (introducing simple geometric designs at selected intersections) proved to have the highest fuel saving and CO emission reduction option.
3. Restricting vehicle use and ownership in GCR and Alexandria as they considered as the highly populated and crowded regions of the country.
Other implemented policies and measures that dealt mainly with improving air quality rather than improving energy efficiency include the use of unleaded gasoline, urban planning and land use, air quality monitoring, and the enforcement of GHGs mitigation standards and regulations.
It worth to mention also here that the transport sector policy since the 1970s characterized by the following main features: [3] - Continuous development of major roads infrastructures such as bridges, ring roads, radial
motorways, underground carriageways. - Partial liberalisation of the surface public transport network which resulted in a considerable
expansion of private microbus lines. - Progressive desertion of the tramway network and abandonment of all trolleybus lines, - Failure to build the planned railway links with the planned new towns, - Control on public transport networks in order to make it more accessible to the poorer classes of
the society. The use of poorer social classes of public transport could be attributed to the relatively low fare of transport cost compared to other modes of transport.
- Extension of the bus network at the expense of the density of supply and of regularity, and without creating segregated lanes,
- Absence of consultation between the various authorities in charge of transport. - Conventional surface networks such as buses and minibuses are badly affected by the traffic
congestion. The drop in speed generates extra operating costs and affects their attraction. - The increase of private shared taxi network which now accounts for a substantial share of
transport modes and has taken advantage of the increasing shortfall in the bus supply. - The development of the metro network was slower than the increase in the number of travels
therefore an increase in traffic congestion in certain districts where the metro is not available occurred. This in turn negatively affected the performance of the bus network leading, among other aspects, to an increase in its operating costs. Moreover, the metro network serves the main North - South travel corridors. Other corridors, which are equally important, do not benefit from efficient and suitable public transport infrastructures with the result that they suffer from extensive traffic congestion due to the increased reliance on private cars. According to the transport sector master plan of the year 2012/2013, the growth of GCR’s population will result in an increase in total public daily transportation trip from about 25.2 million trips/ day currently to about 33 million trips/ day in the year 2022 which means an increase of about 7.8 million trip/day which is expected to be accommodated by Cairo Metro System.

6
- The increases in living standards during the 1970s till the end of the 1990s had resulted in several consequences that negatively affected the transport sector energy demand and consequently pollutants emission. Among these consequences are the remarked increase in number of cars per household, the increase in transport mobility, the dramatic increase in the number of trips and the increase in congestions levels and travelling times. Accordingly, the market share of motorized modes of transport had increased during the three decades, the period (1970-1998) as shown from table (3). [3]
Table (3) Development of motor transport during the period (1970-1998) Motor modes Market share in 1970 Market share in 1998Car and taxi 13% 26% Metro* 0% 17% Tramway 15% 2% Bus and minibus 62% 19% Microbus 0% 28% Others (ENR, school and factors buses, boats) 9% 7&
Source: Household surveys in 1971 and 1998 (in travel per main mode). World Bank Urban Transport Strategy Review, the Case of Cairo, Egypt, WB, November 2000. * The market share of metro reached 20% in the year 2000 as a result of the operation of line 2 of Cairo metro.
- Except for Cairo metro, the lack in developing the appropriate and adequate public transport networks and infrastructure (public buses, trams, railways, river, etc.) during the last few decades resulted in tremendous challenges that have been highlighted though the Urban Transport Strategy for Greater Cairo Region of which are the following: [4] Traffic congestion that causes severe negative economic and environmental impacts. Poor public passengers transport system which relies mainly on poorly maintained public buses
most of which are out of service. Among the main reasons that led to that situation is the large subsidy and low fares set by the government to that service which prevent operating public bus companies to provide sustainable, reliable, convenient and good quality transport service and consequently to be able to compete with other modes of transport.
High rate of accidents that account for more that1000 deaths and 4000 injuries yearly. High levels of air and noise pollution. Lack of adequate, effective and reliable financial schemes and mechanism that lead to the miss
allocation and under investments necessary for the development of transport sector infrastructure and facilities in addition to the inefficient and minor participation of the private sector in financing and managing different transport sector infrastructure projects and services.
As a result of the previous mentioned transport sector problems and main challenges, it was imperative for the government of Egypt to take the necessary actions and set the appropriate policies to encourage passengers’ public transport and to switch considerable portion of vehicles fleet to more clean and efficient fuels in addition to the development and upgrading of the existing infrastructure. Appendix (1) show a list of transport sector ongoing and planned projects classified according to different transport sector activities (railways, road, river and maritime) which provides several investments opportunities. Furthermore, the following sections of this paper shed light on Egypt’s experience of promoting and implementing some of the transport sector energy efficiency policy reforms and measures that include Old Vehicles Scrapping and Recycling Programme (OVSRP), usage of Compressed Natural Gas (CNG) as a fuel for vehicles, and Cairo Metro as mentioned before. An assessment of expected energy savings and associated CO2 emissions reduction, environmental, social and economic impacts of policies implementation in addition to their design consideration and the barriers, obstacles against their materialization has been performed.

7
4. Energy Efficiency Potential:
In assessing future energy efficiency potential in the transport sector in Egypt as a result of implementing some of the energy efficiency policy reforms, programmes and measures, an assessment has been made which comprised the following main activities: 1. Projecting both passengers and freight activities till the year 2030; assuming no energy efficiency
reforms to be made (business as usual scenario) and choosing 2011/2012 as the base year. 2. Estimating the corresponding expected levels of energy consumption and the associated CO2
emissions till the year 2030. 3. Estimating the expected potential energy savings and associated reductions of CO2 emissions
during the coming years till 2030 as a result of implementing some of the energy efficiency policy reforms and measures in the transport sector that include as examples the following: Encouragement of public passenger transport. Increase the role of railways in freight transport. Increase the role of river in both passengers and freight transport. Improve the performance of roads freight transport. Expansion of Cairo metro. Improve vehicles fuel economy.
The assessment of the business as usual scenario highlighted the following main results: - Total passengers activity is expected to increase from 264 billion passenger.km in 2011/2012 (the
base year) to 617 (billion passengers.km) in 2030. - Road passengers activity is expected to increase from 180 (billion passenger.km) in 2011/2012 to
405 (billion passengers.km) in 2030, - Railways passengers activity is expected to increase from 84 (billion passenger.km) in 2011/2012
to 212 (billion passengers.km) in 2030, - River passengers activity is expected to increase from 0.024 (billion passenger.km) in 2011/2012
to 0.051 (billion passengers.km) in 2030, - Road transport is expected to remain have the largest share of total passenger transport activity
which estimated at about 66% in 2029/2030 compared to 34% for railways and almost 0% for river transport.
- Accordingly, total energy consumption by passenger transport activity is expected to increase from about 11 mtoe in 2011/2012 to about 24 mtoe in 2029/2030.
- Total freight activity is expected to increase from 68 (billion tons.km) in 2011/2012 to 159 (billion tons.km) in 2030.
- Road freight activity is expected to increase from 59 (billion tons.km) in 2011/2012 to 144 (billion tons.km) in 2030,
- Railways freight activity is expected to increase from 6 (billion tons.km) in 2011/2012 to 11 (billion tons.km) in 2030,
- River freight activity is expected to increase from 3 (billion tons.km) in the year 2011/2012 to 4 (billion tons.km) in 2030,
- Road transport is expected to still have the largest share of total freight transport activity which estimated at 90% in 2029/2030 compared to 7% for railways and 3% for river transport.
- Accordingly, total energy consumption by freight transport activity is expected to increase from about 4 mtoe in 2011/2012 to about 10 mtoe in 2029/2030.
- Therefore, total energy consumption by both passenger and freight activities is expected to increase from 14.9 mtoe in 2011/2012 to about 34 mtoe in 2029/2030.

8
- The implementation of the previous mentioned policies (encouragement of public passenger transport, increase the role of railways in freight transport, increase the role of river in both passengers and freight transport, improve the performance of freight transport by roads, expansion of Cairo metro, and the improvement of vehicles fuel economy) are expected to achieve a total fuel savings estimated at about 126 mtoe during the period (2010-2030). Consequently, the corresponding CO2 emissions reduction of estimated at more than 307 million tons during the same period.
4.1. Energy Efficiency Potential of OVSRP:
One of the major problems that contribute to the inefficient use of energy in the transport sector in Egypt and consequently the increase of pollutant emissions is the existence of significant number of old vehicles which characterized by low efficiency engines and poor maintenance. The main problems associated to old vehicles is their frequent breakdown that causes traffic jams and bottlenecks and in turn increase fuel consumption and emission of GHGs. According to the year 2010 statistics, total number of registered vehicles in Egypt accounted for about 5.8 million, of which 26% of age of more than 27 years old and 25% of age between 17 to 26 years. By the year 2013, total registered number of vehicles in Egypt accounted for about 6.6 million of which private cars represented 49%, taxi 4.6%, buses 1.6%, trucks 14.2%, motorcycles and three wheel vehicles (tuk tuk) 26.1% with other types representing the reminder which is 4.5%.[2] About 47% of total vehicles fleet exists in GCR that comprises in addition to Cairo both Giza and Kalyoubia.
In order to overcome the problems associated to the operation of old vehicles in areas with heavy traffic and high population density such as the GCR, the OVSRP was developed. Historically, the idea of OVSRP in Egypt was originally initiated in 2009 by the Clean Development Mechanism Awareness and Promotion Unit CDM APU which affiliate to the Egyptian Environmental Affairs Agency (EEAA) with the following main objectives: - Reduce GHGs emissions through the scrapping and replacement of old vehicles by new and fuel
efficient ones. - Create an effective tool that can help the enforcement of traffic law number 121 of the year 2008
which states “mass transport vehicles of age of more than 20 years old are not eligible for new operating licenses or license renewal”. According to the law, the mass transport vehicles include taxis, microbuses, trailer trucks, and buses. [6]
- Implement the program as one of the United Nation Framework Convention on Climate Change UNFCCC’s CDM projects in order to make use of the generated carbon credits to strength its economic viability.
The program is considered as the first UNFCCC’s transport-based implemented CDM project worldwide which is financially supported by the World Bank Carbon Fund. The GCR’s taxies are considered as the main target for the first phase of program implementation. Consequent phases will consider other old mass transport vehicles such as microbuses, trucks and buses in addition to other regions such as Alexandria, Delta, etc.
According to the OVSRP design document and as shown in table (4), in 2009, about 7% of total taxi fleet in Egypt of an age of more than 37 years old, 28% of an age of more than 32 years and 62% of an age of more than 22 years. At the same time, total taxi fleet in GCR account for 86 thousand of which 7% of an age of more than 37 years old, 24% of an age of more than 32 years and 58% of an age of more than 22 years. [6] Based on data collected through performed surveys, the average specific fuel consumption of new taxi vehicles is estimated at about 9.4 liters per 100 km compared

9
to 13.2 liters per 100 km for old taxi vehicles which means fuel consumption saving and consequently reduction of pollutants emissions by about 29%.[7]
Table (4) Average age of registered taxis in GCR and in Egypt
Governorate 1987+ 1982-1987 1978-1982 1972-1977 Before 1972 Total Total<=1987 Cairo 23741 7436 11299 9212 4071 55759 32018 Giza 10369 2929 5604 4292 1804 24998 14629
Kalyoubia 1636 590 1230 1328 128 4912 3276 Total GCR 35746 10955 18133 14832 6003 85669 49923
1987+ 1982-1987 1978-1982 1972-1977 Before 1972 Total Total<=1987 Total Egypt 71741 19465 43007 38488 13961 186662 114921
Share of Taxi by Age GCR Egypt Percentage of Taxis ˃= 22 years old: 58% 62% Percentage of Taxis ˃= 32 years old: 24% 28% Percentage of Taxis ˃= 37 years old: 7% 7%
Source: Small-Scale CDM Program of Activities Design Document from (CDM SSC-PoA-DD) – Version 01, UNFCCC and the WB.[8]
Before the commercial start of the programme, two pilot projects have been implemented to assess the economic viability and effectiveness of programme implementation. As shown from table (5), total number of scrapped and recycled vehicles during the two pilot projects of the programme in 2005 and 2009 and its commercial implementation during the period (2010 till the end of 2013) accounted for 49608 vehicles. Consequently, gasoline consumption saving and GHGs emissions reduction estimated at about 0.55 million tons of gasoline and more than 1.7 million tons of CO2e over 10 year’s period.
Table (5) Summary of GHGs reduction as a result of implementing the OVSRP [9]
Year No. of scrapped and recycled Vehicles GHGs Reduction over 10 years ('000 ton CO2e) * 2005 763 25.6 2009 8845 300
(2010-2013) 40000 1400 Total 49608 1725.6
* Based on GHGs emission reduction per vehicle = 34 thousand ton CO2e over 10 years.
Based on the results achieved through the implementation of the various phases of the program as previously mentioned and shown in table (5), additional energy efficiency improvements and the corresponding GHGs emissions reduction as a result of expanding the original GCR OVSRP to include more old taxi vehicles in GCR and in other regions of Egypt have been assessed. In performing that assessment the following assumptions have been considered: - Scraping of the remaining old taxi fleet that exist at the end of December 2013 in GCR and in other
regions of Egypt and replacing it by new and fuel-efficient taxies within 5 years period (2014-2018).
- Fuel efficiency for new vehicles ranging between (7.7–11.1) liter of fuel per 100 Km, depending on the type of the new vehicles, and compared to 13.2 liter of fuel per 100 Km for old vehicles. [9]
- Consequently, an average annual Fuel saving of about 1.2 ton per vehicle and an average annual GHGs reduction of about 3.4 ton of CO2e per taxi has been utilized.
Table (6) presents the proposed plan for program implementation till the year 2018 based on the previous mentioned assumptions. As shown from that table, total number of eligible old taxis to be scrapped, recycled and replaced by new and fuel-efficient vehicles estimated at 225 thousand taxi by the end of the year 2018 with GCR represents about 41% compared to 7% for Alexandria and 52% for the rest governorates or regions in Egypt.

10
Table (6) Proposed future plan for old taxi vehicles scrapping and recycling
Governorate Total number of
taxi (2013)
Eligible number of old taxi to be replaced (2013)
Number of scrapped and recycled taxis % share (2013-2018) (2013)
Per year (2014-2018)
Total
(end of 2018)
GCR 112943 43068 49068 8614 92676 41%
Alexandria 23167 15754 0 3151 15754 7%
Other Governorates 171056 116317 0 23264 116317 52%
Total 307166 175139 49068 35028 224747 100%
Based on an annual gasoline consumption saving of about 1.2 ton per taxi due to the scrapping and replacement of an old taxi by a new and fuel-efficient one and that the corresponding annual reduction of GHGs equal 3.4 ton CO2e per taxi as mentioned before, therefore: - Annual saving of gasoline consumption is expected to increase from about 60 thousand tons in
2013 to about 273 thousand tons in 2018 as shown from table (7). Accordingly, total accumulated gasoline consumption savings during the period (2013-2018) estimated at about 1 million ton.
- The corresponding GHGs reduction is expected to increase from about 169 thousand tons of CO2e in 2013 to about 764 thousand tons of CO2e in 2018. Accordingly, estimates of total accumulated GHGs reduction during the period (2013-2018) accounted for 2.8 million ton of CO2e.
Table (7) OVSRP Gasoline saving and GHGs emission reduction (2013 - 2018)
Region/ Governorate 2013 2014 2015 2016 2017 2018 Total
Gasoline saving (ton/year)
GCR 60238 70698 81157 91616 102076 112535 518320
Alexandria 0 3826 7652 11478 15303 19129 57388
Other Governorates 0 28249 56497 84746 112995 141243 423730
Total 60238 102772 145306 187840 230374 272908 999438
Region/ Governorate GHGs emission reduction (ton CO2e /year)
GCR 168667 197953 227239 256526 285812 315098 1451295
Alexandria 0 10712 21425 32137 42850 53562 160686
Other Governorates 0 79096 158193 237289 316385 395481 1186444
Total 168667 287762 406857 525952 645046 764141 2798425
4.2. Energy Efficiency Potential for the Usage of CNG as a Fuel for Vehicles Programme:
In the context of its policy to maximize the use of natural gas as a clean and abundant fuel in all economic sectors in Egypt including transport, the Ministry of Petroleum MoP started since the early 1990s implementing a fuel switching policy that aims at maximizing the utilization of natural gas as an efficient and clean fuel in all economic sectors and application including its usage as a fuel for vehicles. During the period (1992-1996), two demonstration projects have been implemented in two of the petroleum sector companies. The first project comprised the construction of 2 CNG fast filling stations to serve 30 dedicated CNG buses. The second project comprised the construction of 3 CNG fast filling stations in addition to the conversion of 150 of the company vehicles to run on both CNG and gasoline. The main objective of the demonstration phase was to assess the technical and economic viability of implementing CNG technology as a fuel for vehicles in the transport sector in
11
Egypt in addition to its positive environmental impacts. The success of the demonstration phase encouraged the Egyptian petroleum sector to rapidly start the commercialization phase. By the year 1995, Natural Gas Vehicles Company NGVC was established as the first CNG operating company. In 1996, the second CNG operating company, GASTEC also established. The success of both companies encouraged the establishment of other 4 CNG operating companies. These are Shell Egypt and Arabia-Gas in 2002, Master-Gas in 2004, and Total in 2005.
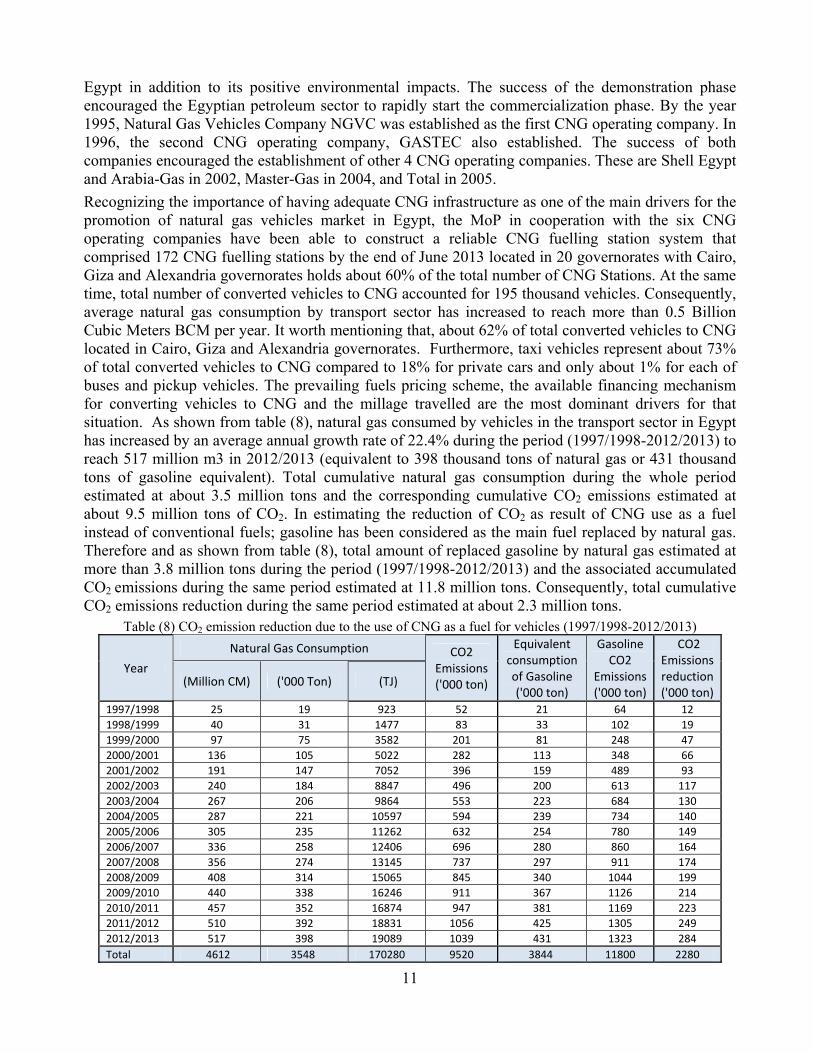
Recognizing the importance of having adequate CNG infrastructure as one of the main drivers for the promotion of natural gas vehicles market in Egypt, the MoP in cooperation with the six CNG operating companies have been able to construct a reliable CNG fuelling station system that comprised 172 CNG fuelling stations by the end of June 2013 located in 20 governorates with Cairo, Giza and Alexandria governorates holds about 60% of the total number of CNG Stations. At the same time, total number of converted vehicles to CNG accounted for 195 thousand vehicles. Consequently, average natural gas consumption by transport sector has increased to reach more than 0.5 Billion Cubic Meters BCM per year. It worth mentioning that, about 62% of total converted vehicles to CNG located in Cairo, Giza and Alexandria governorates. Furthermore, taxi vehicles represent about 73% of total converted vehicles to CNG compared to 18% for private cars and only about 1% for each of buses and pickup vehicles. The prevailing fuels pricing scheme, the available financing mechanism for converting vehicles to CNG and the millage travelled are the most dominant drivers for that situation. As shown from table (8), natural gas consumed by vehicles in the transport sector in Egypt has increased by an average annual growth rate of 22.4% during the period (1997/1998-2012/2013) to reach 517 million m3 in 2012/2013 (equivalent to 398 thousand tons of natural gas or 431 thousand tons of gasoline equivalent). Total cumulative natural gas consumption during the whole period estimated at about 3.5 million tons and the corresponding cumulative CO2 emissions estimated at about 9.5 million tons of CO2. In estimating the reduction of CO2 as result of CNG use as a fuel instead of conventional fuels; gasoline has been considered as the main fuel replaced by natural gas. Therefore and as shown from table (8), total amount of replaced gasoline by natural gas estimated at more than 3.8 million tons during the period (1997/1998-2012/2013) and the associated accumulated CO2 emissions during the same period estimated at 11.8 million tons. Consequently, total cumulative CO2 emissions reduction during the same period estimated at about 2.3 million tons.
Table (8) CO2 emission reduction due to the use of CNG as a fuel for vehicles (1997/1998-2012/2013)
Year
Natural Gas Consumption CO2 Emissions ('000 ton)
Equivalent consumption of Gasoline ('000 ton)
Gasoline CO2
Emissions ('000 ton)
CO2 Emissions reduction ('000 ton)
(Million CM) ('000 Ton) (TJ)
1997/1998 25 19 923 52 21 64 12
1998/1999 40 31 1477 83 33 102 19
1999/2000 97 75 3582 201 81 248 47
2000/2001 136 105 5022 282 113 348 66
2001/2002 191 147 7052 396 159 489 93
2002/2003 240 184 8847 496 200 613 117
2003/2004 267 206 9864 553 223 684 130
2004/2005 287 221 10597 594 239 734 140
2005/2006 305 235 11262 632 254 780 149
2006/2007 336 258 12406 696 280 860 164
2007/2008 356 274 13145 737 297 911 174
2008/2009 408 314 15065 845 340 1044 199
2009/2010 440 338 16246 911 367 1126 214
2010/2011 457 352 16874 947 381 1169 223
2011/2012 510 392 18831 1056 425 1305 249
2012/2013 517 398 19089 1039 431 1323 284
Total 4612 3548 170280 9520 3844 11800 2280

12
Based on the average number of converted vehicles to use CNG during the last 5 years, the period (2007-2012), that accounted for about 20 thousand annually and the latest gasoline and diesel fuels price increase which account for 40% and 64% respectively, it is expected that a huge potential for the development of Natural Gas Vehicles NGVs market in Egypt exist with the number of converted vehicles to CNG to be doubled during the coming five years. Although taxi vehicles are expected to remain representing the largest share of converted vehicles to CNG, the growth of converted private cars and buses number to CNG is expected also to be escalated driven by the gasoline and diesel fuels price increase and the MoP prevailing fuel switching policy to replace gasoline and diesel in the transportation sector as a clean fuel.
4.3. Energy Efficiency Potential of Cairo Metro:
Since the year 1983, several metro lines have been constructed and became in operation in GCR. The following is a brief description of the currently operating, under construction and planned Cairo metro lines.
- Line 1 (Helwan-El Marg) with a total length of 44.3 km of which 4.5 km are underground. The construction of the line started in 1982 and became fully operated in 1989. The line carries about 60 thousand passengers per hour in each direction.
- Line 2 (Shobra El Kheima - El Mounib) with a total length of 21.6 km of which 13 km as underground tunnels. Although the construction of the second line started in the mid 1990s it became fully operated in early 2005.
- Line 3 (Imbaba - Cairo International Airport) with a total length of about 30.6 km of which 28.1 km as underground tunnel. The line comprises four phases. Phase 1 (Attaba - Abbassia) with a total length of 4.3 km. The construction of that phase started in 2006 and became in operation on February 2012 with a total capacity of about 0.3 million passengers per day. Phase 2 (Abbassia to Haroun Station in Heliopolis) with a total length of about 7.1 km as underground tunnel. That phase opened for operation on April 2014. Phase 3 (Attaba - Sphinx Square) with a total length of about 18 km. The work of that phase started in January 2012 and is expected to be completed on October 2015. An extension of the line will be from Sphinx Square Station to Imbaba which is expected to be in operation by October 2017. Phase 4 (Haroun station- Cairo International Airport) with a total length of 13.4 km. The construction of that phase is expected to start in 2015 and to be opened for fully operation by the end of 2019.
- Line 4 (October Oasis Highway- the Police Academy): The construction of the line will be implemented through 4 phases. Phase 1 (El Malek El-Saleh Station- October-Oasis Highway) with a total length of 10 km. The completion and operation of phase 1 is expected by October 2016. Phase 2 will extend from El Malek El-Saleh Station to the 6th District of Nasr City. This phase is expected to be completed by October 2018. Phase 3 is expected to start construction by 2015 and extend from the 6th District Station to Makram Ebid Station at Nasr City. This phase is expected to be operational on October 2019. Phase 4 is the final phase of line 4 and its construction is expected to start by 2017 and extend from Makram Ebid Station in Nasr City to the end of the line at the Police Academy Station in New Cairo District. By the completion of that phase, line 4 of Cairo Metro becomes fully operational by October 2020.
In addition, two other metro lines are still under studying. Appendix (2) presents a map for currently operating, under construction and planned Cairo metro lines.
In assessing energy saving potential of Cairo metro and the corresponding CO2 emissions reduction the following main assumptions have been considered:

13
- Full operation of the four metro lines after the completion of line 4 by the end of 2020. The gradual commissioning of different phases of metro lines based on actual commissioning dates and announced plans have been considered in estimating energy savings and CO2 emissions reduction.
- The shift of passenger transport to Cairo metro is from private cars and some public buses lines that operate near the metro lines. Therefore, fuel savings is attributed to gasoline and diesel fuels. Important drivers for that policy or assumption are the increasing number of private cars which participate in traffic jams and congestions particularly in light of the situation of Cairo streets and absence of enough parking areas. For the case of passenger switch from buses to metro, the reasons for that assumption is the poor maintain operating public bus transport system in GCR that characterized by inconvenience and inefficient fuel use reflected in large amounts of diesel fuel consumption and pollutants emissions in addition to the huge subsidy attributed to diesel consumption and importing large quantities of it as the case for gasoline.
- Passengers transported by metro lines 1 & 2 in 2010/2011 accounted for 783 million passengers. - Passenger’s activity of both metro lines estimated at 51.6 (billion passenger.km) in 2010/2011. - Electricity consumption of both metro lines estimated at 454 million KWh in 2010/2011 (equivalent
to about 92 thousand tons of oil equivalent toe). - Average specific energy consumption of Cairo metro equals 1.8 toe/million passengers.km. - Average specific energy consumption of public buses transport equal 22 toe/million passengers.km
and that for private cars is 92 toe/million passengers.km.
Based on the previous mentioned assumptions, the calculation of expected fuel saving and avoided CO2 emissions as a result of the construction and operation of the four lines of Cairo metro and its utilization instead of private cars and poor maintained and old public buses resulted in:
- For the case of passengers switch from private cars to metro: gasoline savings are expected to increase to reach about 4.1 million tons of oil equivalent (mtoe) in 2021 after the completion and operation of all metro lines including the last phase of line 4 by the end of the year 2020 and compared to 1.8 (mtoe) in 1989 (the start of line 1 operation). Therefore, total accumulated gasoline savings during the period (1989-2021) estimated at 81 mtoe. Accordingly, avoided CO2 emissions estimated at about 11.4 million tons in 2021 compared to about 5 million tons in 1989. Therefore, total avoided CO2 emissions during the period (1989-2021) estimated at 228 million tons.
- For the case of passengers switch from public buses to metro: diesel fuel savings are expected to reach about 1 mtoe in 2021 after the completion and operation of all 4 metro lines by the end of the year 2020 compared to 0.4 mtoe in 1989. Therefore, total accumulated diesel fuel saving during the period (1989-2021) estimated at 18 mtoe. Accordingly, avoided CO2 emissions are expected to increase to reach about 2.6 million tons in 2021 compared to about 1.1 million tons in 1989. Therefore, total avoided CO2 emissions during (1989-2021) estimated at 51.2 million tons.
5. Assessment Methodology: 5.1. OVSRP Assessment Methodology: [7], [8], [10]
According to the project design, owners of old taxi vehicles of more than 20 years are voluntarily to surrender their vehicles for managed scrapping and recycling in exchange for financial incentives which is used for the purchase of a new and fuel-efficient vehicle under a closely monitored process. The Program of Activities (PoA) of the OVSRP started on April 2009 with the implementation of the first taxi Component Project Activities (CPA) that account for 11 CPA in GCR. Although the PoA is expected to last for 28 years from the start date of the programme in April 2009 through April 2037, the length of each CPA shall not be more than 10 years.

14
The methodology of estimating energy savings and the GHGs emission reductions for the first taxi Component Project Activities (CPA) in GCR is based on the expected fuel consumption efficiency improvements as a result of scrapping and recycling old vehicles and replacing them with new and fuel-efficient ones. In addition, the methodology is conducted in accordance with the guidelines of the UNFCCC CDM Small-Scale CPA Design Document which include the following assumptions, principles and procedures: [7], [8]
- Calculated emissions reductions are based on the average annual fuel efficiency which is the average fuel consumed per vehicle kilometer travelled and the distance driven by registered participating vehicles.
- Estimate of emission reductions is performed using the UNFCC approved methodology which estimate baseline and project emissions using the following parameters: carbon content of fuel presented as ton of CO2e per unit of combusted fuel, vehicle fuel efficiency (average number of units of fuel combusted per km travelled), number of participating vehicles, and average annual distance driven. Table (9) presents some of the assumptions considered. [8]
- Estimates of emissions reduction for the first taxi CPA is performed using data collected from different Egyptian government entities and from field surveys.
- The baseline survey is conducted by the MoF using questionnaires to collect the necessary data to calculate average fuel efficiency of the baseline vehicles in addition to the average annual vehicles kilometers travelled. The survey covered 600 vehicles and its results are used for the first 49000 vehicles included in the GCR project. The surveys are conducted once per program stage for each fuel type and under similar operating conditions. In addition, it is conducted according to the “Guidelines for Sampling and Surveys for Small-Scale CDM Project Activities” prepared by the CDM Unit of the UNFCCC.
- Upon the registration of POA, the MoF becomes responsible for hiring an independent auditor consultant to verify that the number of scrapped vehicles and the project vehicles are corresponding with each other. The consultant is responsible also for ensuring and verifying that the scrapping and recycling facility is carrying out its operational mandate and that all project activities are performed according to the project design document.
Table (9) some of the assumptions considered in estimating fuel saving and GHGs emissions reduction for the OVSRP in GCR
Fuel Heating Value (kJ/kg)
Fuel efficiency CO2 default factor (kg/TJ)
Gasoline 44.800 9.39 liters/100 km 69.300 Diesel 43.300 14.14 liters/ 100 km 74.100 CNG 47.143 8.34 m3/100 km 56.100 Average annual distance driven 38.816 km/year
Source: Small-Scale CDM Program Activity Design Documents Form (CDM-SSC-CPA-DD) – Version 01, CDM Executive Board, UNFCCC.
In addition to estimating fuels savings and GHGs emissions reductions as a result of implementing the OVSRP, energy subsidy savings have been also assessed through a performed study entitled “Subsidies for Energy Efficiency and Alternative Energy Adoption Programs: Case Study from Egypt Taxi Recycling Program”. The study used the Cost Benefit Analysis (CBA) to define the main costs and benefits gained by the government of Egypt and taxi owners as the main stakeholders of the program. [10] Main outputs of that study are presented in section 6 (Economic, Environmental, and Policy Analysis).

15
5.2. CNG Assessment Methodology: In estimating energy efficiency improvements and the associated reduction in CO2 emissions as a result of utilizing compressed natural gas CNG as a fuel for vehicles instead of gasoline and diesel fuel a simplified excel sheet has been utilized. Gasoline has considered as the main fuel replaced by natural gas. The utilized heat content and CO2 emission factors for both gasoline and natural gas are those published by the UNFCCC as follows:
- Heat content presented as tera joules per giga gram of fuel equals 44.3 for gasoline and 48 for natural gas.
- CO2 emission factors presented as ton of CO2 per tera joules of fuel equals 69.3 for gasoline and 56.1 for natural gas.
5.3. Cairo Metro Assessment Methodology:
In assessing energy savings and the reduction in CO2 emissions as a result of the construction and operation of GCR metro lines as previously described, a simplified excel sheet has also utilized. The introduction of different phases of metro lines operation has been considered according to actual and planned dates of commissioning. Based on the capacity of each metro line expressed as passengers /day and the length of the lines expressed in kilometer (km), total activity of each metro line has been calculated in terms of passenger.km. Then, based on an average fuel consumption of 92 toe per million passenger.km for private cars and 22 toe per million passenger.km for public buses and 1.8 toe per million passenger.km for metro lines, fuel savings and the associated reduction in CO2 emissions as a result of passengers switch from private cars and public buses to metro system have been calculated in toe and ton of Co2 respectively. 6. Economic, Environmental and Policy Analysis:
6.1. OVSRP Economic, Environmental and Policy Analysis:
The analysis and the evaluation of implemented phases of OVSRP so far revealed some important issues and key drivers for its success which include: The programme establishment as a Public Private Partnership (PPP) which means that costs,
benefits and risks of the program are shared between participating public and private entities. Appendix (3) presents different stakeholder participating in the OVSRP in addition to their role and responsibilities.
The implementation of the program as a CDM project that resulted in cost reduction due to revenues gain from selling the generated Certified Emissions Reduction (CERs) in the international carbon market.
The effective cooperation and collaboration among different stakeholders participating in the programme and fulfillment of their role and responsibilities as described in appendix (3).
More important, the additional incentives provided to old taxi vehicles owners participating in the program helped them to scrap and recycle their old vehicles and buy new vehicles.
6.1.1. OVSRP Finance Support by the Ministry of Finance (MoF):
As the number of participating vehicles considered as a key factor in estimating the cost and benefits associated to the first phase of project implementation, 49 thousand vehicles have been considered by the MoF through the program duration as CDM project during the period (2010-2018). Therefore, total cost of the program estimated at about US$ 620 million (LE 3.5 billion) which include as shown from table (10) government subsidy, tax and custom waivers, vehicles price after discounts, program coordination and monitoring, in addition to the preparation of the scrapping and recycling site. [9]

16
Table (10) Estimated Project Cost (2010-2018)
No. of vehicles Per vehicles ($)* Total (million US $) (2010-2018) %
49000 Max. Government subsidy per vehicle 911 44.64 7.2 Tax and custom waivers * 2674 131.03 21.1 Vehicle price after discounts 8833 432.82 69.8 Annual program coordination & monitoring * 0.05 0 Recycling site preparation ** 11.70 1.9 Total estimated project cost 620.24 100
* Based on US$1=5.61 EGP (Egyptian pounds). **World Bank (2010). Carbon Finance Assessment Memorandum (CFAM)
Source: UNFCCC (2009), Egypt Vehicle Scrapping and Recycling Program, CDM SSC-POA-DD, Ver. 01, Oct. 6 ’09. [
Since the program start on April 2009 till February 2013, the cost of benefits and subsidy given by the MoF to taxi owners estimated at about LE 1.1 billion disaggregated as follows:[11] LE 205 million for scrapping of vehicles, LE 343 million as sales tax (about LE 8300 per vehicle), LE 36 million for the exemption of imported components of new vehicles from custom duties (about LE 1000 per vehicle), LE 475 million as the cost of advertisement on taxi vehicles (the MoF paid that cost which equal about LE 33 thousand per vehicle on 60 monthly installments of about LE 550 instead of the advertisement company which withdraw from the programme due to some economic difficulties that prevents its continuation in the programme), and LE 36 million paid by the MoF on behalf of vehicle’s owners due to their delay on paying loan installments for January, February and March of 2011 as a result of the tough economic situation that Egypt passed through after the 25th of January 2011. According to the program set up, the Egyptian MoF provide a subsidy of about LE 5000 for each surrendered vehicle (about USD 911 based on an exchange rate of about LE 5.49/USD as of the year 2009). Based on a total number of eligible old vehicles that have been scrapped, recycled and replaced by new and fuel-efficient vehicles which account for about 49 thousand and assuming that not all vehicles received the same subsidy, total cost of subsidy covered by the MoF estimated at about USD 44.6 million as shown from table (10). It worth mentioning that the subsidy given to scrapped vehicle's owners through the program is considered as relatively small or conservative compared to that given in similar programs in other countries.[9] In addition, the MoF was responsible for providing the cost of recycling facility site preparation that accounted for about USD 11.7 million. Therefore, total direct investment provided by the MoF estimated at USD 52 million that have a positive impact across all participating entities in the program such as banks, vehicles manufacturing companies, advertising firm, insurance companies, and recycling facility.
6.1.2. OVSRP Financial Support through the WB Carbon Finance Program: [9]
Implementing the OVSRP as a CDM project contribute providing the Government of Egypt, represented by the MoF with an efficient financial package that help old vehicles owners in GCR to purchase new fuel efficient and less polluting vehicles and scrape and recycle their old vehicles through an environmentally sound system. As previously mentioned, the OVSRP comprised 11 Component Project Activities (CPA) in the GCR for which the World Bank (WB) represented by the International Bank for Restructuring and Development (IBRD), as Trustee of Carbon Fund, has committed to purchase the generated CERs. Based on project estimates, scraping and recycling of 49 thousand old taxi vehicles and replacement them by new and fuel-efficient ones result in GHSs emissions reduction of about 1.3- 2.3 million tons of CO2 equivalent (CO2e) during the period (2013-2018) depending on the kilometers traveled by vehicles each year. Based on project duration for 28 years, the period (2009-2037) and assuming program market price of USD 11 per each CER generated till 2013 and of USD 6 per CER after 2013, total revenues from the generated CERs during the programme period estimated at USD 15.8–27.8 million that will be utilized for supporting the
17
programme cost including the preparation of the vehicles scrapping and recycling sites. In addition, a monetary value could be potentially applied to the total air pollution reduction associated with the implementation of various programme activities as well as accidents.
Therefore, the Carbon Finance Fund is essential for achieving the OVSRP objectives through: 1. Supporting the subsidy provided by the MoF to encourage vehicle owners to surrender their old
vehicles for managed scrapping and recycling. It should be noted that without that incentive old vehicles owners will not be able to scrape their vehicles and buy new ones. In addition, as the law number 121 for the year 2008 does not specify the way through which impacted vehicles by the law could be disposed off, old taxi vehicles can either be: (a) Sold in other countries in which similar law does not exist, (b) Converted to private use, as private cars are not affected by the law, and (c) Dismantled with the engines being sold for use in other vehicles,
2. Supports the on-going activities for GHG emissions reductions associated to the program, and 3. Development of the recycling facility through partial fund derived from the carbon finance.
6.1.3. Incentives and Economic Benefits and Revenues of the OVSRP:
6.1.3.1. OVSRP Incentives: one of the key drivers for the success of OVSRP implementation is the package of incentives provided by different stakeholders participating in the program as follows: [11]
- The MoF provides a grant of LE 5000 for each scraped old vehicle, bear the cost of surrendered vehicles, the cost of sales tax for new vehicles that range between LE 7000 to 13000 according to vehicle type, the cost of custom duties fees for the components of new manufactured vehicles in addition to providing the necessary guarantee for loans from local banks to purchase new vehicles.
- Local banks provide loans for old taxi owners to purchase new vehicles of a maximum LE 70 thousands for 60 installments over 5 years period with an interest rate of 7.5% compared to 9% as prevailing market interest rate.
- Vehicles manufacturing companies and suppliers offer lower prices for new vehicles (25%-30% less than market price), provide spare parts and the necessary maintenance for new vehicles at reduced cost (a discount of 30% is given to spare parts).
- The insurance company provides insurance against theft, fire, and accidents for each taxi at an interest rate of only 3.25% compared to prevailing market interest rate of 6.25%.
- The advertising agency that has an exclusive right to advertize on new vehicles, pay a monthly advertising cost of about LE 550 for 5 year period for the benefit of taxi vehicles owners.
Besides, sustainable implementation of the programme is expected to help promote local vehicles manufacturing in addition to providing new job opportunities. Furthermore, the expected revenues from the sale of generated CERs units as a result of implementing the program as a CDM project will provide some of the financial resources and incentives to offset the significant up-front cost burden on the MoF and help secure the sustainability of program implementation.
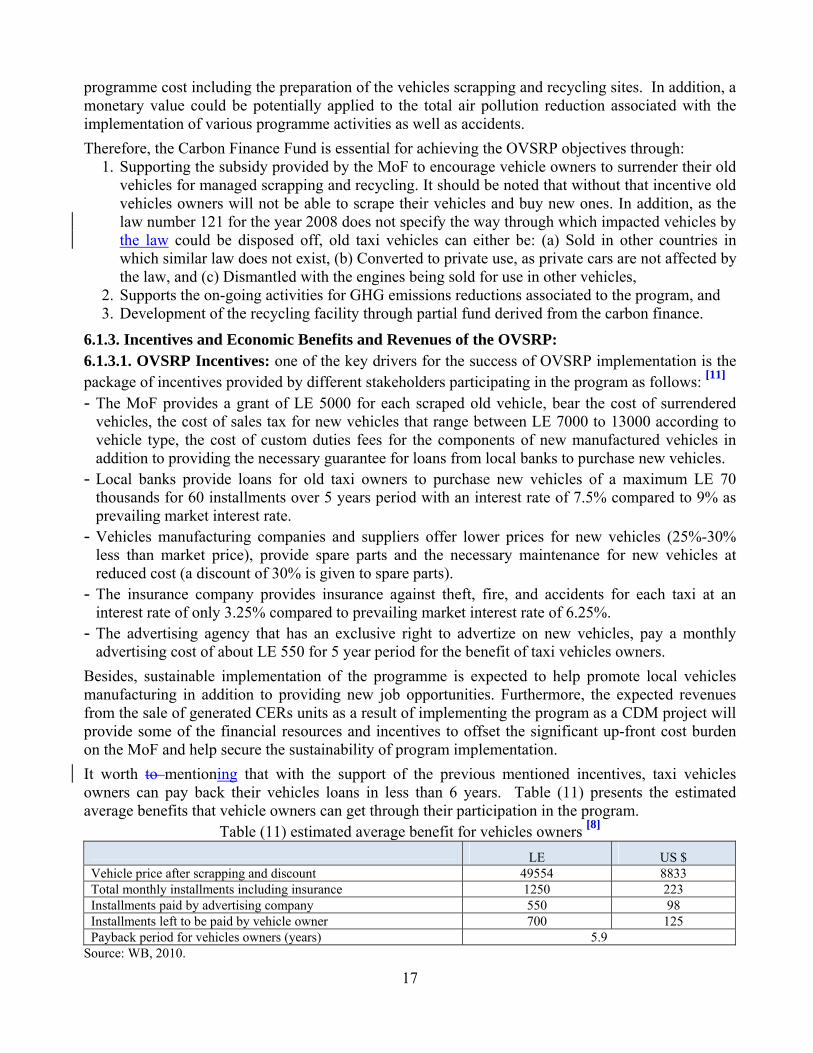
It worth to mentioning that with the support of the previous mentioned incentives, taxi vehicles owners can pay back their vehicles loans in less than 6 years. Table (11) presents the estimated average benefits that vehicle owners can get through their participation in the program.
Table (11) estimated average benefit for vehicles owners [8] LE US $
Vehicle price after scrapping and discount 49554 8833 Total monthly installments including insurance 1250 223 Installments paid by advertising company 550 98 Installments left to be paid by vehicle owner 700 125 Payback period for vehicles owners (years) 5.9
Source: WB, 2010.

18
6.1.3.2. OVSRP Economic Benefits and Revenues: Based on the assumptions and analysis made through a study entitled “Arab Republic of Egypt Cost Assessment of Environmental Degradation”, the program is expected to pay for itself over 10 year’s period through air pollution reduction alone. The following are some of the assumptions considered in that study to achieve that conclusion: [12] (1) Cost of air pollution in GCR represented about 2.1% of total GDP in 1991. (2) Assuming that this percentage remains constant over time, which means that the cost of air pollution has grown at the same rate as the GDP, therefore, cost of air pollution accounted for about USD 4.4 million in the year 2010. (3) Assuming that about 75% of air pollution is generated in GCR and about 26% of that percentage was generated from road-based transport therefore, air pollution from transport in GCR would account for about USD 850 million. (4) Participating vehicles in the program (49 thousand) are expected to reduce air pollution by about 1% per year account for about USD 8.5 million in addition to improvements in fuel efficiency. Furthermore, the programme implementation and expansion to cover the remaining old taxi vehicles in GCR and other regions of Egypt in addition to including other types of old vehicles of age of more than 20 years such as microbuses, buses, trucks, etc. will help decrease imports of gasoline and diesel fuel which accounted for USD 5.9 billion in 2012/2013 (USD 1.3 billion for gasoline and USD 4.6 billion for diesel fuel).
6.1.4. Environmental and Socioeconomic Impacts of the OVSRP: [9]
Although the transport sector plays an important and vital role in achieving economic and social development in Egypt, escalating travel demand as a result of economic and population growth is combined with aggressive increase in energy consumption and pollutants emissions in addition to significant environmental and economic negative impacts. According to a study performed by the Word Bank in 2013 entitled “The Arab Republic of Egypt, For Better or For Worse: Air Pollution in Greater Cairo, A Sector Note”, the cost of air pollution degradation in GCR has increased tremendously during the last decade from about LE 6.6 billion in 1999 to about LE 76 billion in 2009 (at 2009 constant prices) with an average annual growth rate of about 4.6% during that period with the cost of air pollution degradation in GCR represented about 1% of total Egypt’s Gross Domestic Product (GDP) during the same year 2009.[13] Moreover, and according to the Egyptian law, an environmental and social assessment was essential to be conducted before the program implementation. Therefore, the MoF contracted EcoConServ as an independent consultant to perform the proposed assessment which concluded the following environmental and social benefits: [9] - GHGs reduction of about 1.3 – 2.3 million tons of CO2e during the period (2010-2018). - Reduction in traffic jams and congestion in GCR as a result of removing old vehicles from roads
and consequently reduce economic losses associated to it. - Raising the income of drivers as a result of scrapping their old inefficient vehicles and replacing it
with new ones that can work for more time (at least one additional shift) with the reduction of fuel consumption and spare parts and maintenance costs. The increase in the overall income of taxi owners estimated at about 40% and that for taxi drivers by 100%. The 40% increase in the taxi owner’s income at the end of the program is due to fuel consumption reduction by about LE 50 per month. As a considerable portion of new taxi vehicles will run on both gasoline and CNG, the use of CNG instead of gasoline will result in additional saving of LE 200 per month (due to price differential between both fuels as the price of CNG is 50% of gasoline 80 price) in addition to reduction of vehicle maintenance cost of more than LE 300 per month. Therefore, each taxi owner is expected to get an average monthly income of LE 1500 compared to LE 900 for the old taxi.
- Improving life conditions for taxi drivers as a result of improving their economic conditions.

19
- Business development of participating stakeholders such as banks and vehicles manufacturing companies which means opportunities for the creation of new jobs and more expected revenues.
- The outcomes of OVSRP comply with the objectives of the government of Egypt long term development vision till the year 2020 and its 6th National Development Plan (2007-2012) with its ultimate goal of reducing poverty and improving the standard of living of the Egyptian citizens. The following are some examples of the programme expected outputs and millstones which contribute achieving those objectives: [14] The creation of more job opportunities (10500 as direct new jobs for taxi-drivers in addition to
1000 indirect new jobs for skilled and unskilled employees in vehicles suppliers and manufacturing companies, spare parts suppliers, after sales services, vehicles maintenance industry, and vehicles scrapping activities). It is estimated that a net daily income of about LE 85 (about USD 15, based on an exchange rate of LE 5.6 per USD as of the year 2009) will be generated for each new job. Taking into consideration the average monthly expenditure for each benefiting household of the program an average monthly saving of USD 120 can be gained. Accordingly, an annual saving of about USD 12 million could be injected in the whole economy. In that regard it worth to mention also that the gained profits by participating banks in the program will result in increased availability of investments funds.
Providing opportunities for the establishment of new Small and Medium Enterprises (SME) in different areas and activities related to the program.
Expanding the market of vehicles manufacturing for the existing vehicles manufacturing companies in addition to giving opportunities for the establishment of new ones.
Improve air quality and hence the Egyptian citizen’s life and health conditions as the GHGs emissions of new taxi vehicles expressed as CO2e is 25% less than that emit from old taxi vehicles as a result of their efficient use of fuel. [12]
Upgrade taxi fleet in addition to public transport buses and microbuses in later phases of program implementation. Upgrading urban transport will directly affect economic development in terms of reduced commuting time, increased productivity, and income generated from tourism as a result of improving taxi service for both local and touristic passengers and customers.
The formulation of a cost effective financing mechanism which could be used as a model for attracting and allocating necessary finance and investments for similar programmes and projects in the transport sector and in other economic sectors. In that regard and as an example the programme will enhance the capabilities, skills and knowledge of existing staff of local banks, financing firms and other program stakeholders on different aspects and approaches relevant to attracting investment and the implementation of programmes and projects for climate change mitigation, air quality improvement and sustainable environmental management.
An annual fuel subsidy saving of about LE 399 million as a result of the operation of new efficient vehicles and the retrofit of significant portion of it to run using CNG.
Nevertheless, the performed environmental impact assessment for the programme assessed also the potential adverse impacts of project implementation and their mitigation options. The potential adverse impacts at the scrapping and recycling facility include: handling and disposal of solid waste, handling and disposal of liquid waste, dust and gaseous emissions, noise, etc.
Moreover, energy subsidy savings as a result of program implementation in GCR in addition to define the main costs and benefits gained by the government and taxi owners as the main stakeholders of the program have been assessed through a study entitled “Subsidies for Energy Efficiency and Alternative Energy Adoption Programs: Case Study from Egypt Taxi Recycling Program”. The main findings of the study include: [10]

- An annureplacemmillion
- An averCPA whof negatCO2. Ainternati
- The surrecyclinEnviron
- Improvi- The intr- Taxi ve
natural g
6.2. The us6.2.1. The
In order toencourage companiesallows vehlocal bankmonthly in
The proceprogrammethe NGVsinformationnecessary
ual fuel subsment of 40 for 49 thous
rage annual ehich compristive environAdditional sional carbonrrendered veng companynmental Affaing the workroduction of hicle’s owngas as a fuel
se of CNG ause of CNGo overcomecar owners developed
hicle's ownerks and pay tnstallments w
Fig
dure for coe is very sim operating n in additioapprovals th
sidy saving othousand ol
sand old taxienvironmentse 4576 taxinmental impsavings are n market. ehicles are sy under the airs (MSEA)king environm
new meterinners can get instead of g
as a fuel forG as a fuel foe the barrier
to use CNGthe Smart Crs to get the the conversiwith favorabl
gure (1) Sim
onverting cample. Any cacompanies
on to his/hehe bank tran
of more thanld taxi vehicvehicles).
tal benefit of. That estimacts of CO2
also expect
afely and enmonitoring
. ment of taxi ng system foan addition
gasoline.
r vehicles Ecor vehicles Er of high u
G, the MoP Card program
necessary lion cost, whle interest ra
mlified presen
ars to run uar owner whand fill a sr approval
nsfer the tota
20
n LE 380 micles by new
f more than mate is based
2 emissions ted as a res
nvironmentag and the s
drivers consor taxi vehiclnal monthly
conomic, EnEconomic I
up front cosin collaboram. The Smaoans to conv
hich range bate.
ntation of the
using CNG ho would liksimplified qto join the
al cost of co
illion will bew and fuel-ef
2 million USon CAPMAthat equal a
sult of sellin
al friendly dsupervision
sequently inles. income of
nvironmentssues and C
st of vehicleation with loart Card progvert their vebetween LE
e smart card
in additionke to converquestionnaire
smart card onversion to
e achieved bfficient ones
S dollars perAS’s 2010 esabout 80 USng the gene
disposed throof the Mi
ncrease their
about LE 6
tal and PolicConsideratioes conversio
ocal banks agram as preehicles to CN 5000 to 60
d framework
n to gasolinrt his/her care that contaprogrammeNGVs oper
by the scrapps (or about
r each taxi restimates for S dollars peerated CERs
ough the conistry of S
productivity
80 in case o
cy Analysis:on Analysison to CNG
and NGVs opesented in figNG from on000, in the
ne accordingr can contacains some pe. After getrating comp
ping and LE 466
ecycling the cost
er ton of s in the
ontracted State for
y.
of using
: :
G and to perating gure (1)
ne of the form of
g to the ct any of personal tting the pany and
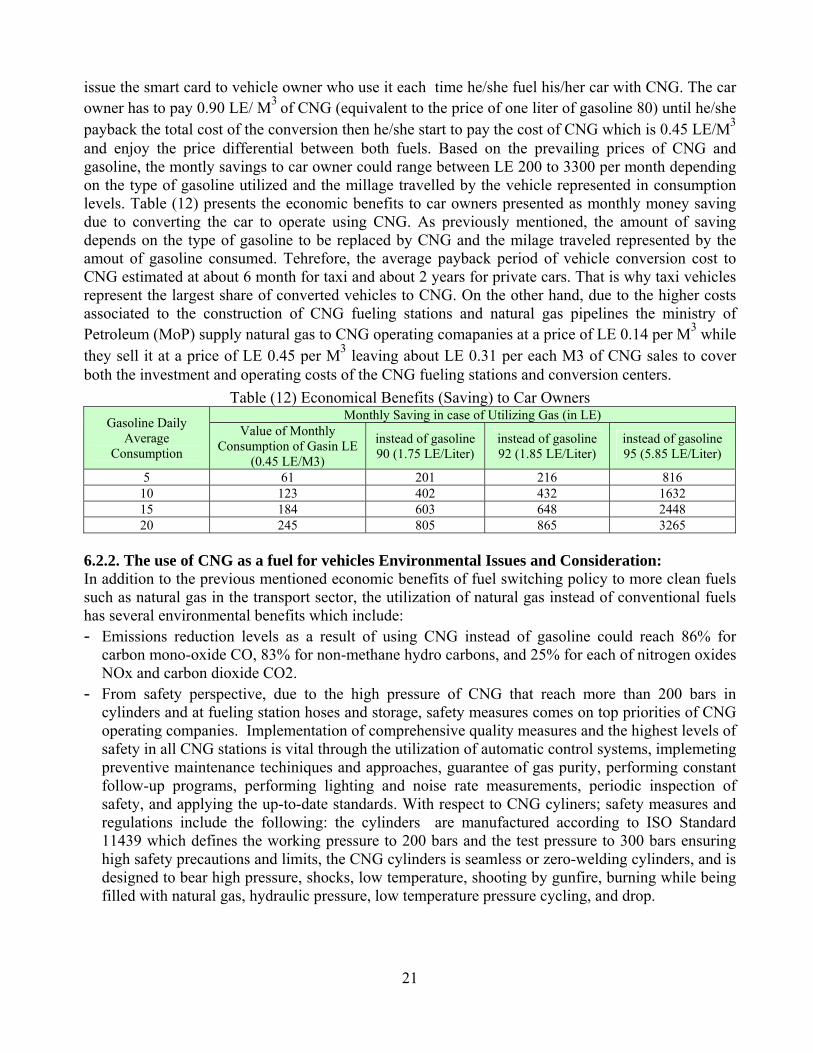
21
issue the smart card to vehicle owner who use it each time he/she fuel his/her car with CNG. The car owner has to pay 0.90 LE/ M3 of CNG (equivalent to the price of one liter of gasoline 80) until he/she payback the total cost of the conversion then he/she start to pay the cost of CNG which is 0.45 LE/M3 and enjoy the price differential between both fuels. Based on the prevailing prices of CNG and gasoline, the montly savings to car owner could range between LE 200 to 3300 per month depending on the type of gasoline utilized and the millage travelled by the vehicle represented in consumption levels. Table (12) presents the economic benefits to car owners presented as monthly money saving due to converting the car to operate using CNG. As previously mentioned, the amount of saving depends on the type of gasoline to be replaced by CNG and the milage traveled represented by the amout of gasoline consumed. Tehrefore, the average payback period of vehicle conversion cost to CNG estimated at about 6 month for taxi and about 2 years for private cars. That is why taxi vehicles represent the largest share of converted vehicles to CNG. On the other hand, due to the higher costs associated to the construction of CNG fueling stations and natural gas pipelines the ministry of Petroleum (MoP) supply natural gas to CNG operating comapanies at a price of LE 0.14 per M3 while they sell it at a price of LE 0.45 per M3 leaving about LE 0.31 per each M3 of CNG sales to cover both the investment and operating costs of the CNG fueling stations and conversion centers.
Table (12) Economical Benefits (Saving) to Car Owners
Gasoline Daily Average
Consumption
Monthly Saving in case of Utilizing Gas (in LE) Value of Monthly
Consumption of Gasin LE (0.45 LE/M3)
instead of gasoline 90 (1.75 LE/Liter)
instead of gasoline 92 (1.85 LE/Liter)
instead of gasoline 95 (5.85 LE/Liter)
5 61 201 216 816 10 123 402 432 1632 15 184 603 648 2448 20 245 805 865 3265
6.2.2. The use of CNG as a fuel for vehicles Environmental Issues and Consideration: In addition to the previous mentioned economic benefits of fuel switching policy to more clean fuels such as natural gas in the transport sector, the utilization of natural gas instead of conventional fuels has several environmental benefits which include: - Emissions reduction levels as a result of using CNG instead of gasoline could reach 86% for
carbon mono-oxide CO, 83% for non-methane hydro carbons, and 25% for each of nitrogen oxides NOx and carbon dioxide CO2.
- From safety perspective, due to the high pressure of CNG that reach more than 200 bars in cylinders and at fueling station hoses and storage, safety measures comes on top priorities of CNG operating companies. Implementation of comprehensive quality measures and the highest levels of safety in all CNG stations is vital through the utilization of automatic control systems, implemeting preventive maintenance techiniques and approaches, guarantee of gas purity, performing constant follow-up programs, performing lighting and noise rate measurements, periodic inspection of safety, and applying the up-to-date standards. With respect to CNG cyliners; safety measures and regulations include the following: the cylinders are manufactured according to ISO Standard 11439 which defines the working pressure to 200 bars and the test pressure to 300 bars ensuring high safety precautions and limits, the CNG cylinders is seamless or zero-welding cylinders, and is designed to bear high pressure, shocks, low temperature, shooting by gunfire, burning while being filled with natural gas, hydraulic pressure, low temperature pressure cycling, and drop.

22
6.2.3. The use of CNG as a fuel for vehicles Policy Analysis: The remarkable progress and development of the utilization of natural gas as a fuel for vehicles and the NGV market in Egypt could be attributed to several important market drivers the most important of which are the following: - Availability of significant natural gas proven reserves which estimated at about 72.2 Trillion Cubic
Feet (TCF) by the end of June 2012. - The existence of a reliable, efficient and expandable natural gas network with a total length of
more than 18 thousand km which covers most of the inhibited areas in the country. - The prevailing fuels pricing scheme which make natural gas the fuel of choice for vehicles.
Currently, the price of CNG is LE 0.45/M3 which represent 50% of gasoline 80 price, 26% of gasoline 90 price, 24% of gasoline 92 price, 8% of gasoline 95 price and 41% of diesel price.
- The success of the MoP to keep balance between the number of converted vehicles to CNG and the availability of adequate natural gas supply infrastructure, mainly CNG fuelling stations. In that regard, it worth mentioning that total number of vehicles served by one fuelling station is still less than the world average which is about 1200 vehicles per station. However, the relatively high investment associated to the construction of CNG fuelling station which account for more than LE 7 million (USD l million) in addition to the scarcity of available land particularly in major cities like Cairo and Alexandria are among the main barriers and challenges that could hinder achieving more development of NGVs sustainable market in Egypt.
- Considerable potential for more vehicles conversion. In that regard it worth to mention that in spite of the significant number of converted vehicles to CNG which accounted for 195 thousand by the end of June 2013, their share of total vehicles fleet in Egypt does not exceed 3% leaving a huge potential for more vehicles conversion.
6.3. Economic, Environmental and Policy Analysis of Cairo Metro:
6.3.1. Economic Analysis of Cairo Metro:
The construction of metro lines is characterized by being very high capital intensive projects. As shown from table (13), the construction cost of the four Cairo metro lines (in operation, under construction and planned) estimated at about LE 75 billion. Therefore, attracting the necessary and appropriate investments for their financing considered as a great challenge. As for the case of Egypt the success of implementing the first metro line project which fully financed by the Egyptian government in addition to its economic, social and environmental viability encouraged both the national and international investors and financing firms to participate in financing the rest of Cairo Metro lines. International financing entities that contributed in financing the metro lines projects include as an example the European Investment Bank (EIB), the Agence Française de Développement (AfD), Japan Bank for International Cooperation (JBIC), the European Union (EU), etc. In addition to the high capital investments needed for the construction of metro lines the operation and maintenance costs are also high and it becomes very difficult to allocate the necessary funds to keep sustainable operation of the metro lines at reasonable quality of service in light of the prevailing unified low tariffs for passengers transport which account for only one LE regardless of the length of the travel trip. One possibility to tackle and overcome that problem it to start the program of energy prices reform and to allocate some of the phased out gasoline and diesel subsidy to raise the efficiency of operation of the existing metro lines, to cover the shortage in metro system operation and maintenances costs, in addition to improve the service provided to metro passengers. As previously mentioned, the subsidies allocated to gasoline and diesel are very huge (LE 27 billion and LE 57 billion in 2012/2013 respectively) representing 66 of total petroleum energy subsidy.

23
However, and in spite of the huge investments and costs associated to the construction and operation of Cairo metro lines, they are characterized by considerable economic benefits of which are the following: [15] - Economic gain as a result of reduction in surface trips time by different modes of transport,
improvements in traffic jams and congestions, the switch of significant volume of motorized vehicles passengers to the underground metro consequently reducing gasoline and diesel fuels consumption and the associated subsidy and pollutants emissions.
- Encourage the development of national industry and leverage its efficiency and competitiveness particularly that relevant to the equipments and component of the metro therefore reduce the need for foreign currency and borrowing from abroad. In that regard it worth mentioning that some of the metro wagons are currently produced in Egypt according to a contract between the Japanese Company Mitsubishi and Semaf Company of Egypt. Other equipments and materials utilized for the construction and operation of metro lines currently produced in Egypt include cables, electrical distribution boards, lighting units, Poly vinyl Chloride PVC sewers, cement, ceramics, granite, etc.
Table (13) Cairo Metro lines main characteristics and associated investments Line / Phase Opening Date Length
(Km) Capacity (million
passenger/day) Investment (LE billion)
Line 1 (Helwan-el Marg) Start operation:1987 Fully operation:1989
44.3 1.2 2
Line 2 (Shobra El Kheima - El Mounib) Start operation:1995 Fully operation:2005
21.6 1 9.7
Line 3 (Imbaba - Cairo Airport): 33.5 2.3 48.2
Phase 1 (Attaba- Abbassia) February 2012 4.3 4.2
Phase 2 (Abbassia- Haroun Station in Heliopolies) April 2014 7.7 8 Phase 3 (Attaba- Sphinx Square - Imbaba) October 2015 18 18
Phase 4 (Haroun Station – Cairo Airport) 10.5 18 Line 4 (October-Oasis Highway- Police Academy) October 2020 37 2 15
Source: Ministry of Investment.
6.3.2. Environmental and Socio-Economic Impacts of Cairo Metro: Several studies have been conducted in order to assess the socioeconomic and environmental impacts of Cairo metro lines. The studies show positive impacts for all dimensions assessed including the generation of more economic returns and value added, creation of more jobs (As an example, the first phase of line three that took about 51 months to be finished and opened on February 2012 provided about 3500 jobs [16]), fuel saving and reduction of pollutants emissions as a result of using metro lines instead of motorized mode of transport, the improvements of life style of the communities around the metro lines. In that regard, it worth to mention that part of the finance allocated for the construction of metro lines is used for the development of communities surrounding metro lines including social services, housing improvements, the development of basic infrastructure including renewing of existing one in addition to the development of Small and Medium Enterprises (SME). Furthermore, and according to the Environmental Impact Assessment (EIA) for Phase 1 of line four performed by the Egyptian Environmental Consultancy Company (Environics) substantial benefits are expected to be attained such as economic growth, improvements in the quality of life of the Egyptian citizens, affordability of safer mode of transport, minimized traveling time and more job opportunities creation. However, the study assessed some negative impacts that are expected to occur mainly during construction phases such as the increase in air and noise pollution due to the utilization of some machinery for soil excavation in addition to the movements of vehicles, local traffic congestion,

24
and the disruption created as a result of land occupation. The study recommended some measure to overcome and mitigate the previous mentioned negative impacts such as the use of machinery and vehicles at good condition to decrease noise and air pollution and the better coordination with governorate and relevant authorities to decrease the potential disruption created by land occupation, traffic congestion and other physical barriers created during the construction phase. The study also recommended some measures to be undertaken in order to mitigate the negative impacts that could emerge during the operation phase of the line such as air pollution and noise of vehicles travelling to and from the new stations of the metro of which are the construction of parking areas and the erection of noise barriers.[17] Moreover, according to a feasibility study prepared by AFD to provide a loan of 44 M€ for financing phase 2 of line 3 of Cairo metro the following impacts have been identified: [18] - An economic internal rate of return at 17%, mainly due to a gain in travel times. - Negative environmental impacts during the construction phase (noise and pollution) but positive
during operation phase (noise reduction and pollution abatement). The reduction in GHGs emissions estimated at about 133 thousand tons of CO2 per year.
- From the social perspective, the project gives Cairo citizens better access to employment and services, especially for low income classes or population.
Furthermore, and according to the National Authority for Tunnels (NAT), Cairo metro have several economic, social and environmental positive impacts of which are the following: [15] - Improving and raising the social and economic level of the surrounding area and community near
the metro lines. - Improving health conditions for the citizens living near the metro lines as a result of reducing
pollutants emissions from motorized vehicles (busses and cars). - Providing more than 15000 direct and indirect job opportunities during the construction phase and
the operation of metro lines. - Renewing of all public utilities networks surrounding metro lines areas and consequently improves
their performance and efficiency. - Opportunity for a modal shift in means of transportation leads to a reduction in the total distance in
kilometers travelled by cars, taxis, shared taxis, minibuses and buses and thereby lead to a reduction in fuel consumed and consequently the emissions that would have resulted from fuel combustion in these vehicles.
- Job creation and skills development in a variety of economic sectors during the constructions and operations phases.
7. Policy Design Consideration:
7.1. OVSRP Policy Design Consideration: Key important issues have been considered in the set up and design of the programme that guaranteed its success in addition to the potential for its replication. The following are some examples of the OVSRP design consideration:
- The well setup and design of the program which is considered as the first attempt by the government of Egypt to promote fuel-efficient, private vehicles through a combination of outreach, financial and economic incentives and market organization.
- The success in building up strong and effective partnership between different stakeholders participating in the program (the MoF, MoI, and MoE as governmental entities and several private sector entities such as commercial banks, insurance companies, vehicles manufactures, advertising agencies, taxi vehicles owners, scrapping and recycling operators, and the WB Carbon Finance Unit). Appendix (3) presents the OVSRP main stakeholders, their role and responsibilities.

25
- The provision of a very effective financial mechanism and economic incentives that helped old taxi vehicle’s owners to overcome the high upfront investment cost barrier and accordingly enabled them purchase new vehicles.
- The utilization of one-stop-shop approach that help old vehicles owners to scarp, recycle old vehicles, get loans for purchasing new and fuel-efficient ones in addition to insurance and licenses, etc. all in one site with a very simple, effective and transparent steps and approach. Consequently, high levels of program participation rates have been achieved.
- Maintaining a degree of flexibility which allow for periodical changes to be made on the program based on vehicles owners feedback from performed surveys and interviews.
- Carful program planning, close monitoring in addition to partners meeting before program implementation which proves to be essential for ensuring better coordination among different stakeholders, keeping detailed records for project activities through its database, and performing random surveys to estimate fuel saving and GHGs emissions reduction.
- Guarantee the success of project implementation in GCR in order to encourage the government to expand it to cover the rest of old taxi vehicles in GCR and to include other types of old vehicles such as microbuses, minibuses, trailer trucks, trucks and buses in addition to its replication in other region of Egypt such as Alexandria, Dakahleya, Ismailia, and Assiut.
- The design and set up of the project so it could be considered as a good example for its replication in other sectors in Egypt and in other countries with similar economic and transport sector system characteristics. The proposed countries in the ESCWA region in which such a project could be replicated include Jordan, Syria, Lebanon, Yemen, Iraq, Libya, Sudan, Morocco, Tunisia and Palestine. Other proposed countries outside the ESCWA region through which the project could be implemented include Algeria and to less extent some countries in the Gulf area as most of its vehicles fleet characterized by being new and less than 10-15 years old. It worth to mention that some governments of the previous mentioned countries has already expressed interest in performing similar projects.
7.2. The Usage of CNG as a Fuel for Vehicles Policy Design Consideration: The success of implemeting the NGVs programme in Egypt and the development of its market could be attributed to several implemeted institunional, economic, market development, and rasing awerness policies, measures and intiatives that ensure it's wider spread and sustainability of which are the following: - The formulation of a CNG policy committee heded by the chairman of the Egyptian Natural Gas
Holding Company EGAS and comprise chairmen of CNG operating companies. The committee is responsible for giving approvals for the establishment of CNG operating companies, monitoring the devlopment of NGVs market and recommending the appropriate policies, measures and actions needed for its development and to achieve the CNG industry targets and objectives. In that regard it might be worth to mention the following relevant aspects and issues: The utilization of natural gas as a fuel for vehicles instead of gasoline and diesel considered as
one of the main important applications of natural gas fuel switching policy in different economic sectors in Egypt since the early 1980s including transport.
The main objective of the CNG industry strategy in Egypt is to introduce at least 20 thousand new CNG vehicles per year to the NGVs market in addition to the establishment of 10 new CNG fueling station.
As the regulatory body of natural gas industry in Egypt is not yet exist and stiil under establishment, EGAS plays some of its roles and responsibilities.

26
The formulation of such a committee shouldn't be looked at as a sort of cartile as almost all the CNG operating companies are based on PPP with some 100% privately owned and there is no any restrictions on the establishment and the entrance of any new company to the NGVs market.
- The formulation of a CNG committee within EGAS with mandates and responsibilities including monitoring the performance of the CNG operating companies and the development of the CNG market, proposing the necessary norms and standards in addition to giving approvals for the establishment of new conversion centers and the construction of new CNG fueling stations. Examples of the norms set by the committee to organize and regulate the construction of new CNG fueling stations activity include the following: (1) the distance between two CNG fueling stations should not be less than one kilometer. (2) In order to construct any new CNG fueling station, the CNG operating company has to convert first at least 600 vehicles to CNG, etc.
- The development of relatively suitable financing mechanism for converting vehicles such as the smart card system which is considered as an effective financial mechanism that help making vehicles conversion to CNG economically attractive and bankable projects. One of the main features that strength that financing mechanizm and make it very attractive for taxi vehicles is that the payback period of vehicles conversion cost is equal or less than 6 month for taxi and about 2 years for private cars.
- Cooperation with vehicles manufacturing companies: The main objective of that initative is to convert vehicles to run on both CNG and gasoline on the production lines of the vehicles manufacturing companies in the context of the OVSRP. Hyundai, BYD and Chevrolet are the frequent models used in that segment.
- Incorporating CNG fueling stations within existing oil stations: As previously mentioned, one of the main constraints that face the construction of new CNG fueling stations is the scarcity of the necessary land particularly in major cities such as Cairo and Alexandria. In order to overcome that obstacle, the MoP permits and encourage the construction of CNG fueling station within the existing oil stations.
- In order to increase the number of CNG buses and ecourge the conversion of public transport authorities busses fleet to CNG, it is necessary to provide the appropriate CNG supply infrastructure. In an attempt to achieve that goal, Cairo Transportation Authority CTA built a CNG fuelling station that fuels 200 buses per day. Other four CNG buses fueling stations in CTA’s garages are currently in the process of establishment. Moreover, CTA is intending to buy 1350 new buses 400 of which will be dedicated CNG buses.
- In the context of the MoP policy that aims at providing reliable and sufficient CNG supply infrastructure at reasonable cost and to allocate adequate resources towards achieving that goal, a joint venture company between SAFE Italy and Gastec and EGAS of Egypt has been established. The main activity of the company is to assemble SAFE CNG compressor, dispensers and storage through SAFE Egypt CNG Company.
- The implementation of several CNG awareness campaigns and promotion programs. As an example, the NGVs Company (Cargas) implemented two promotion programmes to ecncourage petroleum sector employees to convert their gasoline operated vehicles to use CNG. The first programme allows car owner to convert vehicle to CNG by paying 50% of total conversion cost as down payment with the rest of the cost to be paid through 24 monthly instalments without any interest rate. The second programme allows car owner to convert vehicle to CNG by paying the full conversion cost and get 1000 cubic meters of CNG for free. Although both programmes seems to be more attractive than the smart card system due to incentives provided, the smart card mechanism is considered more successful and sustainable approach for several reasons which include the dominant factor that affect the decision taken by the two different income classes concerned (taxi owners and petroleum sector employees). While that for the taxi owners is mainly dominated by the

27
economics and benefits of converting vehicles to CNG instead of gasoline that for the petroleum sector employees is dominated by other factors rather than economics and benefits of conversion (particularly in the context of the prevailing heavly subsidezied fuel pricing schemes) such as barriers for conversion (examples include the reduced trunk space caused by CNG cylinder, waiting time at CNG refueling stations, etc.).
- Cargas company signed a contract with Vodafone Egypt through which the company converted a number of Vodafone's fleet of modern vehicles to use both CNG and gasoline. Cargas also signed a contract with Coca Cola Egypt according to which Cargas converted Coca-Cola Egypt’s forklift fleet to be operated by CNG.
7.3. Cairo Metro Policy Design Consideration: Several policies, measures and criterion have been considered at the design stage of the construction of metro lines of which is the choice and the identification of the line track which is done according to specific criteria that guarantee the following: The line will serve significant volume of population and pass through the more crowded areas in which traffic congestions and bottlenecks occurred, the line is connected to other types of mode of transport, in addition to the technical and financial viability of the construction of the line which encourage financing institutions to participate in financing different phases of the line with favorable conditions and terms of loans provided.
8. Barriers / Obstacles against Implementation and Lessons Learned: [8], [10] & [19]
8.1. OVSRP Barriers/ Obstacles against Implementation and Lessons Learned:
In spite of the success that has been achieved in implementing the OVSRP in GCR so far, several challenges and barriers exist that could negatively affect its effectiveness and possible sustainability and replications in the future; the following are some examples of which: - Failure of some stakeholders to fulfill their commitments. As an example the advertising agency
failed to pay the cost of advertisement on new taxi vehicles to participating lending banks towards vehicles owner’s debt service payments in addition to its withdrawal from the program.
- Failure of some taxi vehicles owners to pay their loan installments to lending banks, particularly after the 25th of January 2011 due to the tough economic situation that Egypt passed through.
- The rapid growth of the program which created increased service demand that was not expected by the maintenance companies.
- The culture differences of taxi vehicles owners who are used to make their vehicles maintenance service at local maintenance shops.
- Degree of coordination and collaboration between participating stakeholders and entities. - The costs of maintenance services. - Waiting times for getting the new vehicles and their quality.
However, several key tangible lessons have been learned through the implementation of OVSRP in Egypt of which is the following: [7], [19] - The feasibility and success of implementing such energy efficiency and air quality improvement
programmes through the CDM APU which acts as a centralized unit and networking agent for carbon trading in the Ministry of State of Environment.
- The implementation of such programmes helped not only proving their success, raising interest and confidence for implementing further CDM projects but also the need for getting the necessary strong political support for their implementation.
28
- In order to encourage behavioral changes towards energy efficiency improvements and attract the necessary investments and finance for their materialization, there is a need to create positive incentives on the whole programme or project value chain.
- Awareness is considered as one of the essential key drivers for the success of the programme through the vital role it plays in attracting the interest of old vehicles owners and different stakeholders on its importance and viability, getting the necessary political support for its implementation not only as a viable and cost effective project but also as one of the new carbon trading projects.
- Strong and solid cooperation among different stakeholders participating in the project proves to be one of the key success drivers that help the APU in building and creating the necessary technical expertise and system of change for project registration, development and implementation as the first transport CDM project worldwide.
- Political support combined with remarkable success of implementing similar pilot programs and projects could help the implementation of similar projects in other areas and sectors of the economy and consequently achieving programme ultimate goals and objectives.
- Incentives in addition to effective tools, mechanisms and efforts could play an essential role to facilitate compliance with environmental legislation and achieve its goals.
- Financial incentives coupled with government and private incentives can offer an attractive platform for old vehicles owners to encourage them participate in the programme.
- Performing pilot project is important to allow better and appropriate design of the programme, assist information and outreach to be targeted, and build up the necessary and effective partnership for its execution.
- Well define scope of the programme in addition to its effective approach helped the MoF on getting the programme components carefully worked out.
- As such programmes can impose some environmental risks in performing some activities such as handling of liquids and solid waste from older vehicles; therefore scrapping and recycling facilities should be carefully planned and designed with carrying in-depth environmental and social assessments in order to avoid such risks.
- Good potential for programme replication in countries with similar characteristics of the Egyptian energy and transport sectors system.
- The OVSRP is not a new initiative as it is well known and implemented in several countries worldwide as presented in appendix (4).
8.2. The Usage of CNG as a Fuel for Vehicles Barriers/ Obstacles against Implementation and Lessons Learned: In spite of the previous mentioned market drivers and initatives for the development of NGVs market in Egypt, a number of barriers and challenges exist which could be categorized as technical, operational, economical, and environmental barriers and challenges. The technical and operational barriers and challenges include: low efficiency of some existing vehicles fleet engines, extra weight and reduced vehicle trunk space caused by CNG cylinder, inadequate participation of vehicles manufacturing companies in the national programme for vehicles conversion, lengthy procedures for getting approvals for the construction and operation of CNG fueling stations and conversion centers, access to natural gas network, waiting time at CNG refueling stations, land space availability, prevailing standards and safety regulations; and awareness. The economical barriers and challenges include: the relatively high cost of conversion kits and CNG refueling stations that account for LE (5000-6000) thousand and LE 7 million respectively, encountered problems facing the implementation of the “Smart Card system” such as operation outage of smart cards machines in

29
some of the CNG fueling stations and delays of some vehicles owners in paying loans installments associated to the cost of their vehicles conversion to lending commercial banks. Concerning the environmental barriers and challenges although the current prevailing environmental law number 4 for 1994 sets some limits for vehicles pollutants emissions however the law does not cover all pollutants such as NOx and SOx and is not practically enforced to a large extent. In order to encourage more vehicles owners to convert their vehicles to CNG, it is recommended that the law should be strictly enforced and its terms be revisited to cover more pollutants and consider more stringent emission limits.
8.3. Cairo Metro Barriers/ Obstacles against Implementation and Lessons Learned: The barriers, obstacles and challenges associated to the construction and operation of Cairo metro lines in addition to the lessons learned include: - The huge capital investment needed. As previously mentioned total cost of the construction of the
four metro lines will reach about LE 75 billion by the end of 2020 (about LE 2 billion yearly). - The economic, social and environmental negative impacts occurred during the construction of the
metro lines which include: increased commuting time and traffic congestions particularly in areas near the metro line, the huge amount of soil excavated during the construction and the difficulty of getting rid of it in addition to the quantities of dust emitted during that operation, the noise and pollutants emitted from equipments and vehicles operated on the surface of the metro tunnels, etc.
- Need of qualified personnel for performing the various activities related to the construction and the operation of metro lines efficiently and effectively, and
- Need for the acquisition of the most up to date technologies and knowhow for the construction and the operation of metro lines.
9. Conclusions and Recommendations:
9.1. Conclusions:
The transport sector plays a vital role in achieving economic and social development in Egypt. However, it is considered as one of the main energy consumers and sources of pollutants emissions. Over the last four decades, the period (1981/1982-2012/2013) transport sector total petroleum energy consumption increased by an average annual growth rate of about 5% to reach 16.6 mtoe in the year 2012/2013 with relevant CO2 emissions accounted for 49 million tons. Among the key important factors that led to that situation are the following:
Economic and population growth in addition to the increase in travel demand for both passengers and freight. The high population density and growth particularly in major cities like Cairo puts an escalating pressure on available limited natural resources and infrastructure including that for the transport sector.
Limited, inconvenient and inefficient public modes of transport which characterized by poor maintenance and lack of integration among themselves and with other modes of transport.
Unplanned expansion of some residential, commercials and industrial districts with the lack of appropriate parking areas.
The switch of large volumes of passengers from public to private transport which reflected in the increase of private cars and taxi fleet.
The existence of a significant number of old vehicles which characterized by inefficient fuel consumption, more pollutants emission, poor maintenance and frequently breakdowns.
Lower trip speed. According to the Transportation Master Plan for GCR performed in 2002, average trip speed among all modes of travel in GCR is expected to decrease from 19 km/hr currently to 11.6 km/hr by 2022 with average journey time to and from work to be doubled. [22]
30
Recognizing the adverse and negative impacts of the continuation of the transport sector problems on social and economic development the government of Egypt started and since few decades taking the necessary policy reforms and measures to mitigate such impacts which include the promotions and development of public transport, fuel switching to more clean fuels, upgrading of vehicles fleet, the development of transport infrastructure, traffic management, vehicles emission testing and engine tuning, etc. Examples of successful implemented policy reforms, programmes and projects eligible to attract energy efficiency investments and make it bankable that have been addressed through the current paper include the OVSRP, the utilization of CNG as a fuel for vehicles, and the construction of Cairo Metro.
In addition to positive economic and social benefits gains as a result of implementing the previous mentioned programmes and projects estimates of energy savings and GHGs emissions reduction are as follows: For the OVSRP; scraping, recycling and replacement of 49 thousand old taxi vehicles by new and fuel-efficient vehicles is expected to result in an accumulated gasoline consumption savings during programme implementation; the period (2013-2018) of about 1 million ton and avoiding the emission of 1.3- 2.3 million tons of CO2e. For the CNG programme; gasoline and diesel fuel saving accounted for about 4.2 mtoe during the period (1997/1998-2012/2013) and consequently cumulative avoided CO2 emissions reduction during the same period estimated at 2.3 million tons. For Cairo Metro: total accumulated gasoline saving during the period (1989-2021) estimated at 81 mtoe assuming the case of passengers switch from private cars to metro. Accordingly, total avoided CO2 emissions during the same period estimated at 228 million tons. As for the case of passengers switch from public buses to metro; total accumulated diesel fuel savings during the period (1989-2021) estimated at 18 mtoe. Accordingly, total avoided CO2 emissions during the same period estimated at more than 51 million tons.
The success of implementing the assessed programmes and projects could be attributed basically to the following main factors:
A. For the OVSRP and the use of CNG as a fuel for vehicles: Their design and set up as PPP and the success in building up strong and effective partnership
among different stakeholders. The provision of very efficient institutional frameworks, cost effective financial mechanism and
economic incentives. Examples in that regard include: The utilization of one-stop-shop approach in the case of the OVSRP which help old vehicles
owners to scarp, recycle their old vehicles, get loans for purchasing new and fuel-efficient vehicles, etc. all in one site with a very simple and effective approach. As a result, high levels of program participation rates have been achieved.
The use of the smart card system in the CNG program which allows car owners to get the necessary loans to convert their vehicles to CNG from one of the local banks and pay the conversion cost in the form of monthly installments with favorable interest rate and loan conditions. The system in addition to other financial and economic incentives successed in attracting investments for the development of the CNG market in Egypt in addition to help pre-fesibility study business plans to become bankable projects that can be financed.
Maintaining a degree of flexibility which allow for periodical changes to be made on project implementation procedures based on vehicles owners feedback from surveys and interviews.
Careful program planning in addition to close monitoring. B. For Cairo metro, the success of implementing the first metro line project which fully financed by
the Egyptian government in addition to its economic, social and environmental viability

31
encouraged both the national and international investors and financing firms to participate in financing the rest of Cairo Metro lines.
However, several challenges and barriers exist that might negatively affect its effectiveness and possible sustainability and replications in the future. Last but not least, the lessons learned from the implementation of the previous mentioned programmes and projects prove the good potential for its replication in countries with similar characteristics of the transport system in Egypt. Proposed countries in the ESCWA region include Jordan, Lebanon, Syria, Yemen, Iraq, Libya, Sudan, Morocco, Tunisia and Palestine. It worth mention to that some governments of those countries have already expressed interest in performing similar projects.
9.2. Recommendations: - Importance to create positive incentives on the whole value chain of similar presented programs
and projects in order to encourage behavioral changes towards energy efficiency improvements and attract the necessary investments and finance for their materialization,
- Importance of having strong and solid cooperation among different stakeholders. - In order to implement similar energy efficiency projects and policy reforms in other areas and
sectors of the economy and achieve their ultimate goals, it is necessary to have strong political support combined with remarkable success of implementing similar pilot programmes and projects which allow better and appropriate design of the energy efficiency programmes in the transport sector, assist information and outreach to be targeted and build up the necessary and effective partnership for its execution.
- To help getting the programme components carefully worked out it is essential to have a well defined scope of the programme and an effective approach for its implementation.
- It is important to perform and conduct awareness campaigns as it is considered as one of the essential key drivers for the success of energy efficiency programmes and projects in different economic sectors in general and in the transport sector in particular.
- In order to guarantee the effective implementation of energy efficiency improvements and pollutants emissions reduction policy reforms projects and programmers and make it more economically attractive, it is necessary to establish the appropriate set up and design for its implementation in addition to the effective financial mechanisms.

32
10. References: 1. Ministry of Petroleum (MoP). 2. Central Agency for Public Mobilization and Statistics (CAPMAS) and the State Information
Service. 3. World Bank Urban Transport Strategy Review, the Case of Cairo, Egypt, WB, November 2000. 4. Greater Cairo: A Proposed Urban Transport Strategy, World Bank, November 2006. 5. Options and Opportunities for Greenhouse Gases Abatement in the Energy Sector of ESCWA
Region, Volume 1: Transport Sector, ECSWA, 2001. 6. Carbon Credits Help Remove Old, Polluting Taxis from the Streets of Cairo, Carbon Finance
Unit, WB, 2012. 7. Integrated Safeguard Data Sheet Concept Stage, WB, 2009. 8. Small-Scale CDM Programme of Activities Design Document from (CDM SSC-PoA-DD) –
Version 01, UNFCCC & the WB, December 2009. 9. Carbon Finance Assessment Memorandum on a Proposed Carbon Offset Project with the
Ministry of Finance for the Vehicle Scrapping and Recycling Program, World Bank, 2010. 10. “Subsidies for Energy Efficiency and Alternative Energy Adoption Programs: Case Study from
Egypt Taxi Recycling Program”, AUC, April 2011. 11. Ministry of Finance. 12. “Arab Republic of Egypt Cost Assessment of Environmental Degradation”, World Bank, June
2002. 13. The Arab Republic of Egypt, for Better or for Worse: Air Pollution in Greater Cairo, a Sector
Note, World Bank, April 2013. 14. Egypt tackles climate change through energy-efficient transportation, MDG-F, wiki.mdgfund.net. 15. The National Tunnels Authority (NAT). 16. http://www.vinciconstruction.co.uk/news-and-downloads/Opening-of-Phase-1-of-Line-3-of-the-
Cairo-metro.html). 17. Cairo's Metro Line 4 had given environmental green light, Egyptian Independent, 2010. 18. AFD. 19. Good Practices in City Energy Efficiency, Cairo ARE- Taxi scrapping and Recycling Project,
Energy Efficient Cities Initiative, ESMAP, May 2010. 20. Greater Cairo: A Proposed Urban Transport Strategy, World Bank, November 2006). 21. Car scrapping- sense and nonsense of a popular scheme, QCEA ethical fact sheet, 2010. 22. Invest in Egypt, Logistics and Transportation, Ministry of Investment, 2013.

33
Appendices
Appendix (1) Transport Sector Planned Projects
Project Details Estimated Cost Contract
Railway & Metro Projects High Speed Train
Alexandria /Cairo (210 Km) $ 4.3 billion PPP/BOT
Cairo/Luxor (700 Km)
$ 8.6 billion Luxor/ Hurgada (300 Km) $ 5.7 billion
Safaga /Quena/AboTartoor Freight Train(Fright Link ) $ 121 Million PPP/BOT AinSams/10thof Ramadan railway Passenger and Fright Link $ 1.3 Billion PPP/BOT Sidi-GaberRailway Station
Commercialization ( Shopping Mall attached to the railway station &car parking )
$30 Million Management cost
Management Contract
Ramsis Railway Station
Commercialization ( Shopping Mall attached to the railway station &car parking )
$30 Million Management cost
Alexandria Touristic Station
Commercialization ( Shopping Mall located in Alexandria Port
Management Contract
Mansura / Damietta Train Passenger and Fright Link $ 117 Million PPP/MMO Super Tram 6thof October City / Line 4 30 Km $ 264 Million PPP/BOT Super Tram Nasr City/New Cairo 44 Km $ 392 Million PPP/BOT Abbasia/TibeenTrain Passenger and Fright Link $ 214 Million PPP/BOT
Multi-model Station Commercialization ( Huge Commercial area in New Cairo Qaliub , Almoneeb, RodElFarag)
$ 357 Million PPP/BOT
Road Projects Urban Ring Road 2ndphase
Badr City/ Belbeise 125 Km ( Build ,Operate and Manage The Road)
$ 603 Million
PPP/BOT
Coastal Road Port Said /Matrouh
Linked Egypt from the east to west 565Km ( Build ,Operate and Manage The Road)
$ 314 Million
PPP/BOT
Cairo / Suez Road
Link Cairo to Sinai Peninsula 120 Km ( Rehabilitation of Construction
$ 225 Million
PPP/BOT
Shobra / Banha Free Road
Link Cairo to the heart of Delta 39 Km ( Build ,Operate and Manage The Road)
$ 235 Million
PPP/BOT
Kafr El Zayat /Hosh Issa/Alexandria 110Km construction $ 200 Million PPP/BOT
River Projects
Quena Port (Concession)
Length:250 m Depth : 250 m Storage Capacity: 255,ooo ton Annual Throughput : 6,6 million ton
$ 28.5 Million
BOT
Sohag Port (Concession)
Length:350 m Depth : 70 m Storage Capacity: 197,200 ton Annual Throughput : 5,1 million ton
$ 21 Million
BOT
Assiut Port (Concession)
Length:540 m Depth : 265 m Storage Capacity: 578,000 ton Annual Throughput : 15million ton
$ 64.4 Million
BOT
Meit Ghamr Port (Concession)
Length:625 m Depth : 115m Storage Capacity: 248,000ton Annual Throughput : 6,5 million ton
$ 28.5 Million
BOT
Maritime Projects
East Port Said Port ( Concession )
Logistics Area $ 168 Million BOT Container Terminal $ 700 Million
BOT General Cargo Terminal $ 257 Million
BOT
Sokhna Port ( Concession ) Logistics Area $ 57 Million BOT
Damietta Port ( Concession ) Multipurpose Terminal $ 100 Million BOT
Dekheila Port ( Concession ) Dry Bulk $ 78 Million
BOT Dry Bulk Extension $ 290 Million
BOT Source: The Way Forward…Projects and Investment Opportunities, Ministry of Transport, March 2013.

ApCairo M
34
ppendix (2) Metro lines M
Map

35
Appendix (3) OVSRP stakeholders and their main role, duties and responsibilities
Stakeholder Main Duties and Responsibilities The Ministry of Finance (MoF)
Coordinate and manage all program activities. Provides vehicles owners with payments for surrendered eligible vehicles. Ensuring that obsolete old taxies are scrapped according to the prevailing environmental
regulations and standards in order to avoid their re-use or part of them. Bear new vehicles sales tax on behalf of vehicle’s owners. Exempts customs on imported components of vehicles. Guarantees given loans from banks against default in selected cases. Working with the World Bank Carbon Finance Unit to leverage carbon finance to support
the development of a recycling facility that would ensure scrapped vehicles are permanently taken off the roads.
The Ministry of Interior (MoI)
Providing land for processing/scrapping and recycling sites, as well as managing vehicle inspection and new vehicle licensing.
Provides security and monitoring services for processing, scrapping and recycling sites
The Ministry of Environment (MoE) , EEAA and the CDM Awareness and Promotion Unit
Program development and monitoring as CDM project including issuing letter of approval of the program and its participation in achieving sustainable development.
Program supervision from environment perspective. Giving environmental approval for participating private sector entity to operate the
scraping and recycling facility.
The World Bank Carbon Finance Unit
Working with the Ministry of Finance to leverage carbon finance to support the development of a recycling facility that would ensure scrapped vehicles are permanently taken off the roads.
Securing partners willing to buy carbon credits
The banks Provide low-interest loans to eligible vehicle owners. The Vehicles Manufacturing Companies or Auto Dealers (Lada, Sperenza, Hyundai, Chevrolet Lanos, and Peugot).
Prepare vehicles for mass transport use (e.g. install meters and paint exteriors). Provide up to 3 year warranty on vehicles. Provide the necessary routine maintenance. Guarantee loans against default as they repossess the vehicles and pays the loans to the
bank. Buying old taxi licenses.
Insurance Companies Providing insurance for the new vehicles. Advertising Firms Using taxis as advertising space, to help reduce owners’ payments. Representatives for processing/scrapping sites
Monitor the process for scrapping old taxies.

36
Appendix (4) Vehicles Scrapping and Recycling Program Worldwide [21]
The old vehicles scrapping and recycling program is not a new scheme as it is well known and implemented in many countries in the world with the objective not only to promote the reduction of GHG emissions through the replacement of old vehicles by new and fuel-efficient ones but also with the aim of strength the economy through attracting investments, the promotion and development of vehicle industry, creating new job opportunities, etc. As shown from table (20), the program is implemented in several countries with schemes of relative different requirements and perspectives that each country feels it will benefit it most as follows:
France, Italy, Luxembourg and Spain offer increasing incentives for buying the more efficient vehicles.
The US effort is to reduce vehicles fuel consumption from over 13.1 L/km to under 10.7 L/km through advances technology.
Egypt provides several incentives to old vehicles owners to encourage and help them scrapping and replacing their old vehicles by new and fuel-efficient vehicles.
China effort in that regard is to reach at least the Euro 3 standards by higher number of vehicles running on the roads.
In Russia, the scheme requires that vehicles replacing the old ones should be produced locally.
The experience gained from applying vehicles scrapping programmers worldwide showed the following: - Importance of its sustainability in medium and long terms; incentives could play an important and
vital role in achieving that objective. - Vehicle scrapping schemes can play a vital role at times of recession as they can encourage
people not to reduce their spending and consequently help the economy towards a faster recovery. - Fuel efficiency and carbon reduction should be the core of future vehicle’s scrapping schemes. - Importance of exchanging the best practice of vehicles scrapping programs between countries and
consequently following the good examples provided. - Awareness and dissemination of information about carbon emission by different vehicles models
should be provided by car manufacturers and supply dealers.

37
Country Entry into effect
Age requirement Emissions requirement
Financial limit
Austria 2009 (April) Older than 13 years Euro‐4 1500 Euros
China 2009 ( June) Old heavy polluting cars and trucks.
Euro‐3 $450‐ $900
Egypt 2009 Only taxis older than 20 years
Choice between 5 models – all assembled in Egypt
650 Euros plus special credit scheme
France 2009 ( January) Older than 10 years Up to 160 g/km for increasing efficiency
1000 up to 5000 Euros
Germany 2009 ( January) Older than 9 years Euro‐4 2500 Euros Italy 2009 (there
were several
before)
Older than 10 years <140 g/km petrol<140 g/km diesel
For increasing efficiency
1500 Euros up to 5000 Euros.
Ireland 2009 (December)
Older than 10 years Euro‐4 1500 Euros
Japan 2009 ( June) Older than 13 years none 2500 US $ Luxembourg 2009 ( January) Older than 10 years Euro‐4 for emissions
below 120 g/km 1500 Euros 2500 Euros
Portugal 2007 Older than 10 yearsOlder than 15 years
Euro‐4 1000 Euros 1250 Euros
Romania 2005 Older than 12 years No particular requirement
900 Euros
Russia 2010 (March) Older than 10 years
Must be produced in Russia
1200 Euros
Slovakia 2009 (March) Older than 10 years Acquisition below
25000 Euros
2000 Euros
Spain 2008 (August) Older than 10 years or
more than 250 thousand km
Less than 120 g/km Special credit
scheme
United
Kingdom
2009 Older than 10 years No particular
requirement
2000 Pounds
United States 2009 ( July) Consumption more than 13.1 L/100 km
Consumption less than 10.7 L/100 km
Up to 4500 US $
Appendix (5)
Examples of Implemented VSRP Worldwide [21]