e-Competence in Italy - cepis.org · e-Competence in Italy. ... While ICT provides crisis-resistant...
53
Analysing Gaps and Mismatches for a Stronger ICT Profession e-Competence in Italy
Transcript of e-Competence in Italy - cepis.org · e-Competence in Italy. ... While ICT provides crisis-resistant...
Analysing Gaps and Mismatches for a Stronger ICT Profession
e-Competence in Italy

About the Grand Coalition for Digital Jobs
The European Commission is leading a multi-stakeholder partnership to tackle the lack of digital skills in Europe and the thousands of unfilled ICT-related vacancies across all industry sectors.
The Secretariat of the Grand Coalition has been established to support the initiatives of the European Commission’s Grand Coalition for Digital Jobs.
Disclaimer
The outputs described in this report outline the up-take of the European e-Competence Framework (e-CF) powered tool ‘CEPIS e-Competence Benchmark’ developed by CEPIS.
The CEPIS e-Competence Benchmark has identified the e-competences of over 2,000 ICT professionals from 31 countries across greater Europe. The sample of respondents per profile and per country cannot be considered statistically representative and therefore the survey results analysed in the European report are to be considered as qualitative.
The results presented in this country report are based on the information provided by the research respondents in Italy. As a result of the popularity of the online tool, the data contained in the European report is based on an expanded data set compared to this country report. Therefore slight variances may appear between the data presented here and in the European report.
Legal Notice
Neither the European Commission nor any person acting on its behalf may be held responsible for the use to which infor-mation contained in this publication may be put, nor for any errors which may appear despite careful preparation and checking. The views and positions expressed are those of the authors and do not necessarily reflect those of the European Commission.
Reproduction is authorised, provided the source is acknowl-edged, save where otherwise stated.
Acknowledgements
This project was made possible by the participation of many hundreds of research respondents. We are par-ticularly grateful for the support and expertise of the CE-PIS Member Society in Italy, Associazione Italiana per l’Informatica ed il Calcolo Automatico (AICA).
Statement of Originality
This deliverable contains original unpublished work except where clearly indicated otherwise. Acknowledgement of pre-viously published material and of the work of others has been made through appropriate citation, quotation or both.
This report has been prepared by CEPIS in the framework of the European Commission funded DIGITALJOBS project, which established the Secretariat of the Grand Coalition, and received support from the Competitiveness and Innovation Programme (CIP).

Deliverable 4.3: Present national and European-level uptake of e-CF powered tool DIGITALJOBS
Table of Content
1 Introduction to the Deliverable and Scope ...................................................... 4
2 Context ............................................................................................................... 5
3 Introduction ....................................................................................................... 6
4 Methodology ...................................................................................................... 7
4.1 Personal Information ........................................................................................ 7 4.2 Competence Questionnaire ............................................................................. 7 4.3 Competence Questionnaire ............................................................................. 8 4.4 Proximity Profiles ............................................................................................. 9 4.5 Competence Proficiency Index ........................................................................ 9 4.6 Criteria for Inclusion and Country Level Analysis ............................................. 9 4.7 The European Benchmark ............................................................................. 10
5 Respondent Demographics ............................................................................ 11
5.1 Respondents by Age ...................................................................................... 11 5.2 Respondents by Gender ................................................................................ 11 5.3 Respondents by Education Level................................................................... 12 5.4 Respondents by Educational Field................................................................. 13 5.5 Respondents by Industry Sector .................................................................... 13 5.6 Respondents by Enterprise Size .................................................................... 14 5.7 Respondents by Professional Status ............................................................. 14 5.8 Respondents by Declared ICT Profile ............................................................ 15
6 Proximity Profiles and Competences ............................................................ 17
6.1 Respondents by Proximity Profile .................................................................. 17 6.2 Comparison between Professional Profile and Proximity Profile.................... 17 6.3 Analysis of Competence Proficiency Index .................................................... 20
7 Profiles Analysis.............................................................................................. 22
7.1 Chief Information Officer ................................................................................ 22 7.2 Business Information Manager ...................................................................... 23 7.3 Business Analyst............................................................................................ 24 7.4 Systems Architect .......................................................................................... 25 7.5 Developer ...................................................................................................... 26 7.6 Digital Media Specialist .................................................................................. 27 7.7 Account Manager ........................................................................................... 28 7.8 ICT Trainer ..................................................................................................... 29 7.9 Database Administrator ................................................................................. 30 7.10 Systems Administrator ............................................................................... 31 7.11 Network Specialist ...................................................................................... 32 7.12 Technical Specialists .................................................................................. 33 7.13 ICT Security Manager ................................................................................ 34 7.14 Project Manager ......................................................................................... 35
8 Conclusions ..................................................................................................... 37
9 Annex ............................................................................................................... 41
9.1 Proximity Profiles – Overview ........................................................................ 41 9.2 Proximity Profiles – Details ............................................................................ 45

Deliverable 4.3: Present national and European-level uptake of e-CF powered tool DIGITALJOBS
4
1 Introduction to the Deliverable and Scope
The outputs described in this deliverable outline the uptake of the European e-Competence Framework (e-CF) powered tool at national and European level. This deliverable is part of WP4 – Certification. The main objective of WP4 – Certification is to strengthen ICT professionalism, by promoting the e-CF in Europe.
This deliverable relates to WP4.3 which aims to:
Accelerate the adoption of the e-CF through the CEPIS e-Competence Benchmark Tool,
Allow ICT professionals/aspiring professionals to identify the competences they need/lack for various ICT roles (using the e-CF) enabling them to adapt to market demand and communicate competences across borders,
Work with partners to generate uptake of the e-CF at the national and EU level,
Raise awareness of the e-CF,
Promote and share the resulting data on usage to demonstrate the value of the e-CF.
This deliverable will be widely disseminated once approved among national and European stakeholders to show the real-world, practical application of the e-CF in action. It shows how ICT practitioners can identify the competences they need/lack for various ICT roles, enabling them to adapt to market labour demand and communicate their competences in a comparable manner across the EU.
Deliverable 4.3: Present national and European-level uptake of e-CF powered tool DIGITALJOBS
5
2 Context The increasing demand for ICT practitioners is hampered not only by the lack of new entrants into the profession, but also by the mismatches in the competences that practitioners have today. While ICT provides crisis-resistant employment, Europe currently is not producing the talent with the right skills to boost competitiveness. The ICT professional bodies and informatics societies that are the members of CEPIS recognise the need to reduce the gap between supply and demand and commit to taking action to redress the balance and promote ICT professionalism. Under the Grand Coalition for Digital Jobs, the European Commission has launched a series of practical initiatives to help fill the growing number of vacant ICT-related jobs across Europe, and to ensure that more people get the training needed to work in the digital economy. To support the roll-out of the Grand Coalition for Digital Jobs, DIGITALEUROPE has collaborated with partners such as ECDL Foundation, CEPIS and others to establish the Secretariat of the Grand Coalition. This deliverable is part of the WP4 within the strategy of the Secretariat of the Grand Coalition. The purpose of this deliverable is to present the national and European-level uptake of an e-CF powered tool, which is a free, online interactive tool for current and future ICT professionals to identify the competences they need for various ICT roles, enabling them to adapt to labour market demand. It will enable individuals and recruiters to map their competences against a range of profiles and better equip themselves for future roles and employment. It will allow companies to benchmark entire departments, identify workforce gaps and plan accordingly. It is powered by the European e-Competence Framework the common language for ICT competences created by the CEN workshop on ICT skills and therefore provides a standard upon which Europeans can better understand what is needed for their current and future IT roles based on the ICT Professional Profiles developed by CEN. Several national reports have been produced for each participating country which aggregate the information for that country and produce a snapshot of the ICT professional landscape. This report will provide information to support policy making, as well as update information for the training industry on market needs. The European level report brings together all of the data from throughout Europe and provide a basic for policy recommendations on future actions to support the ongoing development of the ICT profession.
Deliverable 4.3: Present national and European-level uptake of e-CF powered tool DIGITALJOBS
6
3 Introduction This report provides the Italian results of a European initiative designed to identify the digital competences held by ICT professionals across 31 countries in Europe and beyond. This report is based on the CEPIS e-Competence Benchmark an online, interactive tool that enables individuals and organisations to assess their competences against the European e-Competence Framework (e-CF)1. Using the results of the CEPIS e-Competence Benchmark, this report offers a unique view of the status of professional e-competence in Europe and shows the practical application and real-world usage of the e-CF. As experts predict that the demand for skilled ICT professionals will far outstrip supply, it is more important than ever to provide current and future professionals with the ability to compare their competences against those needed for typical ICT job profiles throughout Europe. This helps identify training and professional development opportunities to transition to new roles and even to start an ICT career. This work was carried out as part of the Grand Coalition for Digital Jobs, an EU-wide initiative to address the competence mismatches and fill vacancies of ICT practitioners to boost employment. The results gathered through this pan-European initiative provide an insight into the level of professional competences and a snapshot of the profession in each country. It also is a means to implement the e-CF, demonstrating to individuals and organisations how it can be of immediate and practical benefit. The ability to determine which competencies are underdeveloped on a national and European scale can assist policy makers as well as training providers with timely information for decision making. This, in turn, can facilitate the development of focused training courses to further educate the workforce so as to meet the needs of the labour market. The research has been conducted via an interactive, free, web-based tool that is powered solely by the European e-Competence Framework (e-CF) and the accompanying professional profiles. The e-CF has been developed by the CEN (European Committee for Standardization) Workshop on ICT Skills and is supported by the European Commission. This framework identifies 36 ICT competences which are all used in this tool along with the professional job profiles developed by CEN. This project has been led by the Council of European Professional Informatics Societies (CEPIS) and implemented in conjunction with CEPIS members. Special thanks to the Associazione Italiana per l'Informatica ed il Calcolo Automatico (AICA) who led the project in Italy and provided expert perspectives on the national ICT landscape.
1 For more information about the European e-Competence Framework see: http://www.ecompetences.eu/

Deliverable 4.3: Present national and European-level uptake of e-CF powered tool DIGITALJOBS
7
4 Methodology This initiative has been conducted in 31 countries in Europe and beyond using an interactive, web-based tool: the CEPIS e-Competence Benchmark. The European results are compiled based on over 2,000 responses provided by participants from these countries. It is important to note that the results presented here reflect the constituency of those who participated in the CEPIS e-Competence Benchmark. In some countries that may have implications for the general statistical significance of the data. The CEPIS e-Competence Benchmark has been completed by individual respondents who consider themselves to be ICT practitioners, or who will soon become one, and is divided into three sections as described below. It is fully compatible with and is based on the e-CF and associated professional profiles.
4.1 Personal Information
In the online tool, each respondent is invited to register and then enter personal information including education background, employment status, organisation size, and industry. They then select the ICT profile that matches their current role from the following 23 professional profiles, grouped into 6 families:2
BUSINESS MANAGEMENT
Chief Information Officer Business Information Manager ICT Operations Manager
DESIGN Business Analyst Systems Analyst Enterprise Architect Systems Architect
SUPPORT Account Manager ICT Trainer ICT Security Specialist ICT Consultant
DEVELOPMENT Developer Digital Media Specialist Test Specialist
SERVICE & OPERATIONS
Database Administrator Systems Administrator Network Specialist Technical Specialist Service Desk Agent3
TECHNICAL MANAGEMENT
Quality Assurance Manager ICT Security Manager Project Manager Service Manager
Figure 1.1 – ICT Professional Profiles
4.2 Competence Questionnaire
In this section of the assessment, the respondent completes the competence questionnaire, which consists of 36 competences. The questionnaire is divided in five areas of competences - Plan, Build, Run, Enable, Manage - that are derived from ICT business processes. For each competence, the level options available are: None, Knowledge, Experience, or Knowledge and Experience. Upon selecting ’Experience’ the respondent is asked to indicate their corresponding level of experience. Additional information, such as
2 For more information on the professional profiles : ftp://ftp.cen.eu/CEN/Sectors/List/ICT/CWAs/CWA%2016458.pdf 3 The profile of Service Desk Agent is excluded from the present analysis as the profile was sufficiently broad to encompass
most respondents, thus skewing the results.

Deliverable 4.3: Present national and European-level uptake of e-CF powered tool DIGITALJOBS
8
examples of the knowledge and skills associated with that competence, is also available to assist the respondent in choosing an appropriate level.
Figure 1.2 – Example of Competence Level and Experience Level
4.3 Competence Questionnaire
Upon completion of the questionnaire, the respondent is presented with personal results. These results are displayed on a graphical radar, split into 36 segments (one for each competence) as illustrated in Figure 1.3. The graphic will show which of the 23 ICT professional profiles best matches the respondent’s e-competences, regardless of the profile the respondent selected. The results are represented in a proximity index which gives an indication of how the respondent’s competences match the requirements of the specific job profile (see Figure 1.4). A high proximity index indicates that the respondent has the necessary competences for this role.
Figure 1.2 – Personal Results: the
‘Radar’
Figure 1.3 – Personal Results:
Proximity Index

Deliverable 4.3: Present national and European-level uptake of e-CF powered tool DIGITALJOBS
9
Moreover, the results also indicate the competences that the individual should seek to improve, as well as the competences that exceed the level required for the given profile. Each respondent can review their proximity to any other professional profile to assess their potential to move into a new role, and export the results into a report that may be printed.
4.4 Proximity Profiles
The Proximity Profile is used to identify and classify respondents into homogeneous groups in terms of specific skills (professional profile). The CEPIS e-Competence Benchmark uses the 23 professional profiles as defined by the CEN Workshop on ICT skills. Each profile is characterised by a specific set of competences (ranging from two to five competences) selected from the 36 competences identified and described in the e-CF. An algorithm produces a score, based on the knowledge and experience reported, for each of the 23 profiles. These scores are then compared with what is required for each profile and expressed as a percentage match. The highest score shows the profile(s) that is closest to the expertise of the respondent. This is referred to as the Proximity Profile. The level of proximity is shown as a percentage: a 100% proximity index means that the competence declared by the respondent completely satisfies the requirements for that profile.
4.5 Competence Proficiency Index
The Competence Proficiency Index (CPI) is used to measure the degree to which the competencies identified by the e-CF framework are represented in Europe today. On the basis of the respondents’ declaration of competence, a Competence Proficiency Index is computed for each of the 36 competence identified in the e-CF. This index, expressed as a percentage, represents the degree of proficiency for each competence with respect to the e-CF. So, a 100% Competence Proficiency Index means that the respondent declared to have relevant experience at each one of proposed levels of competence. The analysis of the Competence Proficiency Index of each competence can be useful to design detailed training paths to cover the competence gaps.
4.6 Criteria for Inclusion and Country Level Analysis
In order to ensure the integrity of the results, certain criteria for inclusion of the results were established at the level of the individual response as well as at the country level. The criteria for individual responses were established so as to exclude responses that are incomplete, or completed in a manner that is implausible. Implausible

Deliverable 4.3: Present national and European-level uptake of e-CF powered tool DIGITALJOBS
10
responses include those that for example have the highest level of knowledge and experience in all competences. Responses that do not comply with the established criteria have been excluded from the results. The data validation ensures that only results meeting the following criteria are included:
knowledge of 5 or more competences,
experience in no more than 31 competences,
Proximity Profile score(s) of at least 40%,
ex-aequo4 top score in 5 profiles or less.
With the high number of participating countries, it was necessary to decide upon the baseline criteria to ensure that the volume and the quality of responses were suitable for country level analysis. The following criteria were adopted to ensure the integrity of the country reports:
a competence profile is included when 10 or more valid questionnaires are completed. In other words a cluster of 10 respondents enables a professional profile to be analysed for that country,
a country profile can be generated where there are more than 50 valid assessments completed, and at least one competence profile has 10 or more valid assessments.
4.7 The European Benchmark
All country results are compared to the European benchmark, sometimes also referred to as European average. In order to avoid distortions due to a higher number of contributions from certain countries, the European benchmark has been computed as a weighted mean, taking into account an equal number of contributions from those countries which, although in varying degrees, have proved to be the major contributors.
4 Assessments which show the same proximity score for more than one profile are counted as many times as the same score
appears.

Deliverable 4.3: Present national and European-level uptake of e-CF powered tool DIGITALJOBS
11
5 Respondent Demographics
The research was launched across 31 countries in Europe and beyond. Over 2,000 current and future ICT practitioners participated in the research. This chapter provides an overview of the demographics of Italian respondents. Thanks to the Associazione Italiana per l'Informatica ed il Calcolo Automatico (AICA) 456 respondents were assessed using the CEPIS e-Competence Benchmark, which resulted in 14 professional profiles qualifying for analysis.
5.1 Respondents by Age
The Italian respondents represented a range of age groups as highlighted in Figure 2.15. The average age of respondents in Italy is around 42 years, which is the same age as the European average. As shown in Figure 2.1, the percentages of the under 30 segment and the over 50 segment are lower than the European average; while the 30-40 and 40-50 segments show a higher percentage than the European average. The Network Specialist is the youngest profile with an average of 35 years, while the Chief Information Officer profile is the oldest one (46 years).
17.3%16.0%
28.9%
32.5%
22.7%
33.1%
37.9%
11.6%
< 30 yr 30 - 40 yr 40 - 50 yr > 50 yr
Italy
Europe
Figure 2.1 – Respondents Distribution by Age
5.2 Respondents by Gender
The gender results show that there is still a large degree of gender imbalance in ICT; in fact, the comparative analysis in Figure 2.2 shows that Italy is lagging behind even the low European average in the sample. Women in Italy represent only 11% of ICT professionals, while the European average is 15%. Among all countries taking part in the research and eligible for analysis, Italy has one of the lowest rates of female presence in the sample. However, the gap (4%) between the Italian and the
5 Note: as ‘<20 yr’ and ‘>60 yr’ classes count for a low % of total assessments (respectively <1% and about 5%), they have
been grouped into the adjacent class. As a result, only four age classes are shown: ‘<30 yr’, ‘31-40 yr’, ‘41-40 yr’, and ‘>50 yr’.

Deliverable 4.3: Present national and European-level uptake of e-CF powered tool DIGITALJOBS
12
European average has decreased by 4% since the previous CEPIS research carried in 20116. A higher representation of female ICT professionals is found among Business Information Manager (20%), Systems Administrators (15%) and Project Managers (14%). There were no female respondents at all for the ICT Security Manager and Network Specialist profiles.
5.3 Respondents by Education Level
The respondents were asked to select the highest level of education that they had achieved. The majority of the respondents in Italy (79%) have at least a degree level qualification, showing the importance of third level qualifications in gaining employment in this sector. Results of this sample also show that the Italian rate of 79% is the second lowest among European countries, which average is 86%. Moreover, only 26% of Italian ICT professionals obtained a fourth level qualification (master’s degree or doctorate), which is the lowest rate in Europe and significantly lower than the European average of 40%. This is mainly due to the fact that ICT part-time jobs are frequently offered to undergraduates and to bachelor students, who decide to suspend their studies for a full-time employment. Only 15% of the students obtaining a bachelor degree apply for a master.
5,9%
26,8%
20,2%
0,7%
4,6%
35,5%
29,6%
4,4%
11,6%12,8%
1,5%3,5%
20,8%22,1%
Doctorate Masters
Degree
Bachelors
Degree
Postgraduate
Diploma
Graduate
Diploma
Secondary
School
Diploma
None of the
above
ItalyEurope
Figure 2.3 – Respondents Distribution by Education Level
6 See ‘CEPIS Survey of Professional e-Competence in Europe - Italy Report’, available at: http://www.cepis.org/media/CEPISProfeCompetenceItaly_Report1.pdf
89%
85%
11%
15%
Italy
Europe
Female
Male
Figure 2.2 – Respondents Distribution by Gender
Deliverable 4.3: Present national and European-level uptake of e-CF powered tool DIGITALJOBS
13
There are three ICT profiles for which the level of education is lower than the general Italian average: Developer (61% graduated), Database Administrator, and Systems Administrator (both at 68%). A different situation appears for the profiles of Business Information Manager, Business Analyst, ICT Security Manager, Project Manager, and Account Manager for which at least 90% of respondents have a high level qualification. This is significantly higher than the Italian average (79%) but in line with the European average. It is worth mentioning that Business Information Manager (60%) Chief Information Officer (53%) and Account Manager (50%) show a high rate of master’s/doctorate degrees, almost double than the Italian average (26%), since these positions are usually offered to highly competent and trained people.
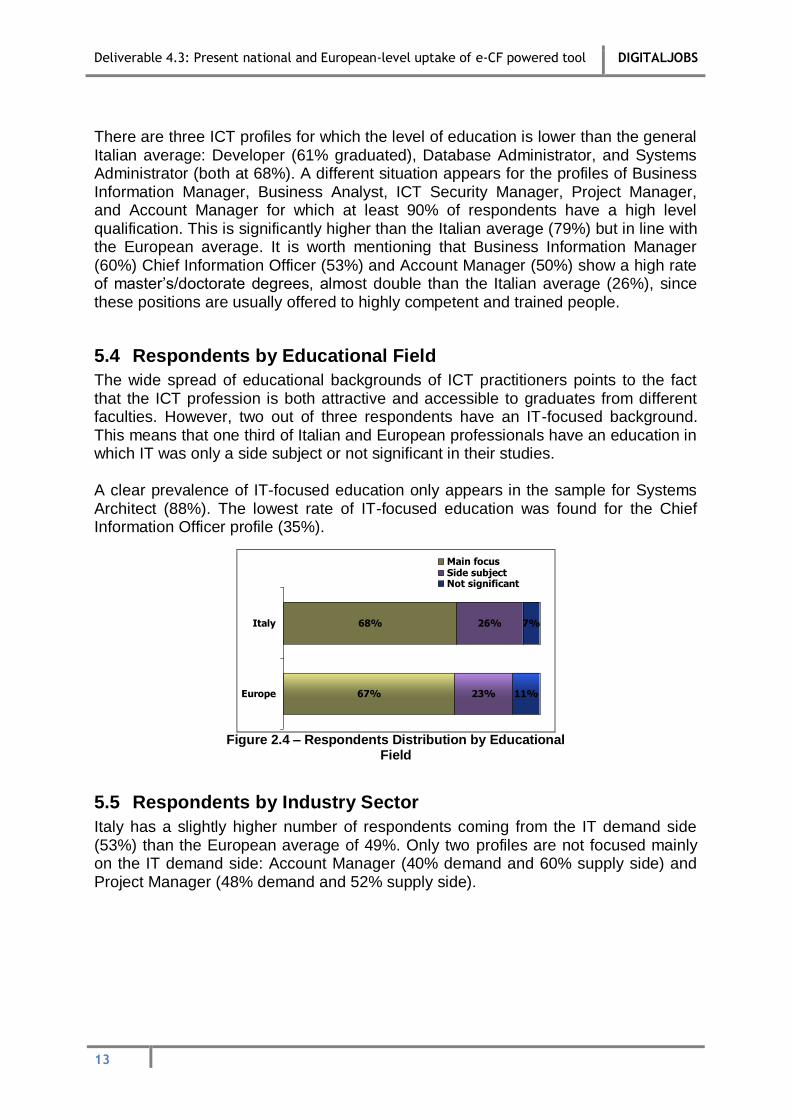
5.4 Respondents by Educational Field
The wide spread of educational backgrounds of ICT practitioners points to the fact that the ICT profession is both attractive and accessible to graduates from different faculties. However, two out of three respondents have an IT-focused background. This means that one third of Italian and European professionals have an education in which IT was only a side subject or not significant in their studies. A clear prevalence of IT-focused education only appears in the sample for Systems Architect (88%). The lowest rate of IT-focused education was found for the Chief Information Officer profile (35%).
5.5 Respondents by Industry Sector
Italy has a slightly higher number of respondents coming from the IT demand side (53%) than the European average of 49%. Only two profiles are not focused mainly on the IT demand side: Account Manager (40% demand and 60% supply side) and Project Manager (48% demand and 52% supply side).
26%
23%
7%
11%67%
68%Italy
Europe
Main focusSide subjectNot significant
Figure 2.4 – Respondents Distribution by Educational
Field

Deliverable 4.3: Present national and European-level uptake of e-CF powered tool DIGITALJOBS
14
Figure 2.5 – Respondents Distribution by Industry Sector
5.6 Respondents by Enterprise Size
The distribution of respondents by organization size shows a preference for smaller enterprises. The rate of respondents in micro or small enterprises is 30% in the sample, while it is 31% in larger companies. The European average shows the opposite situation: 24% of respondents work in micro/small enterprises and 36% work in large organisations with more than 1,000 employees. This finding is not unusual due to the larger number of SMEs in Italy compared with other European countries. A number of profiles are more prevalent in micro organisations (1-10 employees), these include: Systems Architects (42%), Network Specialists (37%), and Account Manager (33%). On the other hand, Business Information Managers (56%), Systems Administrators (44%), Project Managers (44%), Developers (41%), and Digital Media Specialists (37%) are more concentrated in the largest organisations.
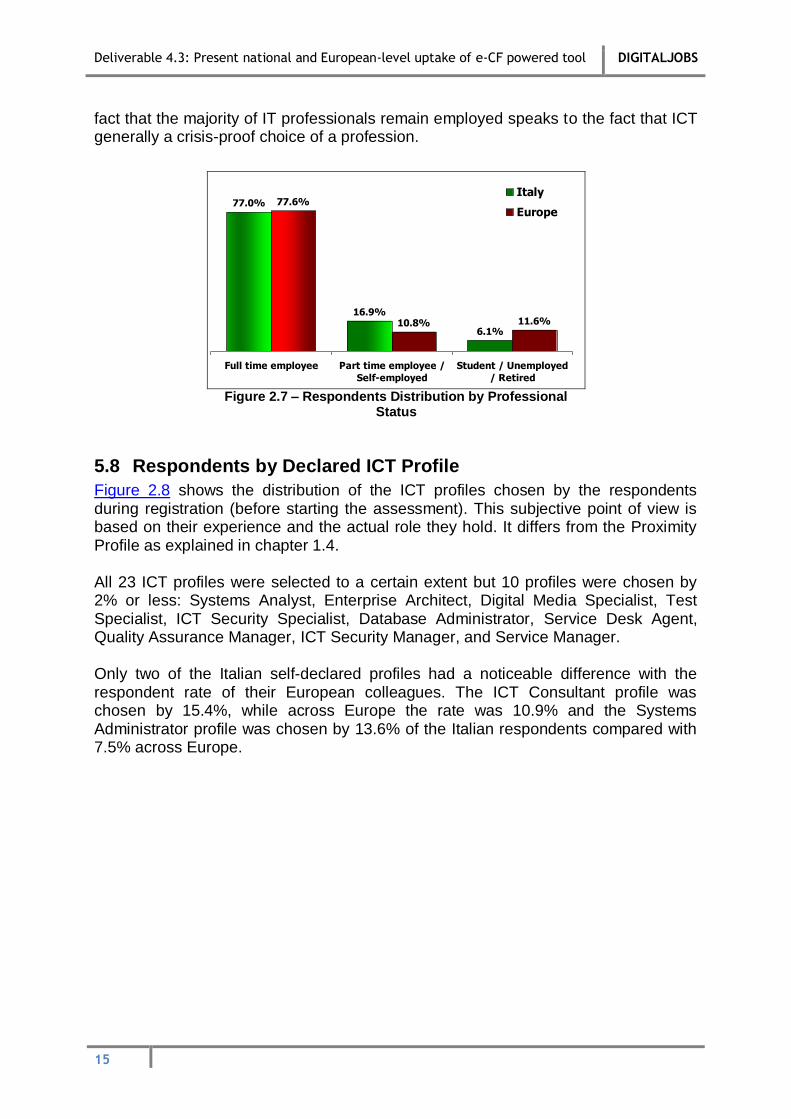
5.7 Respondents by Professional Status
The majority of Italian respondents hold full-time positions7 (77%), which is close to the European average of 78%. However there are noticeable features concerning some ICT profiles. For example, 21% of Italian Systems Architects are unemployed and the self-employed rate is much higher than the Italian average (14%) for Account Manager (40%), Database Administrator (32%) and Network Specialist (29%). The
7 Note: as ‘Full time employee’ choice counts 80% of total assessments, the other items were grouped as follow: ‘Part time
employee / Self-employed’ and ‘Student / Unemployed / Retired’.
17.2%
31.4%
11.2%13.0%
22.0%
17.8%
36.0%
14.1%
21.1%
16.2%
1 - 10 11 - 50 51 - 250 251 - 1000 > 1000
Italy
Europe
Figure 2.6 – Respondents Distribution by Enterprise Size
47%
51%
53%
49%
Italy
Europe
IT demand side IT supply side
y
Deliverable 4.3: Present national and European-level uptake of e-CF powered tool DIGITALJOBS
15
fact that the majority of IT professionals remain employed speaks to the fact that ICT generally a crisis-proof choice of a profession.
5.8 Respondents by Declared ICT Profile
Figure 2.8 shows the distribution of the ICT profiles chosen by the respondents during registration (before starting the assessment). This subjective point of view is based on their experience and the actual role they hold. It differs from the Proximity Profile as explained in chapter 1.4. All 23 ICT profiles were selected to a certain extent but 10 profiles were chosen by 2% or less: Systems Analyst, Enterprise Architect, Digital Media Specialist, Test Specialist, ICT Security Specialist, Database Administrator, Service Desk Agent, Quality Assurance Manager, ICT Security Manager, and Service Manager. Only two of the Italian self-declared profiles had a noticeable difference with the respondent rate of their European colleagues. The ICT Consultant profile was chosen by 15.4%, while across Europe the rate was 10.9% and the Systems Administrator profile was chosen by 13.6% of the Italian respondents compared with 7.5% across Europe.
11.6%
77.0%
6.1%
16.9%10.8%
77.6%
Full time employee Part time employee /
Self-employed
Student / Unemployed
/ Retired
Italy
Europe
Figure 2.7 – Respondents Distribution by Professional
Status

Deliverable 4.3: Present national and European-level uptake of e-CF powered tool DIGITALJOBS
16
7.7%
2.6%
3.5%
4.4%
1.5%
2.0%
2.9%
8.1%
1.1%
0.4%
3.5%
5.3%
1.1%
15.4%
1.1%
13.6%
2.6%
6.4%
0.4%
0.9%
1.1%
13.6%
0.9%
7.1%
3.2%
3.9%
4.3%
2.3%
3.2%
3.9%
11.2%
1.2%
2.7%
3.3%
3.7%
2.5%
10.9%
0.5%
7.5%
2.1%
6.9%
0.8%
1.7%
1.2%
13.6%
2.4%
Chief Information Officer BM1
Business Information Manager BM2
ICT Operations Manager BM3
Business Analyst DS1
Systems Analyst DS2
Enterprise Architect DS3
Systems Architect DS4
Developer DV1
Digital Media Specialist DV2
Test Specialist DV3
Account Manager SP1
ICT Trainer SP2
ICT Security Specialist SP3
ICT Consultant SP4
Database Administrator SR1
Systems Administrator SR2
Network Specialist SR3
Technical Specialist SR4
Service Desk Agent SR5
Quality Assurance Manager TM1
ICT Security Manager TM2
Project Manager TM3
Service Manager TM4
ItalyEurope
Figure 2.8 – Respondents Distribution by ICT Profile
Deliverable 4.3: Present national and European-level uptake of e-CF powered tool DIGITALJOBS
17
6 Proximity Profiles and Competences
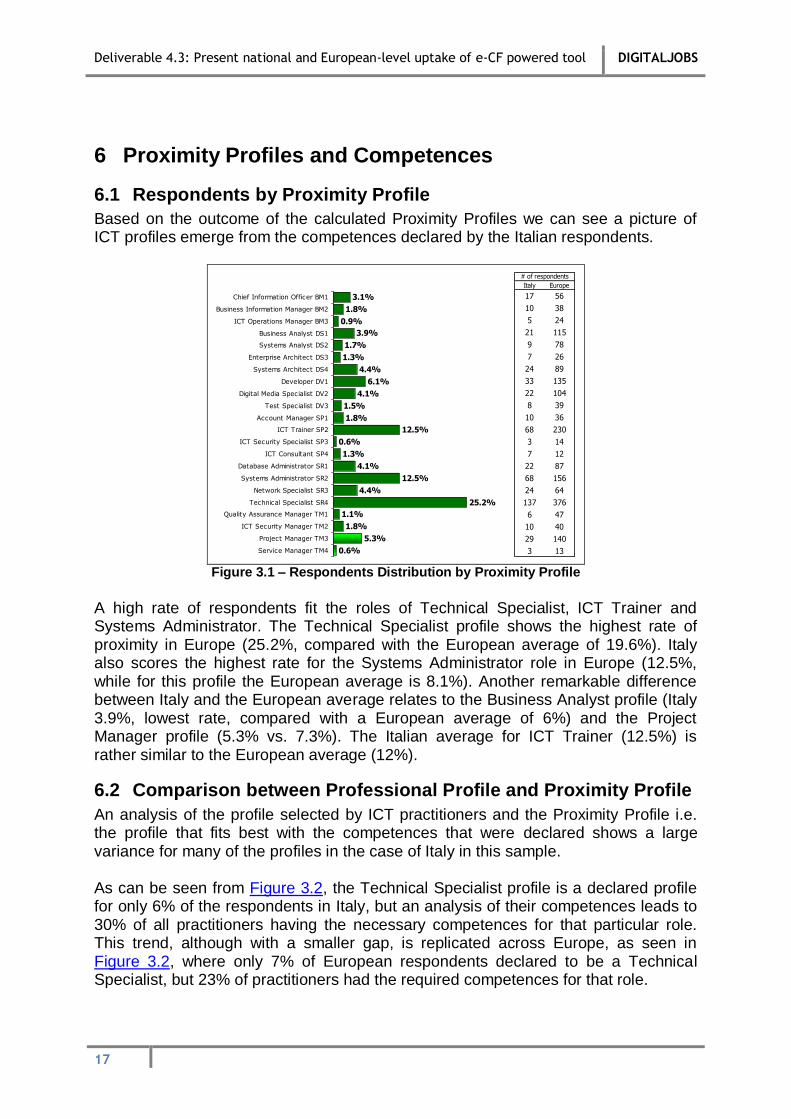
6.1 Respondents by Proximity Profile
Based on the outcome of the calculated Proximity Profiles we can see a picture of ICT profiles emerge from the competences declared by the Italian respondents.
Italy Europe
17 56
10 38
5 24
21 115
9 78
7 26
24 89
33 135
22 104
8 39
10 36
68 230
3 14
7 12
22 87
68 156
24 64
137 376
6 47
10 40
29 140
3 13
# of respondents
3.1%
1.8%
0.9%
3.9%
1.7%
1.3%
4.4%
6.1%
4.1%
1.5%
1.8%
12.5%
0.6%
1.3%
4.1%
12.5%
4.4%
25.2%
1.1%
1.8%
5.3%
0.6%
Chief Information Officer BM1
Business Information Manager BM2
ICT Operations Manager BM3
Business Analyst DS1
Systems Analyst DS2
Enterprise Architect DS3
Systems Architect DS4
Developer DV1
Digital Media Specialist DV2
Test Specialist DV3
Account Manager SP1
ICT Trainer SP2
ICT Security Specialist SP3
ICT Consultant SP4
Database Administrator SR1
Systems Administrator SR2
Network Specialist SR3
Technical Specialist SR4
Quality Assurance Manager TM1
ICT Security Manager TM2
Project Manager TM3
Service Manager TM4
Figure 3.1 – Respondents Distribution by Proximity Profile
A high rate of respondents fit the roles of Technical Specialist, ICT Trainer and Systems Administrator. The Technical Specialist profile shows the highest rate of proximity in Europe (25.2%, compared with the European average of 19.6%). Italy also scores the highest rate for the Systems Administrator role in Europe (12.5%, while for this profile the European average is 8.1%). Another remarkable difference between Italy and the European average relates to the Business Analyst profile (Italy 3.9%, lowest rate, compared with a European average of 6%) and the Project Manager profile (5.3% vs. 7.3%). The Italian average for ICT Trainer (12.5%) is rather similar to the European average (12%).
6.2 Comparison between Professional Profile and Proximity Profile
An analysis of the profile selected by ICT practitioners and the Proximity Profile i.e. the profile that fits best with the competences that were declared shows a large variance for many of the profiles in the case of Italy in this sample. As can be seen from Figure 3.2, the Technical Specialist profile is a declared profile for only 6% of the respondents in Italy, but an analysis of their competences leads to 30% of all practitioners having the necessary competences for that particular role. This trend, although with a smaller gap, is replicated across Europe, as seen in Figure 3.2, where only 7% of European respondents declared to be a Technical Specialist, but 23% of practitioners had the required competences for that role.

Deliverable 4.3: Present national and European-level uptake of e-CF powered tool DIGITALJOBS
18
6%
7%
30%
23%
Italy
Europe
Declared profile
Calculated profileTechnical Specialist
Figure 3.2 – Technical Specialist: Declared and Calculated Profile
5%
4%
15%
14%
Italy
Europe
Declared profile
Calculated profileICT Trainer
Figure 3.3 – ICT Trainer: Declared and
Calculated Profile
In Italy, this case is also noticeable with ICT Trainers. Only 5% of the Italian respondents in the sample declared this as their profile, but 15% of all respondents actually hold the necessary competence for that role. This trend is replicated across Europe, as seen in Figure 3.3, where only 4% of European respondents declared to be ICT Trainers, but 14% of all practitioners held the required competences. Again, for the Digital Media Specialist profile, the results show that only 1% declared the profile, but 5% were seen to have the competences associated with it after their evaluation. As Figure 3.4 reveals, the same situation appears across Europe: only 1% declare to be Digital Media Specialists, but 7% of all respondents have the competences for the role. A different situation appears for the ICT Consultant profile: 15% of Italian ICT practitioners declare to be an ICT Consultant, but only 2% have the required competences. The same trend is observed at European level: 11% claim to be ICT Consultants, but only 1% have the appropriate competences (see Figure 3.5).
1%
1%
5%
7%
Italy
Europe
Declared profile
Calculated profileDigital Media Specialist
Figure 6.4 – Digital Media Specialist: Declared and Calculated Profile
15%
11%
2%
1%
Italy
Europe
Declared profile
Calculated profileICT Consultant
Figure 6.5 – ICT Consultant: Declared and
Calculated Profile
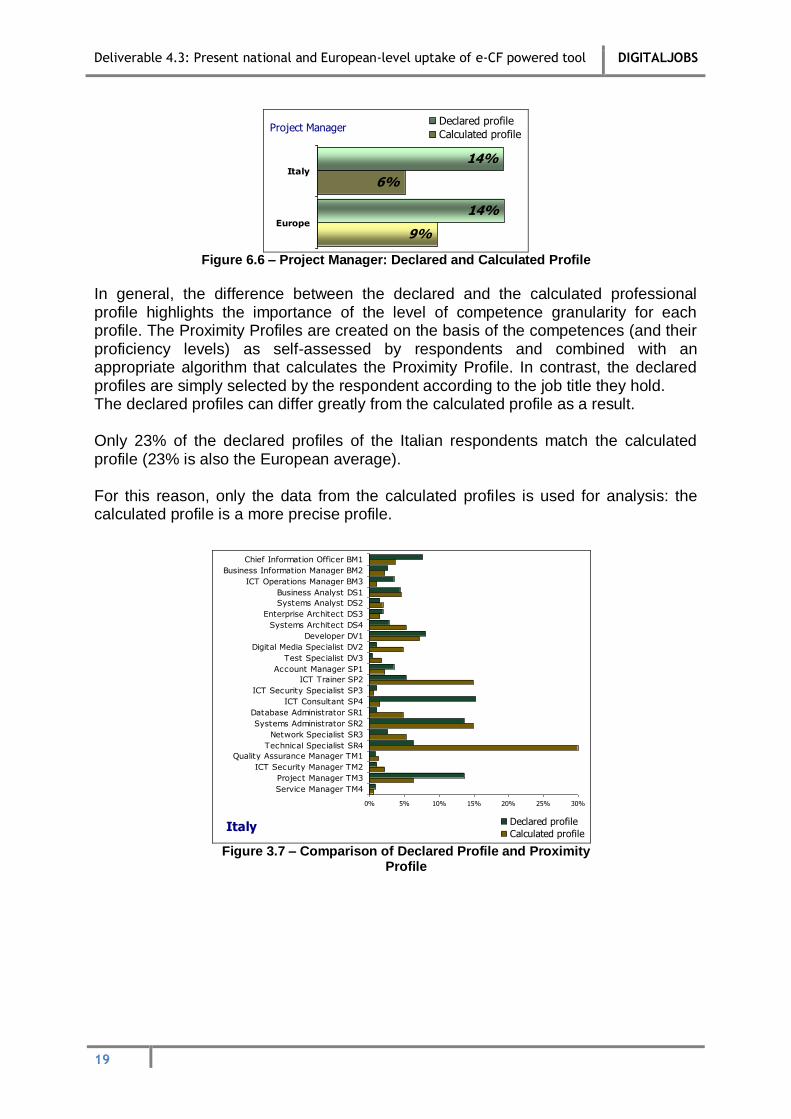
Similarly, the Project Manager profile shows a variance between the declared and the calculated profile. A substantial rate of Italians (14%) declared to be in this role, but less than a half (6%) actually has the required competence to perform it. A similar, if slightly smaller gap is found at the European level. In fact, compared with a self-declaration of 14% of assessments, only 9% of European respondents have the suitable competence for the Project Manager role (see Figure 3.6).
Deliverable 4.3: Present national and European-level uptake of e-CF powered tool DIGITALJOBS
19
14%
14%
6%
9%
Italy
Europe
Declared profile
Calculated profileProject Manager
Figure 6.6 – Project Manager: Declared and Calculated Profile
In general, the difference between the declared and the calculated professional profile highlights the importance of the level of competence granularity for each profile. The Proximity Profiles are created on the basis of the competences (and their proficiency levels) as self-assessed by respondents and combined with an appropriate algorithm that calculates the Proximity Profile. In contrast, the declared profiles are simply selected by the respondent according to the job title they hold. The declared profiles can differ greatly from the calculated profile as a result. Only 23% of the declared profiles of the Italian respondents match the calculated profile (23% is also the European average). For this reason, only the data from the calculated profiles is used for analysis: the calculated profile is a more precise profile.
0% 5% 10% 15% 20% 25% 30%
Chief Information Officer BM1
Business Information Manager BM2
ICT Operations Manager BM3
Business Analyst DS1
Systems Analyst DS2
Enterprise Architect DS3
Systems Architect DS4
Developer DV1
Digital Media Specialist DV2
Test Specialist DV3
Account Manager SP1
ICT Trainer SP2
ICT Security Specialist SP3
ICT Consultant SP4
Database Administrator SR1
Systems Administrator SR2
Network Specialist SR3
Technical Specialist SR4
Quality Assurance Manager TM1
ICT Security Manager TM2
Project Manager TM3
Service Manager TM4
Declared profile
Calculated profileItaly
Figure 3.7 – Comparison of Declared Profile and Proximity
Profile

Deliverable 4.3: Present national and European-level uptake of e-CF powered tool DIGITALJOBS
20
0% 5% 10% 15% 20% 25% 30%
Chief Information Officer BM1
Business Information Manager BM2
ICT Operations Manager BM3
Business Analyst DS1
Systems Analyst DS2
Enterprise Architect DS3
Systems Architect DS4
Developer DV1
Digital Media Specialist DV2
Test Specialist DV3
Account Manager SP1
ICT Trainer SP2
ICT Security Specialist SP3
ICT Consultant SP4
Database Administrator SR1
Systems Administrator SR2
Network Specialist SR3
Technical Specialist SR4
Quality Assurance Manager TM1
ICT Security Manager TM2
Project Manager TM3
Service Manager TM4
Declared profile
Calculated profileEurope
Figure 6.8 – Comparison of Declared Profile and Proximity Profile
6.3 Analysis of Competence Proficiency Index
Figure 3.9 below provides a comparison of the Italian and European averages of the Competence Proficiency Index (CPI) for the five competence areas: Plan, Build, Run, Enable, and Manage.
0%
5%
10%
15%
20%
25%
30%
35%
Plan (A)
Build (B)
Run (C) Enable (D)
Manage (E)
Italy
Europe
Competence Proficiency Index
Figure 3.9 – Competence Proficiency Index by Competence Areas
In Italy, it appears that the Competence Proficiency Index is higher in this sample than the equivalent for Europe in the Build and Manage areas and lower for the others. The full value of each CPI is 100%. More relevant differences, compared with the European average, appear to be in the Run area (33.4% vs. 29.4%) and in the Manage area (14.6% vs. 17.9%). However, it appears that the Enable and Manage Areas are the weakest, both for Italy and Europe. The profiles that have the highest CPI in the Plan area are Chief Information Officer and Business Analyst; in the Build area the highest CPI is
Deliverable 4.3: Present national and European-level uptake of e-CF powered tool DIGITALJOBS
21
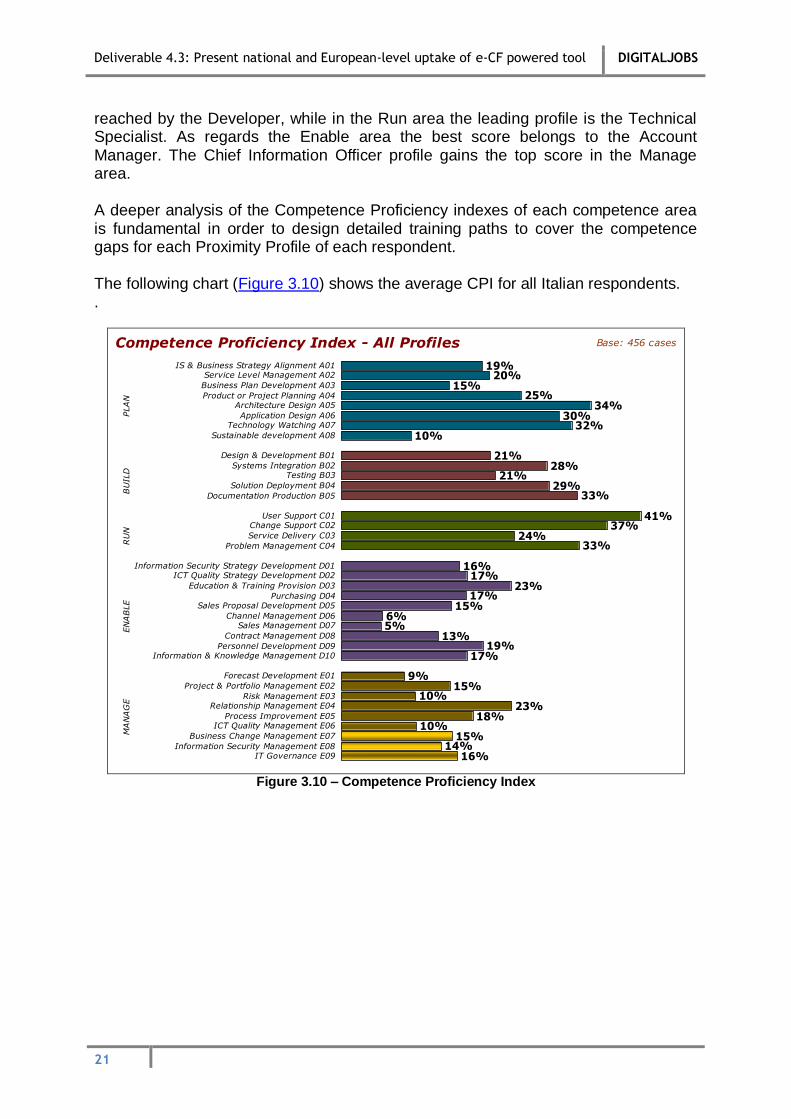
reached by the Developer, while in the Run area the leading profile is the Technical Specialist. As regards the Enable area the best score belongs to the Account Manager. The Chief Information Officer profile gains the top score in the Manage area. A deeper analysis of the Competence Proficiency indexes of each competence area is fundamental in order to design detailed training paths to cover the competence gaps for each Proximity Profile of each respondent. The following chart (Figure 3.10) shows the average CPI for all Italian respondents. .
19%20%
15%25%
34%30%
32%10%
21%28%
21%29%
33%
41%37%
24%33%
16%17%
23%17%
15%6%5%
13%19%
17%
9%15%
10%23%
18%10%
15%14%
16%
IS & Business Strategy Alignment A01Service Level Management A02
Business Plan Development A03
Product or Project Planning A04Architecture Design A05
Application Design A06Technology Watching A07
Sustainable development A08
Design & Development B01
Systems Integration B02Testing B03
Solution Deployment B04
Documentation Production B05
User Support C01Change Support C02
Service Delivery C03
Problem Management C04
Information Security Strategy Development D01ICT Quality Strategy Development D02
Education & Training Provision D03
Purchasing D04Sales Proposal Development D05
Channel Management D06Sales Management D07
Contract Management D08
Personnel Development D09Information & Knowledge Management D10
Forecast Development E01
Project & Portfolio Management E02
Risk Management E03Relationship Management E04
Process Improvement E05ICT Quality Management E06
Business Change Management E07
Information Security Management E08IT Governance E09
PLA
NB
UIL
DR
UN
EN
AB
LE
MA
NA
GE
Base: 456 casesCompetence Proficiency Index - All Profiles
Figure 3.10 – Competence Proficiency Index

Deliverable 4.3: Present national and European-level uptake of e-CF powered tool DIGITALJOBS
22
7 Profiles Analysis The answers collected generated 543 Proximity Profiles in relation to 22 ICT professional profiles (Figure 3.1). The eligibility criteria for the analysis of these profiles were the following:
10 or more cases per country for each profile,
a Proximity Profile score higher than 40%. Following this criteria the following 14 profiles for Italy were selected and analysed:
1. Chief Information Officer 2. Business Information Manager 3. Business Analyst 4. Systems Architect 5. Developer 6. Digital Media Specialist 7. Account Manager 8. ICT Trainer 9. Database Administrator
10. Systems Administrator 11. Network Specialist 12. Technical Specialist 13. ICT Security Manager 14. Project Manager
A deeper analysis of the data for each of these 14 profiles is presented in this chapter.
7.1 Chief Information Officer
0%
5%
10%
15%
20%
25%
30%
35%
40%
45%
50%
Plan
Build
Run Enable
Manage
ItalyEurope
Chief Information Officer
Figure 7.1 – Competence Proficiency Index – Chief Information Officer
88% of Italian Chief Information Officers in the sample have obtained a university degree or higher, which is lower than the European average of 93%. Moreover, 53% of Italian Chief Information Officers have obtained a fourth level qualification (master’s degree or PhD), which is clearly lower than the European education level
Deliverable 4.3: Present national and European-level uptake of e-CF powered tool DIGITALJOBS
23
average of 63%. A noticeable proportion (65%) of Italian Chief Information Officers comes from an educational background where IT was either a side subject or not significant in the curriculum. In Italy, only 35% of Chief Information Officers have an IT-focused background; this is the lowest rate among Italian ICT professionals (68% is the Italian average). However, this rate is not too far from the 47% of their European colleagues.
A large majority of Chief Information Officers who responded were male (88%), similar to the general Italian average of male respondents (89%) and to the average rate of male CIO colleagues in Europe (88%). The Italian Chief Information Officer is 46 years old on average, the oldest among Italian colleagues in this sample, but younger than other European CIOs, who are 48 years old on average.
Italian Chief Information Officers show a similar pattern of Competence Proficiency Index to the European average for this profile. However, the Italian CIO obtains a slightly higher score, even if there is no difference in the Manage area (42%). In the other four areas, the differences of the CPI are: 49% vs. 43% in the Plan area, 19% vs. 14% in the Build area, 24% vs. 20% in the Run area, and 33% vs. 27% in the Enable area. For Italian Chief Information Officers the best CPIs are found for Architecture Design (63%), Relationship Management (63%), IT Governance (63%), and IS & Business Strategy Alignment (61%). The widest competence gap with European colleagues exists in Information Security Management with -14% (21% for Italy compared to 35% for Europe), while better results appear in Architecture Design (+20% higher competences comparing to the European average) and Application Design (+21%).
7.2 Business Information Manager
0%
10%
20%
30%
40%
50%
60%
Plan
Build
Run Enable
Manage
ItalyEurope
Business Information Manager
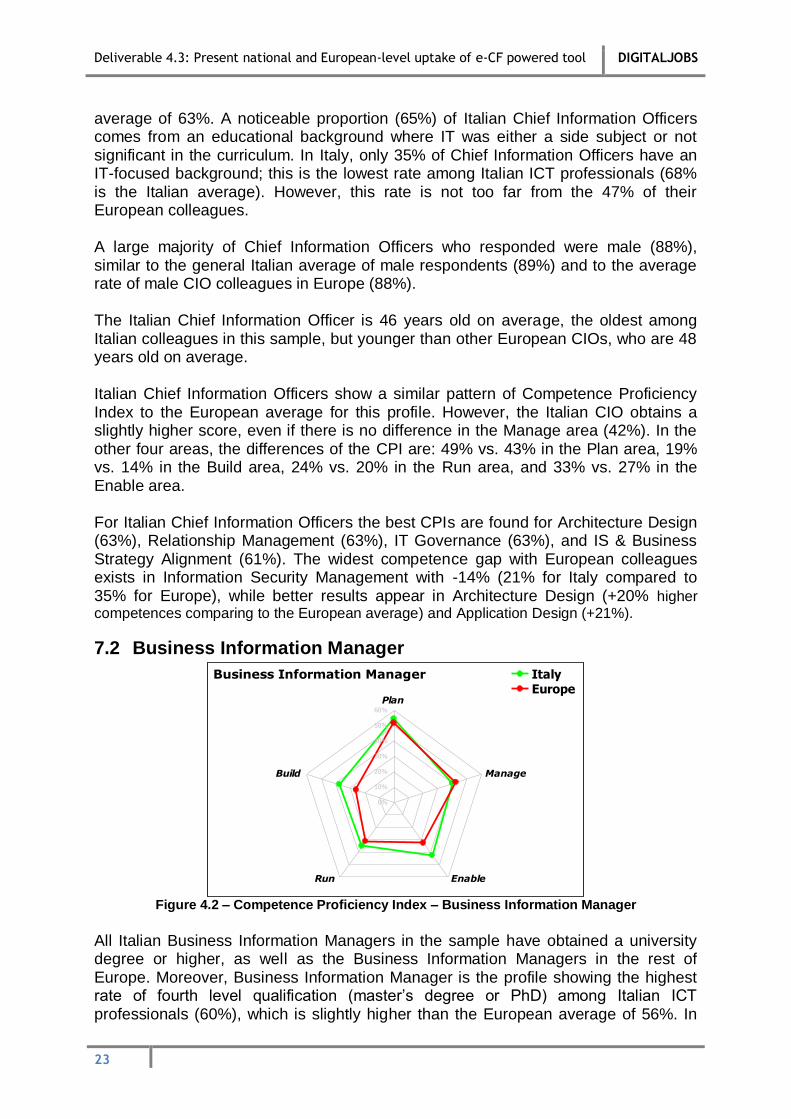
Figure 4.2 – Competence Proficiency Index – Business Information Manager
All Italian Business Information Managers in the sample have obtained a university degree or higher, as well as the Business Information Managers in the rest of Europe. Moreover, Business Information Manager is the profile showing the highest rate of fourth level qualification (master’s degree or PhD) among Italian ICT professionals (60%), which is slightly higher than the European average of 56%. In
Deliverable 4.3: Present national and European-level uptake of e-CF powered tool DIGITALJOBS
24
Italy, 50% of Business Information Managers have an IT-focused background, which is lower than the domestic rate of 68%, but in line with the 48% of all Business Information Managers in Europe. As mentioned before, this is one of the positions usually offered to highly competent and trained people. The Business Information Manager is not a young ICT professional in Italy. The average age is 44 years and therefore about 2 years younger than the European average. The majority of the Business Information Managers who responded were male, but this profile shows the highest rate of female ICT professionals (20%) among the Italian ICT profiles in this sample. This is higher than the European average of 15% for this profile. National experts say this is due to the fact that professionals for this position frequently come from non-ICT study degrees (e.g., management, engineering, or economy) where females are present in larger percentages. Italian Business Information Managers show a better Competence Proficiency Index than the European average for this profile in four out of five areas: Plan area (54% vs. 52%), Build area (37% vs. 26%), Run area (35% vs. 31%), and Enable area (43% vs. 33%). In the Manage area, the CPI results are slightly lower: 40% vs. 42%. For Italian Business Information Managers, the best CPI can be found in Application Design (77%), Product or Project Planning (74%), Information & Knowledge Management (74%), and IS & Business Strategy Alignment (72%). Comparing his/her results to the European average, it reveals some major differences: widest gaps are found for Application Design (+30%), Systems Integration (+29%), ICT Quality Strategy Development (+26%), and Forecast Development (+23%). On the other hand, negative gaps can be found in Information Security Management (-17%), Risk Management (-18%) and Technology Watching (-21%).
7.3 Business Analyst
0%
5%
10%
15%
20%
25%
30%
35%
40%
45%
50%
Plan
Build
Run Enable
Manage
ItalyEurope
Business Analyst
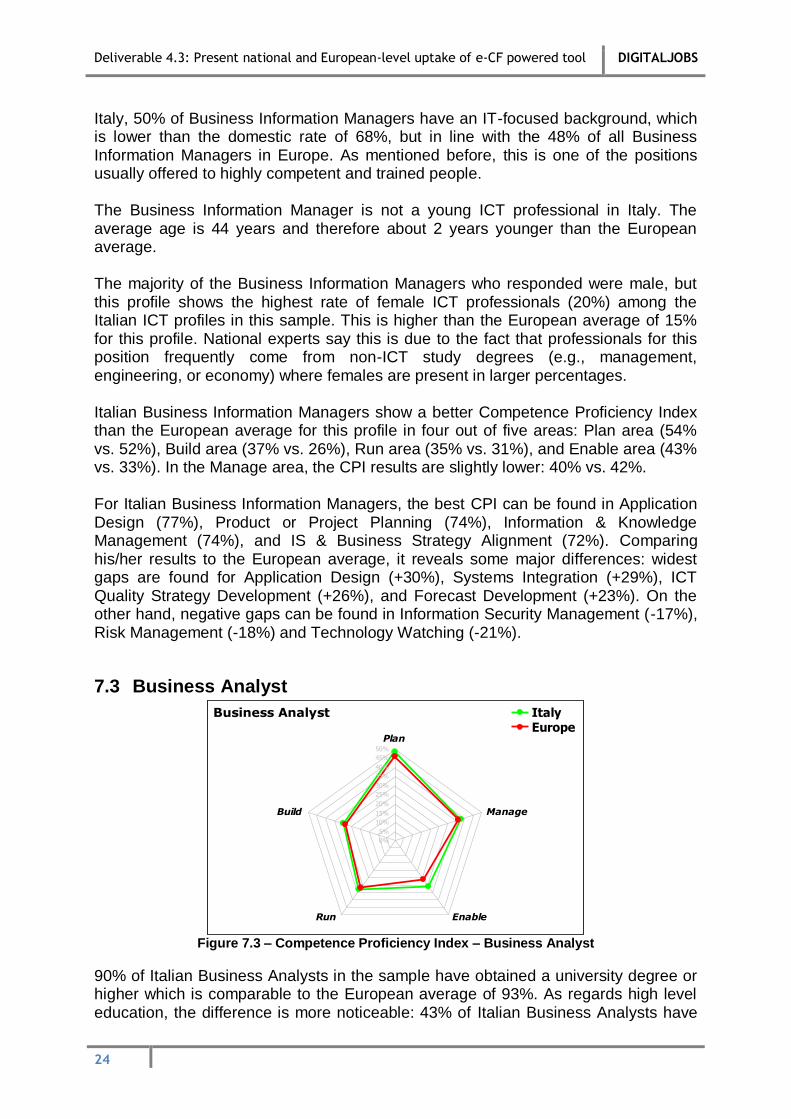
Figure 7.3 – Competence Proficiency Index – Business Analyst
90% of Italian Business Analysts in the sample have obtained a university degree or higher which is comparable to the European average of 93%. As regards high level education, the difference is more noticeable: 43% of Italian Business Analysts have
Deliverable 4.3: Present national and European-level uptake of e-CF powered tool DIGITALJOBS
25
obtained a fourth level qualification (master’s degree or PhD), while the European average is 60%. In Italy, 52% of Business Analysts have an IT-focused background; this is lower than the general average of 68% of all Italian respondents and remains low if compared to the 61% of European Business Analysts. The vast majority the Business Analysts who responded were male (95%), which is slightly higher than the 89% male proportion for all Italian respondents and even higher compared to the 87% European average in that role. The Italian Business Analyst is 44 years old on average and therefore only a few months older than their European colleagues in this sample.
Italian Business Analysts show a higher Competence Proficiency Index than the European average for this profile in three areas. The gap ranges from +4.8 percentage points in the Enable area to +1.5 in the Build and Run area. The CPIs observed for Italian Business Analysts and their European equivalent are: 48% vs. 46% in the Plan area, 30% vs. 28% in the Build area, 33% vs. 31% in the Run area, 31% vs. 26% in the Enable area, and 38% vs. 36% in the Manage area. Italian Business Analysts reach their highest CPIs in IS & Business Strategy Alignment (69%), Process Improvement (63%), and Application Design (56%).
In comparison with the European average, the CPI for the Italian Business Analyst profile shows a higher score especially in Application Design (+20%), Purchasing (+13%), and Contract Management (+12%), while Process Improvement (-11%) represents the biggest gap.
7.4 Systems Architect
0%
5%
10%
15%
20%
25%
30%
35%
40%
45%
Plan
Build
Run Enable
Manage
ItalyEurope
Systems Architect
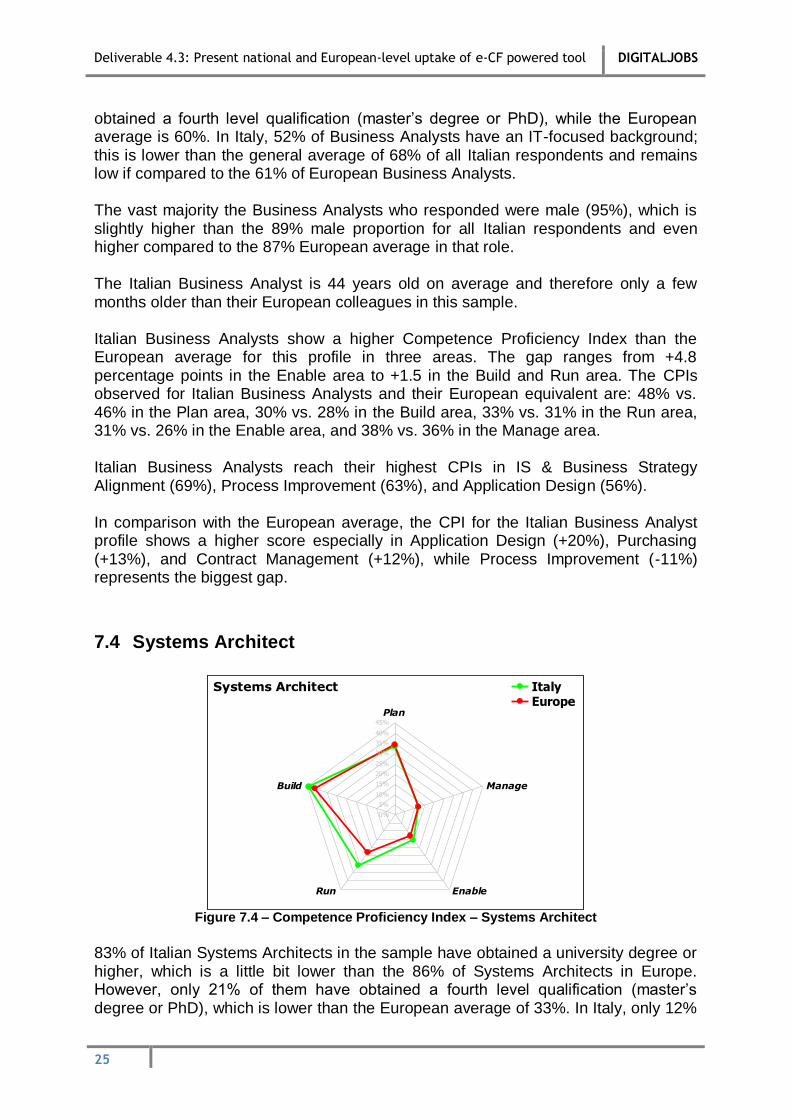
Figure 7.4 – Competence Proficiency Index – Systems Architect
83% of Italian Systems Architects in the sample have obtained a university degree or higher, which is a little bit lower than the 86% of Systems Architects in Europe. However, only 21% of them have obtained a fourth level qualification (master’s degree or PhD), which is lower than the European average of 33%. In Italy, only 12%
Deliverable 4.3: Present national and European-level uptake of e-CF powered tool DIGITALJOBS
26
of Systems Architects have an educational background where IT was not the main focus which is much lower than the 32% of all Italian respondents, but significantly lower than the 21% of all European Systems Architects. The Italian Systems Architect is 45 years old on average and 4 years older than his/her European colleagues, who are 41 years old on average. Almost all of the Systems Architects who responded were male (96%), which means that this profile has even greater male presence than the general average for all profiles in Italy in this sample, but is comparable to the European average of 94% for all European Systems Architects. Italian Systems Architects show a better Competence Proficiency Index compared to the European average for this profile in four areas. A relevant difference (+7.7%) is present in the Run area (30.4% vs. 22.7%), while the CPI in the other areas shows a smaller gap (Plan area: 33% vs. 34%, Build area: 44% vs. 41%, Enable area: 15% vs. 13%, and Manage area: 12% vs. 12%). Systems Architects gain their best CPI in Technology Watching (73%) and Architecture Design (68%). Compared to the European average, an Italian Systems Architect has a better CPI in User Support (+16%) but a worse one in Application Design (-9%).
7.5 Developer
0%
10%
20%
30%
40%
50%
60%
Plan
Build
Run Enable
Manage
ItalyEurope
Developer
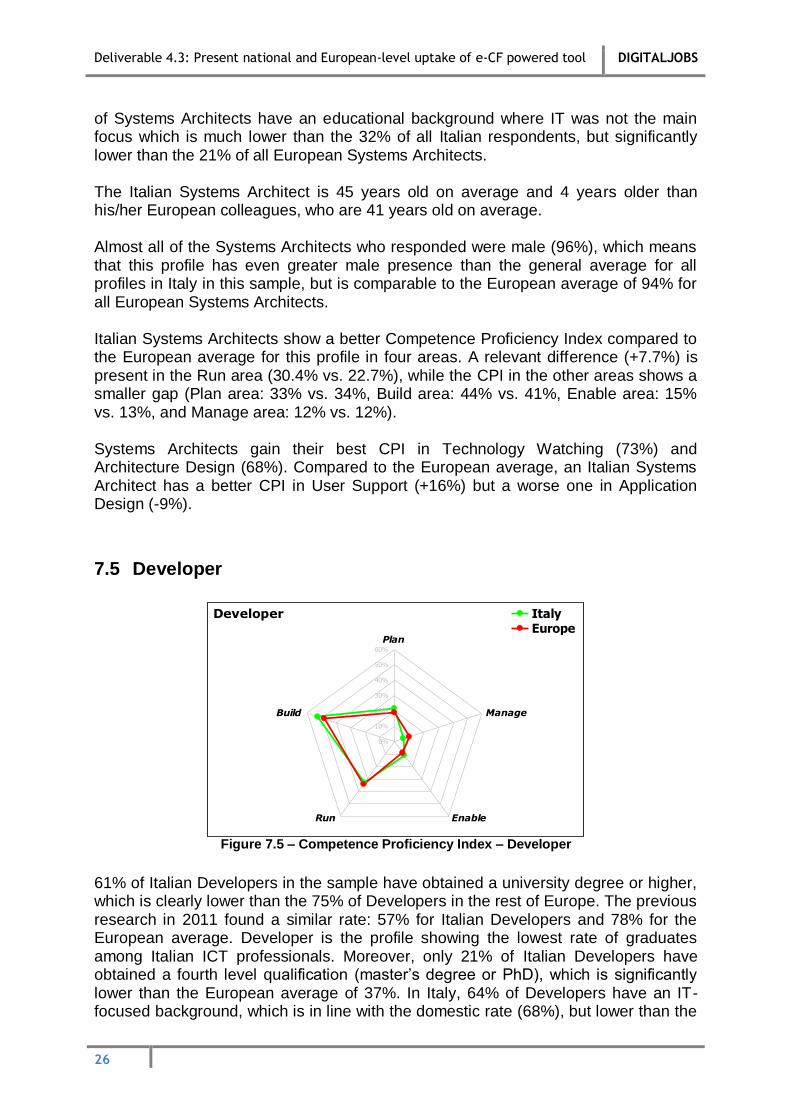
Figure 7.5 – Competence Proficiency Index – Developer
61% of Italian Developers in the sample have obtained a university degree or higher, which is clearly lower than the 75% of Developers in the rest of Europe. The previous research in 2011 found a similar rate: 57% for Italian Developers and 78% for the European average. Developer is the profile showing the lowest rate of graduates among Italian ICT professionals. Moreover, only 21% of Italian Developers have obtained a fourth level qualification (master’s degree or PhD), which is significantly lower than the European average of 37%. In Italy, 64% of Developers have an IT-focused background, which is in line with the domestic rate (68%), but lower than the

Deliverable 4.3: Present national and European-level uptake of e-CF powered tool DIGITALJOBS
27
73% of all Developers in Europe. National experts believe that this can to be attributed to a tendency for software developers to be sourced from young, often inexperienced talent. The Developer is not a young ICT professional in Italy; the average age is 38 years, just 1 year older than the European average. The majority of Developers who responded were male (88%), this is in line with the 89% of male proportion for all Italian respondents, but higher than the European average of 82% for this profile in this sample. Italian Developers show a better Competence Proficiency Index than the European average for this profile in three of five areas: Plan area (22% vs. 19%), Build area (53% vs. 48%) and Enable area (11% vs. 9%). The CPI results to be slightly lower in the Run area with 33% vs. 34%, as well as in the Manage area with 6% vs. 10%. For Italian Developers, the best CPI can be found in Documentation Production (75%) and Design & Development (57%). Comparing his/her results to the European average, there are no major differences. The widest gaps can be found for Architecture Design (+10%) and Technology Watching (+10%).
7.6 Digital Media Specialist
0%
10%
20%
30%
40%
50%
60%
Plan
Build
Run Enable
Manage
ItalyEurope
Digital Media Specialist
Figure 7.6 – Competence Proficiency Index – Digital Media Specialist
73% of Italian Digital Media Specialists in the sample have obtained a university degree or higher, which is clearly lower than the 90% European average. Moreover, 32% of Italian Digital Media Specialists have obtained a fourth level qualification (master’s degree or PhD), which is lower than the European average of 43%. In Italy, 77% of Digital Media Specialists have an IT-focused education, which is higher than the general domestic rate (68%), but lower than the 85% of other Digital Media Specialists in Europe. The Digital Media Specialist is a 40 years old ICT professional in Italy and 2 years younger than the Italian average, but about 1 year older than his/her European colleagues, who are 39 years old on average.

Deliverable 4.3: Present national and European-level uptake of e-CF powered tool DIGITALJOBS
28
Even if the profile shows the second highest participation rate of women in this sample, a large part of the Digital Media Specialists who responded was male (86%). This is lower than the 89% male proportion for all Italian respondents, but equal to the European average. Italian Digital Media Specialists show a lower Competence Proficiency Index in all areas, compared to the European average. Differences range from a variance of -2.4% (Enable area: 9.6% vs. 12%) to the largest gap of -6% (Run: 20.3% vs. 26.3%). Intermediate values are 22% vs. 24% for the Plan area, 50% vs. 54% for the Build area and 8% vs. 12% for the Manage area.
For Italian Digital Media Specialists, the best CPI can be found in Documentation Production (72%), Design & Development (54%) and Application Design (51%). The variance with the European average CPI shows the Italian Digital Media Specialist in a negative light: major differences are found in Change Support (-13%), Product or Project Planning (-11%) and Solution Deployment (-11%).
7.7 Account Manager
0%
5%
10%
15%
20%
25%
30%
35%
40%
Plan
Build
Run Enable
Manage
ItalyEurope
Account Manager
Figure 7.7 – Competence Proficiency Index – Account Manager
90% of Italian Account Managers in the sample have obtained a university degree or higher, which is slightly lower than the 96% of Account Managers in Europe. Moreover, half of Italian Account Managers have obtained a fourth level qualification (master’s degree or PhD) which is in line with the European average of 53%. In Italy, 50% of Account Managers have an IT-focused education, which is higher than the 46% average of Account Managers in Europe, but lower than the average rate for all profiles in Italy (68%). The Italian Account Manager is 46 years old on average, the second oldest ICT professional in Italy, but is in line with his/her European counterpart, who is 46 years old on average, as well.
Deliverable 4.3: Present national and European-level uptake of e-CF powered tool DIGITALJOBS
29
The majority of Account Managers who responded were male (90%); this is very close to the 89% male proportion for all Italian respondents in this sample, but a little bit lower than the European average for the role (93%). Italian Account Managers show a significantly higher Competence Proficiency Index than the European average for the profile in each of the 5 areas. The CPI is similar only for the Build area with 9% vs. 8%. For the other areas, the results are the following: 33% vs. 25% in the Plan area, 17% vs. 14% in the Run area, 39% vs. 31% in the Enable area, and 29% vs. 22% in the Manage area. Moreover, regarding the CPI, Italian Account Managers gain their best results in Relationship Management (68%), Sales Management (60%), Sales Proposal Development (57%), and Channel Management (56%). The main differences from the European CPIs are in Information Security Strategy Development (+19%), Relationship Management (+17%), Contract Management (+16%), and IS & Business Strategy Alignment (+15%).
7.8 ICT Trainer
0%
5%
10%
15%
20%
25%
Plan
Build
Run Enable
Manage
ItalyEurope
ICT Trainer
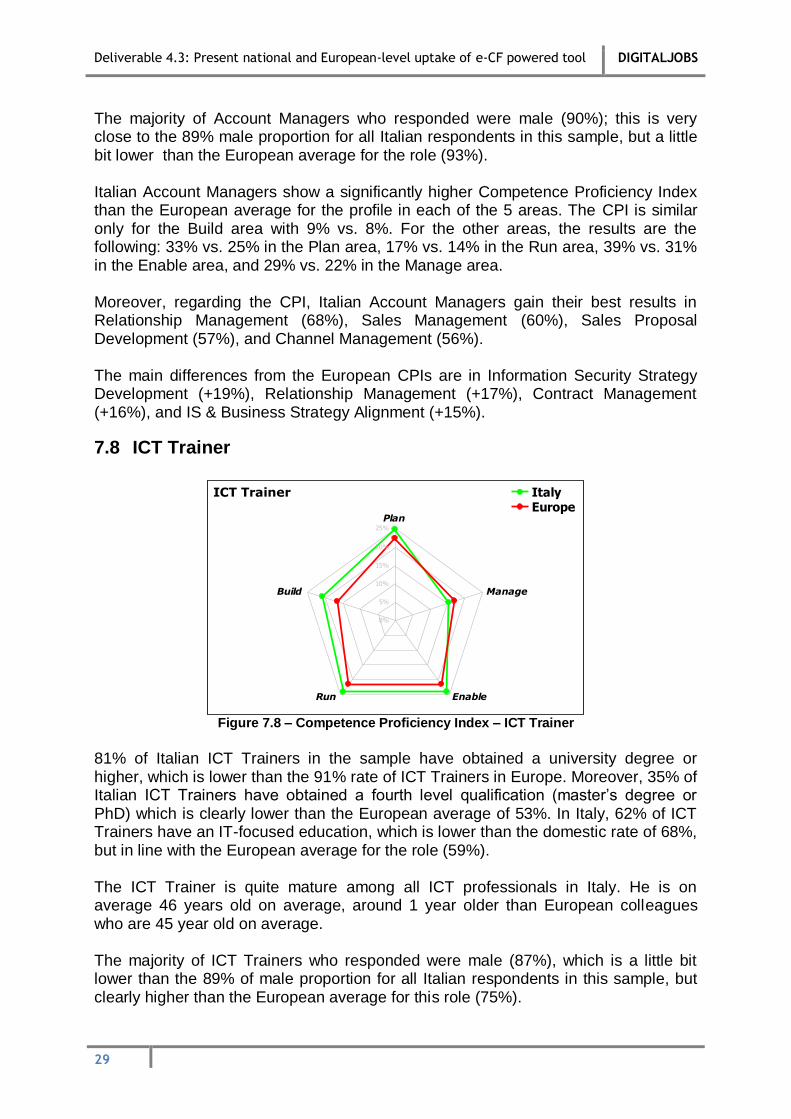
Figure 7.8 – Competence Proficiency Index – ICT Trainer
81% of Italian ICT Trainers in the sample have obtained a university degree or higher, which is lower than the 91% rate of ICT Trainers in Europe. Moreover, 35% of Italian ICT Trainers have obtained a fourth level qualification (master’s degree or PhD) which is clearly lower than the European average of 53%. In Italy, 62% of ICT Trainers have an IT-focused education, which is lower than the domestic rate of 68%, but in line with the European average for the role (59%). The ICT Trainer is quite mature among all ICT professionals in Italy. He is on average 46 years old on average, around 1 year older than European colleagues who are 45 year old on average. The majority of ICT Trainers who responded were male (87%), which is a little bit lower than the 89% of male proportion for all Italian respondents in this sample, but clearly higher than the European average for this role (75%).
Deliverable 4.3: Present national and European-level uptake of e-CF powered tool DIGITALJOBS
30
Italian ICT Trainers show a higher Competence Proficiency Index than the European average for the profile in four of the five areas: Plan: 25% vs. 22%, Build: 21% vs. 17%, Run: 24% vs. 22%, and Enable: 24% vs. 21%. The Manage area is the only one in which the ICT Trainers’ CPI is slightly lower with 15% vs. 17%. The Competence Proficiency Index for Italian ICT Trainers obviously gains its best results in Education & Training Provision (69%) and Personnel Development (43%). Comparing the Italian CPI results to the European average does not reveal remarkable differences: the gaps are all smaller than 10%.
7.9 Database Administrator
0%
5%
10%
15%
20%
25%
30%
35%
40%
45%
50%
Plan
Build
Run Enable
Manage
ItalyEurope
Database Administrator
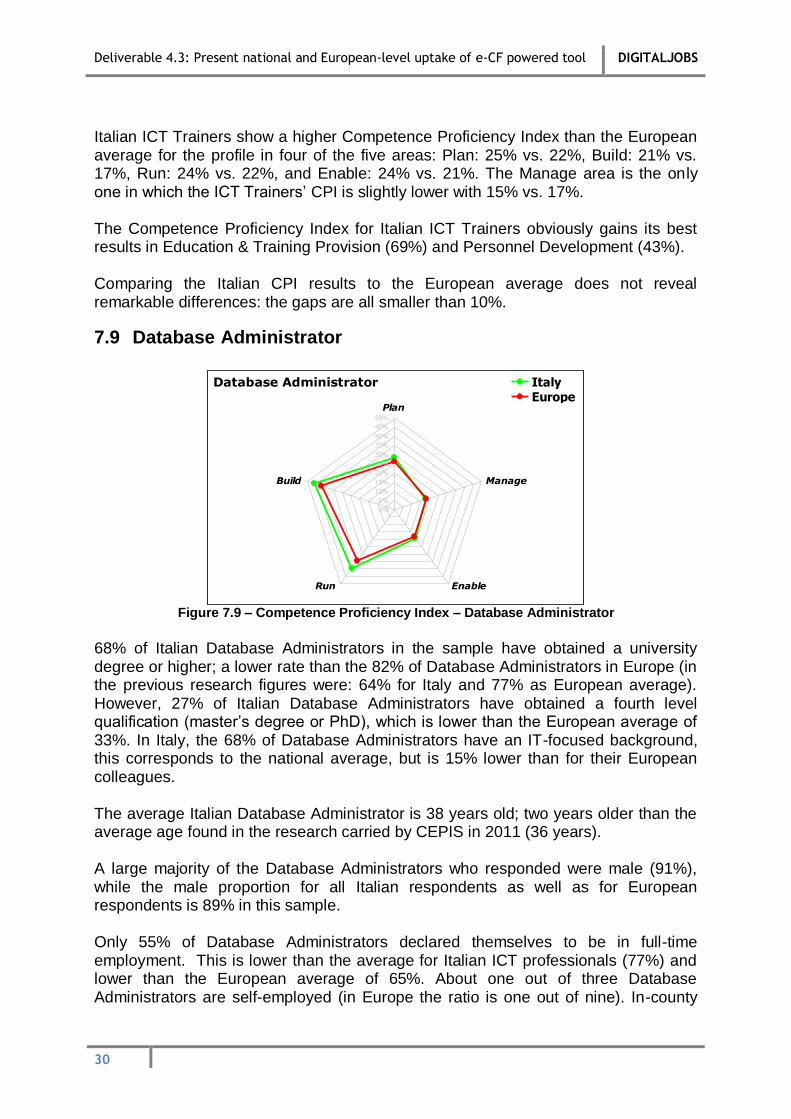
Figure 7.9 – Competence Proficiency Index – Database Administrator
68% of Italian Database Administrators in the sample have obtained a university degree or higher; a lower rate than the 82% of Database Administrators in Europe (in the previous research figures were: 64% for Italy and 77% as European average). However, 27% of Italian Database Administrators have obtained a fourth level qualification (master’s degree or PhD), which is lower than the European average of 33%. In Italy, the 68% of Database Administrators have an IT-focused background, this corresponds to the national average, but is 15% lower than for their European colleagues. The average Italian Database Administrator is 38 years old; two years older than the average age found in the research carried by CEPIS in 2011 (36 years). A large majority of the Database Administrators who responded were male (91%), while the male proportion for all Italian respondents as well as for European respondents is 89% in this sample. Only 55% of Database Administrators declared themselves to be in full-time employment. This is lower than the average for Italian ICT professionals (77%) and lower than the European average of 65%. About one out of three Database Administrators are self-employed (in Europe the ratio is one out of nine). In-county

Deliverable 4.3: Present national and European-level uptake of e-CF powered tool DIGITALJOBS
31
experts report that it is common for such profiles to work independently and thus be shared between several companies. In Italy, the Database Administrator shows a quite higher Competence Proficiency Index than the European average in four areas: 28% in the Plan area vs. 26%, 46% in the Build area vs. 42%, 39% in the Run area vs. 34%, and 20% in the Enable area vs. 18%. In the Manage area they get the same index (18%) as their European colleagues (18%). For Italian Database Administrator the best CPIs are in Systems Integration (61%), Information & Knowledge Management (56%), Application Design (55%), Design & Development and Problem Management (51% each).
Comparing Italian Database Administrator results with the European average does not reveal major differences: the widest positive gap exists for Information Security Strategy Development (+14%), while on the negative side the widest gap is in ICT Quality Management (-13%).
7.10 Systems Administrator
0%
5%
10%
15%
20%
25%
30%
35%
40%
Plan
Build
Run Enable
Manage
ItalyEurope
Systems Administrator
Figure 7.10 – Competence Proficiency Index – Systems Administrator
68% of Italian Systems Administrators in the sample have obtained a university degree or higher, a lower rate than the 79% of Systems Administrators in Europe. Only 13% of Italian Systems Administrators have obtained a fourth level qualification (master’s degree or PhD), which is lower than the European average of 23%. In Italy, 66% of Systems Administrators have an IT-focused background, which is close to the Italian general average of 68%, but is still 6% lower than their European colleagues with 72%. Italian Systems Administrators are 39 years old on average, while their European colleagues are about one year younger (38 years). The majority Systems Administrators who responded were male (85%); this is slightly below the 89% male proportion for all Italian respondents, but very close to the European average (87%) for this role in this sample.

Deliverable 4.3: Present national and European-level uptake of e-CF powered tool DIGITALJOBS
32
Systems Administrator in Italy, as well as in Europe, is the ICT profile which has the lowest proximity rate: 72%. An explanation for this low rate could be that it is more difficult to meet all the required competencies for this profile. In Italy, the Systems Administrators show Competence Proficiency Indexes which vary slightly from the European average, always on the minus: Plan area: 13% vs. 16%, Build area: 22% vs. 23%, Run area: 36% vs. 36, Enable area: 7% vs. 10%, and Manage area: 8% vs. 12%. As regarding the Competence Proficiency Index, Italian Systems Administrators gain their best results in User Support (59%), Problem Management (34%), and Systems Integration (34%). Some negative differences only arise for Product or Project Planning (-9%) and Project & Portfolio Management (-8%).
7.11 Network Specialist
0%
10%
20%
30%
40%
50%
60%
Plan
Build
Run Enable
Manage
ItalyEurope
Network Specialist
Figure 7.11 – Competence Proficiency Index – Network Specialist
A majority (88%) of Italian Network Specialists in the sample have obtained a university degree or higher; this is slightly higher than 78% of Network Specialists in Europe and higher than the Italian general average of 79% as well. Moreover, only 4% of Italian Network Specialists have obtained a fourth level qualification (master’s degree or PhD), which is the lowest rate among all ICT profiles. In comparison, 26% of Italian ICT professionals have such a qualification, and the European average is of 21%. In Italy, 75% of Network Specialists have an IT-focused education which is a bit higher than the domestic rate (68%), but in line with the 76% of Network Specialists across Europe. The Italian Network Specialist is 35 years old on average, making them the youngest ICT professional in Italy, 7 years younger than the domestic average (42 years) but 3 years older than the European average (38 years old). All the Network Specialists who responded were male in this sample (this was also the case in the previous research), while the male proportion for all Italian respondents is 89% and the European average for the profile is 93%.

Deliverable 4.3: Present national and European-level uptake of e-CF powered tool DIGITALJOBS
33
Italian Network Specialists have a better Competence Proficiency Index than the European average only in the Run area (50% vs. 42%). Their CPIs are lower for the areas Plan, Build, Enable and Manage (14% Plan area vs. 21%, 42% Build area vs. 45%, 12% Enable area vs. 13%, and 13% Manage area vs. 17%). For Italian Network Specialists the best CPIs are in Solution Deployment (72%), User Support (56%), and Problem Management (55%). Negative differences compared with the European average arise in in Architecture Design (-17%), Product or Project Planning (-15%), Documentation Production (-13%), and ICT Quality Management (-12%). The best performances compared to the European average CPI are in User Support (+9%) and Service Delivery (+10%).
7.12 Technical Specialists
0%
10%
20%
30%
40%
50%
60%
Plan
Build
Run Enable
Manage
ItalyEurope
Technical Specialist
Figure 7.12 – Competence Proficiency Index – Technical Specialist
76% of Italian Technical Specialists in the sample have obtained a university degree or higher, slightly lower than the European average for this role and the national average (79% each). However, only 19% of Italian Technical Specialists have obtained a fourth level qualification (master’s degree or PhD), which is 7% lower than the European average of 26%. In Italy, 77% of the Technical Specialists have an IT-focused education: this rate is higher than the 68% average of European colleagues, and also higher than 68% of all Italian respondents. The average Italian Technical Specialist is 41 years old on average, about 1 year younger than his/her European colleagues (42 years old), and 1 year younger than the average of other Italian ICT professionals, as well. A majority of Technical Specialists who responded were male (93%), a slightly higher percentage than the proportion of respondents from Italy (89%) and across Europe (89%) in this sample. Italian Technical Specialists show a Competence Proficiency Index pattern by area very similar to the European average, but always slightly lower: Plan Area (21% vs.
Deliverable 4.3: Present national and European-level uptake of e-CF powered tool DIGITALJOBS
34
23%), Run area (54% vs. 55%), Enable area (14% vs. 16%), and Manage Area (14% vs. 18%); in the Build area they are almost equal to the European average of 29%. Regarding the Competence Proficiency Index, Italian Technical Specialists gain their best results in Change Support (72%), User Support (54%), Problem Management (51%), and Service Delivery (44%). Some negative differences with the European average arise in Product or Project Planning (-9%) and in Process Improvement (-8%).
7.13 ICT Security Manager
0%
5%
10%
15%
20%
25%
30%
35%
40%
Plan
Build
Run Enable
Manage
ItalyEurope
ICT Security Manager
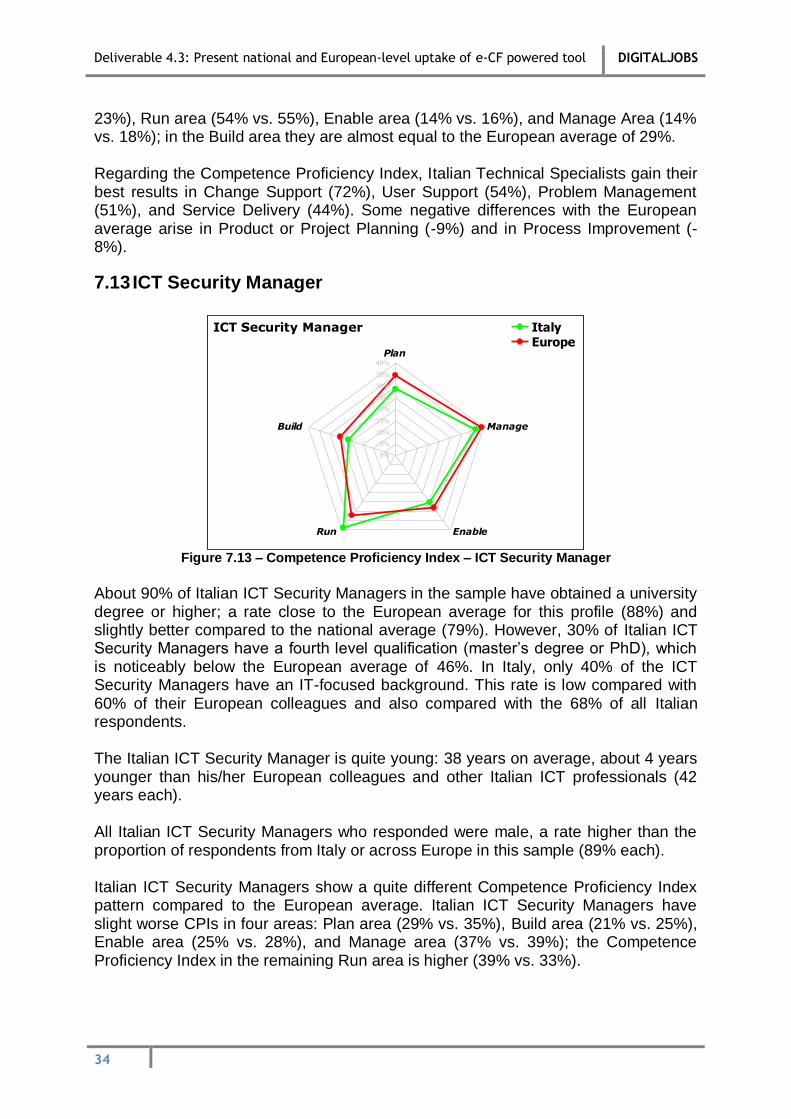
Figure 7.13 – Competence Proficiency Index – ICT Security Manager
About 90% of Italian ICT Security Managers in the sample have obtained a university degree or higher; a rate close to the European average for this profile (88%) and slightly better compared to the national average (79%). However, 30% of Italian ICT Security Managers have a fourth level qualification (master’s degree or PhD), which is noticeably below the European average of 46%. In Italy, only 40% of the ICT Security Managers have an IT-focused background. This rate is low compared with 60% of their European colleagues and also compared with the 68% of all Italian respondents. The Italian ICT Security Manager is quite young: 38 years on average, about 4 years younger than his/her European colleagues and other Italian ICT professionals (42 years each). All Italian ICT Security Managers who responded were male, a rate higher than the proportion of respondents from Italy or across Europe in this sample (89% each). Italian ICT Security Managers show a quite different Competence Proficiency Index pattern compared to the European average. Italian ICT Security Managers have slight worse CPIs in four areas: Plan area (29% vs. 35%), Build area (21% vs. 25%), Enable area (25% vs. 28%), and Manage area (37% vs. 39%); the Competence Proficiency Index in the remaining Run area is higher (39% vs. 33%).

Deliverable 4.3: Present national and European-level uptake of e-CF powered tool DIGITALJOBS
35
As regards the Competence Proficiency Index, Italian ICT Security Managers, as expected, gain their best results in Information Security Strategy Development (75%), Information Security Management (72%), IT Governance (56%), and Technology Watching (58%). Their better performance in the Run area is based on a better CPI in Service Delivery (+15%). On the negative side, the most remarkable differences are found in Business Plan Development (-14%), Documentation Production (-13%), and Project & Portfolio Management (-11%).
7.14 Project Manager
0%
5%
10%
15%
20%
25%
30%
35%
40%
45%
Plan
Build
Run Enable
Manage
ItalyEurope
Project Manager
Figure 7.14 – Competence Proficiency Index – Project Manager
90% of Italian Project Managers in the sample have obtained a university degree or higher, which is almost the same rate of Project Managers in Europe (89%). A large disparity is found in the fourth level qualification rate: only 31% of Italian Project Managers have a master’s degree or PhD, which is a long way from the European average of 54%. In Italy, 59% of Project Managers have an IT-focused education; this is lower than the national average (68%) but significantly higher than the European average for this profile (48%). National experts note that this is one of the ICT profiles more frequently obtained by professionals who started working earlier as developers, during their bachelor studies. A high number of the responding Project Managers were male (86%), which is close to the male proportion for all Italian respondents (89%), but differs considerably from the European average. Italian Project Managers are 44 years old on average, which is the same age as their European colleagues in this sample. Italian Project Managers show a better Competence Proficiency Index than the European average for this profile in three areas: the Plan area with 41% vs. 36%, the Build area with 25% vs. 22%, and the Run area with 28% vs. 26%. Slightly smaller CPIs are in the Enable area (22% vs. 23%) and in the Manage area (37% vs. 38%).

Deliverable 4.3: Present national and European-level uptake of e-CF powered tool DIGITALJOBS
36
The Project Manager gains the best Competence Proficiency Index in Application Design, Product or Project Planning, Project & Portfolio Management (61% each), and Relationship Management (54%). The most significant differences in comparison to European Project Managers are in Application Design (+24%) and Architecture Design (+12%). On the negative side, Risk Management (-11%) and Education & Training Provision (-7%) show the most remarkable differences.
Deliverable 4.3: Present national and European-level uptake of e-CF powered tool DIGITALJOBS
37
8 Conclusions
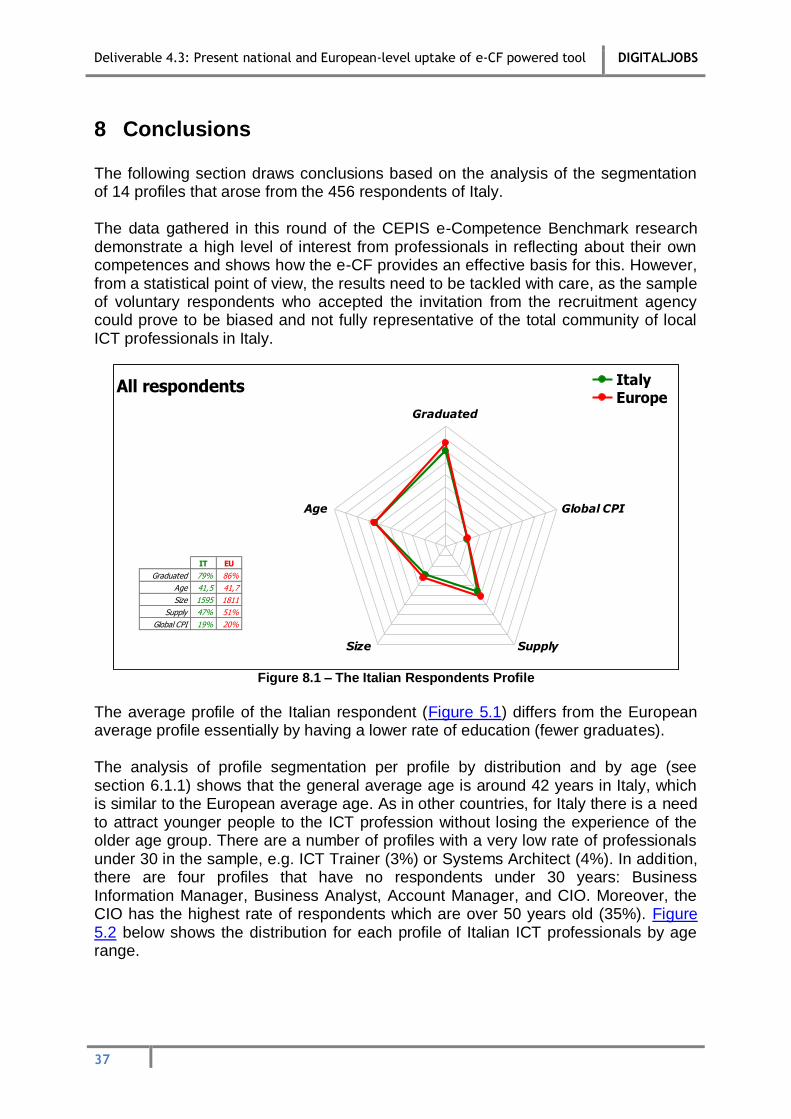
The following section draws conclusions based on the analysis of the segmentation of 14 profiles that arose from the 456 respondents of Italy. The data gathered in this round of the CEPIS e-Competence Benchmark research demonstrate a high level of interest from professionals in reflecting about their own competences and shows how the e-CF provides an effective basis for this. However, from a statistical point of view, the results need to be tackled with care, as the sample of voluntary respondents who accepted the invitation from the recruitment agency could prove to be biased and not fully representative of the total community of local ICT professionals in Italy.
All respondents
IT EU
Graduated 79% 86%
Age 41,5 41,7
Size 1595 1811
Supply 47% 51%
Global CPI 19% 20%
Graduated
Age
Size Supply
Global CPI
ItalyEurope
Figure 8.1 – The Italian Respondents Profile
The average profile of the Italian respondent (Figure 5.1) differs from the European average profile essentially by having a lower rate of education (fewer graduates). The analysis of profile segmentation per profile by distribution and by age (see section 6.1.1) shows that the general average age is around 42 years in Italy, which is similar to the European average age. As in other countries, for Italy there is a need to attract younger people to the ICT profession without losing the experience of the older age group. There are a number of profiles with a very low rate of professionals under 30 in the sample, e.g. ICT Trainer (3%) or Systems Architect (4%). In addition, there are four profiles that have no respondents under 30 years: Business Information Manager, Business Analyst, Account Manager, and CIO. Moreover, the CIO has the highest rate of respondents which are over 50 years old (35%). Figure 5.2 below shows the distribution for each profile of Italian ICT professionals by age range.

Deliverable 4.3: Present national and European-level uptake of e-CF powered tool DIGITALJOBS
38
12%
4%
21%
14%
3%
32%
13%
25%
12%
20%
7%
71%
65%
80%
76%
71%
70%
77%
80%
66%
50%
79%
71%
74%
70%
76%
17%
35%
20%
24%
25%
9%
9%
20%
31%
18%
7%
4%
14%
10%
17%
Italy (average)
BM1 Chief Information Officer
BM2 Business Information Manager
DS1 Business Analyst
DS4 Systems Architect
DV1 Developer
DV2 Digital Media Specialist
SP1 Account Manager
SP2 ICT Trainer
SR1 Database Administrator
SR2 Systems Administrator
SR3 Network Specialist
SR4 Technical Specialist
TM2 ICT Security Manager
TM3 Project Manager
<30yr 31..50 >50yr
Figure 5.2 – Profile Distribution by Age Range
Looking at the gender balance (section 6.1.2) provides evidence that female representation in Italy is very limited in this sample. The participation of women higher than 15% appears only in two profiles: Business Information Manager (20%) and Systems Administrator (15%). Moreover, in two profiles there were no female respondents at all (Network Specialist and ICT Security Manager); female representation at the European level in these profiles is also lower than the average (7% and 11%). The results of the educational analysis (section 6.1.3 and 6.1.4) suggest that there is a low level of attainment of degrees. For 10 out of the 14 analysed profiles, the Italian rate is lower than the European rate and is only noticeably higher in one profile (Network Specialist, 88% vs. 78%). On IT-focused education, there is evidence to suggest a sufficient IT education. In fact, two profiles count for more than half of ICT professionals without an IT-focused education. However these are two key profiles: Chief Information Officer and ICT Security Manager. For the level of Competence Proficiency Index (section 3.3) of Italian respondents, it appears that the results compare favourably to one of the five areas at European level: Run area with 33% vs. 29%. On the other side, results show a gap in the Manage area with 15% vs. 18%. Figure 5.3 shows the difference between the CPI in Italy and the corresponding European average CPI. In general, Italian CPIs in the sample do not show significant gaps compared to the European average. The largest variance, lower than the European CPI, appears for Product & Project Planning (-7.1%), Risk Management (-5.8%), Process Improvements (-5.0%), and Project & Portfolio Management (-5.1%). On the other hand, Italian CPIs are higher than the European average for User Support (+6.2%), Change Support (+4.3%), and Systems Integration (+3.9%).

Deliverable 4.3: Present national and European-level uptake of e-CF powered tool DIGITALJOBS
39
Difference between Italy CPI and Europe average CPI - All ProfilesIS & Business Strategy Alignment A01
Service Level Management A02Business Plan Development A03Product or Project Planning A04
Architecture Design A05Application Design A06
Technology Watching A07Sustainable development A08
Design & Development B01Systems Integration B02
Testing B03Solution Deployment B04
Documentation Production B05
User Support C01Change Support C02Service Delivery C03
Problem Management C04
Information Security Strategy Development D01ICT Quality Strategy Development D02
Education & Training Provision D03Purchasing D04
Sales Proposal Development D05Channel Management D06
Sales Management D07Contract Management D08
Personnel Development D09Information & Knowledge Management D10
Forecast Development E01Project & Portfolio Management E02
Risk Management E03Relationship Management E04
Process Improvement E05ICT Quality Management E06
Business Change Management E07Information Security Management E08
IT Governance E09
MA
NA
GE
PLA
NB
UILD
RU
NE
NA
BLE
-3.2%0.6%
-3.1%-7.1%
3.1%1.3%
0.5%0.7%
-2.2%3.9%
-0.6%3.6%
-1.9%
6.2%4.3%
2.4%3.4%
-0.2%-0.8%
1.6%1.7%
-1.3%1.4%
0.0%0.1%
-2.3%-2.3%
-2.4%-5.1%
-5.8%-0.2%
-5.0%-2.6%-2.6%
-0.5%-1.9%
Figure 8.3 – Competence Proficiency Index – Differences to European Average
Some interesting results arise from the comparison between the competences of ICT professionals working in micro/small organisations (1-50 employees) and those working in medium/large organisations (more than 50 employees). Figure 5.4 shows that ICT professionals working in micro/small organisations score higher rates in the Plan and Enable areas, while they show lower competence levels in the areas of Build, Run and Manage.

Deliverable 4.3: Present national and European-level uptake of e-CF powered tool DIGITALJOBS
40
Micro & Small
Organisations
Medium & Large
Organisations
IS & Business Strategy Alignment A01Service Level Management A02Business Plan Development A03Product or Project Planning A04
Architecture Design A05Application Design A06
Technology Watching A07Sustainable development A08
Design & Development B01Systems Integration B02
Testing B03Solution Deployment B04
Documentation Production B05
User Support C01Change Support C02Service Delivery C03
Problem Management C04
Information Security Strategy Development D01ICT Quality Strategy Development D02
Education & Training Provision D03Purchasing D04
Sales Proposal Development D05Channel Management D06
Sales Management D07Contract Management D08
Personnel Development D09Information & Knowledge Management D10
Forecast Development E01Project & Portfolio Management E02
Risk Management E03Relationship Management E04
Process Improvement E05ICT Quality Management E06
Business Change Management E07Information Security Management E08
IT Governance E09
CPI Difference vs
whole Italy
MA
NA
GE
PLA
NB
UILD
RU
NE
NA
BLE
0%0%2%1%
0%0%
-3%-3%
0%0%1%
-1%1%
1%2%
1%0%
-1%1%
-2%-1%-1%
-1%-3%
1%1%
0%
-1%2%
0%1%1%0%1%
-1%1%
0%0%
-1%-2%
2%-1%
8%4%
-1%-1%
-3%1%
-3%
-1%-3%-3%
0%
1%-2%
0%-1%
3%4%
7%1%
-3%-2%
2%-5%
-2%-2%
-4%-2%
-3%-3%-3%
Figure 8.4 – CPI Difference versus whole Italy
A deeper analysis of the Competence Proficiency Indexes compared to each profile requirement is fundamental in order to design detailed training paths to cover the competence gaps for each Proximity Profile of each respondent. For example, the analysis of the five main competences of the Systems Administrator profile reveals that Italian Systems Administrators show different competence levels: they suffer a competence gap with European colleagues in Testing (-1%) and User Support (-2%); they have similar performances in Problem Management and Information Security Management; and finally they show better competence level in Systems Integration (+4%).
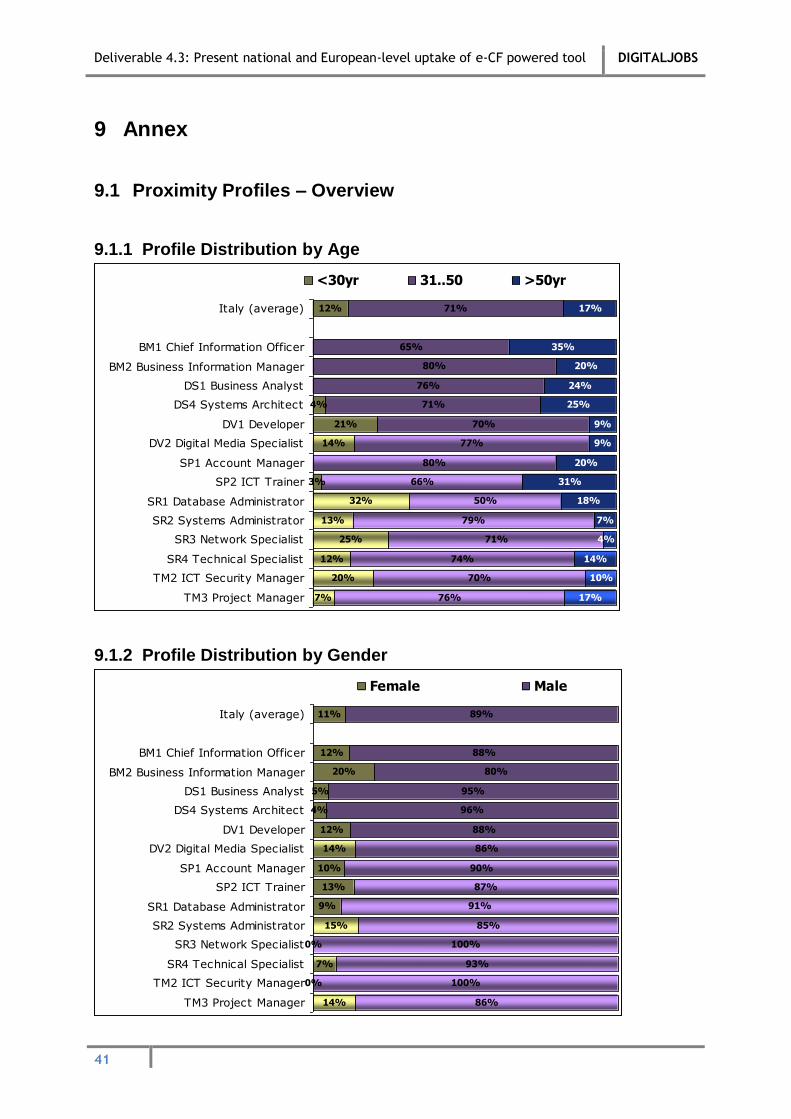
Deliverable 4.3: Present national and European-level uptake of e-CF powered tool DIGITALJOBS
41
9 Annex
9.1 Proximity Profiles – Overview
9.1.1 Profile Distribution by Age
12%
4%
21%
14%
3%
32%
13%
25%
12%
20%
7%
71%
65%
80%
76%
71%
70%
77%
80%
66%
50%
79%
71%
74%
70%
76%
17%
35%
20%
24%
25%
9%
9%
20%
31%
18%
7%
4%
14%
10%
17%
Italy (average)
BM1 Chief Information Officer
BM2 Business Information Manager
DS1 Business Analyst
DS4 Systems Architect
DV1 Developer
DV2 Digital Media Specialist
SP1 Account Manager
SP2 ICT Trainer
SR1 Database Administrator
SR2 Systems Administrator
SR3 Network Specialist
SR4 Technical Specialist
TM2 ICT Security Manager
TM3 Project Manager
<30yr 31..50 >50yr
9.1.2 Profile Distribution by Gender
11%
12%
20%
5%
4%
12%
14%
10%
13%
9%
15%
0%
7%
0%
14%
89%
88%
80%
95%
96%
88%
86%
90%
87%
91%
85%
100%
93%
100%
86%
Italy (average)
BM1 Chief Information Officer
BM2 Business Information Manager
DS1 Business Analyst
DS4 Systems Architect
DV1 Developer
DV2 Digital Media Specialist
SP1 Account Manager
SP2 ICT Trainer
SR1 Database Administrator
SR2 Systems Administrator
SR3 Network Specialist
SR4 Technical Specialist
TM2 ICT Security Manager
TM3 Project Manager
Female Male

Deliverable 4.3: Present national and European-level uptake of e-CF powered tool DIGITALJOBS
42
9.1.3 Profile Distribution by Education Level
21%
12%
0%
10%
17%
39%
27%
10%
19%
32%
32%
13%
24%
10%
10%
79%
88%
100%
90%
83%
61%
73%
90%
81%
68%
68%
88%
76%
90%
90%
Italy (average)
BM1 Chief Information Officer
BM2 Business Information Manager
DS1 Business Analyst
DS4 Systems Architect
DV1 Developer
DV2 Digital Media Specialist
SP1 Account Manager
SP2 ICT Trainer
SR1 Database Administrator
SR2 Systems Administrator
SR3 Network Specialist
SR4 Technical Specialist
TM2 ICT Security Manager
TM3 Project Manager
Secondary Diploma or less University degree
9.1.4 Profile Distribution by IT Education
68%
35%
50%
52%
88%
64%
77%
50%
62%
68%
66%
75%
77%
40%
59%
32%
65%
50%
48%
13%
36%
23%
50%
38%
32%
34%
25%
23%
60%
41%
Italy (average)
BM1 Chief Information Officer
BM2 Business Information Manager
DS1 Business Analyst
DS4 Systems Architect
DV1 Developer
DV2 Digital Media Specialist
SP1 Account Manager
SP2 ICT Trainer
SR1 Database Administrator
SR2 Systems Administrator
SR3 Network Specialist
SR4 Technical Specialist
TM2 ICT Security Manager
TM3 Project Manager
Main focus Secondary subjet
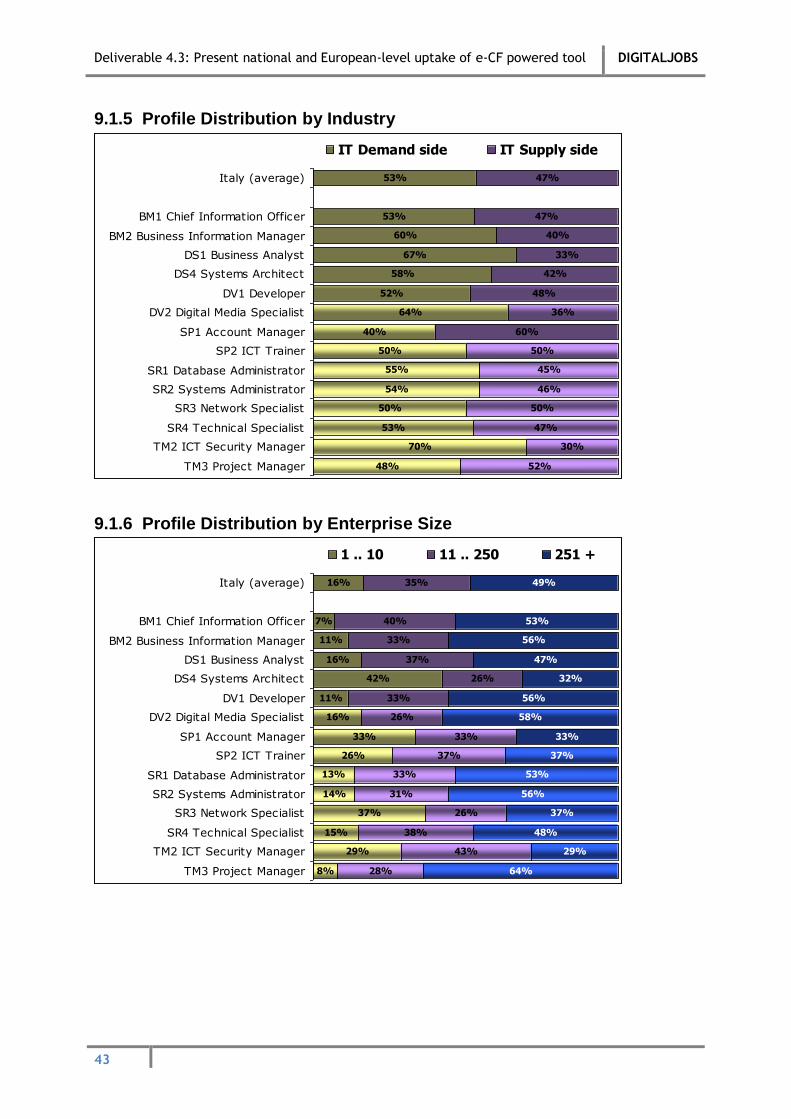
Deliverable 4.3: Present national and European-level uptake of e-CF powered tool DIGITALJOBS
43
9.1.5 Profile Distribution by Industry
53%
53%
60%
67%
58%
52%
64%
40%
50%
55%
54%
50%
53%
70%
48%
47%
47%
40%
33%
42%
48%
36%
60%
50%
45%
46%
50%
47%
30%
52%
Italy (average)
BM1 Chief Information Officer
BM2 Business Information Manager
DS1 Business Analyst
DS4 Systems Architect
DV1 Developer
DV2 Digital Media Specialist
SP1 Account Manager
SP2 ICT Trainer
SR1 Database Administrator
SR2 Systems Administrator
SR3 Network Specialist
SR4 Technical Specialist
TM2 ICT Security Manager
TM3 Project Manager
IT Demand side IT Supply side
9.1.6 Profile Distribution by Enterprise Size
16%
7%
11%
16%
42%
11%
16%
33%
26%
13%
14%
37%
15%
29%
8%
35%
40%
33%
37%
26%
33%
26%
33%
37%
33%
31%
26%
38%
43%
28%
49%
53%
56%
47%
32%
56%
58%
33%
37%
53%
56%
37%
48%
29%
64%
Italy (average)
BM1 Chief Information Officer
BM2 Business Information Manager
DS1 Business Analyst
DS4 Systems Architect
DV1 Developer
DV2 Digital Media Specialist
SP1 Account Manager
SP2 ICT Trainer
SR1 Database Administrator
SR2 Systems Administrator
SR3 Network Specialist
SR4 Technical Specialist
TM2 ICT Security Manager
TM3 Project Manager
1 .. 10 11 .. 250 251 +
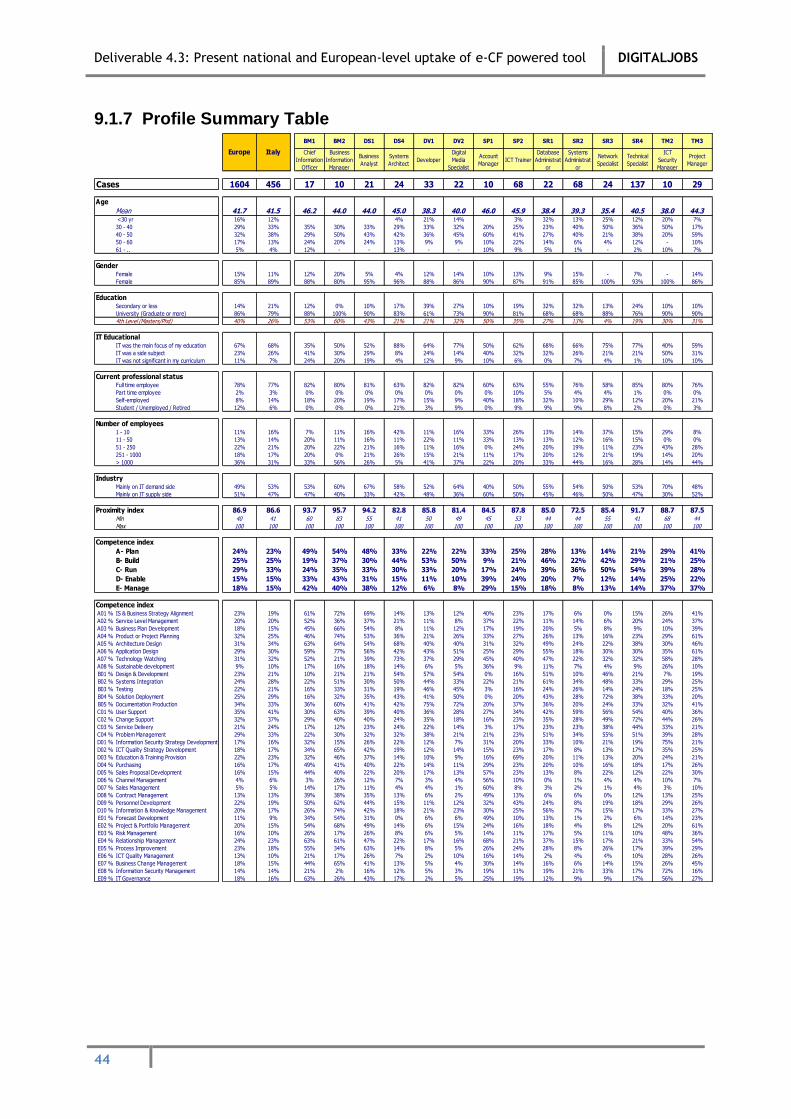
Deliverable 4.3: Present national and European-level uptake of e-CF powered tool DIGITALJOBS
44
9.1.7 Profile Summary Table BM1 BM2 DS1 DS4 DV1 DV2 SP1 SP2 SR1 SR2 SR3 SR4 TM2 TM3
Chief
Information
Officer
Business
Information
Manager
Business
Analyst
Systems
ArchitectDeveloper
Digital
Media
Specialist
Account
ManagerICT Trainer
Database
Administrat
or
Systems
Administrat
or
Network
Specialist
Technical
Specialist
ICT
Security
Manager
Project
Manager
Cases 1604 456 17 10 21 24 33 22 10 68 22 68 24 137 10 29
Age
Mean 41.7 41.5 46.2 44.0 44.0 45.0 38.3 40.0 46.0 45.9 38.4 39.3 35.4 40.5 38.0 44.3 <30 yr 16% 12% 4% 21% 14% 3% 32% 13% 25% 12% 20% 7%
30 - 40 29% 33% 35% 30% 33% 29% 33% 32% 20% 25% 23% 40% 50% 36% 50% 17%
40 - 50 32% 38% 29% 50% 43% 42% 36% 45% 60% 41% 27% 40% 21% 38% 20% 59%
50 - 60 17% 13% 24% 20% 24% 13% 9% 9% 10% 22% 14% 6% 4% 12% - 10%
61 - .. 5% 4% 12% - - 13% - - 10% 9% 5% 1% - 2% 10% 7%
GenderFemale 15% 11% 12% 20% 5% 4% 12% 14% 10% 13% 9% 15% - 7% - 14%
Female 85% 89% 88% 80% 95% 96% 88% 86% 90% 87% 91% 85% 100% 93% 100% 86%
EducationSecondary or less 14% 21% 12% 0% 10% 17% 39% 27% 10% 19% 32% 32% 13% 24% 10% 10%
University (Graduate or more) 86% 79% 88% 100% 90% 83% 61% 73% 90% 81% 68% 68% 88% 76% 90% 90%
4th Level (Masters/Phd) 40% 26% 53% 60% 43% 21% 21% 32% 50% 35% 27% 13% 4% 19% 30% 31%
IT EducationalIT was the main focus of my education 67% 68% 35% 50% 52% 88% 64% 77% 50% 62% 68% 66% 75% 77% 40% 59%
IT was a side subject 23% 26% 41% 30% 29% 8% 24% 14% 40% 32% 32% 26% 21% 21% 50% 31%
IT was not significant in my curriculum 11% 7% 24% 20% 19% 4% 12% 9% 10% 6% 0% 7% 4% 1% 10% 10%
Current professional statusFull time employee 78% 77% 82% 80% 81% 63% 82% 82% 60% 63% 55% 76% 58% 85% 80% 76%
Part time employee 2% 3% 0% 0% 0% 0% 0% 0% 0% 10% 5% 4% 4% 1% 0% 0%
Self-employed 8% 14% 18% 20% 19% 17% 15% 9% 40% 18% 32% 10% 29% 12% 20% 21%
Student / Unemployed / Retired 12% 6% 0% 0% 0% 21% 3% 9% 0% 9% 9% 9% 8% 2% 0% 3%
Number of employees1 - 10 11% 16% 7% 11% 16% 42% 11% 16% 33% 26% 13% 14% 37% 15% 29% 8%
11 - 50 13% 14% 20% 11% 16% 11% 22% 11% 33% 13% 13% 12% 16% 15% 0% 0%
51 - 250 22% 21% 20% 22% 21% 16% 11% 16% 0% 24% 20% 19% 11% 23% 43% 28%
251 - 1000 18% 17% 20% 0% 21% 26% 15% 21% 11% 17% 20% 12% 21% 19% 14% 20%
> 1000 36% 31% 33% 56% 26% 5% 41% 37% 22% 20% 33% 44% 16% 28% 14% 44%
IndustryMainly on IT demand side 49% 53% 53% 60% 67% 58% 52% 64% 40% 50% 55% 54% 50% 53% 70% 48%
Mainly on IT supply side 51% 47% 47% 40% 33% 42% 48% 36% 60% 50% 45% 46% 50% 47% 30% 52%
Proximity index 86.9 86.6 93.7 95.7 94.2 82.8 85.8 81.4 84.5 87.8 85.0 72.5 85.4 91.7 88.7 87.5Min 40 41 60 83 55 41 50 49 45 53 44 44 55 41 68 44
Max 100 100 100 100 100 100 100 100 100 100 100 100 100 100 100 100
Competence index
A- Plan 24% 23% 49% 54% 48% 33% 22% 22% 33% 25% 28% 13% 14% 21% 29% 41%
B- Build 25% 25% 19% 37% 30% 44% 53% 50% 9% 21% 46% 22% 42% 29% 21% 25%
C- Run 29% 33% 24% 35% 33% 30% 33% 20% 17% 24% 39% 36% 50% 54% 39% 28%
D- Enable 15% 15% 33% 43% 31% 15% 11% 10% 39% 24% 20% 7% 12% 14% 25% 22%
E- Manage 18% 15% 42% 40% 38% 12% 6% 8% 29% 15% 18% 8% 13% 14% 37% 37%
Competence indexA01 % IS & Business Strategy Alignment 23% 19% 61% 72% 69% 14% 13% 12% 40% 23% 17% 6% 0% 15% 26% 41%
A02 % Service Level Management 20% 20% 52% 36% 37% 21% 11% 8% 37% 22% 11% 14% 6% 20% 24% 37%
A03 % Business Plan Development 18% 15% 45% 66% 54% 8% 11% 12% 17% 19% 20% 5% 8% 9% 10% 39%
A04 % Product or Project Planning 32% 25% 46% 74% 53% 36% 21% 26% 33% 27% 26% 13% 16% 23% 29% 61%
A05 % Architecture Design 31% 34% 63% 64% 54% 68% 40% 40% 31% 32% 49% 24% 22% 38% 30% 46%
A06 % Application Design 29% 30% 59% 77% 56% 42% 43% 51% 25% 29% 55% 18% 30% 30% 35% 61%
A07 % Technology Watching 31% 32% 52% 21% 39% 73% 37% 29% 45% 40% 47% 22% 32% 32% 58% 28%
A08 % Sustainable development 9% 10% 17% 16% 18% 14% 6% 5% 36% 9% 11% 7% 4% 9% 26% 10%
B01 % Design & Development 23% 21% 10% 21% 21% 54% 57% 54% 0% 16% 51% 10% 46% 21% 7% 19%
B02 % Systems Integration 24% 28% 22% 51% 30% 50% 44% 33% 22% 21% 61% 34% 48% 33% 29% 25%
B03 % Testing 22% 21% 16% 33% 31% 19% 46% 45% 3% 16% 24% 26% 14% 24% 18% 25%
B04 % Solution Deployment 25% 29% 16% 32% 35% 43% 41% 50% 0% 20% 43% 28% 72% 38% 33% 20%
B05 % Documentation Production 34% 33% 36% 60% 41% 42% 75% 72% 20% 37% 36% 20% 24% 33% 32% 41%
C01 % User Support 35% 41% 30% 63% 39% 40% 36% 28% 27% 34% 42% 59% 56% 54% 40% 36%
C02 % Change Support 32% 37% 29% 40% 40% 24% 35% 18% 16% 23% 35% 28% 49% 72% 44% 26%
C03 % Service Delivery 21% 24% 17% 12% 23% 24% 22% 14% 3% 17% 23% 23% 38% 44% 33% 21%
C04 % Problem Management 29% 33% 22% 30% 32% 32% 38% 21% 21% 23% 51% 34% 55% 51% 39% 28%
D01 % Information Security Strategy Development 17% 16% 32% 15% 26% 22% 12% 7% 31% 20% 33% 10% 21% 19% 75% 21%
D02 % ICT Quality Strategy Development 18% 17% 34% 65% 42% 19% 12% 14% 15% 23% 17% 8% 13% 17% 35% 25%
D03 % Education & Training Provision 22% 23% 32% 46% 37% 14% 10% 9% 16% 69% 20% 11% 13% 20% 24% 21%
D04 % Purchasing 16% 17% 49% 41% 40% 22% 14% 11% 29% 23% 20% 10% 16% 18% 17% 26%
D05 % Sales Proposal Development 16% 15% 44% 40% 22% 20% 17% 13% 57% 23% 13% 8% 22% 12% 22% 30%
D06 % Channel Management 4% 6% 3% 26% 12% 7% 3% 4% 56% 10% 0% 1% 4% 4% 10% 7%
D07 % Sales Management 5% 5% 14% 17% 11% 4% 4% 1% 60% 8% 3% 2% 1% 4% 3% 10%
D08 % Contract Management 13% 13% 39% 38% 35% 13% 6% 2% 49% 13% 6% 6% 0% 12% 13% 25%
D09 % Personnel Development 22% 19% 50% 62% 44% 15% 11% 12% 32% 43% 24% 8% 19% 18% 29% 26%
D10 % Information & Knowledge Management 20% 17% 26% 74% 42% 18% 21% 23% 30% 25% 56% 7% 15% 17% 33% 27%
E01 % Forecast Development 11% 9% 34% 54% 31% 0% 6% 6% 49% 10% 13% 1% 2% 6% 14% 23%
E02 % Project & Portfolio Management 20% 15% 54% 68% 49% 14% 6% 15% 24% 16% 18% 4% 8% 12% 20% 61%
E03 % Risk Management 16% 10% 26% 17% 26% 8% 6% 5% 14% 11% 17% 5% 11% 10% 48% 36%
E04 % Relationship Management 24% 23% 63% 61% 47% 22% 17% 16% 68% 21% 37% 15% 17% 21% 33% 54%
E05 % Process Improvement 23% 18% 55% 34% 63% 14% 8% 5% 26% 24% 28% 8% 26% 17% 39% 29%
E06 % ICT Quality Management 13% 10% 21% 17% 26% 7% 2% 10% 16% 14% 2% 4% 4% 10% 28% 26%
E07 % Business Change Management 18% 15% 44% 65% 41% 13% 5% 4% 30% 14% 16% 6% 14% 15% 26% 45%
E08 % Information Security Management 14% 14% 21% 2% 16% 12% 5% 3% 19% 11% 19% 21% 33% 17% 72% 16%
E09 % IT Governance 18% 16% 63% 26% 43% 17% 2% 5% 25% 19% 12% 9% 9% 17% 56% 27%
ItalyEurope
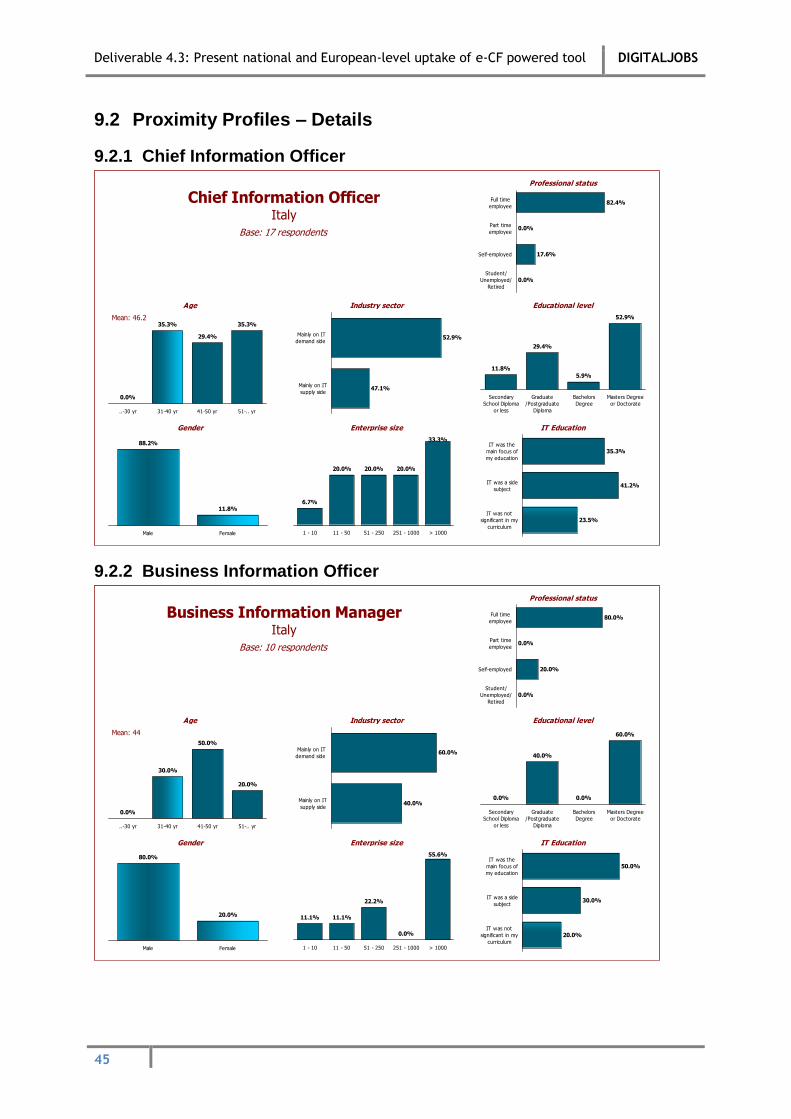
Deliverable 4.3: Present national and European-level uptake of e-CF powered tool DIGITALJOBS
45
9.2 Proximity Profiles – Details
9.2.1 Chief Information Officer
Italy
Chief Information Officer
Base: 17 respondents
Professional status
Gender IT EducationEnterprise size
Age Industry sector Educational level
82.4%
0.0%
17.6%
0.0%
Full time
employee
Part time
employee
Self-employed
Student/
Unemployed/
Retired
11.8%
29.4%
5.9%
52.9%
Secondary
School Diploma
or less
Graduate
/Postgraduate
Diploma
Bachelors
Degree
Masters Degree
or Doctorate
35.3%
41.2%
23.5%
IT was the
main focus of
my education
IT was a side
subject
IT was not
significant in my
curriculum
6.7%
20.0% 20.0% 20.0%
33.3%
1 - 10 11 - 50 51 - 250 251 - 1000 > 1000
52.9%
47.1%
Mainly on IT
demand side
Mainly on IT
supply side0.0%
35.3%
29.4%
35.3%
..-30 yr 31-40 yr 41-50 yr 51-.. yr
Mean: 46.2
11.8%
88.2%
FemaleMale
9.2.2 Business Information Officer
Gender IT EducationEnterprise size
Age Industry sector Educational level
Italy
Business Information Manager
Base: 10 respondents
Professional status
80.0%
0.0%
20.0%
0.0%
Full time
employee
Part time
employee
Self-employed
Student/
Unemployed/
Retired
0.0%
40.0%
0.0%
60.0%
Secondary
School Diploma
or less
Graduate
/Postgraduate
Diploma
Bachelors
Degree
Masters Degree
or Doctorate
50.0%
30.0%
20.0%
IT was the
main focus of
my education
IT was a side
subject
IT was not
significant in my
curriculum
11.1% 11.1%
22.2%
0.0%
55.6%
1 - 10 11 - 50 51 - 250 251 - 1000 > 1000
60.0%
40.0%
Mainly on IT
demand side
Mainly on IT
supply side0.0%
30.0%
50.0%
20.0%
..-30 yr 31-40 yr 41-50 yr 51-.. yr
Mean: 44
20.0%
80.0%
FemaleMale
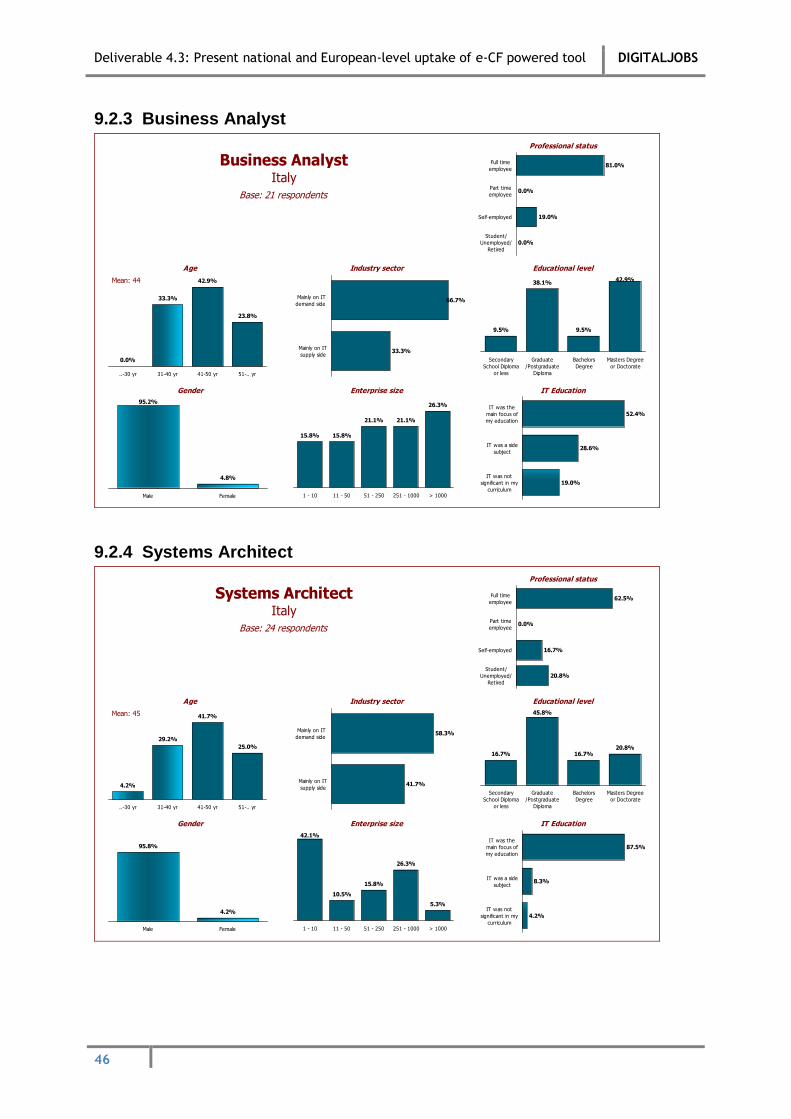
Deliverable 4.3: Present national and European-level uptake of e-CF powered tool DIGITALJOBS
46
9.2.3 Business Analyst
Gender IT EducationEnterprise size
Age Industry sector Educational level
Italy
Business Analyst
Base: 21 respondents
Professional status
81.0%
0.0%
19.0%
0.0%
Full time
employee
Part time
employee
Self-employed
Student/
Unemployed/
Retired
9.5%
38.1%
9.5%
42.9%
Secondary
School Diploma
or less
Graduate
/Postgraduate
Diploma
Bachelors
Degree
Masters Degree
or Doctorate
52.4%
28.6%
19.0%
IT was the
main focus of
my education
IT was a side
subject
IT was not
significant in my
curriculum
15.8% 15.8%
21.1% 21.1%
26.3%
1 - 10 11 - 50 51 - 250 251 - 1000 > 1000
66.7%
33.3%
Mainly on IT
demand side
Mainly on IT
supply side0.0%
33.3%
42.9%
23.8%
..-30 yr 31-40 yr 41-50 yr 51-.. yr
Mean: 44
4.8%
95.2%
FemaleMale
9.2.4 Systems Architect
Gender IT EducationEnterprise size
Age Industry sector Educational level
Italy
Systems Architect
Base: 24 respondents
Professional status
62.5%
0.0%
16.7%
20.8%
Full time
employee
Part time
employee
Self-employed
Student/
Unemployed/
Retired
16.7%
45.8%
16.7%20.8%
Secondary
School Diploma
or less
Graduate
/Postgraduate
Diploma
Bachelors
Degree
Masters Degree
or Doctorate
87.5%
8.3%
4.2%
IT was the
main focus of
my education
IT was a side
subject
IT was not
significant in my
curriculum
42.1%
10.5%
15.8%
26.3%
5.3%
1 - 10 11 - 50 51 - 250 251 - 1000 > 1000
58.3%
41.7%
Mainly on IT
demand side
Mainly on IT
supply side4.2%
29.2%
41.7%
25.0%
..-30 yr 31-40 yr 41-50 yr 51-.. yr
Mean: 45
4.2%
95.8%
FemaleMale
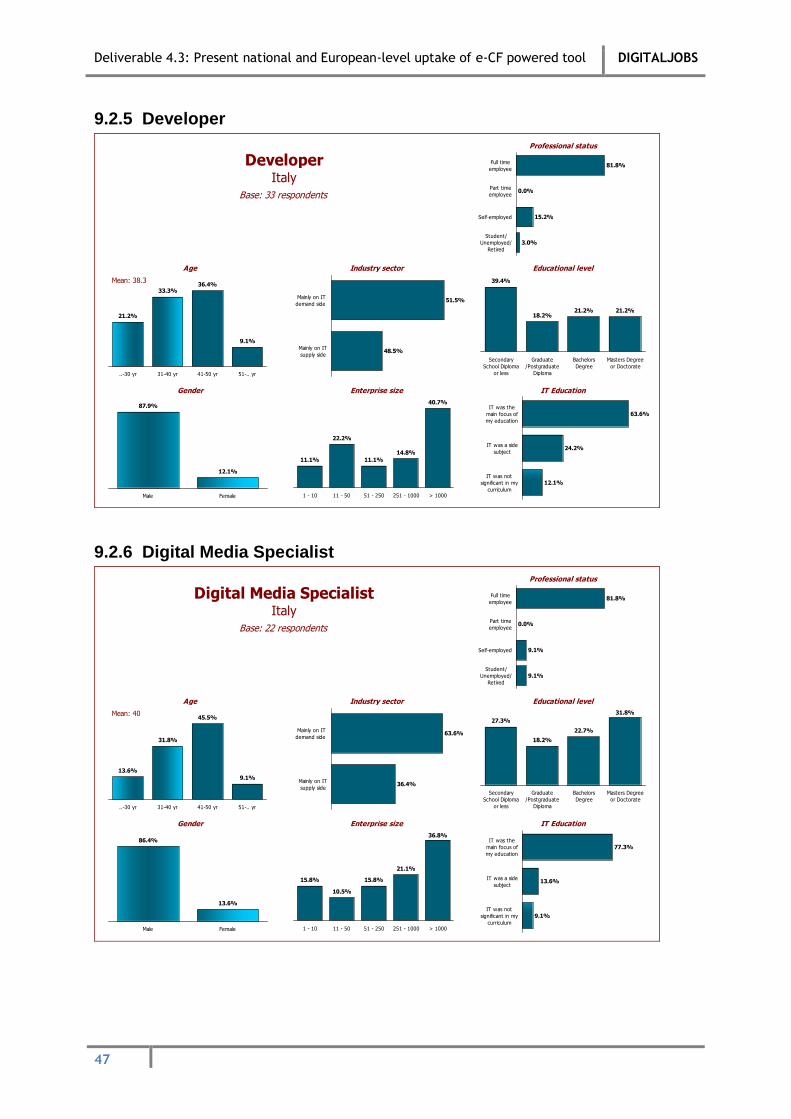
Deliverable 4.3: Present national and European-level uptake of e-CF powered tool DIGITALJOBS
47
9.2.5 Developer
Italy
Developer
Base: 33 respondents
Professional status
Gender IT EducationEnterprise size
Age Industry sector Educational level
81.8%
0.0%
15.2%
3.0%
Full time
employee
Part time
employee
Self-employed
Student/
Unemployed/
Retired
39.4%
18.2%21.2% 21.2%
Secondary
School Diploma
or less
Graduate
/Postgraduate
Diploma
Bachelors
Degree
Masters Degree
or Doctorate
63.6%
24.2%
12.1%
IT was the
main focus of
my education
IT was a side
subject
IT was not
significant in my
curriculum
11.1%
22.2%
11.1%
14.8%
40.7%
1 - 10 11 - 50 51 - 250 251 - 1000 > 1000
51.5%
48.5%
Mainly on IT
demand side
Mainly on IT
supply side
21.2%
33.3%36.4%
9.1%
..-30 yr 31-40 yr 41-50 yr 51-.. yr
Mean: 38.3
12.1%
87.9%
FemaleMale
9.2.6 Digital Media Specialist
Italy
Digital Media Specialist
Base: 22 respondents
Professional status
Gender IT EducationEnterprise size
Age Industry sector Educational level
81.8%
0.0%
9.1%
9.1%
Full time
employee
Part time
employee
Self-employed
Student/
Unemployed/
Retired
27.3%
18.2%
22.7%
31.8%
Secondary
School Diploma
or less
Graduate
/Postgraduate
Diploma
Bachelors
Degree
Masters Degree
or Doctorate
77.3%
13.6%
9.1%
IT was the
main focus of
my education
IT was a side
subject
IT was not
significant in my
curriculum
15.8%
10.5%
15.8%
21.1%
36.8%
1 - 10 11 - 50 51 - 250 251 - 1000 > 1000
63.6%
36.4%
Mainly on IT
demand side
Mainly on IT
supply side
13.6%
31.8%
45.5%
9.1%
..-30 yr 31-40 yr 41-50 yr 51-.. yr
Mean: 40
13.6%
86.4%
FemaleMale

Deliverable 4.3: Present national and European-level uptake of e-CF powered tool DIGITALJOBS
48
9.2.7 Account Manager
Italy
Account Manager
Base: 10 respondents
Professional status
Gender IT EducationEnterprise size
Age Industry sector Educational level
60.0%
0.0%
40.0%
0.0%
Full time
employee
Part time
employee
Self-employed
Student/
Unemployed/
Retired
10.0%
30.0%
10.0%
50.0%
Secondary
School Diploma
or less
Graduate
/Postgraduate
Diploma
Bachelors
Degree
Masters Degree
or Doctorate
50.0%
40.0%
10.0%
IT was the
main focus of
my education
IT was a side
subject
IT was not
significant in my
curriculum
33.3% 33.3%
0.0%
11.1%
22.2%
1 - 10 11 - 50 51 - 250 251 - 1000 > 1000
40.0%
60.0%
Mainly on IT
demand side
Mainly on IT
supply side0.0%
20.0%
60.0%
20.0%
..-30 yr 31-40 yr 41-50 yr 51-.. yr
Mean: 46
10.0%
90.0%
FemaleMale
9.2.8 ICT Trainer
Gender IT EducationEnterprise size
Age Industry sector Educational level
Italy
ICT Trainer
Base: 68 respondents
Professional status
63.2%
10.3%
17.6%
8.8%
Full time
employee
Part time
employee
Self-employed
Student/
Unemployed/
Retired
19.1%
25.0%
20.6%
35.3%
Secondary
School Diploma
or less
Graduate
/Postgraduate
Diploma
Bachelors
Degree
Masters Degree
or Doctorate
61.8%
32.4%
5.9%
IT was the
main focus of
my education
IT was a side
subject
IT was not
significant in my
curriculum
25.9%
13.0%
24.1%
16.7%
20.4%
1 - 10 11 - 50 51 - 250 251 - 1000 > 1000
50.0%
50.0%
Mainly on IT
demand side
Mainly on IT
supply side2.9%
25.0%
41.2%
30.9%
..-30 yr 31-40 yr 41-50 yr 51-.. yr
Mean: 45.9
13.2%
86.8%
FemaleMale

Deliverable 4.3: Present national and European-level uptake of e-CF powered tool DIGITALJOBS
49
9.2.9 Database Administrator
Gender IT EducationEnterprise size
Age Industry sector Educational level
Italy
Database Administrator
Base: 22 respondents
Professional status
54.5%
4.5%
31.8%
9.1%
Full time
employee
Part time
employee
Self-employed
Student/
Unemployed/
Retired
31.8%
22.7%
18.2%
27.3%
Secondary
School Diploma
or less
Graduate
/Postgraduate
Diploma
Bachelors
Degree
Masters Degree
or Doctorate
68.2%
31.8%
0.0%
IT was the
main focus of
my education
IT was a side
subject
IT was not
significant in my
curriculum
13.3% 13.3%
20.0% 20.0%
33.3%
1 - 10 11 - 50 51 - 250 251 - 1000 > 1000
54.5%
45.5%
Mainly on IT
demand side
Mainly on IT
supply side
31.8%
22.7%
27.3%
18.2%
..-30 yr 31-40 yr 41-50 yr 51-.. yr
Mean: 38.4
9.1%
90.9%
FemaleMale
9.2.10 Systems Administrator
Italy
Systems Administrator
Base: 68 respondents
Professional status
Gender IT EducationEnterprise size
Age Industry sector Educational level
76.5%
4.4%
10.3%
8.8%
Full time
employee
Part time
employee
Self-employed
Student/
Unemployed/
Retired
32.4%35.3%
19.1%
13.2%
Secondary
School Diploma
or less
Graduate
/Postgraduate
Diploma
Bachelors
Degree
Masters Degree
or Doctorate
66.2%
26.5%
7.4%
IT was the
main focus of
my education
IT was a side
subject
IT was not
significant in my
curriculum
13.6%11.9%
18.6%
11.9%
44.1%
1 - 10 11 - 50 51 - 250 251 - 1000 > 1000
54.4%
45.6%
Mainly on IT
demand side
Mainly on IT
supply side
13.2%
39.7% 39.7%
7.4%
..-30 yr 31-40 yr 41-50 yr 51-.. yr
Mean: 39.3
14.7%
85.3%
FemaleMale
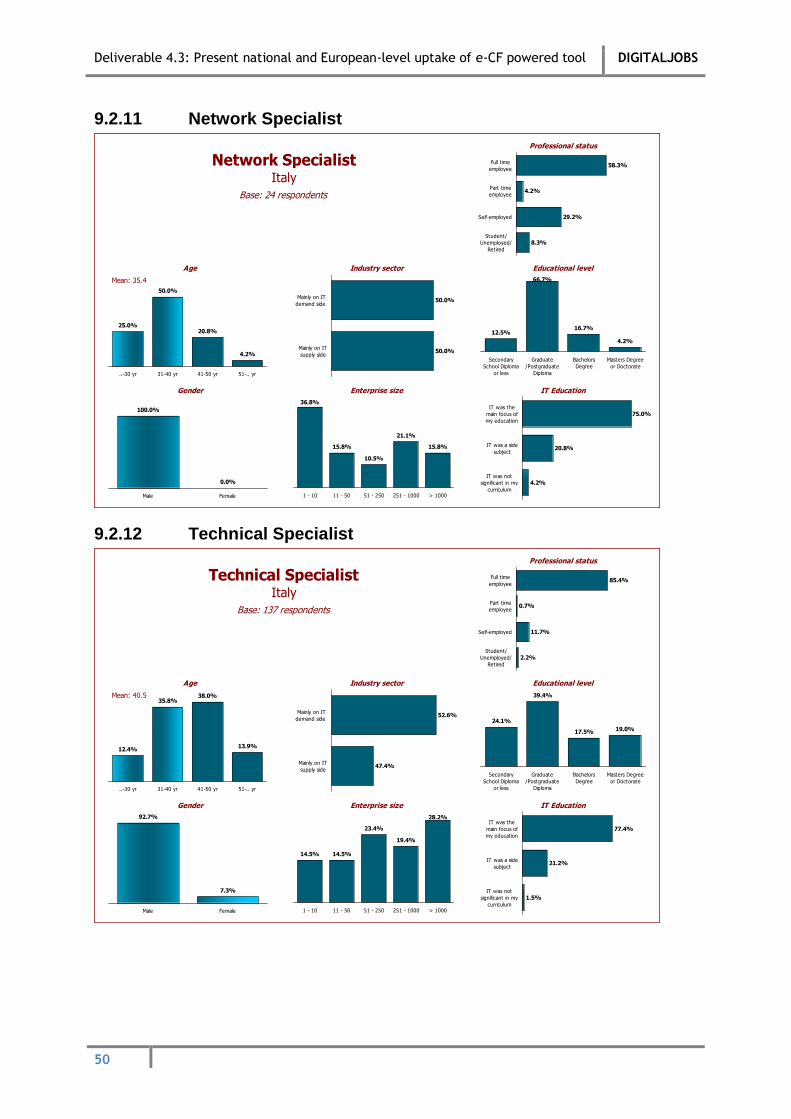
Deliverable 4.3: Present national and European-level uptake of e-CF powered tool DIGITALJOBS
50
9.2.11 Network Specialist
Gender IT EducationEnterprise size
Age Industry sector Educational level
Italy
Network Specialist
Base: 24 respondents
Professional status
58.3%
4.2%
29.2%
8.3%
Full time
employee
Part time
employee
Self-employed
Student/
Unemployed/
Retired
12.5%
66.7%
16.7%
4.2%
Secondary
School Diploma
or less
Graduate
/Postgraduate
Diploma
Bachelors
Degree
Masters Degree
or Doctorate
75.0%
20.8%
4.2%
IT was the
main focus of
my education
IT was a side
subject
IT was not
significant in my
curriculum
36.8%
15.8%
10.5%
21.1%
15.8%
1 - 10 11 - 50 51 - 250 251 - 1000 > 1000
50.0%
50.0%
Mainly on IT
demand side
Mainly on IT
supply side
25.0%
50.0%
20.8%
4.2%
..-30 yr 31-40 yr 41-50 yr 51-.. yr
Mean: 35.4
0.0%
100.0%
FemaleMale
9.2.12 Technical Specialist
Italy
Technical Specialist
Base: 137 respondents
Professional status
Gender IT EducationEnterprise size
Age Industry sector Educational level
85.4%
0.7%
11.7%
2.2%
Full time
employee
Part time
employee
Self-employed
Student/
Unemployed/
Retired
24.1%
39.4%
17.5% 19.0%
Secondary
School Diploma
or less
Graduate
/Postgraduate
Diploma
Bachelors
Degree
Masters Degree
or Doctorate
77.4%
21.2%
1.5%
IT was the
main focus of
my education
IT was a side
subject
IT was not
significant in my
curriculum
14.5% 14.5%
23.4%
19.4%
28.2%
1 - 10 11 - 50 51 - 250 251 - 1000 > 1000
52.6%
47.4%
Mainly on IT
demand side
Mainly on IT
supply side
12.4%
35.8%38.0%
13.9%
..-30 yr 31-40 yr 41-50 yr 51-.. yr
Mean: 40.5
7.3%
92.7%
FemaleMale

Deliverable 4.3: Present national and European-level uptake of e-CF powered tool DIGITALJOBS
51
9.2.13 ICT Security Manager
Gender IT EducationEnterprise size
Age Industry sector Educational level
Italy
ICT Security Manager
Base: 10 respondents
Professional status
80.0%
0.0%
20.0%
0.0%
Full time
employee
Part time
employee
Self-employed
Student/
Unemployed/
Retired
10.0%
20.0%
40.0%
30.0%
Secondary
School Diploma
or less
Graduate
/Postgraduate
Diploma
Bachelors
Degree
Masters Degree
or Doctorate
40.0%
50.0%
10.0%
IT was the
main focus of
my education
IT was a side
subject
IT was not
significant in my
curriculum
28.6%
0.0%
42.9%
14.3% 14.3%
1 - 10 11 - 50 51 - 250 251 - 1000 > 1000
70.0%
30.0%
Mainly on IT
demand side
Mainly on IT
supply side
20.0%
50.0%
20.0%
10.0%
..-30 yr 31-40 yr 41-50 yr 51-.. yr
Mean: 38
0.0%
100.0%
FemaleMale
9.2.14 Project Manager
Gender IT EducationEnterprise size
Age Industry sector Educational level
Italy
Project Manager
Base: 29 respondents
Professional status
75.9%
0.0%
20.7%
3.4%
Full time
employee
Part time
employee
Self-employed
Student/
Unemployed/
Retired
10.3%
31.0%
27.6%
31.0%
Secondary
School Diploma
or less
Graduate
/Postgraduate
Diploma
Bachelors
Degree
Masters Degree
or Doctorate
58.6%
31.0%
10.3%
IT was the
main focus of
my education
IT was a side
subject
IT was not
significant in my
curriculum
8.0%
0.0%
28.0%
20.0%
44.0%
1 - 10 11 - 50 51 - 250 251 - 1000 > 1000
48.3%
51.7%
Mainly on IT
demand side
Mainly on IT
supply side6.9%
17.2%
58.6%
17.2%
..-30 yr 31-40 yr 41-50 yr 51-.. yr
Mean: 44.3
13.8%
86.2%
FemaleMale

AustriaOesterreichisches Computer Gesellschaft (OCG)
BelgiumFederation of Belgian Informatics Associations (FBVI-FAIB)
Bosnia and HerzegovinaAssociation of Informatics in Bosnia and Herze-govina
BulgariaUnion of Automation and Informatics (UAI)
CroatiaCroatian Information Technology Association (CITA)
CyprusCyprus Computer Society (CCS)
Czech RepublicCzech Society for Cybernetics and Informatics (CSKI)
DenmarkDansk IT
FinlandFinnish Information Processing Association (TIVIA)
GermanyGesellschaft für Informatik e.V – German Informatics (GI)
GermanyInformationstechnische Gesellschaft im Verband der Elektrotechnik Elektronik Informationstechnik (VDE)
GreeceHellenic Professionals Informatics Society (HEPIS)
HungaryJohn von Neumann Computer Society (NJSzT)
IcelandIcelandic Society for Information Processing (ISIP)
IrelandThe Irish Computer Society (ICS)
ItalyAssociazione Italiana per l’Informatica ed il Calcolo Automatico (AICA)
LatviaLatvian Information Technology & Telecommunica-tions Association (LIKTA)
LithuaniaLietuvos Kompiuterininku Sajunga (LIKS)
LuxembourgAssociation Luxembourgoise des Ingenieurs (ALI)
MaltaComputer Society of Malta (CSM)
MontenegroDrustvo Informatičara Crne Gore (DICG)
The NetherlandsVereniging van Register Informatica (VRI) / Neder-lands Genootschap voor Informatica (NGI
NorwayDen Norske Dataforening (DND)
PolandPolskie Towarzystwo Informatyczne - Polish Infor-mation Processing Society (PTI-PIPS)
RomaniaAsociatia Pentru Tehnologia Informatiei si Comuni-catii (ATIC)
SerbiaSerbian Information Technology Association (JISA)
SlovakiaSlovak Society for Computer Science (SSCS)
SloveniaSlovenian Society Informatika (SSI)
SpainAsociación de Técnicos de Informática (ATI)
SwedenDF Dataforeningen i Sverige (Swedish Computer Society)
SwitzerlandSwiss Informatics Society (SI)
TurkeyInformatics Association of Turkey (IAT)
United KingdomBCS - The Chartered Institute for IT
The Members of CEPIS

Telephone: +32 (0)2 772 18 36Fax: +32 (0)2 646 30 32E-mail: [email protected]: www.cepis.org
Avenue Roger Vandendriessche 181150 Brussels, Belgium
Council of European Professional Informatics Societies (CEPIS)
About CEPIS uropeT
The Council of European Professional Informatics Societies (CEPIS) is a non-profit organisation seeking to improve and promote a high standard among informatics professionals in recognition of the impact that Informatics has on employ-ment, business and society.
CEPIS represents 33 Member Societies in 32 countries. Established in 1989, CEPIS has grown to represent over 450,000 informatics professionals in Europe and beyond.