e Compaction
61
Compaction
-
Upload
ankush-jain -
Category
Documents
-
view
223 -
download
0
Transcript of e Compaction

8/13/2019 e Compaction
http://slidepdf.com/reader/full/e-compaction 1/61
Compaction

8/13/2019 e Compaction
http://slidepdf.com/reader/full/e-compaction 2/61
Compaction
Compaction is the densification of soils by
the application of mechanical energy.
It is the process by which the soil grains get
rearranged more closely, the volume of air
voids get reduced, and the density of soilincreases.

8/13/2019 e Compaction
http://slidepdf.com/reader/full/e-compaction 3/61
• The objective of compaction is the improvementof the engineering properties of the soil mass.
Advantages:
• Settlements can be reduced or prevented
• Soil strength increase and slope stability can be
improved• Bearing capacity of pavement subgrade can be
improved
• Reduces the coefficient of permeability
• Reduces the liquefaction potential• Undesirable volume changes caused by frost
action, swelling and shrinkage may becontrolled.

8/13/2019 e Compaction
http://slidepdf.com/reader/full/e-compaction 4/61

8/13/2019 e Compaction
http://slidepdf.com/reader/full/e-compaction 5/61
Laboratory tests
• The aim of the laboratory tests is tosimulate the field compaction conditions.
• R.R. Proctor in early 1930’s developed the
principles of compaction.• Proctor established that compaction is a
function of four variables:
– Dry density – Water content
– Compactive effort and
– Soil type

8/13/2019 e Compaction
http://slidepdf.com/reader/full/e-compaction 6/61
Laboratory tests- cont.
• Laboratory tests:
- Dynamic compaction or impact
- Kneading compaction- Static compaction

8/13/2019 e Compaction
http://slidepdf.com/reader/full/e-compaction 7/61
Dynamic compaction
Standard Proctor Test AASHTO (1978) T99
ASTM (1980) D 698
IS 2720- Part 7 and 8
• The test is carried on soil passing 19 mm soil
• Five or more samples are prepared at different water
content and allowed for moisture equillibration
• The dia of the flat rammer head = 0.5 dia of the mould
8/13/2019 e Compaction
http://slidepdf.com/reader/full/e-compaction 8/61
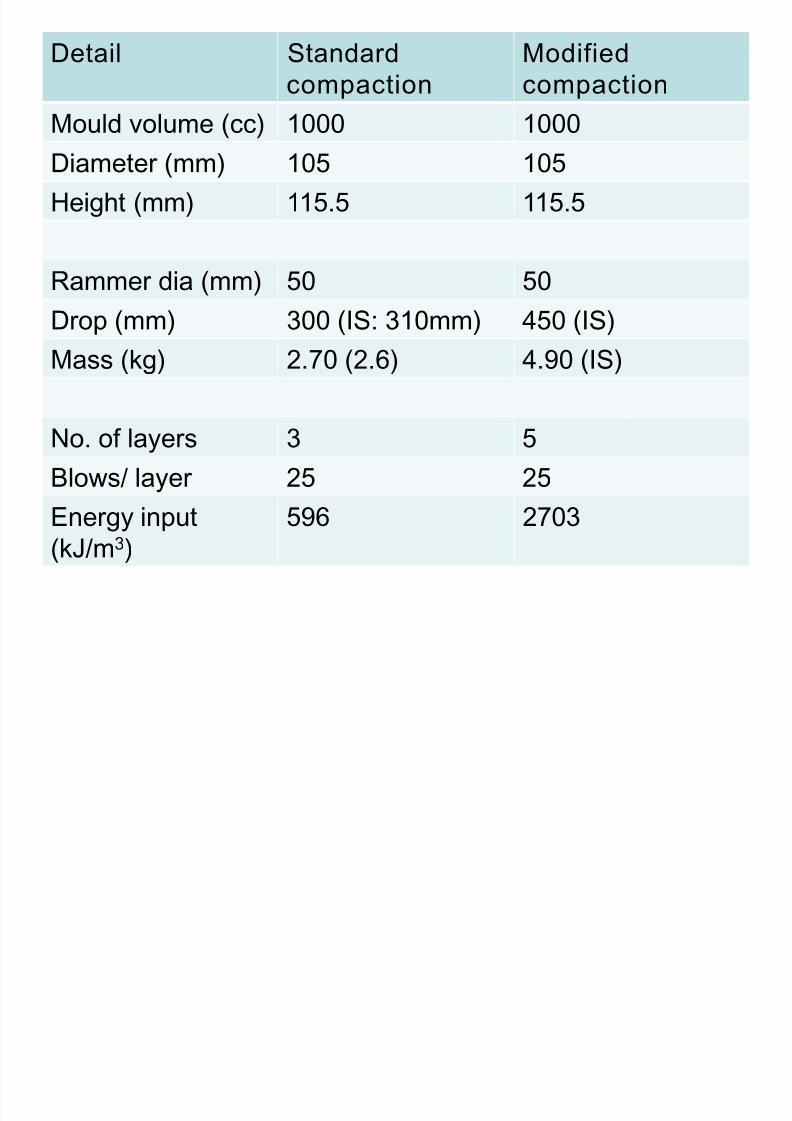
Detail Standard
compaction
Modified
compaction
Mould volume (cc) 1000 1000
Diameter (mm) 105 105
Height (mm) 115.5 115.5
Rammer dia (mm) 50 50
Drop (mm) 300 (IS: 310mm) 450 (IS)
Mass (kg) 2.70 (2.6) 4.90 (IS)
No. of layers 3 5
Blows/ layer 25 25
Energy input
(kJ/m3)
596 2703

8/13/2019 e Compaction
http://slidepdf.com/reader/full/e-compaction 9/61
Compaction test apparatus

8/13/2019 e Compaction
http://slidepdf.com/reader/full/e-compaction 10/61
Standard and modif ied Proctor compaction curves
MDD
OMC

8/13/2019 e Compaction
http://slidepdf.com/reader/full/e-compaction 11/61
Theoretical curves for different degree ofsaturations can be given by:
wd
+=1
γ γ
V
W =γ
S
wGG
S
wS
d
+
=
1
γ γ

8/13/2019 e Compaction
http://slidepdf.com/reader/full/e-compaction 12/61
Water content-dry density relationships for eight soils compacted
according to the Standard Proctor mehtod

8/13/2019 e Compaction
http://slidepdf.com/reader/full/e-compaction 13/61
Water content-density relationship indicating the increased density resulting
from the addition of water and that due to the applied compaction effort. Soil
is a silty clay LL = 37, PI = 14, Standard Proctor Compaction.

8/13/2019 e Compaction
http://slidepdf.com/reader/full/e-compaction 14/61
Comparision of field and laboratory compaction.
1. Laboratory static compaction, 2000 psi
2. Modified Proctor
3. Standard Proctor
4. Laboratory Static compaction, 200 psi
5. Field compaction, rubber-tired load, 6 coverages
6. Field compaction, sheepfoot roller, 6 passesNote: static compaction from top and bottom of soil sample.

8/13/2019 e Compaction
http://slidepdf.com/reader/full/e-compaction 15/61
Properties and Structure of Compacted
Cohesive Soils
The structure and thus the engineering
properties of compacted cohesive soils will
depend greatly on:
– the method or type of compaction
– the compactive effort applied
– the soil type, and
– on the molding water content

8/13/2019 e Compaction
http://slidepdf.com/reader/full/e-compaction 16/61

8/13/2019 e Compaction
http://slidepdf.com/reader/full/e-compaction 17/61
Change in permeability with molding water content

8/13/2019 e Compaction
http://slidepdf.com/reader/full/e-compaction 18/61
Change in
compressibility withmolding water content

8/13/2019 e Compaction
http://slidepdf.com/reader/full/e-compaction 19/61
Shrinkage as a function
of water content and
type of compaction
Swelling of compacted clays is
greater for those compacted dry
of optimum.
Opposite is true for shrinkage
8/13/2019 e Compaction
http://slidepdf.com/reader/full/e-compaction 20/61
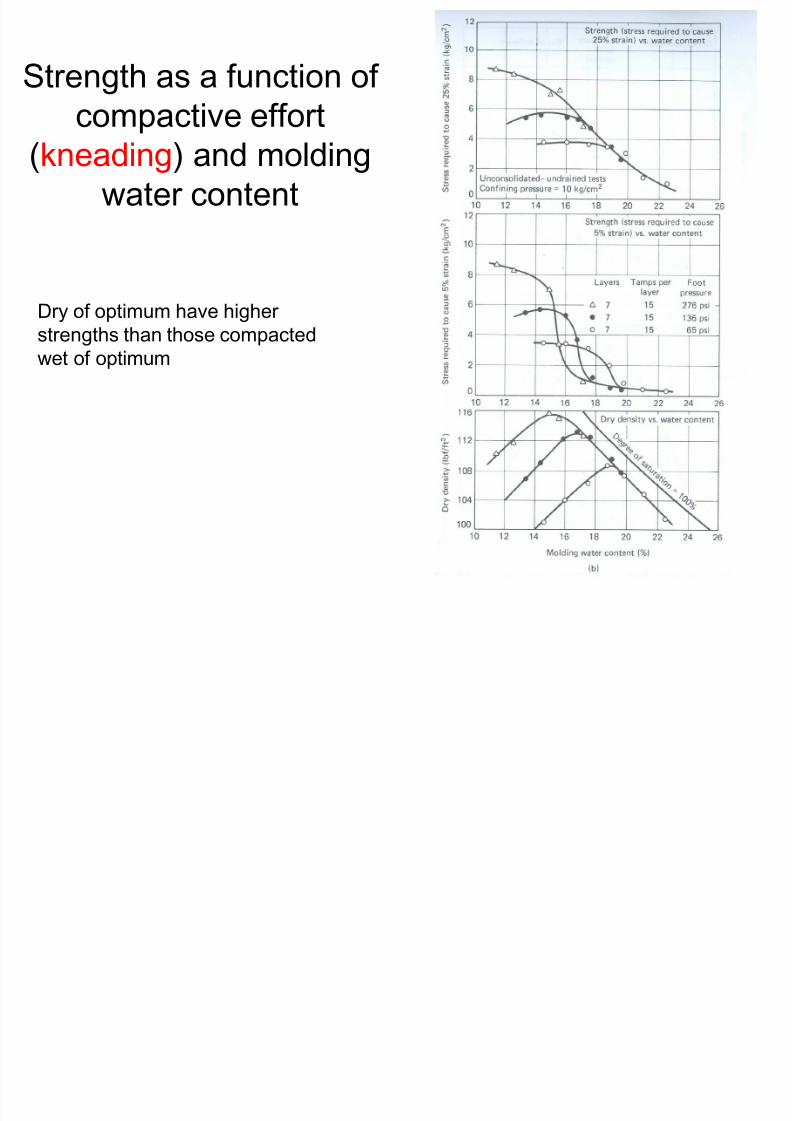
Strength as a function of
compactive effort
(kneading) and molding
water content
Dry of optimum have higher
strengths than those compacted
wet of optimum

8/13/2019 e Compaction
http://slidepdf.com/reader/full/e-compaction 21/61
Strength as measured
by the CBR and the dry
density versus watercontent for laboratory
impact compaction

8/13/2019 e Compaction
http://slidepdf.com/reader/full/e-compaction 22/61
Comparison of soil properties between dry of optimum
and wet of optimum compaction.

8/13/2019 e Compaction
http://slidepdf.com/reader/full/e-compaction 23/61
Field Compaction Equipment
and Procedures

8/13/2019 e Compaction
http://slidepdf.com/reader/full/e-compaction 24/61
24
Equipment
Smooth-wheel roller (drum) • 100% coverage under the
wheel
• Contact pressure up to 380 kPa
• Can be used on all soil types except for rocky soils.
• Compactive effort: static weight
• The most common use of large
smooth wheel rollers is for
proof-rolling subgrades and
compacting asphalt pavement.
Holtz and Kovacs, 1981

8/13/2019 e Compaction
http://slidepdf.com/reader/full/e-compaction 25/61

8/13/2019 e Compaction
http://slidepdf.com/reader/full/e-compaction 26/61
26
Equipment (Cont.)
Sheepsfoot rollers • Has many round or rectangular
shaped protrusions or “feet”
attached to a steel drum
• 8% ~ 12 % coverage
• Contact pressure is from 1400
to 7000 kPa
• It is best suited for clayed soils.
• Compactive effort: static weight
and kneading.
Holtz and Kovacs, 1981

8/13/2019 e Compaction
http://slidepdf.com/reader/full/e-compaction 27/61
27
Equipment (Cont.)
Tamping foot roller • About 40% coverage
• Contact pressure is from 1400
to 8400 kPa
• It is best for compacting fine-grained soils (silt and clay).
• Compactive effort: static weight
and kneading.
Holtz and Kovacs, 1981

8/13/2019 e Compaction
http://slidepdf.com/reader/full/e-compaction 28/61
28
Equipment (Cont.)
Mesh (or grid pattern) roller • 50% coverage
• Contact pressure is from 1400
to 6200 kPa
• It is ideally suited forcompacting rocky soils, gravels,
and sands. With high towing
speed, the material is vibrated,
crushed, and impacted.
• Compactive effort: static weightand vibration.
Holtz and Kovacs, 1981

8/13/2019 e Compaction
http://slidepdf.com/reader/full/e-compaction 29/61
29
Equipment (Cont.)
Vibrating drum on smooth-wheel roller • Vertical vibrator attached to
smooth wheel rollers.
• The best explanation of why
roller vibration causes
densification of granular soils isthat particle rearrangement
occurs due to cyclic
deformation of the soil
produced by the oscillations of
the roller.
• Compactive effort: static weight
and vibration.
• Suitable for granular soilsHoltz and Kovacs, 1981

8/13/2019 e Compaction
http://slidepdf.com/reader/full/e-compaction 30/61
Compaction results on 30 cm layers of silty sand, with and without vibration,
using a 7700 kg towed vibratory rol ler (Holtz and Kovacs 1981)

8/13/2019 e Compaction
http://slidepdf.com/reader/full/e-compaction 31/61
31
Variables-Vibratory Compaction
There are many variables which control the vibratorycompaction or densification of soils.
Characteristics of the compactor:(1) Mass, size
(2) Operating frequency and frequency range
Characteristics of the soil:(1) Initial density
(2) Grain size and shape
(3) Water content
Construction procedures:(1) Number of passes of the roller
(2) Lift thickness
(3) Frequency of operation vibrator
(4) Towing speedHoltz and Kovacs, 1981

8/13/2019 e Compaction
http://slidepdf.com/reader/full/e-compaction 32/61
32
Frequency
Holtz and Kovacs, 1981
The frequency atwhich a maximum
density is achieved is
called the optimum
frequency.

8/13/2019 e Compaction
http://slidepdf.com/reader/full/e-compaction 33/61
33
Roller Travel Speed
For a given number of
passes, a higher density is
obtained if the vibrator is
towed more slowly.
Holtz and Kovacs, 1981
Effect of roller travel speed
on amount of compactionwith 7700 kg towed
vibratory roller

8/13/2019 e Compaction
http://slidepdf.com/reader/full/e-compaction 34/61
34
Roller Passes
Holtz and Kovacs,1981
When compacting
past five or so
coverages, there
is not a great
increase in
density
•240 cm thick layer
of northern Indiana
dune sand
•5670 kg roller
operating at a
frequency of 27.5
Hz.

8/13/2019 e Compaction
http://slidepdf.com/reader/full/e-compaction 35/61

8/13/2019 e Compaction
http://slidepdf.com/reader/full/e-compaction 36/61
36
Dynamic Compaction
Dynamic compaction was first used in
Germany in the mid-1930’s.
The depth of influence D, in meters, of
soil undergoing compaction is
conservatively given by
D ≈ ½ (Wh)1/2
W = mass of falling weight in metric tons.
h = drop height in meters
From Holtz and Kovacs, 1981

8/13/2019 e Compaction
http://slidepdf.com/reader/full/e-compaction 37/61
37
Vibroflotation
From Das,
1998
Vibroflotation is a technique
for in situ densification of
thick layers of loose granular
soil deposits. It was
developed in Germany in the
1930s.
Vib fl t ti P d

8/13/2019 e Compaction
http://slidepdf.com/reader/full/e-compaction 38/61
38
Vibroflotation-Procedures
Stage1: The jet at the bottom of the Vibroflot is turned on and lowered into the ground
Stage2: The water jet creates a quick condition in the soil. It allows the vibrating unit to
sink into the ground
Stage 3: Granular material is poured from the top of the hole. The water from the lower
jet is transferred to he jet at the top of the vibrating unit. This water carries the granular
material down the hole
Stage 4: The vibrating unit is gradually raised in about 0.3-m lifts and held vibrating for
about 30 seconds at each lift. This process compacts the soil to the desired unitwei ht.
From Das,
1998

8/13/2019 e Compaction
http://slidepdf.com/reader/full/e-compaction 39/61
39
Equipment-Summary
Holtz and Kovacs, 1981

8/13/2019 e Compaction
http://slidepdf.com/reader/full/e-compaction 40/61

8/13/2019 e Compaction
http://slidepdf.com/reader/full/e-compaction 41/61

8/13/2019 e Compaction
http://slidepdf.com/reader/full/e-compaction 42/61
Smooth Wheel Roller

8/13/2019 e Compaction
http://slidepdf.com/reader/full/e-compaction 43/61
Rubber-tired roller

8/13/2019 e Compaction
http://slidepdf.com/reader/full/e-compaction 44/61
Vibrating drum on smooth-wheel roller

8/13/2019 e Compaction
http://slidepdf.com/reader/full/e-compaction 45/61

8/13/2019 e Compaction
http://slidepdf.com/reader/full/e-compaction 46/61

8/13/2019 e Compaction
http://slidepdf.com/reader/full/e-compaction 47/61
Field Compaction
Control and Specifications

8/13/2019 e Compaction
http://slidepdf.com/reader/full/e-compaction 48/61
48
Control Parameters
• Dry density and water content correlate well with the
engineering properties, and thus they are convenient
construction control parameters.
• Since the objective of compaction is to stabilize soils and
improve their engineering behavior, it is important to keep
in mind the desired engineering properties of the fill, not
just its dry density and water content. This point is often
lost in the earthwork construction control.
From Holtz and Kovacs, 1981

8/13/2019 e Compaction
http://slidepdf.com/reader/full/e-compaction 49/61
49
Design-Construct Procedures
• Laboratory tests are conducted on samples of the
proposed borrow materials to define the properties
required for design.
• After the earth structure is designed, the compaction
specifications are written. Field compaction control tests
are specified, and the results of these become the
standard for controlling the project.
From Holtz and Kovacs, 1981

8/13/2019 e Compaction
http://slidepdf.com/reader/full/e-compaction 50/61
50
Specifications
(1) End-product specifications
•This specification is used for most highways and building
foundation, as long as the contractor is able to obtain the
specified relative compaction , how he obtains it doesn’t
matter, nor does the equipment he uses.
•Care the results only !
•(2) Method specifications
•The type and weight of roller, the number of passes of that
roller, as well as the lift thickness are specified. A maximum
allowable size of material may also be specified.
•It is typically used for large compaction project.
From Holtz and Kovacs, 1981

8/13/2019 e Compaction
http://slidepdf.com/reader/full/e-compaction 51/61
51
Relative Compaction (R.C.)
%100.C.R laboratorymaxd
filed d ×
ρ
ρ=
−
−
r D2.080.C.R +=
Relative compaction or percent compaction
Correlation between relative compaction (R.C.) and
the relative density Dr
It is a statistical
result based on 47soil samples.
As Dr = 0, R.C. is
80Typical required R.C. = 90% ~ 95%
Determine the Water Content (in Field)

8/13/2019 e Compaction
http://slidepdf.com/reader/full/e-compaction 52/61
52
Determine the Water Content (in Field)
Control
(1) Relative compaction
(2) Water content (dry side or wet
side)
Holtz and Kovacs, 1981
Note: the engineering
properties may be different
between the compacted
sample at the dry side and
at the wet side.
100% saturation
Water content w %
wopt
D r y d e n s i t y , ρ d
ρd max
Line ofoptimums
90% R.C.
a c
Increase
compactio
n energy
b
Destructive

8/13/2019 e Compaction
http://slidepdf.com/reader/full/e-compaction 53/61
53
Destructive
Methods
Holtz and Kovacs, 1981
Methods
(a) Sand cone
(b) Balloon
(c) Oil (or water)
method
Calculations•Know Ms and Vt
•Get ρd field and w (water
content)
•Compare ρd field with ρd max-lab
and calculate relativecompaction R.C.
(a)
(b)
(c)
Sand pouring cylinder used in sand replacement

8/13/2019 e Compaction
http://slidepdf.com/reader/full/e-compaction 54/61
Sand pouring cylinder used in sand replacement
method

8/13/2019 e Compaction
http://slidepdf.com/reader/full/e-compaction 55/61

8/13/2019 e Compaction
http://slidepdf.com/reader/full/e-compaction 56/61
56
Destructive Methods (Cont.)
•Sometimes, the laboratory maximum density may not be
known exactly. It is not uncommon, especially in highway
construction, for a series of laboratory compaction tests to
be conducted on “representative” samples of the borrow
materials for the highway. If the soils at the site are highlyvaried, there will be no laboratory results to be compared
with. It is time consuming and expensive to conduct a new
compaction curve. The alternative is to implement a field
check point, or 1 point Proctor test.
Holtz and Kovacs, 1981
Destructive Methods
(Cont )

8/13/2019 e Compaction
http://slidepdf.com/reader/full/e-compaction 57/61
57
Destructive Methods (Cont.)
Check Point Method
Water content w
wopt
D r y d e n s i t y , ρ d
ρd max
100% saturation
Line of
optimums
A
B
M
C
X
Y(no)
•1 point Proctor test
•Known compaction
curves A, B, C
•Field check point X
(it should be on the
dry side of
optimum)
Holtz and Kovacs, 1981

8/13/2019 e Compaction
http://slidepdf.com/reader/full/e-compaction 58/61
58
Destructive Methods (Cont.)
• The measuring error is mainly from the determinationof the volume of the excavated material.
For example,
• For the sand cone method, the vibration from nearby working
equipment will increase the density of the sand in the hole, whichwill gives a larger hole volume and a lower field density.
• If the compacted fill is gravel or contains large gravel particles. Any kind of unevenness in the walls of the hole causes asignificant error in the balloon method.
• If the soil is coarse sand or gravel, none of the liquid methodsworks well, unless the hole is very large and a polyethylenesheet is used to contain the water or oil.
tsfield d V/M=ρ −
Holtz and Kovacs, 1981

8/13/2019 e Compaction
http://slidepdf.com/reader/full/e-compaction 59/61
59
Nondestructive Methods
Holtz and Kovacs, 1981
Nuclear density meter
(a) Direct transmission
(b) Backscatter
(c) Air gap
(a)
(b)
(c)
Principles
Density
The Gamma radiation is scattered by the
soil particles and the amount of scatter is
proportional to the total density of the
material. The Gamma radiation is typically
provided by the radium or a radioactiveisotope of cesium.
Water content
The water content can be determined based
on the neutron scatter by hydrogen atoms.
Typical neutron sources are americium-beryllium isotopes.

8/13/2019 e Compaction
http://slidepdf.com/reader/full/e-compaction 60/61

8/13/2019 e Compaction
http://slidepdf.com/reader/full/e-compaction 61/61
References
Holtz, R.D. and Kovacs, W.D. (1981).
An Introduction to Geotechnical
Engineering, Prentice Hall.