E bulletin Spring 2010-FINAL - Purdue Agriculture 2010... · 2 Downsize or Paczol), uniconazole...
18
Spring 2010 Volume 4 • Issue 1 IFGA Updates Purdue Floriculture online: http://flowers.hort.purdue.edu IFGA Updates . . . . . . . . . . . . . . . 1 Purdue Research Update: Bark, but Not Rice Hulls, Affect PGR Drenches . . . . 1 Scheduling Bedding Pants . . . . . . . . 3 Cornell Research Update: Ethylene in the Greenhouse: Symptoms of Short and Long Term Exposure . . . . . . . . . . . . . . . 4 Financial Benchmark Analysis for Wholesale Operations using an Internet- Based System . . . . . . . . . . . . . . . 8 The Appeal of Biodegradable Packaging to Floral Consumers . . . . . . . . . . . . . 10 Pest Control Materials that may be Used on Greenhouse-Grown Herbs . . . . . . 12 The Price of Fungicide Success . . . . . . 13 Purdue Research Update: Evaluation of Phytotoxicity of SuffOil-X and BW533 . 15 Upcoming Events . . . . . . . . . . . . . 17 Dr. Roberto G. Lopez, Assist. Professor and Floriculture Extension Specialist Dear flower growers, businesses, distributors, organizations and colleagues, The IFGA board recently met in West Lafayette to discuss the future of the organization. We are excited to announce that beginning in 2011, the 29th Annual IFGA Conference will be held in mid-February and rotate to a different host greenhouse each year. Mark your calendars, as the conference will be held in the Indianapolis area on February 16, 2011. For 2010, the annual conference and golf outing will remain in West Lafayette. The educational sessions will be on Wednesday, October 6th from 1 to 5 PM at the University Plaza Hotel. We have made a few changes that we hope you will enjoy. From 5 to 10 PM we will have an informal social and awards presentation at the University Plaza Hotel atrium instead of the banquet. For the golfers in the group, we will have the golf tournament at 9 AM on Thursday, October 7th at the Elks Country Club. Due to the low turnout in 2009 and 2010, the IFGA will no longer be part of the Indiana Green Expo (IGE). However, IFGA members are encouraged to attend the Indiana Horticulture Congress on January 18 to 20, 2011 (more details to follow). The board would also like to congratulate the recipients of the 2009 IFGA Allen Hammer Scholarship which was awarded to two Purdue Horticulture students. Alicia Aldridge, an undergraduate junior majoring in landscape horticulture and design and Ariana Torres, a graduate M.S. student in floriculture production each received a $750 scholarship and a plaque. In addition, IFGA partially funded a Purdue floriculture research project titled, “Effects of Daily Light Integral during Propagation on Rooting and Flowering of Herbaceous Floriculture Crops.” IFGA President, Steve Dewald of Dewald Gardens and I both presented the IFGA Floriculture Person of the Year Award to Tim Galema of Galema’s Greenhouses in West Lafayette for his many years of dedication to the floriculture industry in Indiana. Purdue Research Update - Bark, but Not Rice Hulls, Affect PGR Drenches By Christopher J. Currey 1 , Diane M. Camberato 2 , Ariana P. Torres 1 and Dr. Roberto G. Lopez 3 Graduate Student 1 , Research Technician 2 , Assist. Professor and Floriculture Extension Specialist 3 Plant growth retardants (PGRs) are commonly applied in our industry to produce compact and marketable plants. Though there are a variety of application methods, PGRs are usually applied using sprays or drenches. Drenches involve applying a relatively large volume of a PGR solution at a low concentration directly to the growing medium. Compared to sprays, benefits associated with media drenching include more uniform results and increased, long-lasting efficacy from a single application. PGRs with active ingredients including paclobutrazol (Piccolo, Bonzi,
Transcript of E bulletin Spring 2010-FINAL - Purdue Agriculture 2010... · 2 Downsize or Paczol), uniconazole...

Spring 2010Volume 4 • Issue 1
IFGA Updates
Purdue Floriculture online: http://flowers.hort.purdue.edu
IFGA Updates . . . . . . . . . . . . . . . 1
Purdue Research Update: Bark, but Not Rice Hulls, Affect PGR Drenches . . . . 1
Scheduling Bedding Pants . . . . . . . . 3
Cornell Research Update: Ethylene in the Greenhouse: Symptoms of Short and Long Term Exposure . . . . . . . . . . . . . . . 4
Financial Benchmark Analysis for Wholesale Operations using an Internet-Based System . . . . . . . . . . . . . . . 8
The Appeal of Biodegradable Packaging to Floral Consumers . . . . . . . . . . . . . 10
Pest Control Materials that may be Used on Greenhouse-Grown Herbs . . . . . . 12
The Price of Fungicide Success . . . . . . 13
Purdue Research Update: Evaluation of Phytotoxicity of SuffOil-X and BW533 . 15
Upcoming Events . . . . . . . . . . . . . 17
Dr. Roberto G. Lopez,
Assist. Professor and Floriculture Extension Specialist
Dear flower growers, businesses, distributors,
organizations and colleagues,
The IFGA board recently met in West Lafayette to
discuss the future of the organization. We are excited
to announce that beginning in 2011, the 29th Annual
IFGA Conference will be held in mid-February and
rotate to a different host greenhouse each year. Mark
your calendars, as the conference will be held in the
Indianapolis area on February 16, 2011.
For 2010, the annual conference and golf outing will
remain in West Lafayette. The educational sessions
will be on Wednesday, October 6th from 1 to 5 PM at
the University Plaza Hotel. We have made a few
changes that we hope you will enjoy. From 5 to 10
PM we will have an informal social and awards
presentation at the University Plaza Hotel atrium
instead of the banquet. For the golfers in the group,
we will have the golf tournament at 9 AM on
Thursday, October 7th at the Elks Country Club.
Due to the low turnout in 2009 and 2010, the IFGA
will no longer be part of the Indiana Green Expo (IGE).
However, IFGA members are encouraged to attend the
Indiana Horticulture Congress on January 18 to 20,
2011 (more details to follow).
The board would also like to congratulate the
recipients of the 2009 IFGA Allen Hammer Scholarship
which was awarded to two Purdue Horticulture
students. Alicia Aldridge, an undergraduate junior
majoring in landscape horticulture and design and
Ariana Torres, a graduate M.S. student in floriculture
production each received a $750 scholarship and a
plaque. In addition, IFGA partially funded a Purdue
floriculture research project titled, “Effects of Daily
Light Integral during Propagation on Rooting and
Flowering of Herbaceous Floriculture Crops.”
IFGA President, Steve Dewald of Dewald Gardens and
I both presented the IFGA Floriculture Person of the
Year Award to Tim Galema of Galema’s Greenhouses in
West Lafayette for his many years of dedication to the
floriculture industry in Indiana.
Purdue Research Update - Bark,
but Not Rice Hulls, Affect PGR
Drenches
By Christopher J. Currey1, Diane M. Camberato2,
Ariana P. Torres1 and Dr. Roberto G. Lopez3
Graduate Student1, Research Technician2, Assist.
Professor and Floriculture Extension Specialist3
Plant growth retardants (PGRs) are commonly applied
in our industry to produce compact and marketable
plants. Though there are a variety of application
methods, PGRs are usually applied using sprays or
drenches. Drenches involve applying a relatively large
volume of a PGR solution at a low concentration
directly to the growing medium. Compared to sprays,
benefits associated with media drenching include
more uniform results and increased, long-lasting
efficacy from a single application. PGRs with active
ingredients including paclobutrazol (Piccolo, Bonzi,

2
Downsize or Paczol), uniconazole (Concise or
Sumagic), ancymidol (Abide or A-Rest),
flurprimidol (Topflor) and chloromequat
chloride (Citadel, Cycocel or Chlormequat
E-Pro) can be applied as drenches. In addition
to media moisture content and volume of the
drench, media components can interact with
the active ingredients to reduce drench
efficacy.
Growing media used in greenhouse
production are commonly soilless mixes
comprised of various proportions of organic
components such as peat and bark, and
inorganic components such as vermiculite and
perlite. The question is – which media
components affect the efficacy PGR drenches?
Research has shown that when bark, either
fresh or composted, is included as a media
component, it can reduce the efficacy of PGR
drenches. Other components including peat,
coir, perlite, and vermiculite have been shown
to have little or no effect on the efficacy of
PGR drenches.
A growing trend among growers is to identify
more sustainable practices and products to
incorporate into the greenhouse production of
ornamentals. As part of this movement, there
is a desire to identify alternative media
components to replace limited organic
components or inorganic components with
energy-intensive manufacturing.
Parboiled rice hulls are an attractive media
component for growers wishing to incorporate
a sustainable product into their crop
production. An agricultural by-product, rice
hulls can provide aeration, are safe for
employees to handle and work with, and are
well-suited for composting or incorporation
into the garden bed by the consumer.
To our knowledge, no published research
currently exists on the effects of parboiled rice
hulls on PGR drench efficacy. Our objectives in
this study were to identify the interaction
between different media components and
PGR drenches for the northern U.S. to control
height or stem length of containerized
bedding plants.
We planted ‘Callie Deep Yellow’ calibrachoa
and ‘Delta Orange Blotch’ pansies in 4.5-inch
round pots filled with three different soilless
media: peat and perlite (“PP”; Fafard 1P Mix;
Conrad Fafard, Inc, Agawam, MA), peat and
parboiled rice hulls (“PRH”; Fafard Custom
RHM), or peat and bark (“PB”; Fafard 3B Mix).
Eleven days later, calibrachoa and pansy were
treated with 2.5 oz. drenches per pot of clear
water or PGR solutions containing Bonzi
(paclobutrazol; Syngenta Crop Protection,
Greensboro, NC) at 2 and 4 ppm (calibrachoa)
and 0.5 and 1 (pansy) or Concise (uniconazole;
Fine Americas, Walnut Creek, CA) at 1 and 2
ppm (calibrachoa) and 0.5 and 1 ppm (pansy).
Plant height (pansy) or length of the longest
stem (calibrachoa) was measured weekly and
final measurements were made 6 weeks after
treatment.
There were no differences among pansies
when treated with 0.5 ppm Concise across
media. As Concise concentration increased to
1.0 ppm, height of pansies grown in PP and
PRH media were similar, while plants grown in
PB were taller. Similarly, when 0.5 or 1.0 ppm
Bonzi drenches were applied plants grown in
PP and PRH media had similar heights, while
plants treated and grown in PB media were 4
to 6 in. and 2.5 to 3 in. taller, respectively
(Figure 1, page 3).
Results with calibrachoa followed a similar
trend. Stem length was 1 to 1.5 inches longer
for plants grown in PB media compared to
plants grown in PP and PRH media when 1.0
ppm Concise was applied. As Concise
concentration increased to 2.0 ppm, stem
length was similar regardless of media. For
both 2.0 and 4.0 ppm Bonzi drenches, there
were no differences between calibrachoa
grown in PP and PRH media, while plants
grown in PB media had longer stems (Figure
2, page 3).
So what does this mean for growers? As
expected, the media containing bark reduced
the efficacy of Bonzi and Concise drenches.
Alternatively, the media containing rice hulls
did not reduce PGR efficacy compared to
standard greenhouse media. Therefore, if you
use media that contains bark you will want to
increase the concentration of PGR solutions. If
you are using a media containing rice hulls,
and not bark, you can adopt the drench
strategies you currently use for crops grown in
peat and perlite media. We always encourage
growers to do on-site trials.
To subscribe, send your name, company name and email address to:
Roberto Lopez at: [email protected]
Subject line: Indiana Flower Grower e-bulletin
The Indiana Flower Grower e-bulletin is an electronic e-bulletin for commercial and advanced fl ower growers. It provides timely information on pest control, production practices, and other topics likely to be of interest to fl ower growers. All growers and interested persons are welcome to subscribe. Subsrciption is free of charge.
This e-bulletin can be accessed free at http://flowers.hort.purdue.edu

3
We thank C. Rakers & Sons for plant material, Conrad Fafard Inc. for growing media, Syngenta
Crop Protection and Fine Americas for plant growth retardants and funding, Scotts Co. for
fertilizer, and ITML for pots.
Scheduling Bedding Plants
Dr. Brian A. Krug1, Christopher J. Currey2, and
Dr. Roberto G. Lopez3
Floriculture Extension Specialist1, Graduate
Student2, and Assist. Professor and Floriculture
Extension Specialist3
Properly scheduling your bedding plant crops
can have a 5-fold impact on your business; it
reduces shrink, fuel consumption, plant
growth regulator (PGR) usage, labor, and
increases plant quality. Shrink, the plants that
do not sell for one reason or another, can be
reduced by ensuring that plants are at their
peak quality at the times when customers
demand them. On occasion, growers do not
take the time to plan out their schedules, but
instead error on starting the crop early, not
wanting to miss the market. This not only can
adversely affect plant quality by producing
overgrown past-prime plants, but increases
heating costs. Starting plants earlier than
needed translates into heating during the
coldest months of the year. These same
overgrown plants will require an additional
spacing, PGRs or cutting back, and/or
repotting into larger pots, all of which creates
a demand on labor. Finally, good quality
plants practically sell themselves. When a
grower plans correctly, a new batch of plants
will be at peak quality each week to present to
his or her customers (Figure 1, page 4).
Start with gathering a calendar (one with
week numbers works best), a pen, some
paper, and the culture information for the
crops you are planning to grow in the spring or
fall. The first step in scheduling a crop is to
begin at the end; decide when you want your
crop to be saleable and work backward from
that date. Will the crop need to be pinched or
require a PGR? These can delay flowering, so
determine the number of weeks required from
a pinch to your desired flower date. For
example, you want crop “A” to be ready for
Mother’s Day, or week 19, and you know that
it takes 3 weeks from pinch to flower. Subtract
3 from 19 and you know you need to pinch on
Fig. 1. Pansy ‘Delta Orange Blotch’ untreated and grown in a peat and perlite media (control) or
grown in peat and perlite, peat and bark or peat and rice hull media and treated with a 2.5 fl. oz.
drench of 0.5 ppm Bonzi solution.
Fig. 2. Calibrachoa Callie Deep Yellow untreated and grown in a peat and perlite media (control) or
grown in peat and perlite, peat, bark, perlite and vermiculite or peat and rice hull media and treated
with a 2.5 fl. oz. drench of 4.0 ppm Bonzi solution.

4
week 16. How many weeks will it take from
transplanting to the time you want to pinch?
Again, for crop “A”, you know it takes 2 weeks,
so subtract 2 weeks from the pinch date to
give you week 14 for your transplant date. If
you are purchasing rooted liners or plugs your
job is done. If you are going to sow your own
seeds or root your own liners you need to take
one more step. Determine how many weeks it
will take from sticking a cutting or sowing a
seed to obtain a plant ready for transplant and
subtract that from the date you plan to
transplant.
Since growers want to sell product with color
but not past their prime, another strategy to
use in scheduling bedding plants is to control
flower induction. Many bedding plants have a
photoperiodic flowering response, meaning
flowering is promoted by long (LD) or short
days (SD). For example, many petunias flower
in response to LD, while marigolds and cosmos
flower in response to SD. However, some
plants, like zonal geraniums, are day-neutral
and flower regardless of the daylength. When
you are scheduling your crops, take the time to
identify if the crop you are scheduling has a
photoperiod response so you can increase the
accuracy of your production schedule.
If you want to sell your plants with color on
them, knowing how to induce flowering will
help you get your crop ready for your target
sales date. If you are growing plants under a
non-inductive photoperiod, you will increase
production time just waiting for them to
flower! Let’s say you want Crop “B” in flower
for Memorial Day weekend sales, week 22. It
is a SD plant that flowers about five weeks
after the start of SD. To get plants flowering
by the target sales date, you’d want to start SD
during week 17.
Alternatively, if you are trying to bulk plant up
to fill in a container, you don’t want to grow
them under photoperiods that result in
flowering right after planting! Take a
seed-propagated petunia crop in 4-inch pots.
Certain cultivars flower in response to LD, so
Cornell Research Update -
Ethylene in the Greenhouse:
Symptoms of Short and
Long Term Exposure
By Dr. Roland Leatherwood1 and Dr. Neil S.
Mattson2
Postdoctoral Research Associate1 and Assist.
Professor and Floriculture Extension Specialist2
Ethylene, a small colorless, odorless gas
composed of two carbon and four hydrogen
atoms (C2H
4), is responsible for both beneficial
and undesirable effects in greenhouse crops.
It can prevent flowering, shorten internode
length, increase branching, initiate fruit
ripening, trigger leaf and flower senescence
and abscission, cause leaf chlorosis
(yellowing), and improve adventitious rooting.
Some crops are relatively insensitive to
ethylene while others are very sensitive. For
example, Poinsettia shows little change after a
24 hour 1 ppm ethylene exposure, yet Cuphea
hyssopifolia abscises flowers after a 24 hour
0.01 ppm exposure. There are many potential
sources of unwanted ethylene such as ripening
fruit, decomposing organic matter, and
exhaust from furnaces and vehicles. Because
several factors can simultaneously impact a
plant’s response to ethylene, it is easy to see
why assessing a potential ethylene problem
can be tricky. Some symptoms of exposure
can be transient, while others show up long
after the ethylene exposure has occurred, still
other responses show up only after long-term
exposure. To help you eliminate ethylene
related crop delays and losses from your
operation, this article details what short term
and chronic low concentration ethylene
exposure looks like, how to detect ethylene,
Fig. 1. An example of a geranium crop well scheduled; three different plantings to fulfill customer
demand throughout the season.
you’ll want to keep plants under SD for a few
weeks after transplanting to promote
vegetative growth and not flowering. After
plants have reached a certain size, they can be
placed under LD conditions to promote
flowering for sales.
Scheduling plants is easy but can take some
time. However, taking time during the slow
winter months to schedule your plants will
allow you to take advantage of reduced shrink,
fuel consumption, and labor as well as
increased plant quality and customer
satisfaction.

5
track down the source, and fix the problem.
What do Symptoms Look Like?
A plant’s response to ethylene can vary with
temperature, ethylene concentration and
duration of exposure. Plant responses to acute
or high concentration (> 0.1 ppm), exposures
are well described and studied. Many growers
can readily identify these symptoms. Brief
exposures may occur due to events such as
shipping plants in a tightly sealed container or
one-time exposure to vehicle exhaust while
plants are in a loading zone. Short duration
exposures at high concentrations result in
flower and leaf abscission, chlorosis, and
downward bent leaves that look wilted, but
are turgid (epinasty) (Figure 1). Longer-term
exposure to high concentrations of ethylene
can result in stunted growth, deformed or
chlorotic leaves, delayed flowering and plant
death (senescence).
However, it can be more difficult to recognize
plant responses to low concentration (< 0.05
ppm) exposures. Low concentration exposure
to ethylene over extended periods of time
(referred to as chronic ethylene exposure) can
Fig. 1. Effects of 8 hour (short term) 1 ppm (acute) ethylene exposure. Leaf and flower abscission
on portulaca (A) and cuphea (B), respectively. Leaf epinasty of tomato (C) and snapdragon (D),
exposed plant is on the left.
ethylene concentrations of 0.00, 0.01 and 0.05
ppm ethylene every night for the last 6 weeks
of production. Some results of these
experiments are presented below.
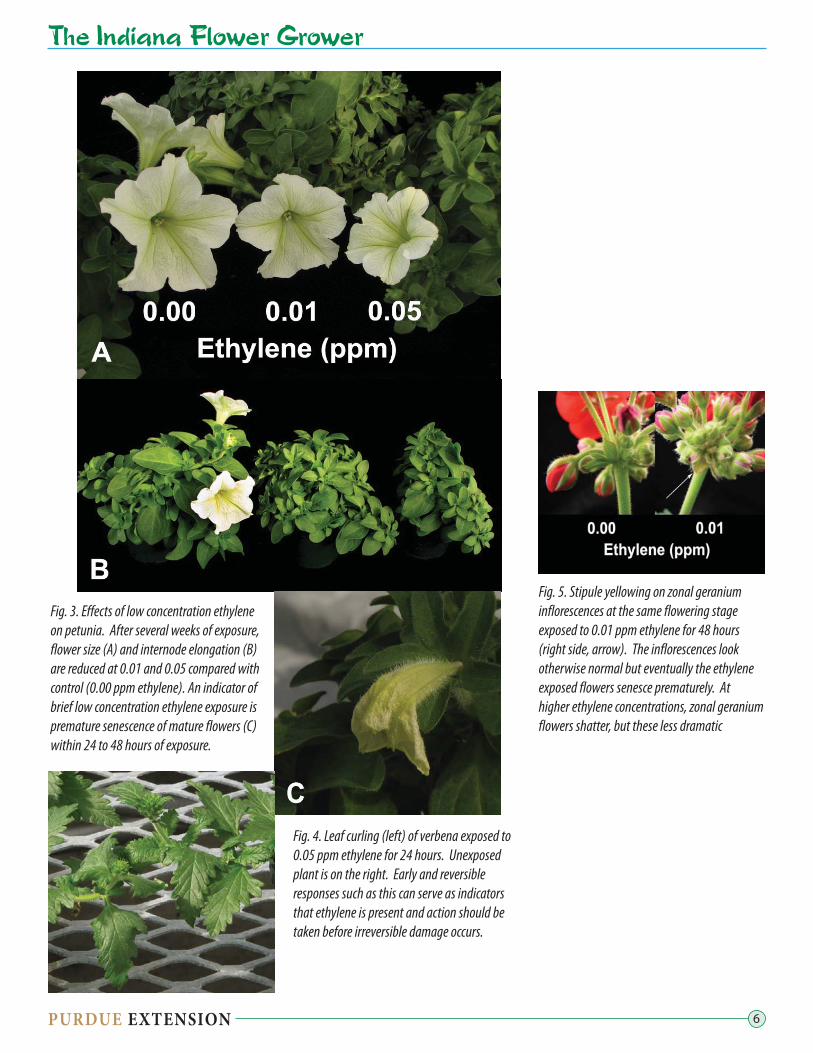
For many plant species responses to low
concentration ethylene exposures are subtle
and can be easily missed. For example,
petunias exposed to 0.01 ppm ethylene for 24
hours, exhibit early senescence of pollen
shedding flowers (Figure 3), while verbena
(Figure 4) and fuchsia show slight leaf
epinasty. Zonal geraniums exhibit stipule
yellowing after 48 hours when exposed to
0.01 ppm ethylene for 24 hours (Figure 5), yet
the flowers do not shatter as is seen at higher
concentrations.
Of course, as a grower you’re not tracking the
fate of individual fl owers or leaves. But the
eff ect in the greenhouse would be, for
example, a noticeable and sudden loss of
petunia fl owers in one part of the greenhouse;
typically the closer to a furnace the more
frequently the symptom is observed. Longer
term exposures at these concentrations result
in less fl owering for begonia, impatiens and
lobelia (Figure 6), and petunia internode
elongation and fl ower size is reduced (Figure
2). The fi gures below illustrate plant
responses to low concentrations of ethylene.
Complete results are summarized in Table 1.
Fig. 2. Leaf senescence in geranium due to chronic ethylene exposure from a faulty heater.
occur during greenhouse production such as
when a furnace is malfunctioning and
generates ethylene inside the greenhouse.
Leaf senescence can occur in geranium due to
chronic ethylene exposure from a faulty
furnace (Figure 2). To develop a visual
diagnostic guide of chronic low concentration
ethylene exposure, an experiment was
conducted at Cornell University. Thirty species
of bedding and potted plants were grown in
separate greenhouses and were exposed to
6
Fig. 3. Effects of low concentration ethylene
on petunia. After several weeks of exposure,
flower size (A) and internode elongation (B)
are reduced at 0.01 and 0.05 compared with
control (0.00 ppm ethylene). An indicator of
brief low concentration ethylene exposure is
premature senescence of mature flowers (C)
within 24 to 48 hours of exposure.
Fig. 4. Leaf curling (left) of verbena exposed to
0.05 ppm ethylene for 24 hours. Unexposed
plant is on the right. Early and reversible
responses such as this can serve as indicators
that ethylene is present and action should be
taken before irreversible damage occurs.
Fig. 5. Stipule yellowing on zonal geranium
inflorescences at the same flowering stage
exposed to 0.01 ppm ethylene for 48 hours
(right side, arrow). The inflorescences look
otherwise normal but eventually the ethylene
exposed flowers senesce prematurely. At
higher ethylene concentrations, zonal geranium
flowers shatter, but these less dramatic

7
Fig. 6. Examples of the effects of long term, six
week, low concentration ethylene exposure on
several species of spring annuals. A) The height
of pansies is reduced but flower count and
size stays consistent. B) Impatiens grow more
compactly while flower size and counts are
reduced. Similar results are seen with C) lobelia
and D) begonia. E) Primula leaves lie closer to
the soil line but flowering appears unaffected.
Table 1: A complete listing of all plants tested and their responses to short term and chronic,
low concentration ethylene exposure.
Plant
Short Term Response
(After 72 hours)
Long Term Response
(After Six Weeks)
Bacopa ‘Calypso Jumbo Lavender’ Slight leaf curling Reduced overall growth,
flower counts and branching
Basil ‘Sweet Large Leaf’ No Change (N/C) Increased branching
Begonia fibrous ‘Cocktail Gin’ N/C Reduced height, overall
growth, flower count
Calendula ‘Bon Bon Yellow’ N/C Reduced height, overall
growth
Calibrachoa ‘Callie Dark Blue’ N/C Reduced height and overall
growth, increased branching
Coleus ‘Stained Glassworks Copper’ N/C Increased branching
Cuphea ‘Allyson Heather’ Complete flower
shattering after 24 hours
at 0.01 and 0.05 ppm
ethylene
Reduced flowering, increased
branching
Dahlia ‘Carolina Orange’ N/C Early flower senescence
Dianthus ‘Telstar Pink’ N/C Reduced height, branching,
overall growth and flower
counts
Fuchsia ‘Trailing Dark Eyes’ Slight leaf curling/
epinasty which increases
with concentration
Reduced branching, overall
growth, increased height,
flower counts
Zonal Geranium ‘Rumba Fire’ Yellowing of stipules
after 48 hours at 0.01
and 0.05 ppm ethylene
Increased flower counts
Gerbera ‘Jaguar Formula Mix’ N/C Leaves are flatter against the
soil
Impatiens ‘Super Elfin XP White’ Slight leaf curling after
24 hours at 0.05 ppm
ethylene
Reduced height, overall
growth, flower size and
flower counts
Lobelia ‘Riviera Blue Splash’ N/C Reduced height, overall
growth and flower counts
French Marigold ‘Crested Bonanza
Mix’
N/C N/C
New Guinea Impatiens ‘Sonic Deep
Purple’
N/C Reduced height, overall
growth
Osteospermum ‘Asti Purple’ N/C Reduced overall growth,
increased branching
Pansy ‘Delta Formula Mix’ N/C Reduced height
Hot Pepper ‘Long Red Thin Cayenne’ N/C N/C

8
Plant
Short Term Response
(After 72 hours)
Long Term Response
(After Six Weeks)
Petunia multiflora prostrate single
‘Saguna Pastel Yellow’
Rapid senescence of
open flowers 24 to 48
hours after exposure to
0.01 and 0.05 ppm
ethylene
Reduced overall growth,
flower size and flower
counts, increased height and
branching
Portulaca ‘Yubi Summer Joy Apricot’ Some leaf abscission
within 24 hours of
exposure to 0.05 ppm
ethylene. Leaf abscission
does not persist long
term
Reduced height and
increased branching.
Primula ‘Danova Select Mix’ N/C Leaves are flatter against the
soil
Rosemary ‘Arp’ N/C Reduced branching
Sanvitalia ‘Sundance Yellow’ N/C N/C
Snapdragon ‘Florini Amalia Yellow’ N/C Reduced height & flower
scent at 0.05 ppm ethylene
Tomato ‘Beefsteak’ Epinasty within 24 hours
of exposure to 0.01 or
0.05 ppm ethylene
Reduced overall growth &
height
Torenia ‘Clown Blue’ N/C Reduced overall growth,
height and flower counts
Verbena ‘Lannai Dark Red’ Slight leaf curling 24
hours after exposure to
0.05 ppm ethylene
Reduced height
Financial Benchmark
Analysis for Wholesale
Operations Using an
Internet-Based System
Dr. Alan W. Hodges
Professor of Economics and Extension Scientist
While the ornamental plant industry in the
United States continues to grow in size and
value, it also becomes increasingly
competitive, due to maturation of the
industry, consolidation in the retail sector and
downward pressure on prices especially for
nursery products. The economic recession
worsened this situation by reducing demand
for ornamental plants as a consequence of the
collapse in construction and landscaping
markets, and reduced disposable income for
discretionary purchases of plant products. This
has impacted the industry in terms of reduced
profitability, increased rates of business failure
(bankruptcy), increased defaults on loans, and
widespread employee layoffs. There are now
signs that the recession is finally coming to an
end, and the economic recovery is underway.
Are you prepared to meet the new
opportunities in the emerging economy?
In this challenging economic environment it is
imperative that owners and managers strive
to make their operations as efficient and
financially sound as possible. A comprehensive
review of your company’s operations and
financial performance should be done at least
quarterly, in order to determine whether the
business is heading in the right direction or if
corrective action is needed. The analysis
should also review performance trends over
the past five years. Think of this like a checkup
with your doctor, except it is the health of your
business that is in question.
Financial benchmark analysis is a common
and longstanding method involving the use of
key indicators or metrics to evaluate a
company’s operational and financial
performance over time and in comparison to
industry averages or benchmark values.
This work was funded, in part, by a grant from the Fred C. Gloeckner Foundation, Inc. Plant
material was donated by C. Raker and Sons, Inc. We also acknowledge the valuable contributions
of John Dole at North Carolina State University, and the generous cooperation of numerous New
York growers for sharing their insights on their own ethylene experiences. This article was
originally published in Greenhouse Grower Magazine.

9
this system closely follow the longstanding
Nursery Business Analysis Program at the
University of Florida. The database was
developed from financial statements and
production records collected from wholesale
grower firms in Florida between 1990 and
1998, and augmented with new data
submitted to the internet-based system since
2004. Users of the system can choose from a
series of menus to create reports that
summarize benchmark information in the
database for selected commodities or
production systems, firm sizes, profitability
levels, locations (state, county) and years.
Currently, commodities or production systems
represented in the database include
greenhouse tropical foliage, shade house
tropical foliage (South Florida), container-
grown woody ornamentals, field-grown
woody ornamentals, potted flowering plants,
and cut foliage (ferneries). Commodity groups
have also been set-up for plugs/liners and
herbaceous perennials, and other
commodities or production systems may be
added from time to time, as requested by
users. Within each commodity, information is
also available for subgroups of large, small,
and highly profitable firms. Large firms are
defined as those having annual sales of two
million dollars or greater, while small firms
had sales of less than $250,000. Highly
profitable firms had a rate of return on assets
of 15 percent or greater. Users can also view
time series information for any industry group
in three separate periods (years). The system
requires a minimum of five (5) valid records in
the database to view averages for a selected
combination of attributes (commodity/
production system, firm size, profitability,
location, year), in order to protect the
confidentiality of user records. If the user does
not specify any of these selection conditions,
the system automatically defaults to all
records available.
The real power of this system is that users may
also enter their own financial data for
customized analysis of their company in
comparison to industry benchmarks. Clients
using this feature must first create an account
with their general company information
(name, address, telephone, email, etc.) and
select a username and password to enable
access to the system. Security encryption
prevents unauthorized access to confidential
information. Clients can view reports for up to
three years of their own company, or any
combination of industry average benchmarks.
Reports generated by the system consist of a
series of tables and charts that present
information for comparison of up to three
industry groups or individual firm records
(years). Graphical bar charts are also available
for selected key indicators to help visualize
critical differences. The following information
is provided:
Scope of Business Operations: annual plant
sales, value of production (sales plus plant
inventory change); gross nursery or
greenhouse area and net usable
production area; workforce (number of
fulltime equivalent employees); value of
owned and leased capital.
Income Statement: sales, miscellaneous
income, total income; expenses for six
major categories (labor, supplies,
equipment/facilities, overhead, capital,
management) and 32 detailed items; gross
income and net income.
Monthly Sales as a percentage of total annual
sales (charted).
Statement of Financial Position: current and
long term assets; current and long term
liabilities; net worth.
Productivity and Efficiency Indicators: sales
and value produced per square foot and
per acre growing space; sales and value
produced per fulltime equivalent
employee; capital managed per acre and
per employee.
Financial Ratios: profitability (gross margin,
net margin, return on assets, return on
According to surveys, benchmark analysis is
practiced by about two-thirds of leading
global businesses. Ideally, comparisons
should be made with the leading or most
profitable firms in an industry that are
presumably following best business practices.
Comparison of an individual company to
industry benchmark values can assist
managers to identify their strengths and
weaknesses, in order to capitalize on their
competitive advantages, and to serve as a
guide for important decisions such as business
expansions, financing, marketing strategies,
operations planning, and product selection.
Benchmark analysis can assist in identifying
common problems in wholesale plant
greenhouses and nurseries, such as slow crop
growth, low pricing, excessive costs, waste or
overuse, poor cash flow, undercapitalization,
and imbalanced debt structure. When used
effectively, this information may help to
achieve a business’ goals to increase
profitability, control costs, reduce the risk of
business failure, enhance efficiency, boost
productivity and improve management
professionalism.
The Internet-Based System
Traditionally, financial benchmark information
is compiled through industry surveys. With
the power of the internet, this process can be
made more efficient and significantly sped-up
to provide more timely information to users.
With this advantage in mind, we set out to
develop an internet-based financial
benchmark system for the greenhouse and
nursery industries, as a partnership between
the University of Florida and the Florida
Nursery Growers and Landscape Association.
The system was originally developed in 2004,
but has recently been modified to incorporate
new features. The system is available at
http://hortbusiness.ifas.ufl.edu/analysis, and
is free of charge. It consists of data entry
forms, a historical database of business
records, a report generator, and a security
encrypted website user interface. The
benchmark measures and calculations used in

10
The Appeal of
Biodegradable Packaging to
Floral Consumers
Drs. Charlie R. Hall1, Ben L. Campbell2, Bridget
K. Behe3, Jennifer H. Dennis4, Roberto G.
Lopez5, and Chengyan Yue6
Ellison Chair in International Floriculture1,
Principal Investigator2, Professor3, Associate
Professor4, Assistant Professor5, and Bachman
Endowed Chair in Horticultural Marketing6
Currently, one of the most widely discussed
topics in the floriculture industry, which is
promulgated by consumers exhibiting greater
degrees of environmental awareness, is the
issue of environmental sustainability. This has
led to a desire for products that not only solve
the needs of consumers but are also produced
and marketed using sustainable production
and business practices. Consumers
increasingly place a great emphasis on
sustainable product packaging and this has
carried over to the greenhouse/floral sector in
the form of biodegradable pots. While various
forms of eco-friendly pots have been available
for several years, their marketing appeal was
limited due to their less-than-satisfying
appearance. With the recent availability of
more attractive biodegradable plant
containers, a renewed interest in their
suitability in the floriculture sector and their
consumer acceptance has emerged. The
objective of this study was to determine the
characteristics of biodegradable pots that
consumers deem most desirable and to solicit
their willingness-to-pay (WTP) for this type of
product.
Research Methods
A recently developed analytical tool, called
experimental auctions, was used to elicit the
floral consumer’s WTP. Experimental auctions
enable researchers to distinguish what
consumers “say they will do” against what
they “actually will do” in making purchasing
decisions. The auctions were conducted in
Minnesota and Texas in order to capture any
wholesale prices, less discounts for
unfinished plant material in relation to
degree of completion.
Nursery or Greenhouse Area: Total area
(acres) and usable growing space (square
feet). Plant production area should be
measured as the net available space within
growing beds and fields, and excluding
non-productive space in aisles, driveways,
and other service areas.
Labor Work Time: The physical quantity of
labor used by nurseries may be measured
in terms of payroll hours, including
production, administrative, sales, and
management personnel, or expressed in
terms of fulltime equivalent (FTE) persons,
representing the number of employees
working 52 weeks at 40 hours per week or
2,080 hours per year.
Operating Expenses: management salaries,
employee wages and salaries,
commissions, health insurance, payroll
taxes, other benefits, plants, containers,
growing media, fertilizer, agrichemicals,
packaging, heating fuel, other supplies,
facility repairs & maintenance, equipment
operations, insurance, electricity,
communications, taxes, advertising, rent,
interest, depreciation, bank charges,
postage/freight, dues/subscriptions,
professional services, offices supplies,
waste removal, miscellaneous other.
In conclusion, financial benchmark analysis is
a proven tool for improving management and
performance of enterprises. The internet-
based system for financial benchmark analysis
described in this article automates and
speeds-up the process, and enables users to
compare their performance with peer industry
firms.
We invite readers to check out this tool
available and see if it may help improve your
business performance. As this system is being
continually developed, we would appreciate
any feedback you may have.
equity), turnover (inventory, asset,
managed capital), liquidity (cash on hand/
current liabilities, current ratio, quick ratio,
accounts receivable / sales, average
collection period), and solvency (assets/
liabilities, leverage, current value /original
cost of long term assets).
Cost Analysis: costs per square foot, costs per
unit sales, and cost per unit value
produced in major expense categories
(labor, supplies, facility & equipment,
overhead, capital, management).
The starting point for doing benchmark
analysis is to collect the most recent available
information for your business from financial
statements, income tax forms, and other
company records. Fortunately, because of
standards regulating the accounting
profession, information on financial
statements has a consistent meaning that
facilitates comparisons among different
businesses and over time. Specific information
required to use the internet-based system
includes the following items. When a user
enters this information, the system checks to
assure that all data is complete and is within a
reasonable range of values.
Income: Annual plant sales, monthly sales
(optional), sales of product purchased and
resold (brokered), other miscellaneous
business income (rents, service charges,
gain on sales of assets, etc).
Capital Owned and Leased: Capital resources
managed includes both owned and leased
assets in land, buildings, and equipment,
and working capital in inventories, cash,
and accounts receivable. Owned capital in
buildings, improvements, and equipment
are given as original cost and accumulated
depreciation. Leased assets are taken at
market value. Inventory values must be
given for both the beginning and end of
the year in order to calculate the change
occurring during the period, which is
treated as an accrual. Plant inventories are
to be estimated at market value, reflecting

11
Fig. 2. Example of a straw biodegradable pot.
Consumers also exhibited a willingness to pay
$.17 per pot premium for pots deemed to be
carbon saving versus a penalty of $.43 for pots
deemed to be carbon intensive, both relative
to a carbon neutral pot. It is important to note
that the pots were merely labeled as carbon
neutral, saving, or intensive. This relationship
has not been established by scientific research
regarding any given pot type.
Lastly, consumers were also willing to pay a
price premium relative to the amount of waste
materials used to manufacture the pots, with
pots made from more than 50% waste
materials generating a $.23/pot price
premium relative to the black plastic pot.
Again, this was only labeled according to the
research design and not based on actual waste
ingredient composition. In this manner we
were able to ascertain the impact/effect of
price on consumer perception.
Impact to the Industry
Through intelligent packaging and system
design, it is possible to “design out” the
potential negative impact of floral plant
packaging on the environment and society –
in this case, the prominent amount of virgin
plastic produced as requisite to the
greenhouse industry. “Cradle to cradle”
principles offer strategies to improve the
material health of packaging and close the
loop on packaging materials, including the
creation of economically viable recovery
systems that effectively eliminate waste.
regional differences that may be present
among northern or southern respondents.
For this study, we consulted with industry
experts to identify the attributes and their
corresponding levels that were considered to
be environmentally important to consumers,
while directly controlling attributes considered
to be of lesser importance. Attributes (and
levels) identified were container type [plastic,
wheat (OP47), rice hull, straw], carbon
footprint (neutral, saving, intense), and
percent of waste products used to make the
pots (0%, 1-49%, >49%). A fractional
factorial design yielded 14 different pot
combinations to be used in the actions.
We conducted eight sessions with a total of
113 participants. In each of the auctions,
there was simultaneous bidding on the 14
alternatives, which were put on a large table.
Beside each alternative there was a label
indicating the container type, percentage of
waste materials used to make the pots, and
carbon footprint levels.
Participants randomly walked around the
table and placed their bids on bidding forms
as they studied each alternative. Afterward,
each participant randomly drew his/her
exclusive binding alternative. The price of an
alternative was equal to the 2nd-highest bid
for that alternative. If the participant had bid
more than the price for their binding
alternative, they had to buy the alternative.
At the end of each session, participants were
given $30 to compensate for their time. If a
Fig. 1. Base scenario using a standard black
plastic pot priced.
participant won an alternative, they would get
the alternative they won and get $30 minus
the price for the alternative. If the participant
did not win, he/she received the $30.
Result and Conclusions
Table 1. A comparison of WTP from the
conjoint analysis online survey and
experimental auctions in Texas and Minnesota.
Survey
Results
Auction
Results
Plastic Base Base
Rice hull $0.69 $0.58
Straw $0.63 $0.37
Wheat $0.24 $0.23
Carbon saving -0.02 $0.17
Carbon neutral Base Base
Carbon intensive -$0.96 -$0.43
No waste Base Base
1-49% waste $0.09 $0.15
+50% waste -$0.13 $0.23
Pots made from biodegradable materials each
generated a positive WTP (Table 1) from
consumers compared to plastic pots, with the
conjoint survey results being slightly higher in
each case compared to the auction results.
This meant that consumers did exhibit a
willingness to pay more for biodegradable
pots.
Each pot type was compared against the
traditional black plastic pot (Figure 1) that was
used as the base to determine how much of a
price premium consumers were willing to pay.
The rice hull pot generated the greatest price
premium, with consumers paying, on average,
an additional $.58 per 4” chrysanthemum.
This was followed by a $.37/pot premium for
the straw pot (Figure 2) and $.22/pot for the
wheat (OP47) pot over the standard black
plastic pot.
12
The use of biodegradable pots reflects these
cradle to cradle principles. This research will
greatly benefit the floral consumer by
ensuring that environmentally-friendly
products marketed to them in the future meet
their “sustainability” needs and/or
expectation.
This work was funded, in part, by a grant from
the American Floral Endowment (AFE), the
Horticultural Research Institute (HRI), and the
Federal-State Marketing Improvement
Program (FSMIP).
Pest Control Materials
that May be Used on
Greenhouse-Grown Herbs
By Dr. Raymond A. Cloyd
Professor and Extension Specialist in
Ornamental Entomology/Integrated Pest
Management
Many herbs are widely grown in greenhouses;
however, the availability of pest control
materials (in this case, insecticides and
miticides) is limited. Despite this, greenhouse
producers that grow herbs must still contend
with and regulate the same insect and mite
pest populations that attack commercially-
grown ornamental plants. As such,
applications of pest control materials are
warranted in order to prevent insect and/or
mite pest outbreaks. However, other than
reading the label of specific pest control
materials, there is currently not a
comprehensive listing of those pest control
materials registered for use on herbs grown in
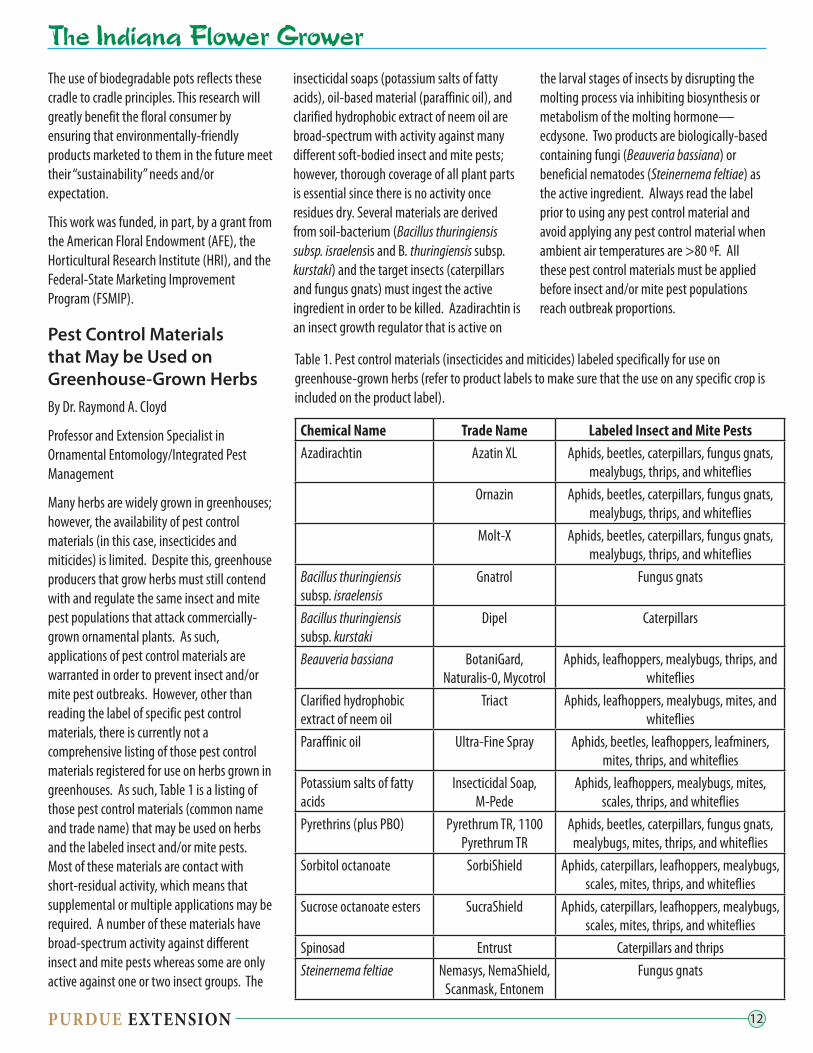
greenhouses. As such, Table 1 is a listing of
those pest control materials (common name
and trade name) that may be used on herbs
and the labeled insect and/or mite pests.
Most of these materials are contact with
short-residual activity, which means that
supplemental or multiple applications may be
required. A number of these materials have
broad-spectrum activity against different
insect and mite pests whereas some are only
active against one or two insect groups. The
Table 1. Pest control materials (insecticides and miticides) labeled specifically for use on
greenhouse-grown herbs (refer to product labels to make sure that the use on any specific crop is
included on the product label).
Chemical Name Trade Name Labeled Insect and Mite Pests
Azadirachtin Azatin XL Aphids, beetles, caterpillars, fungus gnats,
mealybugs, thrips, and whiteflies
Ornazin Aphids, beetles, caterpillars, fungus gnats,
mealybugs, thrips, and whiteflies
Molt-X Aphids, beetles, caterpillars, fungus gnats,
mealybugs, thrips, and whiteflies
Bacillus thuringiensis
subsp. israelensis
Gnatrol Fungus gnats
Bacillus thuringiensis
subsp. kurstaki
Dipel Caterpillars
Beauveria bassiana BotaniGard,
Naturalis-0, Mycotrol
Aphids, leafhoppers, mealybugs, thrips, and
whiteflies
Clarified hydrophobic
extract of neem oil
Triact Aphids, leafhoppers, mealybugs, mites, and
whiteflies
Paraffinic oil Ultra-Fine Spray Aphids, beetles, leafhoppers, leafminers,
mites, thrips, and whiteflies
Potassium salts of fatty
acids
Insecticidal Soap,
M-Pede
Aphids, leafhoppers, mealybugs, mites,
scales, thrips, and whiteflies
Pyrethrins (plus PBO) Pyrethrum TR, 1100
Pyrethrum TR
Aphids, beetles, caterpillars, fungus gnats,
mealybugs, mites, thrips, and whiteflies
Sorbitol octanoate SorbiShield Aphids, caterpillars, leafhoppers, mealybugs,
scales, mites, thrips, and whiteflies
Sucrose octanoate esters SucraShield Aphids, caterpillars, leafhoppers, mealybugs,
scales, mites, thrips, and whiteflies
Spinosad Entrust Caterpillars and thrips
Steinernema feltiae Nemasys, NemaShield,
Scanmask, Entonem
Fungus gnats
insecticidal soaps (potassium salts of fatty
acids), oil-based material (paraffinic oil), and
clarified hydrophobic extract of neem oil are
broad-spectrum with activity against many
different soft-bodied insect and mite pests;
however, thorough coverage of all plant parts
is essential since there is no activity once
residues dry. Several materials are derived
from soil-bacterium (Bacillus thuringiensis
subsp. israelensis and B. thuringiensis subsp.
kurstaki) and the target insects (caterpillars
and fungus gnats) must ingest the active
ingredient in order to be killed. Azadirachtin is
an insect growth regulator that is active on
the larval stages of insects by disrupting the
molting process via inhibiting biosynthesis or
metabolism of the molting hormone— ecdysone. Two products are biologically-based
containing fungi (Beauveria bassiana) or
beneficial nematodes (Steinernema feltiae) as
the active ingredient. Always read the label
prior to using any pest control material and
avoid applying any pest control material when
ambient air temperatures are >80 ºF. All
these pest control materials must be applied
before insect and/or mite pest populations
reach outbreak proportions.

13
The Price of Fungicide
Success
Dr. Janna L. Beckerman
Associate Professor of Plant Pathology and
Extension Specialist
My grandmother introduced me to the phrase
“Penny wise and pound foolish.” It is a trap
that many people fall into in various aspects of
their lives. However, in one aspect, plant
disease control, it is one trap that can be
readily avoided. When managing plant
disease, it is important to remember that the
quoted cost of the fungicide is probably the
least economically important piece of
information you as a grower are confronted
with.
This last fall/winter was a disastrous one for
many poinsettia producers. Cooler
temperatures can be managed in a
greenhouse, but the lack of sun is less
manageable. With less sun light, plants
transpire less, resulting in wet media. As a
result, many growers had tremendous
outbreaks of Pythium root rot. In choosing a
control, especially for something as explosive
as Pythium sp., the first concern should be
choosing the most effective fungicide. There
are many possibilities here. Unfortunately for
this grower, he was also battling mefenoxam-
resistant Pythium, eliminating Subdue Maxx
as a control option. This left us with following
choices:
Aliette•
Fenstop•
Segway DF•
Truban 25EC/30WP•
We’re all familiar with the phrase “You do the
math.” But how many of us actually take the
time do so? And although the math is simple,
coming up with the time is the problem! Table
1 shows 35 of the most commonly used
greenhouse fungicides, the cost of each
product for the average small grower the
recommended label rate, the recommended
application interval, cost per application and
the most important piece of information: the
per month use cost.
All too often, we don’t do the math. This
simple (but tedious and time-consuming)
math takes into account the cost per
treatment, the rate, and the number of
applications. When evaluated this way, an
“expensive” product that is used at a low rate
once per month (or every other week) may be
more cost-effective than using a high rate of a
“less expensive” fungicide on a weekly basis.
Our grower blanched at the recommendation
of one of the more expensive fungicides, even
when faced with loss of his entire crop. I
walked him through the cost breakdown, in
addition to the cost of losing his entire crop.
He decided to proceed using the “Cadillac”
fungicide, rotated with an equally effective
fungicide with a different mode of action. We
also began the process of correcting some of
the underlying cultural problems that
predisposed the crop to Pythium root rot by
removing severely infected plants, improving
drainage issues and preventing the
accumulation of standing water. This reduced
the spread of the pathogen, and allowed the
fungicides to work better by primarily
preventing disease in new plants, and
minimize the fungicide’s role as a curative in a
few lightly symptomatic or asymptomatic
ones. The end results were a very happy
grower and an excellent poinsettia crop.
Another area where a deeper consideration of
costs should occur is when you are faced with
a mixed infection— like downy mildew and
black spot of florist’s roses, or Phytophthora
blight and Alternaria leaf spot on
Catharanthus (Vinca) (Figure 1). There are
many fungicides with excellent activity
against only one of these pathogens.
However, using a strobilurin fungicide
(Pageant, Cygnus, Compass or Heritage) would
be effective against both pathogens, and
possess some curative/eradicant ability (cure
existing infections while protecting against
new ones). Tank mixing or alternating with
mancozeb would also provide control for both
diseases, and an excellent rotation partner.
Hopefully, Table 1 will assist you by providing
the cost-benefit and cost per month rates, and
also by showing growers that many of those
“expensive” or “Cadillac” fungicides are more
like hybrid vehicles, where savings are realized
over the long haul! Keep in mind that the
most expensive fungicide isn’t always the
best, and that proper timing of any fungicide
is essential. Growers often reach for a
fungicide when the crop is no longer
salvageable: A fungicide may prevent future
infections, but the damage may be such that
the crop is no longer saleable. This is the most
expensive fungicide, as it wastes time, money,
and creates unnecessary environmental
impact.
The Purdue Green Industry Working Group has
developed a website to assist growers, and can
be seen at: http://www.btny.purdue.edu/
Extension/GIWG/index.html
Fig. 1. Phytophthora blight on Catharanthus
(Vinca).

14
Fungicide Quantity Cost Rate Application Interval
Cost/100 gal Cost/ 28 Days
Aliette WDG 5 lb $160 0.4 to 5.0 lb /100 g 28 days $13 to 160 $13 to 160
Banrot 40WP 2.0 lbs $73 4 to 12 oz/100g 4 to 12 weeks $9 to 27 $3 to 27
Banrot 8G 40 lb $423 8 oz to16 /cu yard at planting $8 per cu yd $8 to 36
Camelot 1 gal $124 3pt/100g 7 to 14 days $16 $32 to 64
Captan 50WP 50 lb $48 1 to 4 lbs /100g 7 to 10 days $1 to 4 $3 to 16
CHIPCO 26019 N/G 2 lbs $95 1 to 6.5 oz/100 7 to 14 days $3 to 19 $6 to 76
Cleary 3336G 30 lbs $88 3 to 6 lbs/1000 sq. ft 14 days $9 to 18/1000 sq.ft $18 to 35
Compass O 50 WDG 0.5 lb $263 1.0 to 4 oz 100 g 14 to 21 days $33 to 131 $49 to 263
Contrast 70 WSP 8X 1 oz $72 3 to 12 oz/100 gal 14 to 21 days $27 to 107 $40 to 215
Cygnus 50 WG 1lb $253 1 to 6.4 oz/100 g 7 to 14 days $16 to 104 $32 to 414
Daconil Zn FLOWABLE 2.5 G $180 2pt/100 g 7 to 14 days $9 $18 to 36
Daconil ULTREX 82.5WDG 6.5 lb $88 1.4 lb/100 g 7 to 14 days $19 $38 to 76
Decree 50 wdg 2.5 lb $271 0.75 to 1.5 lb/100g 7 to 14 days $81 to 163 $163 to 326
Disarm O 1 lb $100 2 to 4 oz/100 g 14 days $13 to 25 $26 to 50
Fenstop quart $200 7 to 14 oz/100 g 28 days $44 to 88 $44 to 88
Heritage 1 lb $525 1 to 2 oz/100g 14 to 21 day $33 to 66 $49 to 131
Medallion 8 to 1oz packs $206 1 to 4 oz/100 g 7 to 14 days $26 to 103 $103 to 412
OHP 6672 50WP 2lb $49 8 to 24oz/100 g 7 to 14 days $12 to 37 $25 to 147
OHP 6672 4.5L 2.5 g $446 20 oz/100g 7 to 14 days $28 $56 to 112
Pageant 1 lb $80 4 to 18 oz/100 g 7 to 14 days $20 to 90 $40 to 360
Pipron quart $380 4 to 8 oz 7 to 14 days $48 to 95 $96 to 190
Protect DF 6 lb $80 1 to 2 lb/100g 7 to 14 days $14 to 27 $27 to 54
Segway 39.2 oz $370 1.5 oz to 6 oz/100g 14-28 days $14 to 57 $28 to 113
Spectro 90 WDG 5 lb $124 1 to 2 lb/100g 7 to 14 days $25 to 50 $50 to 200
Stature DM 25 oz $165 3.2 to 12.8/100 g 10 to 14 days $21 to 84 $42 to 253
Strike 50WDG 8 oz $90 1 to 8 oz/100g 7 to 14 days $11 to 90 $22 to 360
Subdue Maxx quart $241 0.3 to 3 oz/100g 30 days $2 to 23 $2 to 23
Subdue G 25 lb $133 8 to 75 oz/1000sq.ft. At planting $3 to 25 $3 to 25
Sulfur 30 lbs $28 6 lb/100 g 7 days $6 $22
Systhane/Eagle 8 oz $75 8 to 12 oz/100 g 7 to 14 days $75 to 113 150 to 452
Terrachlor 75WP 5 lb $81 per 1,000 sq. ft. row: 3 to 6.5 lbs $49 to 105/1000 sq. ft.
$49 to 105
Terrachlor 400 1 g $92 6 to 12 oz/100 g 28 to 42 days $4 to 9 $4 to 9
Truban 25 EC quart $70 3 to 8/100g 4 to 12 weeks $7 to 18 $2 to 18
Truban 30 WP 2 lb $70 3 to 12/100g 4 to 12 weeks $7 to 13 $2 to 18
Zyban WSB 3 lb $64 16 to 24 oz/100g 7 to 10 days $21 to 32 $61 to 128
Table 1. Commonly used greenhouse fungicides, the cost of each product for the average small grower, the recommended label rate, the
recommended application interval, cost per application and the most important piece of information: the per month use cost.
Fungicide prices vary between distributors, states, and quantities purchased. The use of specific trade names in this publication does not constitute endorsement of these products nor does exclusion constitute discrimination.

15
Purdue Research Update -
Evaluation of Phytotoxicity
of SuffOil-X and BW533
By Jeannie Ross1, Robert Eddy2, and Marla
Faver3
Undergraduate Researcher1, Plant Growth
Facilities Manager2 and BioWorks Field
Development Scientist3
Introduction
SuffOil-XTM is a spray oil emulsion insecticide,
fungicide, and miticide that provides a
“uniform coverage to suffocate pests without
causing burn or stress to the plants”
(BioWorks, Inc., Victor, NY). It is a pre-
emulsified oil which allows it to separate into
much smaller particles so that it can coat
plants in a very thin, uniform layer of oil.
BW533 is a biological insecticide and
nematicide. In order to further understand
the effects of each of these products on the
plants they would most likely be used on, an
experiment was conducted to determine the
specific phytoxicity at three different
application rates of both SuffOil-XTM and
BW533 as individual treatments. The plants
used in the experiment were a variety of
general greenhouse crops including impatiens
(Impatiens walleriana ’Dazzler Violet’), zinnia
(Zinnia angustifolia x elegans ‘Profusion Fire’),
rex begonia (Begonia rex ‘Chicago Fire’),
marigold (Tagetes patula ‘Bonanza Yellow’),
and fuchsia (Fuchsia hybrid ‘Autumnale’).
Materials and Methods
Ninety-six plants of each species were potted
up in five-inch azalea pots using Metro-Mix
510 media (SunGro Horticulture, Bellevue,
Washington) in the Purdue University
Horticulture Plant Growth Facility. Each
species was watered as needed with Peters
Excel 21-5-20 (Scotts-Sierra Horticultural
Products, Co., Marysville, Ohio).
Once most of the plants had developed
suitable leaf surface area and put on sufficient
flowers, twelve plants from each species were
assigned to one of seven treatments (Table 1).
Treatments were applied using a 1 gallon
hand-pump sprayer. The treatments were
evenly applied to the foliage and flowers to
“run-off”. Conditions during the application
period were mostly sunny with an average
temperature in the greenhouse of 80.9 ºF.
Phytotoxicity measurements and pictures
were taken 24 hours after application.
Evaluations were made 2-5 days post-
application but phytotoxicity symptoms did
not change. The following week on June 24th,
2009 a second application of each treatment
was performed using the same procedure and
method. Conditions during the second
application period were sunny with an
average temperature in the greenhouse of
84.6 ºF. Measurements and pictures for this
second application were taken 24 hours later.
No further damage was noted 2-5 days
post-application.
Results
Phytotoxicity of the plants was measured on a
scale of one to six based on the amount of
damage and the saleability of the plants
(Tabel 2).
Table 1. Treatment List
Treatment Rate
Control n/a
SuffOil-XTM 1.28 oz.1 gal
SuffOil-XTM 2.56 oz/1 gal
SuffOil-XTM 5.12 oz/1 gal
BW533 .08 oz/1gal
BW533 .16 oz/1 gal
BW533 .32 oz/1 gal
Fig. 1. Effect of SuffOil-XTM and BW533 on
impatiens
The impatiens showed the most severe
damage after being treated with the 5.12 oz/1
gal rate of SuffOil-XTM (Figure 1). Impatiens
plants in this treatment group had very
noticeable curling of the flower petals and
severe loss of pigment on most of the flowers
per plant, as evident in Figure 2. There were
also a few grease soaked spots on the leaves of
the impatiens plants in this treatment. Only
moderate flower damage on the impatiens
was observed at the two lower application
rates of SuffOil-XTM. The only other plant
species to show any phytoxicity symptoms
after being treated with the highest rate of
SuffOil-XTM were the zinnias. Several zinnia
plants in this group had grease soaked spots
on their leaves. All of the other plant species
showed no phytotoxicity symptoms regardless
of the rate of SuffOil-XTM that was applied.
Fig. 2. Phytotoxicity on impatiens flowers after
5.12 oz/1 gal of SuffOil-XTM was applied.
In the groups treated with BW533, the
impatiens treated with the .32 oz/1 gal rate
showed the most severe damage to the
flowers. They had curling of the flower edges
and a severe loss of pigment in the petals. The
two lower treatment rates showed similar
damage on fewer of the flowers. The rest of
the plant species showed no symptoms of
phytotoxicity.
Discussion
Plants treated with both products clearly
either showed symptoms of phytotoxicity or
no effect at all. The hypothesis that increasing

16
Table 2. Phytotoxicity of the plants was measured on a scale of one to six based on the amount of
damage and the saleability of the plants.
Rating
Damage
Severity Description Saleability
1 No Damage No phytotoxicity symptoms Would sell
2 Slight A few flowers or leaves slightly
damaged
Would sell
3 Moderate Flowers or leaves moderately
damaged
Decreased salability until
new flowers emerged
4 Moderate Flowers and leaves moderately
damaged
Re-growth period required
for salability
5 Severe Flowers and leaves severely
damaged, plant stunted with
dead tips
Would not sell
6 Severe Plant death Would not sell
rates of either SuffOil-XTM or BW533 would
show increasing symptoms of phytotoxicity
was proven true. The affected plants showed
increasing symptoms as the application rates
increased.
SuffOil-XTM affected only two plant species
out of the five crops selected for this study.
Only the impatiens showed sufficient
phytotoxicity symptoms to decrease their
saleability. Even at the highest rate, however,
they were still healthy enough to be sold
and—in our opinion—after putting on new
flowers would not be distinguishable from the
control plants. This means that growers who
over-apply this product only need to hold off
selling these plants for a week or two to have
a marketable crop.
BW533 phytotoxicity symptoms appeared only
on the impatiens and to a lesser degree than
on the SuffOil-XTM. Likewise, growers who
over apply this product would only need to
wait a week or two before selling the
damaged impatiens crop in order to allow the
plants to put on new, unaffected flowers.
Viewing these products from a grower’s
perspective, the SuffOil-XTM was difficult to
measure out accurately due to its thick
consistency. It worked well on most of the
plants but should probably be used sparingly
on tender annuals such as impatiens. The
BW533 was much easier to measure and mix.
It also seemed to have a milder effect on the
impatiens. One of the main qualities of both
these products that would recommend them
to growers is, unlike harsher chemicals, these
two products are considerably safer for
beneficial insects while still killing a broad
spectrum of pests. This will allow growers to
integrate beneficial insect programs into their
pest control methods which will create a more
ecologically desirable system for managing
insect pests.
This study was made possible by BioWorks, Inc. through their generous support of a summer
intern at the Purdue Horticulture Greenhouse

17
Upcoming 2010 Industry and University EventsDate Event Location Speaker/Topic Web site/ Email
Apr. 29Farmer Market
Master Boot CampIndianapolis, IN
Merchandizing, Selling &
MarketingE-mail: [email protected]
June 10 NWIFA TBA TBA http://faculty.pnc.edu/emaynard/nwifa/nwifa.html
June 16-18SE Color
ConnectionGreenville, SC Education and Trade Show http://www.sgcts.org/
June 26-28 Seeley Conference Ithaca, NY Education http://www.hort.cornell.edu/seeleyconference/
July 10-13 OFA Short Course Columbus, OH Education and Trade Show http://www.ofa.org/shortcourseinfo.aspx
Aug. 2-13Michigan Garden
Plant TourThroughout MI Display gardens http://planttour.hrt.msu.edu/
Aug. 10Michigan Garden
Plant ShowcaseE. Lansing, MI
Educational and Garden
Tourhttp://planttour.hrt.msu.edu/
Sept. 8 NIFGA Fort Wayne, IN Educational and tour E-mail: [email protected]
Sept. 28-29
OFA Disease, Insect
& Plant Growth
Conference
St. Louis, MO Education and Trade Show http://www.ofaconferences.org/
Oct. 6-7IFGA Annual
ConferenceLafayette, IN Education and Golf https://share point.agriculture.purdue.edu/agriculture/flowers/ifga.aspx
Oct. 6-7
Canadian
Greenhouse
Conference
Toronto, Canada Education and Trade Show http://www.canadiangreenhouseconference.com/
Oct. 13 NIFGA Fort Wayne, IN Educational and tour E-mail: [email protected]

18
Reference to products in this publication is not intended to be an endorsement to the exclusion of others that may be similar. Persons using such products assume responsibility for their use in accordance with current directions of the manufacturer.
Roland LeatherwoodPost Doc Associate
Cornell University
134A Plant Sciences Bldg
Ithaca, NY 14853
(607) 255-4568
Roberto G. LopezAssist. Professor and Floriculture
Extension Specialist
Purdue University
Department of Horticulture & Landscape
Architecture
625 Agriculture Mall Dr.
West Lafayette, IN 47907
(765) 496-3425
Neil S. MattsonAssistant Professor & Floriculture
Extension Specialist
Cornell University
134A Plant Sciences Bldg
Ithaca, NY 14853
(607) 255-4568
Janna L. BeckermanAssociate Professor & Extension Specialist
Purdue University
Department of Botany & Plant Pathology
915 West State Street
West Lafayette, IN 47907
(765) 494-4614
Raymond A. CloydAssociate Professor of Entomology
Kansas State University
Department of Entomology
239 W. Waters Hall
Manhattan, KS 66506
(785) 532-4750
Christopher J. Currey , Diane M. Camberato & Ariana P. TorresPhD Student, Technician & M.S. Student
Purdue University
Department of Horticulture & Landscape
Architecture
625 Agriculture Mall Dr.
West Lafayette, IN 47907
(765) 496-3066
Rob Eddy & Jeannie RossPlant Growth Facilities Manager &
Undergraduate Student
Purdue University
Department of Horticulture & Landscape
Architecture
625 Agriculture Mall Dr.
West Lafayette, IN 47907
(765) 496-3710
Marla FaverField Development Scientist
BioWorks Inc.
100 Rawson Rd.
Victor, NY 14564
(800) 877-9443
Charlie R. HallProfessor & Ellison Chair in International
Floriculture
Texas A&M University
Department of Horticultural Sciences
202 Horticulture/Forest Science Building
College Station, TX 77843
(979) 458-3277
Alan W. HodgesExtension Scientist in Food & Resource
Economics
1113 MCCB
Gainesville, FL 32611
(352) 392-1881 Ext. 312
Brian A. KrugFlorictulture & Greenhouse Extension
Specialist
University of New Hampshire
UNH Cooperative Extension
Spaulding Hall, G54
(603) 862-0155
It is the policy of the Purdue University Cooperative Extension Service that all persons have equal opportunity and access to its educational programs, services, activities, and facilities without regard to race, religion, color, sex, age,
national origin or ancestry, marital status, parental status, sexual orientation, disability or status as a veteran. Purdue University is an Affirmative Action institution. This material may be available in alternative formats.