
dynamics of the war to peace transition in northern …ageconsearch.umn.edu/bitstream/244091/2/38...
48
Towards Sustainable Development March 2016 OCCASIONAL PAPER. 38 DYNAMICS OF THE WAR TO PEACE TRANSITION IN NORTHERN UGANDA AFRICAN DEVELOPMENT BANK GROUP
Transcript of dynamics of the war to peace transition in northern …ageconsearch.umn.edu/bitstream/244091/2/38...

Towards Sustainable Development
March 2016
OCCASIONAL PAPER. 38
dynamics of the war to peace transition in northern uganda
african deVeLopment BanK group


Occasional Paper No.38
DYNAMICS OF THE WAR TO PEACE TRANSITION IN NORTHERN UGANDA
May 2015
Copyright © Economic Policy Research Centre (EPRC)
The Economic Policy Research Centre (EPRC) is an autonomous not-for-profit organization established in 1993 with a mission to foster sustainable growth and development in Uganda through advancement of research –based knowledge and policy analysis. Since its inception, the EPRC has made significant contributions to national and regional policy formulation and implementation in the Republic of Uganda and throughout East Africa. The Centre has also contributed to national and international development processes through intellectual policy discourse and capacity strengthening for policy analysis, design and management. The EPRC envisions itself as a Centre of excellence that is capable of maintaining a competitive edge in providing national leadership in intellectual economic policy discourse, through timely research-based contribution to policy processes.
Disclaimer: The views expressed in this publication are those of the authors and do not necessarily represent the views of the Economic Policy Research Centre (EPRC) or its management.
Any enquiries can be addressed in writing to the Executive Director on the following address:
Economic Policy Research CentrePlot 51, Pool Road, Makerere University CampusP.O. Box 7841, Kampala, UgandaTel: +256-414-541023/4Fax: +256-414-541022Email: [email protected]: www.eprc.or.ug

i
DYNAMICS OF THE WAR TO PEACE TRANSITION IN NORTHERN UGANDA
OccasiOnal PaPer nO. 38
TABLE OF CONTENTS
ACRONYMS AND ABBREvIATIONS IIIExECUTIvE SUMMARY Iv
1. INTRODUCTION vI1.1 Background to the Northern Uganda conflict vi1.1.1 Nature of conflicts by sub-region vi1.1.2 Interventions/programs undertaken to restore peace vii1.3 Objectives of the Study 1
2. DATA AND SAMPLING 22.2 Key definitions. 32.3 Descriptive Statistics 4
3. ExCLUSION AND TRUST 63.1 Household level of trust for relations and institutions 63.2 Life satisfaction after the return to peace 10
4. CHANGES IN LIvELIHOODS 134.1 Transition to peace impacts on migration 134.2 Perceived beneficiaries of the return to peace impacts on migration 144.3 Income and Livelihoods 154.4 Government’s response to demand for social services 174.5 Household perception of post-conflict security 224.6 Local government capacity 25
5. CONCLUSIONS AND RECOMMENDATIONS 276. REFERENCES 28
LIST OF TABLES
Table 1: Average Household Characteristics by geographical location 5Table 2: Level of Trust and Engagement within communities by conflict experience 7Table 3: OLS estimates of determinants of trust 9Table 4: Determinants of Life Satisfaction: Ordinary Least Squares estimates 12Table 5: Welfare Status in relation to neighbours (%) 15Table 6: Employment status (current and 2015) by sub region (%) 16Table 7: Net and Gross School Enrolment Rates by Gender, Wealth Status, and Conflict Experience 19Table 8: Perceptions about household security after the return of peace 24Table 9: Capacity of local institutions to support interventions 26Table A 1: Ordered logit estimates of determinants of trust: 30Table A 2: Services Provided by Government within 10kms of household since the end of the conflict (percent) 31Table A 3: Provision of services by NGOs within 10 kms of the household after the end of the war (percent) 31

ii OccasiOnal PaPer nO. 38
DYNAMICS OF THE WAR TO PEACE TRANSITION IN NORTHERN UGANDA
Table A 4: Among services provided by government, which ones are used by households (percent) 32Table A 5: Among services provided by NGOs, which services are used by households (percent) 32Table A 6: What the main 3 services do you think government should provide in your area (percent) 33
LIST OF FIGURES
Figure 1: How has life changed since the end of conflict in Northern Uganda (Household head, %) 10Figure 2: Reasons for migration (%) 14Figure 3: Extent to which groups in the community have benefited from the end of the conflict (%) 14Figure 4: Primary Net Enrolment Rates for children aged 6-12 years 18Figure 5: Awareness of services provided after the end of the conflict 20Figure 6: Awareness of counselling services provided by government and NGOs after the conflict. 21

iii
DYNAMICS OF THE WAR TO PEACE TRANSITION IN NORTHERN UGANDA
OccasiOnal PaPer nO. 38
ACRONYMS AND ABBREvIATIONS
AfDB African Development BankCPA Comprehensive Peace AgreementCSOPNU Civil Society Organizations for Peace in Northern UgandaDRC Democratic Republic of Congo EA Enumeration Areas EMIS Education Management Information SystemGDP Gross Domestic ProductGoU Government of UgandaIDP Internally Displaced Persons KIDDP Karamoja Integrated Disarmament and Development ProgrammeLC Local CouncilLRA Lord’s Resistance Army LSMS Living Standards Measurement SurveyMFPED Ministry of Finance Planning and Economic DevelopmentMoES Ministry of Education and SportsNER Net Enrollment RatesNGOs Non-Governmental OrganizationsNORAD Norwegian Agency for Development CooperationNUS Northern Uganda Survey NUSAF Northern Uganda Social Action Fund OLS Ordinary Least SquaresOPM Office of the Prime MinisterPRDP Peace Recovery and Development Plan SACCO Savings and Credit Co-Operatives SPLA Sudanese People’s Liberation Army UBoS Uganda Bureau of StatisticsUDHS Uganda Demographic and Health SurveyUNHS Uganda National Household SurveyUNPS Uganda National Panel SurveyUNDP United Nations Development ProgrammeUNHCR United Nations High Commissioner for RefugeesUPDF Uganda Peoples Defense Forces UPE Universal Primary EducationUSE Universal Secondary EducationWPT War to Peace Transition

iv OccasiOnal PaPer nO. 38
DYNAMICS OF THE WAR TO PEACE TRANSITION IN NORTHERN UGANDA
ExECUTIvE SUMMARY
The protracted and brutal armed conflict between the Government of Uganda (GoU) and the Lord’s Resistance Army (LRA) in Northern Uganda spanned over two decades and left a trail of social and economic upheaval in its wake. At the height of the conflict thousands were left displaced while in Karamoja sub-region, in North-Eastern Uganda, armed cattle rustling stripped many of their most prized assets. With the return to peace after the cessation of hostilities in 2006 and completion of the disarmament process in Karamoja, this study investigates the dynamics of the war to peace transition in Northern Uganda. More specifically, we examine how the households in Northern Uganda have responded to the return of peace and how this is reflected in their livelihood patterns, demand for social services, asset accumulation, demographic and migration trends and their levels of trust for each other and their local leaders.
Even though Northern Uganda has made significant progress since peace was restored in 2006 with the level of income poverty reducing from 60.7 percent in 2005/6 to 45.8 percent by 2012/13, evidence shows that the region remains the most deprived with a limited degree of convergence with the rest of the country. Analysis of the regions socioeconomic transition is predominantly based on a special survey—the ‘War to Peace Transition Survey’ carried out in August 2015; this is supplemented by Uganda Bureau of Statistics (UBoS) data collected in the region since 2004. Attention is focused on issues of personal and regional security, community cohesion, social/political inclusion, inequalities and vulnerabilities – specifically focusing on how these differ with conflict experience and between sub-regions in Northern Uganda.
Economically, there are a variety of factors that influence the post-war livelihood patterns of households. These include geographical location, population characteristics, gender, land tenureship rights, interventions by government and Non-Governmental Organizations (NGOs) and road/transport infrastructure. Recovery in post-conflict transition periods is often driven by economic sectors and activities that require minimal new investment to start; to this end, the economic reaction of post-conflict northern Uganda to the restoration of peace in the region is characterised by increased economic activity in the agricultural sector. This is reflected by both the number of households dependent on farming and husbandry for their livelihoods, and the multiplicity of government initiatives geared towards agriculture in the region. However, in spite of this increased economic activity, the overall transformation has been limited. There is still a lack of major industrial activity and the linking of farmers to bigger stable markets is still a challenge. This is mostly a result of limitations such as poor access to productive infrastructure like electricity. In addition the majority of trade is actually carried out by small scale traders and remains predominantly informal. Furthermore, the re-emergence of conflict within neighbouring South Sudan in December 2013 affected the market for agricultural products from Northern Uganda and also demonstrated the extent to which fragility in neighbouring countries can affect the regions post-conflict recovery.
Assessment of the social transformation in the region reveals that access to services (particularly to schools and health facilities) has improved since the end of the conflict, although this has seemingly been to the detriment of other services like the provision of psycho-social support. Demand for and awareness of services is largely driven by the presence of large scale government recovery programmes such as the PRDP and NUSAF which have been responsible for the building and expansion of education and health facilities. However, the staggered returns process that started in 2006 with varied patterns across regions ultimately affects households’ awareness of and demand and use of services as well as the extent to which they have been able to take advantage of the peace dividend.
In spite of some issues regarding political and social exclusion, the post conflict communities are generally trusting of their neighbours—especially households with members who were formerly displaced. Nevertheless, there is

v
DYNAMICS OF THE WAR TO PEACE TRANSITION IN NORTHERN UGANDA
OccasiOnal PaPer nO. 38
an overwhelming sense from the survey that women and youth have benefited the least from the return to peace. The policy recommendations arising out of this report address the need to mend the fragilities that obstruct the path to productive transition. Demographically, a quarter of surveyed households were female headed with this figure doubling in Karamoja. The average household size in the region is also significantly bigger than the national average meaning that more concerted region specific interventions are required if the peace dividend is to benefit all.

vi OccasiOnal PaPer nO. 38
DYNAMICS OF THE WAR TO PEACE TRANSITION IN NORTHERN UGANDA
1. INTRODUCTION
1.1 Background to the Northern Uganda conflict
The conflict experienced in northern Uganda varied in cause, nature and intensity across sub-regions. The three regions of analysis applied in this study –West Nile, Lango/Acholi (Mid-north) and Karamoja (North East) - all either continuously or intermittently suffered conflict whilst the rest of the country remained stable. Historically, dating back to the colonial administration, Northern Uganda was used primarily as a labour reservoir that supported the burgeoning cash crop economies in the rest of the country (MOFPED, 2003). The northern region took a while to get involved in the area of trade and commercial agriculture1 and as a result the rest of the country established better foundations for infrastructure and economic development (Mamdani 2001). This socio-economic cleavage in the country was further widened by conflict in northern Uganda whilst the rest of the country was in peace. Although different regions in the north experienced different waves and types of conflict; the Conflict in northern Uganda was predominantly characterized by fighting between the Ugandan army and various rebel groups with the Lord’s Resistance Army (LRA formed in 1987) doing the majority of damage. The conflict lasted over 20 years for a number of reasons including: inefficiencies within the national army; involvement of external actors on both sides of the frontline—especially the Government of Sudan and the former Sudanese People’s Liberation Army (SPLA); and the usage of extreme violence by LRA to recruit combatants as well as acquire supplies (Van Acker, 2004).
1.1.1 Nature of conflicts by sub-region
Acholi/Lango sub-region: Conflict in the Acholi sub-region is often traced back to Uganda’s aforementioned historical welfare divide—“the marginalized north—prosperous south divide” (Gersony 1997), and as a
1 “By the mid-1950s, farmers in Buganda had cash incomes higher than any-where else in the country – three times those of farmers in Acholi and West Nile, and nine times higher than the cattle herders of Karamoja. It is an im-balance that the subsequent growth in commerce, public administration and services has only exacerbated” (Leggett, 2001).
way to reverse this unfavourable situation, numerous rebel groups with roots in northern Uganda attempted to capture state power through the use of arms2.The Acholi sub region was the epicentre of the armed insurgency and suffered the brunt of the violence. Although the intensity of conflict in Acholi and Lango regions is not necessarily comparable, quite a few districts in Lango suffered immensely as the conflict spread whilst others experienced various spill over effects in the form of refugees etc. Intensified military operations by the government in 2002 coupled with declining food stocks for the rebels in Acholi resulted in the extension of the war to the neighbouring Lango and Teso sub-regions in 2003.
West Nile sub-region: The West Nile region had two rebel groups; the West Nile Bank Front (WNBF) and Uganda National Liberation Front (UNLF II) both of which operated in and out of DR Congo; by 2001 both groups had reached a peace agreement with the government3. The worst of the conflict occurred in the early 90’s for a shorter duration from 1992 to 1996 between government and the rebel groups. In spite of an earlier return to peace, the region received several refugees fleeing conflicts in the neighbouring Acholi/Lango region, South Sudan and Democratic Republic of Congo (DRC); putting even more pressure on already strained public services4. War in the two neighbouring countries has had a de-stabilising effect on the sub-region which has been described as the “centre of border conflicts” (Daily Monitor, 2015).
Karamoja sub-region: In contrast to the rebel insurgencies in the Acholi/Lango and West Nile sub-regions, insecurity in Karamoja (North Eastern Uganda) was driven by cattle rustling activities. The people of Karamoja—the Karamojong, are predominantly
2 Previous assessments e.g. by Deininger (2003) find evidence of this phe-nomena of “greed as a driver of civil war”. Specifically, Deininger shows that the civil unrest in Uganda was most likely to occur in areas such as Northern Uganda –characterised by limited resources as measured by the low number of coffee farmers in the community at a time when coffee was a huge cash crop.
3 http://www.insightonconflict.org/conflicts/uganda/conflict-profile/4 In 2006, Nebbi hosted 5,000 Congolese refugees from Nioka and Bunia while
Arua had about 60,000 South Sudanese refugees (Daily Monitor, 2015).
vii
DYNAMICS OF THE WAR TO PEACE TRANSITION IN NORTHERN UGANDA
OccasiOnal PaPer nO. 38
pastoralists and have historically engaged in cultural cattle raiding both within the sub-region and against neighbouring ethnic groups (i.e. the Pokot from western Kenya). Initially, the cattle raids were undertaken using rudimentary weapons like spears; bows; and arrows, and as consequence cattle rustling activities were less extensive and less expansive. However, the political upheavals in Uganda in the late 1970s that culminated in the overthrow of President Idi Amin in 1979 led to the capture of most light ammunitions in the Moroto armoury by the local population (Mirzeler and Young, 2000). This, coupled with the frequent famines that decimated cattle herds in Karamoja, led to increased frequency of cattle raids to neighbouring districts as a means of restocking herds. There had always been cultural ‘relations of trade (barter), conflict (raids) and marriages’ (Ocan 1994) between the Karamajong and neighbouring ethnic groups as well as amongst the different Karamojong sub-groups/clans. However, the introduction of the gun into Karamojong culture changed the way the Karamojong related with each other and with their neighbours, all of whom became particularly vulnerable to the now armed Karamojong groups. In the 1990s, conflicts in neighbouring countries particularly in: southern Sudan, Somalia, and Ethiopia, led to the proliferation of small arms trade within Karamoja, further aggravating the problem.
1.1.2 Interventions/programs undertaken to restore peace
In order to reduce the violence and improve security within Karamoja sub-region, the Government of Uganda (GoU) launched a disarmament programme in December 2001. The first two months of the disarmament process were voluntary and warriors who surrendered their weapons and guns were compensated with incentivising items like money and other assets such as building materials (iron sheets), among others. At least 10,000 guns were surrendered during the voluntary period after which the national army-the Uganda Peoples Defence Forces (UPDF) initiated a “cordon and search” operation to forcefully confiscate weapons (Bevan, 2008). This voluntary phase managed to reduce weapon holdings but on a varying scale across the different ethnic groups in Karamoja. For instance, the Bokora sub-ethnic group willingly surrendered up to 44 per cent of their weapons,
while the Jie and Dodoth respectively gave up only 27 percent and 20 percent of their projected stock (Bevan 2008). The voluntary disarmament phase in Karamoja was interrupted by the escalation of hostilities between the UPDF and the LRA rebels during March 2002 and June 2003 in Acholi, Lango and Teso sub-regions. The withdrawal of the UPDF in Karamoja to counter the LRA insurgency exposed communities and led to an increase raids in Karamoja. The GoU then launched the Karamoja Integrated Disarmament and Development Programme (KIDDP) in 2005 which however proved ineffective. It was then re-launched with the cordon and search operation by the UPDF in May 2006, which was able to achieve successful demobilization; by 2008 the operation had netted 30,000 guns (Ralston, 2012).
Meanwhile, in West Nile and in the Mid-north, the cessation of hostilities was preceded by the acceptance and signing of the Comprehensive Peace Agreement (CPA) between GoU and LRA in 20065. The resultant relatively calm Northern Uganda was declared a post-conflict region, thus opening the doors for recovery. The return of peace, more effective local administration and some improvement in the provision of public services, have helped revive the Northern Uganda Economy. Since 2007, most of the Internally Displaced Persons (IDP) camps have been closed and depending on location, several households have been supported to return to their former homesteads. The process and timing of returning to former homesteads has varied across regions which consequently affects the extent to which different households have been able to take advantage of the peace dividend (Bjorkhaug et al., 2007). A study by Bozzoli et al., (2011) showed that due to the urban-like more commercialised environment, households which remained in IDP camps were more likely to engage in trade related economic activities when compared to their counterparts who had returned to their homes6. In spite of this, these same households (in IDP camps) were also the least likely to broaden their income generation activities probably due to uncertainty (Bozzoli et al., 2011).
There have been significant investments across
5 LRA leader Joseph Kony is yet to sign the CPA and remains at large.6 Many IDP camps grew into urban centres with the residents engaging in
various kinds of petty trade to supplement their aid hand-outs

viii OccasiOnal PaPer nO. 38
DYNAMICS OF THE WAR TO PEACE TRANSITION IN NORTHERN UGANDA
Northern Uganda during the post-conflict era, these include but are not limited to; Peace Recovery and Development Programme (PRDP); NUSAF – Northern Uganda Social Action Fund; Karamoja Livelihoods Programme (KALIP) and the Business Uganda Development Scheme-UK Department for International Development (BUDS-DFID)7. The most prominent of these large scale initiatives has been the implementation of the Peace Recovery and Development Programme (PRDP) series; starting with PRDP I from 2007-2010. The budget for PRDP I was US$ 625 million (UGX 1,060 billion) for 2007-2010 (Marino, 2008) and the sectors targeted were health, education, water and public works. The successor PRDP II (2012-2015) expanded the focus areas to include: enhancements of local governments, police, judiciary, prisons and district land boards; enterprise development; production and marketing of agricultural products; infrastructure, and natural resource management; and peace building, resettlement and reintegration and dispute settlement. At least US$ 455 million was budgeted for expenditure under PRDP II, of which US$ 215 million was spent through the national budget allocation and the remaining US$ 240 million was spent via special project and off-budget activities (GoU, 2011). More recently, PRDP III was launched in May 2015 with three strategic objectives: consolidation of peace; development of the local economy; and reducing vulnerability. Apart from the PRDP, the GoU has since 2010 piloted a cash transfer scheme—the Social Assistance Grants for Empowerment (SAGE) in 14 of the poorest districts of Uganda. At least 9 of the 14 districts are from Northern Uganda—predominantly in Karamoja.8 Beneficiaries of the scheme receive an unconditional monthly grant of UGX 25,000 (approximately US$ 8). Consequently, it is important to review the level of awareness of such recovery initiatives, the role they have played in the transition period and beyond recovery, understand how households in the region can be more integrated with the rest of the Ugandan economy.
7 This was implemented by the Private Sector Foundation (PSFU) on behalf of the Office of the Prime Minister (OPM)
8 At least 5 of the 7 districts in Karamoja are included in the prorammes. It is only the districts of Kaabong and Kotido within Karamoja that are not included in the SAGE programme.
1.2 Justification for the Study
Against the above background on the history of conflict in Northern Uganda, the present study examines the war to peace transition in the region. There are a number of important considerations for examining these issues. First, the LRA conflict destabilized Northern Uganda in a variety of ways. For instance, during the war, in an effort to increase the security of people in the region, the GoU instituted a scheme that obliged people to move into IDP camps, rendering large parts of Northern Uganda economically inactive. By 2005, there were 218 IDP camps with a population of over 1.8 million people—about 20 percent of the population in Northern Uganda (GoU, 2007). Although households in IDP camps had better access to social services, camps were nonetheless associated with degeneration in social values, higher levels of crime; and high rates of alcohol and drug consumption (Nannyonjo, 2005). Apart from displacement into camps, another severe effect of the civil war was the abduction of civilians (mostly children) who were then conscripted into the rebel ranks as combatants; at least 25,000 children were abducted by the rebels between 1986 and 2002. Furthermore, estimates by Civil Society Organizations for Peace in Northern Uganda (CSOPNU) showed that the net loss to the Ugandan economy as a result of the war was about US$ 85 million per year (about 2.6 percent of GDP) during the 20 years in which the region was embroiled in conflict (CSOPNU, 2006). In addition, the conflict resulted in the closure of public facilities—notably school and health facilities. Estimates by Ssewanyana et al (2006) showed that during the conflict at least 13 percent of community schools were closed at any given time during the year. The war also changed the demographics of Northern Uganda—the region is over-represented among female headed households, as a direct consequence of losing men to the conflict. The share of widows among household heads in Northern Uganda—increased from 10 percent in 2005/6 to 16 percent by 2009/10 (Ssewanyana and Kasirye, 2012). During the war, a substantial proportion of households in Northern Uganda relied on external support in order to meet basic needs. Estimates by Ssewanyana and Kasirye (2012) showed that between 2005/6 and 2009/10, at least one in every four households in Northern
1
DYNAMICS OF THE WAR TO PEACE TRANSITION IN NORTHERN UGANDA
OccasiOnal PaPer nO. 38
Uganda consumed food acquired through some form of assistance. Consequently, the living standards of households in Northern Uganda have remained low—at least one out of every four households in the region are chronically poor (UBoS, 2015b). Education attainment remains low although it is slowly improving and the region maintains the highest rate of child mortality in the country although this reduced during 2006-2011 (Uganda Bureau of Statistics and ICF International 2012).
Domestic and foreign investment in the region has increased.The return to peace in Northern Uganda also coincided with the creation of the South Sudan and the subsequent interim Peace in the new state. Northern Uganda has had trade relations with South Sudan dating back to the colonial times; these were disrupted by conflict on both sides of the border and then later reignited by the restoration of peace. Since the withdrawal of the LRA rebels from northern Uganda, there has been an increase in trade going through the region. Specifically, Uganda’s value of informal trade more than doubled from US$ 231 million in 2006 to US$ 776 million in 2007 due to an increase in the amount of goods destined for South Sudan (Uganda Bureau of Statistics, 2009). However, the re-emergence of conflict within South Sudan in December 2013 and subsequent civil war led to the reduction in the level of exports to the country.9 The South Sudan crisis also demonstrated the extent to which fragility in neighbouring countries can affect post-conflict recovery.10
One of the main justifications for seeking a better understanding of the transition process is that there is often a conflict trap borne out of civil war; this trap is accentuated by the challenge of rebuilding a society and its economy while steering it away from triggers that could inevitably see it slip back into violence (Collier, 2007). The other justification is to make sure that the nature and extent of the conflict, is well understood as conflicts differ from country to country and even
9 The level of informal exports to South Sudan reduced by 8.5percent between 2013 and 2014 (Uganda Bureau of Statistics, 2015).
10 Due to the escalation of the crisis in South Sudan, the level of remittances reduced by 30percent during 2013/2014 and this reduced Uganda’s GDP by a projected 0.2-0.3 percentage points (Ministry of Finance Planning and Economic Development, 2014). In addition, the conflict led to an increase of refugees in Northern Uganda (especially in the West Nile sub region)
within countries. Previous assessments on post-war transitions have focused on instances where conflicts affected entire countries and most of these have been ‘resource conflicts’ – e.g. Angola, Sierra Leone, and DRC—where there was a strong economic dimension to the fighting (Collier and Hoeffler, 2000; Ballentine and Nitzschke, 2005). In this regard, what happened in Uganda is distinct because the conflict was isolated in one part of the state, while the rest of the country remained peaceful and enjoyed notable economic growth and development. Furthermore, the political and social grievances that kick-started the violence in Northern Uganda did not necessarily contribute to its continuation as a number of new factors later came into play. In particular, conflict spill-overs from neighbouring countries and the use of extreme violence by the LRA due to loss of support among the rebel’s main ethnic group—the Acholi, all came to play a role in the continuation of the conflict in the later years.
1.3 Objectives of the Study
The extent to which the conflict changed the lives of the affected communities is undoubtedly immense. It is therefore important to have an understanding of how the transition to peace and the peace initiatives in place have helped people to recover from the effects of the conflict. It is also important to understand how the war changed the households’ production, consumption and investment behavior and decisions. It is against the above background that the African Development Bank (AfDB) supported the WPT survey in Northern Uganda as part of the broader goal of understanding fragility in African countries. The overall objective of this study was to investigate the dynamics of the war to peace transition in Northern Uganda. Specifically, the study sought to:• Understand how the households in Northern
Uganda have responded to the return of peace and how this is reflected in their livelihood choices, demographic and migration patterns, and their demand for services. This is done under a dedicated survey in Northern Uganda (linked to the previous 2008 Northern Uganda Survey), and the study also uses data collected by agencies of the government.
• Provide insights into the government’s response to the demand for social services of

2 OccasiOnal PaPer nO. 38
DYNAMICS OF THE WAR TO PEACE TRANSITION IN NORTHERN UGANDA
the population, notably health, education and infrastructure, as they return to more normal lives.
• Identify the ways, if any, experience of conflict has affected trust for relatives, neighbours and government.
• Examine local government capacity to support post conflict interventions.
• And finally analyse household’s sense of the security.
The rest of the report is organized as follows. In section 2, we provide details of the survey implemented. Section 3, discusses the key results of the survey relating to exclusion and trust. Section 4 examines changes in livelihoods and access to services after the end of the war. Section 5 provides the conclusions and policy options of the study.
2. DATA AND SAMPLING
The main source of data for analysis was the 2015 War to Peace Transition (WPT) survey conducted by Economic Policy Research Centre (EPRC) between July and August 2015. The objective was to collect high quality data on household socio-economic changes after the end of the war. The baseline for the 2015 WPT survey was the 2004-2008 Northern Uganda Survey (NUS) conducted by the Uganda Bureau of Statistics. The NUS was conducted to evaluate the World Bank sponsored Northern Uganda Social Action Fund (NUSAF) implemented during 2003-2012. NUS was modelled along the lines of Living Standards Measurement Survey (LSMS) and captured traditional information on household demographics and livelihoods as well as detailed information on household experiences of shocks arising from conflict. Linking the WPT to the NUS helped to capture data on households based in Northern Uganda at two discrete periods; namely during and after the conflict. The NUS covered 478 Enumeration Areas (EAs) across 5 sub regions that made up the wider Northern Uganda.
Unlike the NUS, the WPT survey focused only on the four sub regions with actual experience of conflict
i.e. Acholi, Karamoja, Lango and West Nile.11 The four sub regions also formed strata (non-overlapping sub groups) used in the WTP survey (maintained following the NUS). The WPT survey, randomly selected 120 EAs out of the 478 EAs surveyed under the NUS (I.e. 30 EAs per stratum). For each of the selected EAs, enumerators were availed a list of all households previously surveyed under the NUS. The set protocol was that enumerators had to update the household list prior to survey listing to ensure completeness, account for the fact the area has stabilized after resettlement from displacement and also to reflect the new population. During the household listing activity of the WPT survey, households that were part of the 2008 NUS were identified and sampled with a probability of one i.e. all previous NUS households identified were automatically selected. Additional households were sampled so that the total number of surveyed households in each EA was 10. At least 1,200 households from 21 districts (based on the old 2007 district boundary classification used in the NUS) and 120 EAs were targeted for interview. The final sample covered 7,159 individuals in 1,160 households and as such the level of non-response was 3.3 percent. Out of the selected households, at least 309 (22 percent of the weighted sample) were previously surveyed in 2004 and 2008. During the analysis, data was weighted based on the 2014 Population and Housing Census and this information was provided by Uganda Bureau of Statistics (UBoS). Furthermore, the weights account for both non-response and the regional population. The 2015 WPT survey was multipurpose and contained detailed information on household rosters/personnel characteristics, demographics, group affiliations migration, education, labour force status, operation of household businesses and enterprises, social inclusion, housing conditions, environmental conditions, household enterprise assets, displacement due to the war, land access and utilizations, expectations, communication and information sharing, welfare and food security. In addition to the household survey, a community questionnaire was administered in each surveyed EA. This particular module captured
11 The excluded sub region was Teso in Eastern Uganda. This particular region did not experience direct conflict but was host to populations displaced by the LRA war during 2002-2005 (this was the reason for its inclusion in the NUS).

3
DYNAMICS OF THE WAR TO PEACE TRANSITION IN NORTHERN UGANDA
OccasiOnal PaPer nO. 38
availability and proximity to public services within the village; major community events in 2005 and 2015; implementation of projects in the community after the end of the conflict and available education infrastructure (primary and secondary schools).
2.2 Key definitions.
2.2.1 Conflict experienceThe survey examined conflict experience for individuals who are aged at least 18 years. Specifically, the survey collected information on: displacement, abductions, and economic activities during the war, and conflict impacts on livelihoods. The specific questions include the following:
• Was (NAME) displaced during the conflict? • Was [name] ever a resident of an internally
displaced persons (IDP) camp? • Was [name] ever abducted by rebels? • Did some [at least one] members of this
household die during the conflict?
Based on the above questions, we generate key indicators of conflict experience as: (i) IDP as having at least one household member previously resident in an IDP camp; (ii) Abduction: At least one household member abducted; and (iii) Death: Household reporting that at least one member died due to conflict.
2.2.2 Conflict intensity
In addition, we also use in some instances the official government classification of geographical conflict intensity. In particular, the PRDP II report classifies Northern Uganda into: severely affected by conflict and/or cattle rustling, and those that were sporadically affected. The severely affected region includes the districts of Adjumani, Gulu, Kitgum, Kotido, Moroto, Nakapiripirit, Pader, Abim, Amuru, Kaabong, and Oyam. The sporadically affected districts include: Apac, Arua, Lira, Moyo, Nebbi, Yumbe, Amolator, Dokolo, and Koboko (GoU, 2011). The map below shows that the severely affected districts in red.
Map 1: Northern Uganda map by intensity of conflict
Source: UBoS, 2015.
4 OccasiOnal PaPer nO. 38
DYNAMICS OF THE WAR TO PEACE TRANSITION IN NORTHERN UGANDA
2.2.3 Asset/wealth index
Unlike, the typical LSMS survey, the WPT survey did not have a consumption module. Following studies that account for household wealth in the absence of expenditure data (e.g. Ssewanyana and Younger, 2008), we use factor analysis to construct an asset/wealth index for each household. The 11 asset variables included in the wealth index are whether a household has a: car, motorcycle, bicycle, television, and mobile phone. In addition, we include an indicator for the construction material used for the main floor of the house, access to electricity or gas for lighting; access to or ownership of a private toilet (covered pit latrine, VIP, or flush toilet); the households main source of drinking water; number of rooms used for sleeping and the household head’s education attainment in years.
2.3 Descriptive Statistics
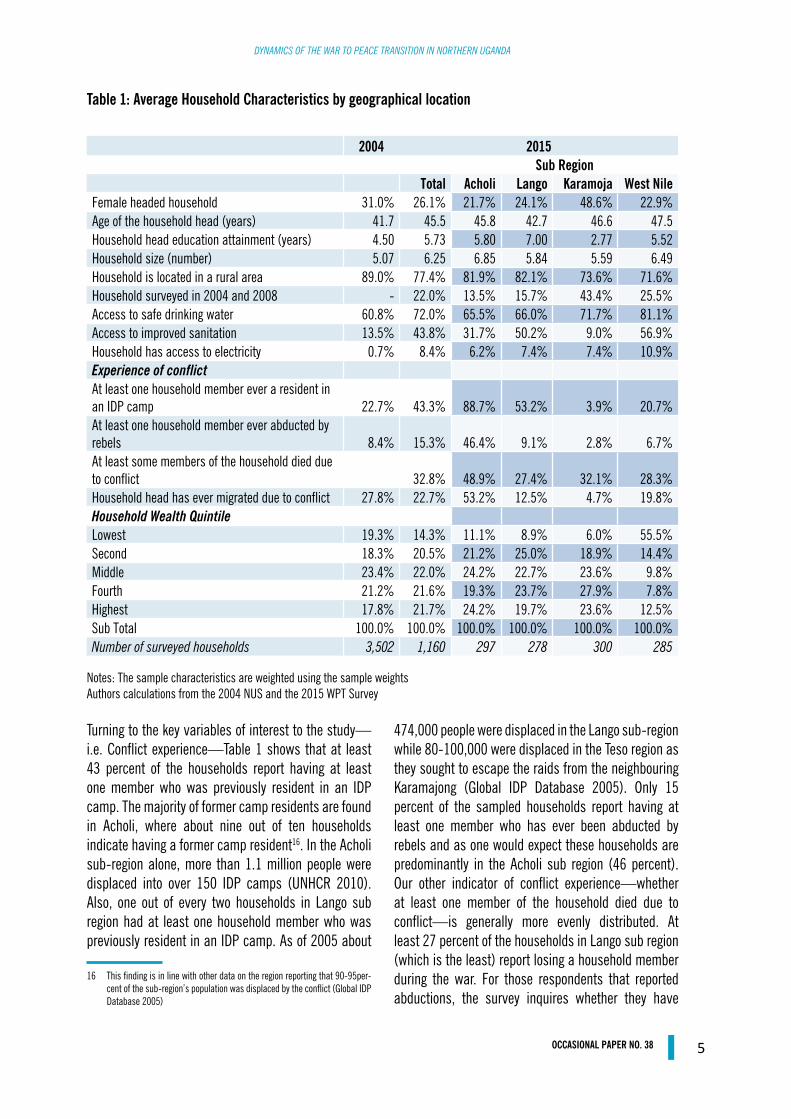
Table 1 shows some of the key characteristics of the households. It is indicated that one out of every four households in the sample is female headed; the rate rises to one out of two in Karamoja sub region. This is in part explained by the fact that the men normally go out with the herds for weeks on end. The average household head education attainment is 5.8 years and again the Karamoja sub region exhibits extremely low education attainment of 2.8 years—partly explained by dominance of female heads in the sub region who in general have less access to education and also generally weaker education attainment across the sub-region.12 The average household size in the surveyed households is 6.2 and this is significantly above the national average of 4.7 persons recorded during the 2014 population census. At the sub-region level, the average household size ranges from 5.6 in Karamoja to 6.8 in Acholi sub region. Even though the war resulted in the loss of human lives, the large household sizes are the result of high fertility rates, high adolescent fertility rates and the low uptake of family planning and contraceptives in the region (UNDP 2015). Table 1 shows that at least 72 percent of the households in Northern Uganda have access to safe drinking water with the West Nile region recording
12 Based on the WPT survey, the average household head education attainment in Karamoja is 1.6 years for females and 3.8 years for male heads.
the highest rate at 81 percent with Karamoja recording up to 72 percent. These figures are in accordance with the emphasis13 the PRDP and government have placed on service provision particularly in the Karamoja sub-region which obtained a substantial amount of funding for water provision. In the Lango and Acholi region where there were high levels of displacement access to safe drinking water was slightly lower as the returns of formerly displaced persons outpaced recovery strategies, service provision and implementation (IDMC 2011). Coverage of safe water at return sites where a lot infrastructure had been destroyed would inevitably be low.
At 44 percent, overall access to improved sanitation is much lower than access to safe drinking water and is lowest in the two sub regions most affected by the conflict i.e. Acholi and Karamoja with 32 percent and 9 percent coverage respectively14. The conflict experienced in the Acholi region resulted in high levels of temporary and semi-permanent settlements where sanitation came second to various other needs (shelter, security, food etc). In Karamoja, the low ownership and usage of improved sanitation facilities is predominantly a function of lifestyle and culture. On the one hand, the pastoralist herdsmen are often on the move in search of water for their herds and are thus not inclined to invest in or use permanent sanitation facilities. On the other hand there are some cultural beliefs that find it taboo to mix excreta with in-laws and elders, thus making it taboo to use pit latrines (Orisa 2012). Access to productive infrastructure notably electricity is also generally low—only 8 percent of the sampled households have access to electricity with the highest access in West Nile at 11 percent15.
13 The Ministry of Water and Environment made an extra allocation of 5 billion UGX for Northern Uganda in the 2008/09 budget (NORAD 2008).
14 In Karamoja sub region, at least 61 percent of the sampled households re-port having no formal sanitation facility i.e. use the bush/lake to dispose excreta and the corresponding rate for Acholi sub region is 16percent.
15 Overall access to electricity in Uganda is not very high. According to the 2012/13 Uganda National Household Survey (UNHS), only 14percent of households across the country have access to electricity (UBoS, 2014).
5
DYNAMICS OF THE WAR TO PEACE TRANSITION IN NORTHERN UGANDA
OccasiOnal PaPer nO. 38
Turning to the key variables of interest to the study—i.e. Conflict experience—Table 1 shows that at least 43 percent of the households report having at least one member who was previously resident in an IDP camp. The majority of former camp residents are found in Acholi, where about nine out of ten households indicate having a former camp resident16. In the Acholi sub-region alone, more than 1.1 million people were displaced into over 150 IDP camps (UNHCR 2010). Also, one out of every two households in Lango sub region had at least one household member who was previously resident in an IDP camp. As of 2005 about
16 This finding is in line with other data on the region reporting that 90-95per-cent of the sub-region’s population was displaced by the conflict (Global IDP Database 2005)
474,000 people were displaced in the Lango sub-region while 80-100,000 were displaced in the Teso region as they sought to escape the raids from the neighbouring Karamajong (Global IDP Database 2005). Only 15 percent of the sampled households report having at least one member who has ever been abducted by rebels and as one would expect these households are predominantly in the Acholi sub region (46 percent).Our other indicator of conflict experience—whether at least one member of the household died due to conflict—is generally more evenly distributed. At least 27 percent of the households in Lango sub region (which is the least) report losing a household member during the war. For those respondents that reported abductions, the survey inquires whether they have
2004 2015 Sub Region Total Acholi Lango Karamoja West NileFemale headed household 31.0% 26.1% 21.7% 24.1% 48.6% 22.9%Age of the household head (years) 41.7 45.5 45.8 42.7 46.6 47.5Household head education attainment (years) 4.50 5.73 5.80 7.00 2.77 5.52Household size (number) 5.07 6.25 6.85 5.84 5.59 6.49Household is located in a rural area 89.0% 77.4% 81.9% 82.1% 73.6% 71.6%Household surveyed in 2004 and 2008 - 22.0% 13.5% 15.7% 43.4% 25.5%Access to safe drinking water 60.8% 72.0% 65.5% 66.0% 71.7% 81.1%Access to improved sanitation 13.5% 43.8% 31.7% 50.2% 9.0% 56.9%Household has access to electricity 0.7% 8.4% 6.2% 7.4% 7.4% 10.9%Experience of conflictAt least one household member ever a resident in an IDP camp 22.7% 43.3% 88.7% 53.2% 3.9% 20.7%At least one household member ever abducted by rebels 8.4% 15.3% 46.4% 9.1% 2.8% 6.7%At least some members of the household died due to conflict 32.8% 48.9% 27.4% 32.1% 28.3%Household head has ever migrated due to conflict 27.8% 22.7% 53.2% 12.5% 4.7% 19.8%Household Wealth QuintileLowest 19.3% 14.3% 11.1% 8.9% 6.0% 55.5%Second 18.3% 20.5% 21.2% 25.0% 18.9% 14.4%Middle 23.4% 22.0% 24.2% 22.7% 23.6% 9.8%Fourth 21.2% 21.6% 19.3% 23.7% 27.9% 7.8%Highest 17.8% 21.7% 24.2% 19.7% 23.6% 12.5%Sub Total 100.0% 100.0% 100.0% 100.0% 100.0% 100.0%Number of surveyed households 3,502 1,160 297 278 300 285
Notes: The sample characteristics are weighted using the sample weightsAuthors calculations from the 2004 NUS and the 2015 WPT Survey
Table 1: Average Household Characteristics by geographical location

6 OccasiOnal PaPer nO. 38
DYNAMICS OF THE WAR TO PEACE TRANSITION IN NORTHERN UGANDA
experienced discrimination. At least 22 percent felt that they had been socially or politically excluded as a result of their abductions (not shown in the table). The most common type of discrimination came in the form of exclusion from social activities in the village, the worst of which was experienced in the Lango sub-region with 31.5 percent reporting prejudice.
Social exclusion due to conflict experience.
I recall very vividly my experience of the LRA war in northern Uganda and more especially the day when my father was brutally murdered and I got shot by the rebels. The rebels attacked mid-morning and fired live bullets which killed many people in our village. I got shot in one of the legs but managed to escape by diving in the pool of blood and shielding myself with dead bodies. I witnessed the murder of those who had initially escaped including that of my own father. After the end of the war, I sometimes feel discriminated against by people. However, I have experienced a lot of suffering that I do not care what people think and say about me. I feel bad that I was not able to go to school because of the insecurity but I will work hard, tooth and nail to educate my daughter.
A survivor of LRA attack
The wealth/asset index characteristics in the bottom part of Table 1 reveal that most of the poorest households (55 percent) are in the West Nile region although the sub-region did not necessarily experience the worst effects of the war. The relatively high deprivation rates in Karamoja are attributed to historical marginalization dating back to the colonial times and the extreme weather conditions that prohibit extensive and regular agricultural production. The sub region is severely affected by climate change and with droughts being a regular occurrence cattle rustling and the proliferation of small arms in the sub region only worsened the situation. As result of the above factors, Karamoja sub region has maintained the worst indicators of deprivation. For instance, in 2012/13, whereas the overall incidence of poverty in Northern Uganda was 43 percent, the poverty head count in Karamoja was nearly double at 74 percent (UBoS, 2014). Although the
sub region accounts for only 3.4 percent of Uganda’s population, it nonetheless contributes 20.7 percent to the national headcount poverty index.
3. ExCLUSION AND TRUST
3.1 Household level of trust for relations and institutions
One of the traumatic effects of a war is the creation of an environment of mistrust among communities and within households. For the case of Northern Uganda, the potential sources of mistrust related to the war are related to the brutal methods used by the rebels to recruit and conscript children, as well as the type of attacks carried out by such children while in captivity. Previous assessments show that returnees, former abductees or ex-combatants are sometimes negatively perceived by society and this affects their ability to integrate back into their communities (El-Bushra et al., 2013). There is also evidence to show that children born in rebel captivity as a result of rape are perceived as alien—especially in the Acholi community primarily because they have an undefined paternal heritage (International Alert, 2015) which is very problematic in a patriarchal society. This kind of negativity is bound to have an effect on trust levels between individuals, families and the community. As such, the survey inquired about the level of interactions with family members as well as trust for neighbours and government. Table 2 shows the results for trust and engagement with communities (for household members aged 13 years and above). Firstly, most individuals regardless of conflict experience report that their level of interaction with others is very good. The frequency of reporting “very good” interactions is highest for family members compared to neighbours. Secondly, nearly all individuals report trusting family members “very much” —at 83 percent. People are equally “very much” trusting of neighbours and government policies at a rate of about 60 percent. The table also shows that although there are no major differences in the level of engagement with others and trust by conflict experience; on the whole, households who experienced conflict tend to have fewer interactions with neighbours and are also less trusting when compared to the “ALL”

7
DYNAMICS OF THE WAR TO PEACE TRANSITION IN NORTHERN UGANDA
OccasiOnal PaPer nO. 38
category. In particular, households who’ve had at least one member abducted appear to have more misgivings about their families and neighbours, with the lowest percentages for both interactions and trust.
Another issue we investigate is whether the experience of conflict affected people’s trust of their relatives, neighbours or government programmes after accounting for other variables. This is important given the evidence showing that conflicts have long term impacts on trust. For example, Nunn and Wantchekon (2011) show that the high levels of mistrust of relatives, neighbours, co-ethnics and government among Africans relative to other regions (as captured in the Afro barometer surveys) is due to long and brutal experience of slave trade—an era characterized by individuals being sold and taken into captivity. Whilst not directly comparable to slavery, the low levels of trust and social interactions recorded by households with individuals who have experienced abduction echo the findings of Nunn and Wantchekon.
In order to examine the correlates of trust and conflict experience, we estimate the determinants of trust using the Ordinary Least Squares (OLS) approach. Following Nunn and Wantchekon (2011), we estimated the following equation:
In this, i represents individuals, e ethnic groups, j communities. The trust dependent variable represents
one of the three measures of trust i.e. of relatives, neighbours and government. The conflict experience variables are defined in section 2.1. The coefficient of interest is , the estimated relationship between the conflict experience and the individual’s current level of trust. On the other hand, the represents a set of individual-level covariates such as age, age squared, religious affiliation, gender, education attainment, ethnicity and an indicator for whether the respondent lives in an urban location.
For the dependent variable, we generate a measure of trust based on the response to questions regarding trust for relatives, neighbours, or government. In particular, we generate values from 0 to 4—with 0 representing no trust at all while 4 represent a high level of trust.17 Among the independent variables included in the regression is the composite measure of conflict exposure as well as separate individual indicators of: previous residence in an IDP camp; experience of abduction and loss of family member due to the war.18 Table 3 reports the results of the OLS estimates, which control for demographics, education attainment, ethnicity, and urban location. It is indicated that for trust of relatives, none of our measures of conflict experience has any significant relationship with trust.
17 The specific trust questions were: (i) How much do you trust the other mem-bers of your household?; (ii) How much do you trust your neighbours?; and (iii) How much do you trust the intentions and policies of government?. The five possible answers to the trust questions were: (i) Very much; (ii) Quite a bit; (iii) Somewhat; (iv) A little; and (v) Not at all.
18 The specific questions relating to conflict experience were: (i) Was (NAME) displaced during the conflict?; (ii) Was [name] ever a resident of an inter-nally displaced persons (IDP) camp?; (iii) Was [name] ever abducted by reb-els?; and (iv) Did some [at least one] members of this household die during the conflict?
Table 2: Level of Trust and Engagement within communities by conflict experience
All
Conflict Experience: At least one household member ever Resident in IDP camp Abducted Died due to conflict
Proportion of individuals who characterize the following engagement with others as “very good”(a) Interactions with other family members 81.6 80.5 76.7 78.7(b) interactions with neighbors 68.6 65.8 56.1 60.4( c ) Consider neighbors as friendly 66.6 65.2 55.1 62.9
Proportion of individuals who report trusting ….. “very much”(d) Family members 82.9 83.1 76.4 79.1(e ) Neighbors 60.9 59.1 54.1 55.2(f) Intentions and policies of government 59.4 57.6 52.6 58.2

8 OccasiOnal PaPer nO. 38
DYNAMICS OF THE WAR TO PEACE TRANSITION IN NORTHERN UGANDA
This particular result may be partly explained the very high level of trust reported for relatives; at least 80 percent of the respondents indicating trusting their relatives “very much”.
The second panel of Table 3 shows that our composite measure of conflict experiences is significantly associated with increasing trustworthiness towards neighbours. Turning to the individual’s conflict measures, the table indicates that it is only the previous residence in an IDP camp variable that is associated with increasing trustworthiness towards neighbours. It is possible that living in close proximity with other people in IDP camps led to an increase in sense of community and hence trust. Results in the third panel show that those who lost relatives during the war significantly distrust government, and this mistrust is borne out of a number of reasons. Firstly, respondents
who lost loved ones during the war are predictably less trusting probably due to the traumatic experiences of observing rebels commit massacres. Secondly the drawn out nature of the conflict has resulted in feelings of neglect and abandonment underpinned by the sentiment that the government didn’t do enough to protect people from the rebels. Thirdly and most importantly the UPDF has persistently been accused of committing atrocities like executions, torture, rape and sexual assault in northern Uganda (Human Rights Watch 2005). Investigations into these crimes are rarely made public and with few prosecutions taking place the appearance of impunity is bound to result in a significant loss of trust (Nannyonjo 2005). As a robustness check, Table A1 in the appendix re-estimates the specifications from Table 3 of the paper using an ordered logit model. The results are similar to the OLS estimates.

9
DYNAMICS OF THE WAR TO PEACE TRANSITION IN NORTHERN UGANDA
OccasiOnal PaPer nO. 38
Tabl
e 3:
OLS
est
imat
es o
f det
erm
inan
ts o
f tru
st
VARI
ABLE
STr
ust o
f rel
ativ
esTr
ust o
f nei
ghbo
rsTr
ust o
f gov
ernm
ent i
nten
tions
and
pol
icie
s
Mod
el 1a
Mod
el 1b
Mod
el 1c
Mod
el 1d
Mod
el 2a
Mod
el 2b
Mod
el 2c
Mod
el 2d
Mod
el 3a
Mod
el 3b
Mod
el 3c
Mod
el 3d
Com
bine
d Co
nflic
t M
easu
re0.
0355
0.13
5*0.
0322
[0.9
29]
[1.8
57]
[0.3
53]
Resid
ent i
n ID
P0.
0217
0.21
7***
0.06
88[0
.513
][3
.014
][0
.783
]Ab
duct
ion-0
.031
4-0
.014
90.
0578
[-0.5
96]
[-0.1
19]
[0.6
25]
Deat
h of
a h
ouse
hold
mem
ber d
urin
g co
nflic
t-0
.012
9-0
.125
-0.1
48*
[-0.3
46]
[-1.4
65]
[-1.
801]
Dem
ogra
phics
(Age
, Age
sq
uare
d, ge
nder
)YE
SYE
SYE
SYE
SYE
SYE
SYE
SYE
SYE
SYE
SYE
SYE
S
Educ
ation
Atta
inm
ent
Cont
rols
YES
YES
YES
YES
YES
YES
YES
YES
YES
YES
YES
YES
Relig
ious C
ontro
lsYE
SYE
SYE
SYE
SYE
SYE
SYE
SYE
SYE
SYE
SYE
SYE
SEt
hnici
ty Co
ntro
lsYE
SYE
SYE
SYE
SYE
SYE
SYE
SYE
SYE
SYE
SYE
SYE
SUr
ban
Indi
cato
rYE
SYE
SYE
SYE
SYE
SYE
SYE
SYE
SYE
SYE
SYE
SYE
S
Cons
tant
3.67
2***
3.67
2***
3.67
7***
3.67
7***
3.20
4***
3.15
0***
3.23
2***
3.20
2***
3.43
4***
3.41
5***
3.44
8***
3.40
4***
[36.
39]
[36.
18]
[37.
12]
[37.
78]
[17.
80]
[17.
86]
[17.
06]
[16.
95]
[17.
62]
[17.
38]
[17.
75]
[17.
31]
Obse
rvat
ions
2,91
42,
914
2,91
42,
914
2,92
32,
923
2,92
32,
923
2,90
92,
909
2,90
92,
909
R-sq
uare
d0.
030.
029
0.02
90.
029
0.07
10.
075
0.06
70.
069
0.04
60.
046
0.04
60.
048
Note
s: Th
e tab
le re
ports
OLS
estim
ates
. The
uni
t of o
bser
vatio
n is
an in
divid
ual.
The i
ndivi
dual
cont
rols
are f
or a
ge, a
ge sq
uare
d, a
gend
er in
dica
tor v
aria
ble,
and
an in
dica
tor f
or w
heth
er th
e res
pond
ent l
ives
in a
n ur
ban
locat
ion .
***,
**
and
* in
dica
te si
gnifi
canc
e at t
he 1
, 5 a
nd 1
0% le
vel.
10 OccasiOnal PaPer nO. 38
DYNAMICS OF THE WAR TO PEACE TRANSITION IN NORTHERN UGANDA
3.2 Life satisfaction after the return to peace
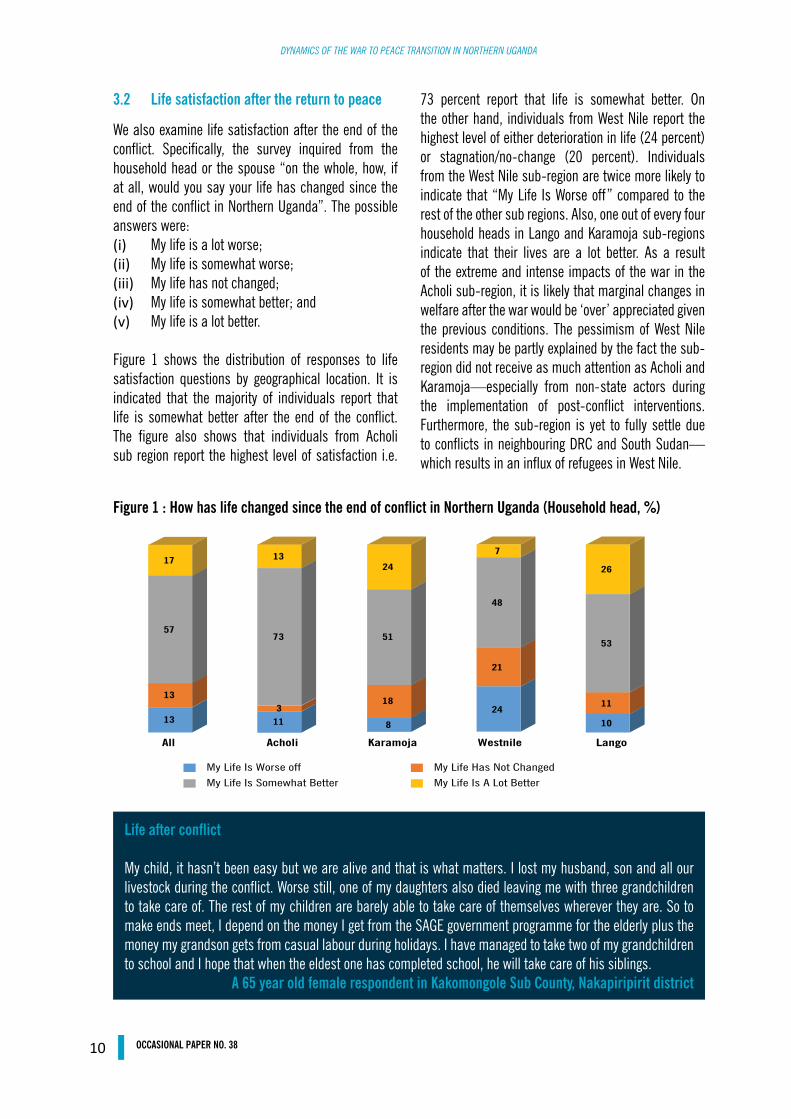
We also examine life satisfaction after the end of the conflict. Specifically, the survey inquired from the household head or the spouse “on the whole, how, if at all, would you say your life has changed since the end of the conflict in Northern Uganda”. The possible answers were:(i) My life is a lot worse;(ii) My life is somewhat worse;(iii) My life has not changed; (iv) My life is somewhat better; and(v) My life is a lot better.
Figure 1 shows the distribution of responses to life satisfaction questions by geographical location. It is indicated that the majority of individuals report that life is somewhat better after the end of the conflict. The figure also shows that individuals from Acholi sub region report the highest level of satisfaction i.e.
73 percent report that life is somewhat better. On the other hand, individuals from West Nile report the highest level of either deterioration in life (24 percent) or stagnation/no-change (20 percent). Individuals from the West Nile sub-region are twice more likely to indicate that “My Life Is Worse off” compared to the rest of the other sub regions. Also, one out of every four household heads in Lango and Karamoja sub-regions indicate that their lives are a lot better. As a result of the extreme and intense impacts of the war in the Acholi sub-region, it is likely that marginal changes in welfare after the war would be ‘over’ appreciated given the previous conditions. The pessimism of West Nile residents may be partly explained by the fact the sub-region did not receive as much attention as Acholi and Karamoja—especially from non-state actors during the implementation of post-conflict interventions. Furthermore, the sub-region is yet to fully settle due to conflicts in neighbouring DRC and South Sudan—which results in an influx of refugees in West Nile.
Figure 1 : How has life changed since the end of conflict in Northern Uganda (Household head, %)
Life after conflict
My child, it hasn’t been easy but we are alive and that is what matters. I lost my husband, son and all our livestock during the conflict. Worse still, one of my daughters also died leaving me with three grandchildren to take care of. The rest of my children are barely able to take care of themselves wherever they are. So to make ends meet, I depend on the money I get from the SAGE government programme for the elderly plus the money my grandson gets from casual labour during holidays. I have managed to take two of my grandchildren to school and I hope that when the eldest one has completed school, he will take care of his siblings.
A 65 year old female respondent in Kakomongole Sub County, Nakapiripirit district
11
DYNAMICS OF THE WAR TO PEACE TRANSITION IN NORTHERN UGANDA
OccasiOnal PaPer nO. 38
Analysis by nature of conflict experience (not shown in the chart) reveals that the level of trust of family members is quite high at 82 percent; only households with experience of abductions or death from conflict have lower rates at about 78 percent. On the other hand, the reported level of trust of neighbours by conflict is much lower at 58 percent--the lowest rates are among households with experience of death and abductions at 55 percent. Finally, at least 57 percent of individuals report that they trust the government’s intentions and policies “very much” and within this, there is limited variation depending on the nature of conflict experience.
Following Arampatzi et al., (2015) who examine determinants of life satisfaction in the MENA region after the Arab-Spring uprising, we estimate correlates of life satisfaction with a Cantril index of life satisfaction (Cantril 1965). Although the types of conflict are not similar, this approach is adopted because of its ability to estimate contentment and fulfilment after upheaval; this is supplemented with a Cantril index. The Cantril index is a wellbeing assessment tool that is used in quantifying life satisfaction. More specifically, respondents are asked to imagine a ladder with steps numbered from zero at the bottom to ten at the top. With the top of the ladder representing the best possible life and the bottom of the ladder representing the worst possible life; respondents then chose the step of the ladder on which they personally feel they stand at that point in time, and where they feel they would be in five years. In particular, our assessment examines the drivers of satisfaction and dissatisfaction through the estimation of a simple reduced-form life satisfaction model; and this is specified as follows:
(2)
Where LSij is the overall life satisfaction of individual i in community j which depends on a set of Individual Perceptions regarding what has changed since the end of the conflict, Personal Characteristics of individual and the error term µij.
The values for the life satisfaction index range from 1 to 5 (maximum score indicating life is a lot better). The independent variables include a measure of changes in livelihoods and access to services as well as a measure of dissatisfaction e.g. to perceived increase in corruption or land conflicts. In addition, we include controls for the respondent’s demographics, education attainment, and location. The results of the OLS estimates are reported in Table 4. Model 1 excludes the measures of improvements and dissatisfactions but includes the key respondent’s characteristics. It is worth noting from Model 1 that being in a monogamous marriage is positively associated with life satisfaction after the end of the conflict. On the other hand, some ethnic groups, especially ethnic groups in West Nile sub region are significantly dissatisfied when compared to other ethnic groups.
Model 2 shows that respondents in communities where “there are more job opportunities” after the war are significantly and positively satisfied with life. These respondents report life satisfaction scores that are 0.23 points higher than those respondents resident in areas that did not register more job opportunities. On the other hand, all other measures of improved access to services although positive are none the less insignificant.

12 OccasiOnal PaPer nO. 38
DYNAMICS OF THE WAR TO PEACE TRANSITION IN NORTHERN UGANDA
vARIABLES Model 1 Model 2 Model 3 Model 4 Model 5: Only RuralMore job opportunities available 0.226*** 0.220*** 0.166*
[2.964] [3.044] [1.950]Access to transportation has improved 0.104 0.0734 0.0488
[1.342] [0.989] [0.669]Access to education has improved 0.0969 0.0954 0.153*
[1.048] [1.069] [1.723]Access to health has improved -0.0644 -0.0913 -0.0298
[-0.843] [-1.192] [-0.368]Dissatisfied with increased corruption in the region -0.134* -0.125* -0.0894
[-1.731] [-1.658] [-1.121]Dissatisfied with experiencing land conflicts 0.209** 0.204** 0.221**
[2.567] [2.513] [2.561]Dissatisfied with influx of migrants 0.0672 0.0625 -0.132
[0.321] [0.310] [-0.620]Dissatisfied with experiencing forced evictions 0.0778 0.0558 0.285
[0.351] [0.248] [1.490]Dissatisfied with decreased access to land 0.168 0.151 0.159
[1.148] [1.000] [0.895]Rise in prices of local goods and services 0.191** 0.179** 0.115
[2.184] [2.060] [1.239]Dissatisfied with loss of livelihoods in the community -0.0541 -0.06 -0.0186
[-0.480] [-0.535] [-0.155]High sense of insecurity -0.219** -0.173* -0.142
[-2.098] [-1.787] [-1.345]Marital status (Reference category: Single)Married Monogamy 0.149** 0.151** 0.137* 0.141* 0.067
[2.098] [2.083] [1.910] [1.953] [0.804]Married Polygamy 0.0262 0.0422 0.00945 0.0244 -0.0699
[0.309] [0.508] [0.110] [0.291] [-0.768]Divorced/Separated -0.0616 -0.0614 -0.0806 -0.0749 -0.073
[-0.593] [-0.579] [-0.824] [-0.755] [-0.726]Widowed 0.152 0.152 0.118 0.123 0.116
[1.415] [1.407] [1.130] [1.185] [1.010]Ethnicity (Reference category: other ethnic groups)Acholi -0.0651 -0.0751 -0.0755 -0.0724 -0.0637
[-0.914] [-1.009] [-1.056] [-0.976] [-0.813]Alur -0.840*** -0.808*** -0.842*** -0.802*** -0.645**
[-4.425] [-4.537] [-4.659] [-4.650] [-2.586]
Lugbara -0.707*** -0.683*** -0.670*** -0.641*** -0.761***
[-5.287] [-5.498] [-5.051] [-5.181] [-5.534]
Karamojong 0.0566 0.0712 0.0356 0.0594 -0.0373
[0.594] [0.740] [0.351] [0.583] [-0.340]Madi -0.363** -0.418** -0.389** -0.426** -0.638***
[-2.180] [-2.284] [-2.315] [-2.334] [-3.633]Kakwa -0.0567 -0.0424 -0.0747 -0.0526 -0.0328
[-0.428] [-0.345] [-0.605] [-0.440] [-0.275]
Demographics (Age, Age squared, gender) YES YES YES YES YES
Table 4: Determinants of Life Satisfaction: Ordinary Least Squares estimates

13
DYNAMICS OF THE WAR TO PEACE TRANSITION IN NORTHERN UGANDA
OccasiOnal PaPer nO. 38
vARIABLES Model 1 Model 2 Model 3 Model 4 Model 5: Only RuralEducation Attainment YES YES YES YES YESReligious indicators YES YES YES YES YESUrban Indicator YES YES YES YES NO
Constant 3.616*** 3.479*** 3.597*** 3.490*** 3.338***
[20.70] [18.95] [18.22] [17.08] [15.75]Observations 2,972 2,972 2,972 2,972 2,315
R-squared 0.131 0.151 0.152 0.169 0.192
Notes: The table reports OLS estimates. The unit of observation is an individual. The individual controls are for age, age squared, a gender indicator variable, and an indicator for whether the respondent lives in an urban location. ***, ** and * indicate significance at the 1, 5 and 10 percent level.
Model 3 considers the possible sources of discontent captured in the survey. Respondents who strongly agree that “government projects in the region have increased corruption” are significantly less satisfied with life. However, the effect disappears when only the rural residents sample is considered. This suggests that it is mainly urban respondents who are more likely to know about corruption activities and are thus dissatisfied with life. It is also worth pointing out that the respondents reporting a rise in prices of local goods and services are generally significantly more satisfied with life. This is expected given that the majority of the respondents are rural and depend on agriculture—agricultural households may have benefited from the rise in commodity prices after the end of the war. Household heads or their spouses were also asked “to what extent do you feel secure after the return to peace in the region” and those who either feel a little secure or not sure at all are significantly negatively satisfied with life. On average the life satisfaction score for respondents dissatisfied with security is 0.2 points lower than respondents reporting that security has somewhat improved after the return to peace.
4. CHANGES IN LIvELIHOODS
4.1 Transition to peace impacts on migration
As a result of the conflict, there has been a of lot migration within the region as families initially left to escape the war, and then gradually started returning after the end of the conflict in 2006. Household migration patterns were obtained by finding out if
respondents had lived somewhere else prior to living where they are currently living and then investigating further into their reasons for moving. At least 61.7 percent of respondents aged 18 years and above had previously changed residence. The highest rates of migration were in Acholi sub region (70.6 percent), followed by Lango (67.6 percent) and West Nile (61.9 percent); Karamoja had the least proportion of migrants (25.4 percent). Most of the migration is within country; it is only respondents from the West Nile region who recorded a very high proportion of migrants from and to South Sudan (10.8 percent) and DRC (2.2 percent).In regard to reasons for migrating, Figure 2 shows that marriage is the main driver accounting for 26.4 percent of all migrants in Northern Uganda. Conflict related migration is the second most cited reason for migrating, with either people moving back from displacement camps, or moving to re-join their families. The fact that only 7.8 percent migrated as a result of escaping insecurity is indicative of the improved security situation in the region. As expected the number of people who were displaced by the war is significantly higher in the Acholi region than in all the other sub regions. Up to 58 percent of migrants in the sub region were returning home after displacement (not shown in the chart). In Karamoja, the main reason for moving was for work related purposes, reflecting the increase in economic opportunities in the region particularly since the end of the conflict. For West Nile (27.9 percent) and Lango (33.4 percent) sub regions, marriage is the main reason given by respondents for moving to their current place of residence.

14 OccasiOnal PaPer nO. 38
DYNAMICS OF THE WAR TO PEACE TRANSITION IN NORTHERN UGANDA
4.2 Perceived beneficiaries of the return to peace impacts on migration
Aside from life satisfaction, not all persons benefited equally from the transition from war to peace. The survey inquired from household heads about their perceptions regarding the extent to which they thought different categories of community members have benefited from the end of the conflict. The categories considered included: the local business community; persons who are well connected with the local government; youth and women. Figure 3 shows the distribution of the views expressed by households.
It is indicated that most household heads are of the view that local business leaders and connected individuals benefited to a large extent from the end of the conflict—37 percent and 44 percent respectively. On the other hand, most heads are of the view that the youth and women have not befitted at all from the end of the conflict. Indeed, recent studies such as UNDP (2015) also highlight the challenges of a very large population of idle youth in Northern Uganda. The report shows that unlike the rest of the country, male youths in Northern Uganda have higher rates of unemployment compared to their female counterparts.
Figure 2: Reasons for migration (%)
Figure 3: Extent to which groups in the community have benefited from the end of the conflict (%)

15
DYNAMICS OF THE WAR TO PEACE TRANSITION IN NORTHERN UGANDA
OccasiOnal PaPer nO. 38
The survey also sought individuals’ perceptions regarding the comparison of household welfare status relative to other households in the village. This is important given the fact that post-conflict societies are associated with rising income inequality (Collier, 1999). The possible answers were: (i) above; (ii) the same; (iii) below; or do not know. Table 5 shows the results regarding this particular question. It is indicated that about one in four individuals perceive their neighbours to be better off. A higher proportion perceives other households in the village to be of a lower welfare status. The figures generally indicate minimal perceptions or feelings of inequality.
4.3 Income and Livelihoods
Experience of war
Before the rebels came to attack our village they would write a letter to the community informing them of their impending arrival. … My right hand thumb was cut half way by the rebels as I ran for my dear life. Most of my nights were spent in the bush. One of my relatives was abducted and raped during captivity. On returning home she lived for some years but recently committed suicide due to the after effect of war. ..My father was also a very wealthy man with a lot of cattle but all was lost due to the conflict. However, because of the peace in the area people can now live in their homes and farm happily.
Local leader in ABAKOIRA LC1’S STORY
The income and livelihood situations of respondents were obtained by a series of questions which asked whether respondents had done any kind of paid work in
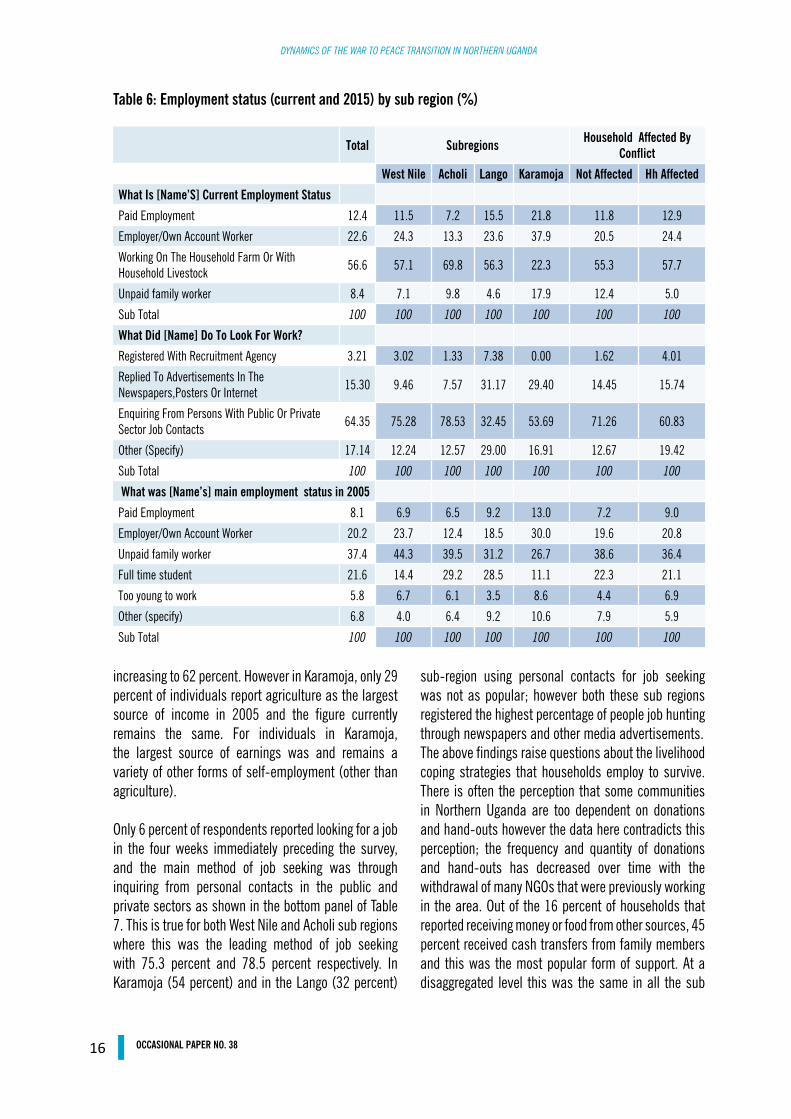
the last 12 months preceding the survey; whether or not they owned or run a small business; what their main day-to-day activity was; what their employment status was in 2005 and what it was at the time of survey etc. When asked about their employment status, the majority of respondents (57 percent) reported working on their household farm or rearing household livestock. Within this, the Acholi sub region had the highest percentage of people farming and rearing livestock with 70 percent. Unexpectedly (considering that the Karamajong are predominantly pastoralists) only 22 percent in Karamoja cited farming or livestock rearing as their main livelihood activity. This unexpected result is also observed in data from UNHS which reveals that agriculture steadily declined as households’ main source of income from 51.5 percent in 2005/6 to 43.3 percent in 2012/13 across the country at a whole. This was replicated with an even steeper decline in the Karamoja region from 55.5 percent in 2005/6 to a mere 7.3 percent in 2012/13. This is mirrored by a reverse trend in the percentage of households that depend on non-agricultural enterprises as the most important source of income; this figure rose from 25.7 percent (2005/6) to 56.2 percent (2012/13) in the Karamoja region.
Furthermore, only 28 percent of respondents aged 10 years and above had engaged in wage employment during the last 12 months. As illustrated in Table 7 below, Karamoja region surprisingly recorded the highest percentage of people having done such work. These findings are reaffirmed by the data examining households’ main sources of income. On the whole, agriculture was the main source of income in 2005 with 60 percent recording it as such. This rate was more or less maintained by 2015, with the percentage slightly
Table 5: Welfare Status in relation to neighbours (%)
All
Conflict Experience: At least one household member ever Resident in IDP camp Abducted Died due to conflict
Comparison of household welfare status with other households in the villageAbove 27.5 27.1 23.1 27.3Same 33.3 31 36 34.1Below 36.6 40.6 39.7 36.7Do not know 2.6 1.3 1.2 1.9Sub Total 100 100 100 100
16 OccasiOnal PaPer nO. 38
DYNAMICS OF THE WAR TO PEACE TRANSITION IN NORTHERN UGANDA
increasing to 62 percent. However in Karamoja, only 29 percent of individuals report agriculture as the largest source of income in 2005 and the figure currently remains the same. For individuals in Karamoja, the largest source of earnings was and remains a variety of other forms of self-employment (other than agriculture).
Only 6 percent of respondents reported looking for a job in the four weeks immediately preceding the survey, and the main method of job seeking was through inquiring from personal contacts in the public and private sectors as shown in the bottom panel of Table 7. This is true for both West Nile and Acholi sub regions where this was the leading method of job seeking with 75.3 percent and 78.5 percent respectively. In Karamoja (54 percent) and in the Lango (32 percent)
sub-region using personal contacts for job seeking was not as popular; however both these sub regions registered the highest percentage of people job hunting through newspapers and other media advertisements. The above findings raise questions about the livelihood coping strategies that households employ to survive. There is often the perception that some communities in Northern Uganda are too dependent on donations and hand-outs however the data here contradicts this perception; the frequency and quantity of donations and hand-outs has decreased over time with the withdrawal of many NGOs that were previously working in the area. Out of the 16 percent of households that reported receiving money or food from other sources, 45 percent received cash transfers from family members and this was the most popular form of support. At a disaggregated level this was the same in all the sub
Total Subregions Household Affected By Conflict
West Nile Acholi Lango Karamoja Not Affected Hh Affected
What Is [Name’S] Current Employment Status
Paid Employment 12.4 11.5 7.2 15.5 21.8 11.8 12.9
Employer/Own Account Worker 22.6 24.3 13.3 23.6 37.9 20.5 24.4
Working On The Household Farm Or With Household Livestock
56.6 57.1 69.8 56.3 22.3 55.3 57.7
Unpaid family worker 8.4 7.1 9.8 4.6 17.9 12.4 5.0
Sub Total 100 100 100 100 100 100 100
What Did [Name] Do To Look For Work?
Registered With Recruitment Agency 3.21 3.02 1.33 7.38 0.00 1.62 4.01
Replied To Advertisements In The Newspapers,Posters Or Internet
15.30 9.46 7.57 31.17 29.40 14.45 15.74
Enquiring From Persons With Public Or Private Sector Job Contacts
64.35 75.28 78.53 32.45 53.69 71.26 60.83
Other (Specify) 17.14 12.24 12.57 29.00 16.91 12.67 19.42
Sub Total 100 100 100 100 100 100 100
What was [Name’s] main employment status in 2005
Paid Employment 8.1 6.9 6.5 9.2 13.0 7.2 9.0
Employer/Own Account Worker 20.2 23.7 12.4 18.5 30.0 19.6 20.8
Unpaid family worker 37.4 44.3 39.5 31.2 26.7 38.6 36.4
Full time student 21.6 14.4 29.2 28.5 11.1 22.3 21.1
Too young to work 5.8 6.7 6.1 3.5 8.6 4.4 6.9
Other (specify) 6.8 4.0 6.4 9.2 10.6 7.9 5.9
Sub Total 100 100 100 100 100 100 100
Table 6: Employment status (current and 2015) by sub region (%)

17
DYNAMICS OF THE WAR TO PEACE TRANSITION IN NORTHERN UGANDA
OccasiOnal PaPer nO. 38
regions except in Karamoja where ‘in-kind’ transfers from NGO’s were the most common type of external support to households. This indicates a different kind of dependency, one centred on social networks rather than on the state or on NGO’s. Only 38 percent of the respondents were members of social clubs and community organizations with the Lango and Acholi sub-regions being the biggest contributors to this. In addition, the most popular type of group/organization was the Savings and Credit Co-Operatives (SACCO’s). That said, only 21 percent of household heads currently have a bank account- although this is a slight increase from 2005 where only 16 percent had bank accounts.
Employment status during conflictFor household members aged 10 years and above, the survey also retrospectively collected information on the main employment status in 2005 i.e. 10 years prior to the survey. A comparison between the top and bottom parts of Table 10 shows that there have been some significant movements in terms of employment status (for persons aged 14-64 years). Specifically, whereas more than one out every three individuals were unpaid family workers in 2005, the proportion had reduced to less than 10 percent by 2015. The largest reduction in the share of unpaid family workers was reported in Lango sub-region. Also, individuals in households affected by conflict were twice as likely to have moved out of unpaid family worker employment status compared to individuals who were resident in households not affected by conflict. As such, the transition to peace enabled individuals to move from the category of unpaid family workers to own account workers. Furthermore, this benefited females most as they were more likely to be unpaid family workers in 2005 compared to males (44.6 percent versus 29.8 percent).
4.4 Government’s response to demand for social services
The overall literacy levels are quite low, with Karamoja being the worst performing sub region. Across all sub regions, only 57 percent of individuals aged 5 years and above were able to read and write in any language, while in Karamoja this figure is at a mere 29 percent. Lango sub-region recorded the highest percentage of people who could read and write with 68 percent,
followed by the Acholi sub region. This is somewhat contrary to what we would expect to see given the intensity of violence in those two regions; the West Nile sub-region should presumably achieve the best figures for education (54 percent). That said, a total of only 43 percent of respondents were attending school at the time of interview and in keeping with the literacy findings, Karamoja (23 percent) recorded the lowest amount of surveyed individuals attending school. In Karamoja where school attendance has been habitually poor with herding activities taking precedence, several agencies including the World Food Program (WFP) have previously instituted school feeding programs. In these programs, meals are provided at school as an incentive to encourage attendance. This is well reflected in the survey findings with 49 percent in Karamoja reporting free meals being provided at school, yet only 4 percent in West Nile and 6 percent in the Lango sub region reporting the same.
In all the sub regions, expense was cited as the main reason for not attending school with 25 percent noting that a lack of funds was to blame. Interestingly one of the main reasons for not attending school was parents’ refusal. This was highest in the West Nile sub region with 29 percent of respondents stating they never attended school because it was forbidden by their parents. While there are questions directly pointed at gauging the level of trust within communities and between communities and authorities, there is a pertinent point about trust that can be gleaned from this. Namely, in the West Nile region, there is some underlying mistrust of authorities and of the education initiatives which have been so heavily championed by the government across the country.
As a result of the implementation of the universal primary education (UPE) programme in 1997, most children who are supposed to be in school are currently enrolled. Figure 4 shows the distribution of primary net enrolments rates (NERs) by gender and household wealth status for children aged 6-12 years. The figure indicates that NERs are generally high in Northern Uganda—at 73.8 percent. The only exceptions are the NERs for the poorest quintile—which are nearly half those of the richest quintile (i.e. 44.2 percent versus 82 percent). The lower NERs among the poorest quintile are driven by Karamoja sub region—the sub

18 OccasiOnal PaPer nO. 38
DYNAMICS OF THE WAR TO PEACE TRANSITION IN NORTHERN UGANDA
region with the lowest NER of 35.3 percent, accounting for more than half of the households in the poorest quintile. Furthermore, it is worth noting that there are minimal gender differences in NERs—again the only exception being the poorest quintile. Overall, with the exception of the bottom two quintiles, the NERs of Northern Uganda are generally in line with the rest of the country.19
Based on conflict experience, NERs are higher among households directly affected by conflict—especially for the lowest quintiles. Again this huge difference is explained by Karamoja sub-region having lower school attendance but higher levels of deprivation.
In comparison to primary school enrolments, secondary school enrolment is considerably much lower in Northern Uganda as is the case across the country. Table 7 shows that NERs for secondary school children aged 13-18 years are only 15.6 percent. The gross enrolment ratios are also much lower at 27 percent indicating that it is not delayed school enrolment constraining children from access to secondary schooling. The disparity between primary school enrolments and secondary school enrolments
19 NERs across Uganda were at 81.2 based on the 2012/13 Uganda National Household Survey (UBoS, 2014).
points to high dropout rates at the primary level and is a major concern. While the gap between primary and secondary school enrolments is often attributed to the introduction of UPE in 1997, UPE simply aggravated a pre-existing problem. Further inquiry into the issue reveals that secondary education has always been more costly than primary hence the “high cost of schooling remains a major reason why children cannot access secondary education in Uganda” (Barungi et al., 2014). While the introduction of Universal Secondary Education (USE) in 2006 contributed to slight increases in secondary enrolments, the majority of secondary schools continue to charge tuition and other fees. Most telling of all however is that there are significantly more primary schools than there are secondary schools, and of the few secondary schools, only about a third are government-aided. Data from the Ministry of Education and Sports 2015 Education Statistical Abstract reveals that across the country in 2014 there were about 18,408 primary schools of which 12235 were Government aided and 6,173 Non Government. This means that at least 66.5 percent of the available primary schools in the country were accessible through UPE. In contrast, there were only about 2,950 secondary schools of which 1208 were Government aided with 1742 being Non-Government. Therefore, only 41 percent of secondary schools were
Figure 4: Primary Net Enrolment Rates for children aged 6-12 years
Source: Authors calculation from the 2015 WPT Survey

19
DYNAMICS OF THE WAR TO PEACE TRANSITION IN NORTHERN UGANDA
OccasiOnal PaPer nO. 38
available through USE. This situation is amplified in northern Uganda as there are serious questions about access to secondary education particularly in remote and rural areas. In 2014, the region accounted for only 16.2 percent and 13.9 percent of total number of primary and secondary schools respectively in Uganda.
In addition, unlike the case of UPE which is primarily free, only pupils who attain a threshold mark at primary leaving examinations (PLE) qualify for the USE grant. Furthermore, students under USE are expected to co-pay for secondary schooling. Indeed, based on the 2015 WPT survey, about one out of every two students aged 13-18 years who have dropped out of school cite the cost of schooling as the main reason for leaving school. The other reason related to cost is that because there are few secondary schools compared to primary schools the average distance to secondary schools is considerably higher. In Northern Uganda, the average distance to primary schools is 2.3 km while that for secondary schools is 6.3kms. The corresponding rates for the rest of the country are 1.8 kms for primary schools and 3.2 kms for secondary schools. It is worth noting that due to the geographical dispersion of region, there are limited available secondary schools. Based on 2014 Education Management Information System (EMIS) data, Northern Uganda accounts for only 16.2 percent and 13.9 percent of the primary and secondary schools in Uganda respectively (Ministry of Education,
2015). On the other hand, the region accounts for 20.2 percent of Uganda’s population. As a result, secondary school students face higher transport related costs compared to their primary counterparts. Table 8 also shows that there are substantial gender differences in secondary schools enrolments. Furthermore the widest gender gaps in secondary enrolments are among the relatively well-to-do households.
As mentioned earlier, in the aftermath of the conflict, the government of Uganda launched large scale reconstruction programmes such as the PRDP for Northern Uganda. Such initiatives targeted the provision and expansion of social services such as schools, health centres and water services. Administrative data shows that during 2009-2013; at least 2,545 new classrooms, 3640 latrines and 2,504 teacher houses were constructed in the PRDP region (Office of the Prime Minister, 2014). The WPT survey solicits information from households whether they are aware of public services provided after the end of the conflict. Awareness and knowledge of available services plays a large part in a households demand and subsequent use of the said services. Results from the WPT survey reveal that the overall awareness of public services initiated after conflict is low.
As illustrated in Figure 5, out of all the services provided by the government, households were most aware of the
Primary (age 6-12 years) Secondary (13-18 years) Conflict Experience Conflict Experience All Females Males IDP Affected All Females Males IDP Affected
Net Enrollment RatesQuintile 1 47 45 50 73 76 4.2 3.1 5.6 4 0Quintile 2 74 71 78 75 73 7.9 5.1 10.3 10 9Quintile 3 81 83 79 85 86 10.9 7.5 15.1 13 17Quintile 4 84 79 88 83 85 17.4 15.3 19.5 19 17Quintile 5 82 83 81 85 89 30.2 34.5 26 26 29All 77 75 78 81 83 15.6 14.6 16.7 16 17
Gross Enrolment RatesQuintile 1 76.1 66.3 80.9 112.9 125.5 8.4 6.5 10.8 9.5 6.8Quintile 2 124.5 104.3 138.5 124.2 1221.7 12.6 9.3 15.5 13.7 13.8Quintile 3 130.9 129.7 132.8 141.2 150.8 22.1 12.4 33.5 23.5 31.6Quintile 4 132.2 125.2 135.9 134.8 144.5 28.4 22.7 24.4 25.5 29.1Quintile 5 131.5 127.3 137.3 151.7 140.9 49.8 52.7 46.9 46.3 58.3All 123.6 121.7 130.1 135.9 137.85 26.7 22.8 30.9 25.4 31.5
Table 7: Net and Gross School Enrolment Rates by Gender, Wealth Status, and Conflict Experience
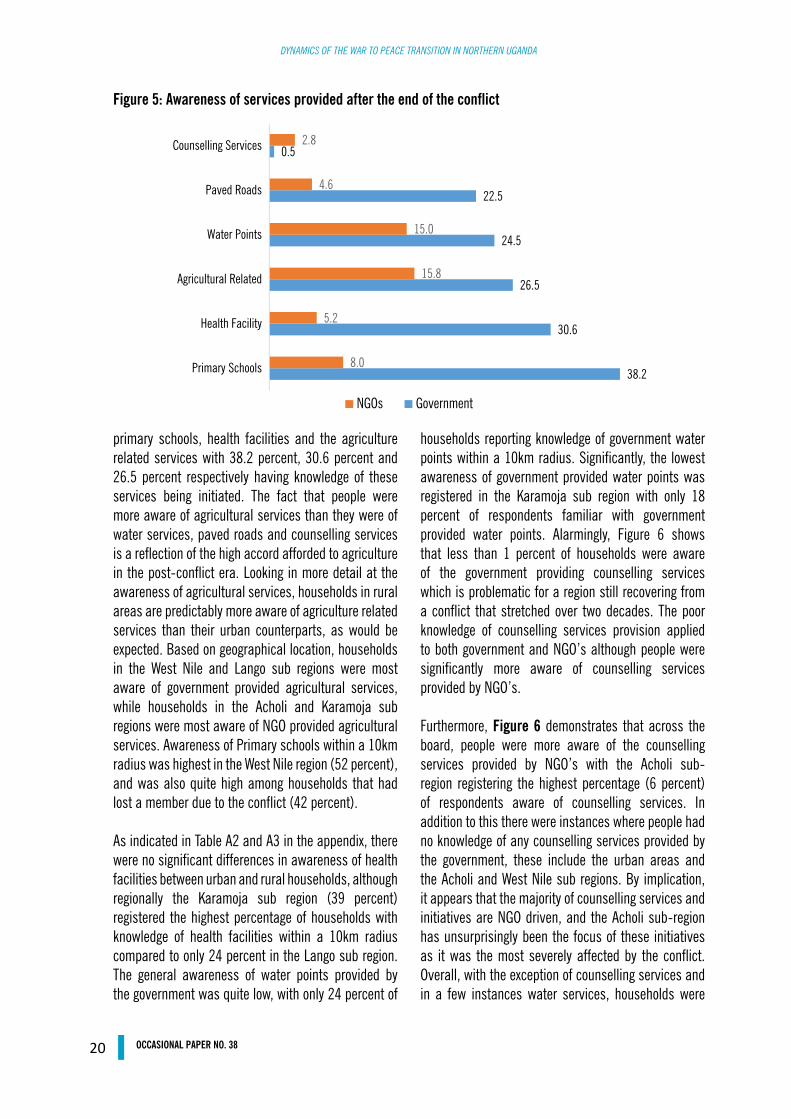
20 OccasiOnal PaPer nO. 38
DYNAMICS OF THE WAR TO PEACE TRANSITION IN NORTHERN UGANDA
primary schools, health facilities and the agriculture related services with 38.2 percent, 30.6 percent and 26.5 percent respectively having knowledge of these services being initiated. The fact that people were more aware of agricultural services than they were of water services, paved roads and counselling services is a reflection of the high accord afforded to agriculture in the post-conflict era. Looking in more detail at the awareness of agricultural services, households in rural areas are predictably more aware of agriculture related services than their urban counterparts, as would be expected. Based on geographical location, households in the West Nile and Lango sub regions were most aware of government provided agricultural services, while households in the Acholi and Karamoja sub regions were most aware of NGO provided agricultural services. Awareness of Primary schools within a 10km radius was highest in the West Nile region (52 percent), and was also quite high among households that had lost a member due to the conflict (42 percent).
As indicated in Table A2 and A3 in the appendix, there were no significant differences in awareness of health facilities between urban and rural households, although regionally the Karamoja sub region (39 percent) registered the highest percentage of households with knowledge of health facilities within a 10km radius compared to only 24 percent in the Lango sub region. The general awareness of water points provided by the government was quite low, with only 24 percent of
households reporting knowledge of government water points within a 10km radius. Significantly, the lowest awareness of government provided water points was registered in the Karamoja sub region with only 18 percent of respondents familiar with government provided water points. Alarmingly, Figure 6 shows that less than 1 percent of households were aware of the government providing counselling services which is problematic for a region still recovering from a conflict that stretched over two decades. The poor knowledge of counselling services provision applied to both government and NGO’s although people were significantly more aware of counselling services provided by NGO’s.
Furthermore, Figure 6 demonstrates that across the board, people were more aware of the counselling services provided by NGO’s with the Acholi sub-region registering the highest percentage (6 percent) of respondents aware of counselling services. In addition to this there were instances where people had no knowledge of any counselling services provided by the government, these include the urban areas and the Acholi and West Nile sub regions. By implication, it appears that the majority of counselling services and initiatives are NGO driven, and the Acholi sub-region has unsurprisingly been the focus of these initiatives as it was the most severely affected by the conflict. Overall, with the exception of counselling services and in a few instances water services, households were
Figure 5: Awareness of services provided after the end of the conflict

21
DYNAMICS OF THE WAR TO PEACE TRANSITION IN NORTHERN UGANDA
OccasiOnal PaPer nO. 38
significantly more aware of services provided by the government than those provided by NGO’s. Two main inferences can be made from this; the first is that NGO’s are perceived as having been primarily focused on providing counselling services, and the second is that there is an increased government presence in all avenues of service provision which was not always the case during the conflict. Nevertheless it is important to bear in mind that several government initiatives are carried out in partnership with NGO’s, often at the behest of donor and multilateral agencies.
During conflict, the resulting weakening of government institutions offered space for NGOs to expand service provision and also build trust among war affected communities. The large NGO presence in service provision may persist even in the post-conflict period. Our findings show that contrary to conventional wisdom, service provision in Northern Uganda is dominated by state agencies. There are a number of plausible reasons why NGOs do not appear to have taken over service provision in the region. First, the nature of services offered by NGOs as well as extent of their reach and breadth of services; in Northern Uganda, NGOs predominantly offer psycho-social services. The traditional services of education and
health services are offered by government. Two, NGOs used to be very active while populations were resident in IDP camps; it is more costly for budget constrained NGOs to operate in a wide geographical area. Three, a number of NGOs operate from public facilities and this may affect the overall recognition of their contribution. Finally, some of the public services are financed by international humanitarian agencies including NGOs and not directly from public revenues.
Even though awareness is a key component of demand for services it is not sufficient to ensure usage of available services; in other words, simply knowing about a particular service does not mean that people are using it. The analysis shows that knowledge and awareness of government and NGO services seldom translates to usage in equal measure. Although 26.5 percent of all households were aware of agricultural services provided by the government, only 15.1 percent actually made use of these services. Similarly even though 6 percent of respondents in the Acholi sub region were aware of counselling services provided by NGO’s only 3.9 percent used the services. Admittedly, use of services is influenced and determined by several things including distance to facilities, cost of using the facility, quality of service as well as the trust between
Figure 6: Awareness of counselling services provided by government and NGOs after the conflict.
22 OccasiOnal PaPer nO. 38
DYNAMICS OF THE WAR TO PEACE TRANSITION IN NORTHERN UGANDA
the community and the service provider. When asked to rank the 3 main services households thought the government should provide in their area, over 41 percent of respondent ranked the building of schools and classrooms as the number 1 priority (see Table A6 in the appendix); this is in spite of the fact that across all services schools were most recognised. In order of prioritisation improving water and sanitation was second, expanding electricity coverage was third and improving agriculture was fourth.
4.5 Household perception of post-conflict security
Given the numerous peace initiatives implemented since 2006, it is important to understand household perception towards personal security. The survey inquired from households the likelihood of the conflict re-occurring as well as the general sense of personal security. Table 9 shows that the majority of respondents (46 percent) felt that it is ‘not likely at all’ that conflict will return to the region, most confident in this assertion were the households in the Karamoja sub region with 64 percent of households believing that conflict was unlikely to reoccur. Interestingly, by comparison only 33 percent of households in the Acholi sub region were convinced that conflict would not resume. In fact, the highest percentage of respondents who were not sure about the prospect of conflict returning was recorded in the Acholi sub region with 31 percent feeling that they ‘do not know’ the likelihood of conflict returning to the area. In comparison only 17 percent in West Nile, 13 percent in Karamoja and 9 percent of households in the Lango sub region were uncertain about the possible return of conflict.20 Overall, only 12 percent of households thought conflict was likely to recommence and of this, the Lango sub region registered that highest percentage of respondents who felt a re-emergence of conflict was ‘very likely’ (21 percent) or ‘somewhat likely’ (18 percent). Taking into consideration respondents’ experience of conflict, households who had lost a family member to the conflict were most positive that conflict was unlikely to return (46 percent); in contrast only 37 percent of
20 The proportion of households indicating doubts about a reoccurrence in the Acholi sub region may be explained by the fact that although the insurgence ended in the sub region, the main perpetrators of the conflict—the LRA—have never given up arms but moved to the Central African Republic.
households with a head who had migrated due to the insecurity felt the same.
The abovementioned results point to an elevated sense of security and this is reflected in the proportion of households (81 percent) who felt ‘very’ (60.9 percent) or ‘quite’ (19.7 percent) secure after the return of peace. Across the sub regions, households in Karamoja felt the most secure with 83 percent of respondents noting that they were ‘very’ secure; and this is in line with their above illustrated belief that conflict is unlikely to return. The most cited reason for this increased sense of security is the effectiveness of peace initiatives followed by proximity to a police station. Another example of the high sense of personal security is reflected with respect to potential land eviction. Two out of every ten households are of the view that they are unlikely to experience land evictions.While only 27 percent of households attributed their heightened sense of security to the close proximity of a police station, this figure was significantly higher in urban areas and the West Nile sub region where 40 percent of respondents accredited the police to their sense of security. There was a noticeable rural/urban divide with regard to whom or what households felt was most responsible for the improved sense of security. On the one hand, only 22 percent of rural households felt that having a nearby police station was a key factor in comparison to 41 percent of urban households. On the other hand up to 55 percent of rural households believed effective peace initiatives were very instrumental in the increased sense of security compared to 43 percent of urban households. Interestingly there is little variation in the perceptions of whom or what is most responsible for the increased sense of security between the different categories of conflict experience.
In line with the above findings, an overwhelming majority of people (71 percent) report their security incidents to local councils (LCs) rather than to the police (19 percent). The Lango sub region recorded the highest percentage of households reporting security incidents to the LCs with 89 percent, while Karamoja recorded the smallest percentage with 45 percent. Notably, Karamoja was the only sub region in which a significant proportion of households reported their security incidents to the military with 19 percent.

23
DYNAMICS OF THE WAR TO PEACE TRANSITION IN NORTHERN UGANDA
OccasiOnal PaPer nO. 38
This is attributable to the residual military presence maintained in the region for security purposes. In spite of the high inclination to report to LCs over the police, only 8 percent of households lived more than 10 kilometres from the nearest police station while 71 percent were within a 5 kilometre distance from the nearest police station. The above results may also reflect a return to the recognition of LCs by the central government after the end of the war. During the war, LCs were part of the local government structures that appeared neglected. Nevertheless it is important to bear in mind that local councils are traditionally more accessible particularly at the village level, and if and when the need arises, local councils will bring the matter to the police.

24 OccasiOnal PaPer nO. 38
DYNAMICS OF THE WAR TO PEACE TRANSITION IN NORTHERN UGANDA
Al
lLo
catio
nSu
b Re
gion
Conf
lict E
xper
ienc
e: A
t lea
st o
ne h
ouse
hold
m
embe
r eve
rHo
useh
old
head
m
igra
ted
due
to
inse
curit
yUr
ban
Rura
lAc
holi
Kara
moj
aW
estn
ileLa
ngo
Resi
dent
in ID
P ca
mp
Abdu
cted
Died
due
to
conf
lict
Like
lihoo
d th
at c
onfli
ct re
occu
r
Ve
ry Li
kely
12.0
11.8
12.0
7.7
8.9
11.2
20.6
12.7
9.6
12.0
11.2
So
mew
hat L
ikely
13.1
18.9
11.4
13.8
11.0
9.1
18.3
13.2
12.8
12.6
11.7
A Li
ttle L
ikely
11.1
10.6
11.3
14.6
3.3
11.2
14.1
13.2
11.5
11.4
14.4
No
t Like
ly At
All
45.6
40.9
46.9
32.9
63.6
51.1
38.6
35.8
40.2
46.1
36.8
I D
on’T
Know
18.3
17.9
18.4
31.1
13.2
17.5
8.6
25.1
25.9
17.9
25.8
Sub
tota
l10
010
010
010
010
010
010
010
010
010
010
0Se
nse
of se
curit
y afte
r the
Ret
urn
of p
eace
Ve
ry M
uch
60.9
66.7
59.2
46.2
83.3
58.4
60.7
51.3
52.2
56.3
51.0
Qu
ite A
Bit
19.7
16.5
20.6
24.5
9.2
22.9
19.8
24.3
21.3
22.6
23.9
So
mew
hat
12.5
9.6
13.3
23.0
5.5
8.7
10.5
17.2
18.5
15.5
15.4
A
Littl
e3.
94.
03.
94.
31.
55.
34.
34.
54.
14.
26.
0
Not A
t All
3.0
3.3
2.9
2.0
0.5
4.6
4.7
2.8
3.9
1.3
3.7
Sub
tota
l10
010
010
010
010
010
010
010
010
010
010
0Re
ason
for h
igh
sens
e of
secu
rity (
i.e ve
ry m
uch
secu
re)
Near
by P
olice
Sta
tion
26.8
40.7
22.4
16.8
16.8
40.2
34.2
23.8
22.6
23.8
22.5
Ne
arby
Milit
ary C
amp
8.3
6.2
8.9
1.3
22.2
0.7
5.0
3.1
2.1
9.2
4.5
Ef
fect
ive P
eace
Initi
ative
s52
.543
.255
.467
.845
.944
.555
.462
.663
.856
.762
.1Ot
her r
easo
ns12
.59.
913
.314
.115
.114
.75.
510
.511
.510
.311
.0Su
b to
tal
100
100
100
100
100
100
100
100
100
100
100
Whe
re D
o Yo
u M
ainl
y Rep
ort a
Sec
urity
Inci
dent
?
Polic
e Sta
tion
18.9
27.5
16.4
16.1
29.2
24.3
7.2
14.9
13.3
18.1
16.5
Loca
l Cou
ncil
70.5
68.0
71.2
76.4
45.0
67.7
89.1
77.8
77.8
73.5
72.2
Milit
ary
4.2
2.3
4.7
0.0
19.2
0.0
0.1
0.2
1.5
3.1
1.5
Othe
r6.
52.
27.
67.
56.
67.
93.
67.
07.
45.
39.
8Su
b to
tal
100
100
100
100
100
100
100
100
100
100
100
How
Far I
s The
Nea
rset
Pol
ice
Stat
ion?
Less
Than
5Km
s71
.086
.466
.763
.971
.378
.171
.467
.462
.662
.868
.9
Betw
een
5 an
d 10
Km
s20
.89.
423
.922
.824
.215
.820
.723
.324
.627
.517
.6M
ore T
han
10Km
s8.
24.
29.
313
.34.
46.
08.
09.
312
.89.
713
.5Su
b to
tal
100
100
100
100
100
100
100
100
100
100
100
Do Yo
u Pa
y Any
thin
g To
Acc
ess S
ecur
ity S
ervi
ces?
66.4
56.8
69.1
82.4
37.7
69.0
70.6
78.6
80.4
67.0
78.8
Hous
ehol
d Fu
ture
Evi
ctio
n Fr
om L
and
Unlik
ely
66.3
60.1
68.0
63.1
65.4
64.8
72.6
66.6
70.9
61.4
60.0
Sour
ce: A
utho
rs ca
lcula
tions
from
the 2
015
War
to P
eace
Tran
sition
Sur
vey
Tabl
e 8:
Per
cept
ions
abo
ut h
ouse
hold
secu
rity a
fter t
he re
turn
of p
eace

25
DYNAMICS OF THE WAR TO PEACE TRANSITION IN NORTHERN UGANDA
OccasiOnal PaPer nO. 38
4.6 Local government capacity
The study also examines the capacity of local institutions to support interventions by different stakeholders. This dimension is worth examining in the Northern Uganda given the breakdown of institutions during the war and the challenges the region faces in attracting and retaining qualified personnel. Local administrators’ capacity is analysed, with respect to inclusiveness, technical and financial capacity, accountability as well as confidence to deliver on mandates, by examining answers to the following questions: • To what extent is the local community and local
administrators involved in providing services and goods to the community e.g. as teachers, doctors, contractors, monitoring of progress of construction of infrastructure or providing oversight?
• How do you rate the education levels of the local administrators in relation to the work they do?
• Do local administrators have enough financial resources to carry out their work?
• Do you have confidence in the local administrators’ capacity to deliver on their mandates?
• Do you think that resource allocation to different groups in the community by local administrators been transparent?
Table 10 shows the results of household’s perception towards local administrator capacity with the possible response being: (i) very much; (ii) somewhat; (iii) Very little/Not at all; and (iv) Do Not Know. First, with regard to local community and local administrator’s engagement in providing services, at least one-third of households highly rate the local administrator’s engagement (33.3 percent); another one-third (32.9 percent) of households rate the engagement as “somewhat” good while a further 30.7 percent report very little or No engagement at all. Geographically, the highest level of engagement is reported in Lango—with 51.4 percent of the households rating the level of interactions between local communities and local administration in providing services very high. On the other hand, households in West Nile report the least engagement—at least 43.6 percent of the households in the sub region report either very little or no-
engagement at all. It is also worth pointing out that a substantial proportion of households in Karamoja (8.7 percent) indicate not knowing the extent of interaction between communities and local administrators.
The second panel of Table 10 reports the results of respondents’ assessments of the education attainment or technical capacity of local administrators. The aim of this was to gauge how qualified households thought their leaders were for their jobs/positions. Only one out of every five household’s rated the education levels of the administrators very highly. West Nile sub region leads with 28.3 percent of the households in the sub region rating the education attainment as very high. The majority of households indicate that local administrator’s education levels are somewhat adequate (51.9 percent). Furthermore, 21.6 percent of the households rate the education attainment of administrators as either very little or none at all and the poorest rating are among households from Acholi sub region (14.3 percent).
With regard to availability of resources for local administrators to carry out their work, Table 10 shows a very high recognition that local administrators do not have enough resources. Specifically, two out of three households indicate that local administrators have either very little or no resources at all. Geographically, households in Lango sub region report the highest rates of non-availability of resources (70.1 percent). Turning to community confidence in local administrator’s capacity to deliver, Table 10 shows that majority of households express high confidence in local administrators (39.2 percent) and this time around Lango sub region express the highest rating of confidence (45.2 percent). It is worth noting that households in districts severely affected by conflict generally express much lower confidence in local administrator’s capacity to deliver on mandates. Finally, regarding accountability, Table 10 shows that the majority of households (39.9 percent) express the view that there has been little transparency or none at all with regards to resource allocation. Households in Acholi sub region are most likely to report the lack of transparency (43.1 percent) while those in Lango sub region indicate the highest perception that resource allocation by local administrators has been transparent (38 percent)

26 OccasiOnal PaPer nO. 38
DYNAMICS OF THE WAR TO PEACE TRANSITION IN NORTHERN UGANDA
Tabl
e 9:
Cap
acity
of l
ocal
inst
itutio
ns to
supp
ort i
nter
vent
ions
Al
lTy
pe O
f Con
flict
Sub
regi
ons
At L
east
A M
embe
r Affe
cted
By
Conf
lict
Sp
orad
ical
ly A
ffect
edSe
vere
ly A
ffect
edKa
ram
oja
Wes
t Nile
Acho
liLa
ngo
To W
hat E
xten
t Is T
he L
ocal
Com
mun
ity A
nd L
ocal
Adm
inis
trato
rs In
volv
ed In
Pro
vidi
ng se
rvic
es?
Ve
ry M
uch
33.3
36.0
31.6
24.5
21.5
30.4
51.4
33.4
So
mew
hat
32.9
27.0
39.1
45.3
30.6
39.4
26.6
33.8
Ve
ry Li
ttle/
Not A
t All
30.7
34.2
27.5
21.5
43.6
27.6
21.7
30.3
I D
o Not
Kno
w3.
22.
81.
88.
74.
32.
60.
32.
5Su
b To
tal
100
100
100
100
100
100
100
100
How
Do Yo
u Ra
te T
he E
duca
tion
Leve
ls O
f The
Loc
al A
dmin
istra
tors
In R
elat
ion
To W
ork
They
Do?
Ve
ry H
igh
21.4
23.9
19.4
14.8
28.3
14.3
21.0
20.0
So
mew
hat
51.9
53.6
50.1
48.3
55.6
48.3
51.6
50.2
Ve
ry Li
ttle/
Not A
t All
21.6
18.0
27.5
24.4
9.4
34.3
25.8
25.0
I D
o Not
Kno
w5.
04.
53.
012
.56.
63.
11.
74.
8Su
b To
tal
100
100
100
100
100
100
100
100
Do L
ocal
Adm
inis
trato
rs H
ave
Enou
gh F
inan
cial
Res
ourc
es T
o Ca
rry O
ut T
heir
Wor
k?
Very
Muc
h8.
59.
18.
55.
89.
19.
88.
17.
9
Som
ewha
t14
.613
.917
.410
.59.
919
.218
.115
.1
Very
Littl
e/No
t At A
ll65
.968
.765
.154
.167
.263
.770
.266
.5
I Do N
ot K
now
11.0
8.3
9.0
29.5
13.7
7.3
3.7
10.4
Sub
Tota
l10
010
010
010
010
010
010
010
0Do
You
Have
Con
fiden
ce In
The
Loc
al A
dmin
istra
tors
’ Cap
acity
To
Deliv
er O
n Th
eir M
anda
tes?
Ve
ry M
uch
39.2
41.2
36.8
35.3
36.2
37.1
45.2
38.0
So
mew
hat
35.7
32.9
37.1
46.2
36.7
38.0
29.3
34.7
Ve
ry Li
ttle/
Not A
t All
23.0
23.8
25.0
13.8
23.5
24.5
24.9
24.9
I D
o Not
Kno
w2.
12.
11.
14.
73.
60.
40.
72.
3
Sub
Tota
l10
010
010
010
010
010
010
010
0
Do Yo
u Th
ink
That
Res
ourc
e Al
loca
tion
To D
iffer
ent G
roup
s In
The
Com
mun
ity B
y Loc
al A
dmin
istra
tors
has
bee
n tra
nspa
rent
?
Ve
ry Tr
ansp
aren
t31
.133
.628
.525
.129
.027
.338
.029
.9
Som
ewha
t24
.222
.127
.625
.924
.527
.521
.123
.9
Very
Littl
e/No
t At A
ll39
.939
.540
.839
.238
.443
.139
.641
.2
I Do N
ot K
now
4.9
4.8
3.1
9.8
8.1
2.1
1.3
5.0
Sub
Tota
l10
010
010
010
010
010
010
010
0
Note
s: 1
The t
ype o
f con
flict
is b
ased
on th
e PRD
P II
repo
rt de
finiti
on of
conf
lict i
nten
sity i
.e. ei
ther
sev
erely
affe
cted
by c
onfli
ct a
nd/o
r cat
tle ru
stlin
g, an
d th
ose t
hat w
ere s
pora
dica
lly a
ffect
ed a
s det
ailed
in se
ction
2.2
.
27
DYNAMICS OF THE WAR TO PEACE TRANSITION IN NORTHERN UGANDA
OccasiOnal PaPer nO. 38
5. CONCLUSIONS AND RECOMMENDATIONS
The WPT survey report examines the changes, if any, in the livelihoods of persons affected war in Northern Uganda. It examines how households coped with conflict experiences; life satisfaction after the end of the conflict; services demanded by communities and how conflict experiences have affected the level of trust for relatives, neighbours and government. The analysis is based on both past conflict experience as well as current geographical location. Finally, the report recommends policy actions to reduce the level of fragility in post-conflict Northern Uganda.
Experience of conflict was widespread in Northern Uganda. Nearly four out of every ten households have at least one member who was previously displaced and about one-third of the households report having lost a member due to conflict. On the positive side, households have been able to gradually rebuild their lives and livelihoods after the end of the conflict. A substantial proportion of individuals returned from displacement—especially from Acholi sub region. Furthermore, life satisfaction is relatively high with majority of communities reporting that life is somewhat better after the end of the conflict. The most satisfied individuals as would be expected are in Acholi sub region. Access to services has improved since the end of the conflict. Post conflict, communities are more trusting of the neighbours—especially households with members who were formerly displaced. Large scale recovery programmes and NGO interventions have expanded access to education and health facilities. Finally, individuals in Northern Uganda have a positive sense of security and majority are of the view that the conflict is unlikely to reoccur.
Nonetheless, a number of issues remained unresolved, eight years after the end of the conflict and these are likely to continue to affect the fragility of Northern Uganda. First, post conflict interventions have focused on the traditional sectors of health, education, agriculture and water—at the cost of other interventions meant to address the psychological effects of the war. Specifically, the provision of
psycho-social support remained neglected particularly by state actors as most of the related interventions were undertaken by fund constrained NGOs. Second, partly vulnerable groups—notably women and youth benefited least from the return to peace. Third, some geographical areas e.g. West Nile received less attention despite continuing to suffer from conflicts—especially from neighbouring DRC and South Sudan. As such, individuals from this particular sub region are less optimistic about life after the end of the conflict. Fourth, although school enrolments significantly improved after the war, post-secondary schooling remain low in Northern Uganda—partly due to the lack of secondary schools in the region. Finally, access to commercial infrastructure remains limited in the region—only 20 percent of individuals in the region have access to bank account due to the relatively very few bank branches in the region.
In order to increase the level of post primary education, there is an urgent need to increase the number of secondary schools in the region. We recognize that there have been previous AfDB interventions in this area such as the US$ 85 million Uganda Post Primary Education and Training Expansion and Improvement (UPPTEI) project implemented during 2009-2014. However, this particular project targeted secondary schooling across the country whereas there is need for a special focus on Northern Uganda given the very low availability of secondary schools in the region.
There also needs to be a concerted effort to tackle the water and sanitation problem, especially in Karamoja. Access to sanitation is only 9 percent in Karamoja and this has significant impacts on health outcomes. For the groups that appear to have missed out on the post-conflict dividend e.g. youth and women, there is need to expand economic opportunities through supporting entrepreneurship schemes for such vulnerable groups. Such schemes if established could offer both business training and start-up capital.
28 OccasiOnal PaPer nO. 38
DYNAMICS OF THE WAR TO PEACE TRANSITION IN NORTHERN UGANDA
6. REFERENCES
ACCS. (2013) Conflict Analysis for Northern Uganda, Kampala: Refugee Law Project, International Alert and Saferworld.
Arampatzi, E., M. Burger., E. Lanchovichina., et al (2015)” Unhappy Development: Dissatisfaction with Life in the Wake of the Arab Spring” World Bank Policy Working Paper No. 7488.
Ballentine, K. & Nitzschke, H. 2005, ‘The Political Economy of Civil War and Conflict Transformation’ in Fisher, M. & Schmelzle, B. eds, Transforming War Economies: Dilemmas and Strategies, Wiesbaden: (Berghof Research Centre for Constructive Conflict Management). Available at: http://www.berghof-foundation.org/fileadmin/redaktion/Publications/Handbook/Dialogue_Chapters/dialogue3_ballentine_nitzschke.pdf
Bevan, J (2008) “Crisis in Karamoja: Armed Violence and the Failure of Disarmament in Uganda’s Most Deprived Region” Small Arms Survey Occasional Paper 21.
Bjorkhaug, I., Bøås, M., Hatløy, A., and Jennings, K.M. (2007). Returning to Uncertainty? Addressing Vulnerabilities in Northern Uganda. United Nations Development Programme. Available at: http://www.fafoarkiv.no/nyhet/return2uncertanity.pdf
Bozzoli, C., Bruck, T. and Muhumuza, T. (2011) Activity Choices of Internally Displaced Persons and Returnees: Quantitative Survey Evidence from Post-war Northern Uganda. Berlin:DIW Berlin. Available at:http://www.diw.de/documents/publikationen/73/diw_01.c.375786.de/dp1134.pdf
Cantril, H. 1965. Pattern of Human Concerns. New Brunswick: Rutgers University.
Collier P. (1999), ‘On the Economic Consequences of Civil War’, Oxford Economic Papers, 51, 168-83.
Collier, Paul (2000) “Doing Well Out of War” in Greed and Grievance: Economic Agendas in Civil Wars, Mats Berdal and David Malone (eds.), Boulder, CO: Lynne Rienner.
CSOPNU (2006) “Counting the Cost: Twenty years of
war in northern Uganda”Daily Monitor (2015), “West Nile: the centre of border
conflicts”, accessed: 17:30 20/01/2016, available at: http://www.monitor.co.ug/artsculture/Reviews/West-Nile--the-centre-of-border-conflicts/-/691232/2826232/-/u1jisnz/-/index.html
Deininger, K. (2003) “Causes and Consequences of Civil Strife: micro-level evidence from Uganda”. Oxford Economic Papers (55): 579-606.
El-Bushra, J., H. Myrttinen and J. Naujoks. (2013) Renegotiating the ‘Ideal’ Society: Gender relations in the wake of conflict and displacement in Uganda, London: International Alert.
Gersony, R. (1997). “The Anguish of Northern Uganda: Results of a field based Assessment of the civil conflict in Northern Uganda.”, Submitted to USAID Mission, Kampala
Global IDP Database (2005) Profile of Internal Displacement: Uganda, Global IDP Database of the Norwegian Refugee Council, available at: http://www.internal-displacement.org/assets/library/Africa/Uganda/pdf/Uganda-August-2005.pdf
Government of Uganda (2007) Peace Recovery and Development Plan for Northern Uganda: 2007-2010. Kampala. Government of Uganda.
Government of Uganda (2011) Peace Recovery and Development Plan for Northern Uganda Phase 2: July 2012-June 2015. Kampala. Government of Uganda.
Government of Uganda (2013) The Peace Recovery and Development Plan 3 for Northern Uganda. Kampala. Government of Uganda.
Human Rights Watch (2005) “Uprooted and Forgotten: Impunity & Human Rights Abuses in Northern Uganda”. Vol. 17 # 12(A), available at: https://www.hrw.org/reports/2005/uganda0905/uganda0905.pdf
Leggett, I (2001) Uganda: The Background, the Issues, the People. An Oxfam Country Profile. Fountain Publishers.
Mamdani, M. (2001), Politics and Class Formation in Uganda. Fountain Publishers, Kampala.
Marino, J (2008) “Is the PRDP Politics as usual? Beyond Juba: Update on the Implementation of

29
DYNAMICS OF THE WAR TO PEACE TRANSITION IN NORTHERN UGANDA
OccasiOnal PaPer nO. 38
the Uganda Peace Recovery and Development Plan”. Briefing Note 2. http://www.refugeelawproject.org/files/briefing_papers/RLP.BP0802.pdf
Ministry of Finance, Planning and Economic Development, (2014). Background to the Budget 2014/15 Fiscal Year: Maintaining the Momentum: Infrastructure Investment for Growth and Social Economic Transformation. Ministry of Finance, Planning and Economic Development, Kampala, Uganda.
Ministry of Finance, Planning and Economic Development-MOFPED (2003). Post-conflict Reconstruction: The Case of Northern Uganda. Ministry of Finance, Planning and Economic Development, Kampala, Uganda.
Mirzeler, M and C. Young (2000) “Pastoral politics in the northeast periphery in Uganda: AK-47 as change agent” The Journal of Modern African Studies. Vol. 38. No.3: 407-429.
Nannyonjo, J (2005) “Conflicts, Poverty and Human Development in Northern Uganda”. The Round Table: The Commonwealth Journal of International Affairs Issue 381 (September): 473-488.
Nunn, N and L. Wantchekon (2011) “The Slave Trade and the Origins of Mistrust in Africa” American Economic Review 101 (December 2011): 3221–3252
Ocan, C. (1994) ‘Pastoral crisis and social change in Karamoja’, in M. Mamdani and J. Oloka Onyango, eds., Uganda: studies in living conditions and popular movements and constitutionalism. Kampala: JEP Books, 97–142.
Orisa, J. (2012) “Using latrines is a taboo in Karamoja” New Vision, accessed on 12/12/2015, available at: http://www.newvision.co.ug/new_vision/news/1300708/latrines-taboo-karamoja
Ralston, L (2012) “Less Guns, More Violence: Evidence from Disarmament in Uganda”
Ssewanyana, S and S.D. Younger (2008) “Infant Mor-tality in Uganda: Determinants, Trends, and Millennium Development Goals” Journal of African Economies Vol. 17. No.1: 34-61.
Ssewanyana, S., and I. Kasirye (2012) “Poverty and inequality dynamics in Uganda: Insights from
the Uganda national Panel Surveys 2005/6 and 2009/10” EPRC Research Series No 94.
Ssewanyana, S., S.D. Younger and I. Kasirye (2006) “Strengthening the understanding of the dynamics of poverty in Northern Uganda”. Mimeo Economic Policy Research Centre.
Uganda Bureau of Statistics (2014) Uganda National Household Survey 2012/2013. Kampala, Uganda Bureau of Statistics.
Uganda Bureau of Statistics and ICF Macro International (2012). Uganda Demographic and Health Survey 2011: Preliminary Report. Calverton, Maryland: UBoS and Macro International Inc.
Uganda Bureau of Statistics, (2015a) Uganda National Panel Survey 2013/2014 (Wave IV). Kampala, Uganda Bureau of Statistics, Kampala, Uganda.
Uganda Bureau of Statistics, (2015b) 2015 Statistical Abstract. Kampala, Uganda Bureau of Statistics, Kampala, Uganda.
United Nations Development Programme (2015) Uganda Human Development Report 2015: Unlocking the Development Potential of Northern Uganda. Kampala United Nations Development Programme.
United Nations High Commissioner for Refugees (UNHCR) (2010), A Time Between: Moving on from internal displacement in northern Uganda, available at: http://www.refworld.org/docid/54c0b2914.html
Van Acker, F (2004) “Uganda and the Lord’s Resistance Army: The New Order No One Ordered”. African Affairs. Vol. 103/412: 335-357

30 OccasiOnal PaPer nO. 38
DYNAMICS OF THE WAR TO PEACE TRANSITION IN NORTHERN UGANDA
Tabl
e A
1: O
rder
ed lo
git e
stim
ates
of d
eter
min
ants
of t
rust
:
Tr
ust o
f rel
ativ
esTr
ust o
f nei
ghbo
urs
Trus
t of g
over
nmen
t int
entio
ns a
nd p
olic
ies
M
odel
1aM
odel
1bM
odel
1cM
odel
1dM
odel
2aM
odel
2bM
odel
2cM
odel
2dM
odel
3a
Mod
el 3b
Mod
el
3cM
odel
3dCo
mbi
ned
Conf
lict M
easu
re0.
208
0.35
1**
0.00
068
[1.1
30]
[2.3
44]
[0.0
0397
]Re
siden
t in
IDP
0.14
30.
493*
**0.
0494
[0.6
69]
[3.1
55]
[0.2
95]
Abdu
ction
-0.1
2-0
.036
20.
0907
[-0.5
80]
[-0.1
61]
[0.5
11]
Deat
h of
a h
ouse
hold
mem
ber d
urin
g con
flict
-0.0
379
-0.2
56*
-0.3
11**
[-0.2
18]
[-1.
691]
[-2.
136]
Dem
ogra
phics
(Age
, Age
squa
red,
gend
er)
YES
YES
YES
YES
YES
YES
YES
YES
YES
YES
YES
YES
Educ
ation
Atta
inm
ent C
pntro
lsYE
SYE
SYE
SYE
SYE
SYE
SYE
SYE
SYE
SYE
SYE
SYE
SRe
ligiou
s Con
trols
YES
YES
YES
YES
YES
YES
YES
YES
YES
YES
YES
YES
Ethi
ncity
Con
trols
YES
YES
YES
YES
YES
YES
YES
YES
YES
YES
YES
YES
Urba
n In
dica
tor
YES
YES
YES
YES
YES
YES
YES
YES
YES
YES
YES
YES
Pseo
do-R
-squ
ared
Obse
rvat
ions
2,91
42,
914
2,91
42,
914
2,92
32,
923
2,92
32,
923
2,90
92,
909
2,90
92,
909
Note
s : Th
e tab
le re
ports
estim
ates
from
an
orde
red
logit
mod
el, w
here
the u
nit o
f obs
erva
tion
is an
indi
vidua
l. Ea
ch co
lum
n re
ports
an
estim
ate f
rom
a re
gres
sion
with
a d
iffer
ent
conf
lict e
xpos
ure m
easu
re. T
he ta
ble r
epor
ts es
timat
ed co
effic
ients
and
t-s
tatis
tics.
The i
ndivi
dual
cont
rols
are f
or a
ge, a
ge sq
uare
d, a
gend
er in
dica
tor v
aria
ble,
educ
ation
atta
inm
ent c
ontro
ls, et
hinc
ity co
ntro
ls, re
ligion
cont
rols,
and
an
indi
cato
r for
whe
ther
the r
espo
nden
t live
s in
an u
rban
loca
tion.
***
, **
and
* in
dica
te
signi
fican
ce a
t the
1, 5
and
10%
leve
l

31
DYNAMICS OF THE WAR TO PEACE TRANSITION IN NORTHERN UGANDA
OccasiOnal PaPer nO. 38
Tabl
e A
2: S
ervic
es P
rovid
ed b
y Gov
ernm
ent w
ithin
10k
ms o
f hou
seho
ld si
nce
the
end
of th
e co
nflic
t (pe
rcen
t)
Al
lLo
catio
nSu
b Re
gion
Conf
lict E
xper
ienc
e: A
t lea
st o
ne h
ouse
hold
m
embe
r eve
rHo
useh
old
head
m
igra
ted
due
to
inse
curit
y
Urba
nRu
ral
Acho
liKa
ram
oja
Wes
t Nile
Lang
oRe
side
nt in
IDP
cam
pAb
duct
edDi
ed d
ue to
co
nflic
tPr
imar
y Sch
ools
38.2
41.9
37.1
36.2
35.2
51.8
29.0
34.4
34.2
42.2
33.8
Agric
ultu
ral R
elate
d 26
.517
.529
.123
.319
.829
.932
.326
.826
.329
.627
.2He
alth
Fac
ility
30.6
32.3
30.2
28.2
38.8
32.4
24.4
27.6
33.5
36.0
29.4
Wat
er P
oints
24
.524
.824
.429
.418
.527
.621
.225
.722
.523
.623
.3Pa
ved
Road
s 22
.524
.621
.925
.27.
528
.726
.326
.424
.424
.822
.4Co
unse
lling S
ervic
es
0.5
0.0
0.7
0.0
0.3
0.0
1.9
0.5
0.0
0.2
0.8
Sour
ce: A
utho
rs ca
lcula
tions
from
the 2
015
War
to P
eace
Tran
sition
Sur
vey
Tabl
e A
3: P
rovis
ion
of se
rvic
es b
y NGO
s with
in 1
0 km
s of t
he h
ouse
hold
afte
r the
end
of t
he w
ar (p
erce
nt)
Al
lLo
catio
nSu
b Re
gion
Conf
lict E
xper
ienc
e: A
t lea
st o
ne h
ouse
hold
m
embe
r eve
rHo
useh
old
head
m
igra
ted
due
to
inse
curit
y
Urba
nRu
ral
Acho
liKa
ram
oja
Wes
t Nile
Lang
oRe
side
nt in
ID
P ca
mp
Abdu
cted
Died
due
to
conf
lict
Prim
ary S
choo
ls 8.
06.
48.
515
.15.
43.
17.
611
.115
.310
.511
.6Ag
ricul
tura
l Rela
ted
15.8
13.4
16.5
20.1
23.0
8.3
12.5
17.8
22.4
16.3
18.8
Heal
th F
acilit
y 5.
27.
54.
57.
05.
42.
26.
06.
27.
45.
07.
5W
ater
Poin
ts
15.0
10.7
16.2
24.0
12.9
7.1
15.0
21.4
23.6
14.5
15.7
Pave
d Ro
ads
4.6
2.1
5.3
7.0
6.1
0.6
5.1
5.9
7.9
6.1
6.5
Coun
sellin
g Ser
vices
2.
84.
42.
36.
02.
60.
61.
73.
12.
14.
14.
1So
urce
: Aut
hors
calcu
latio
ns fr
om th
e 201
5 W
ar to
Pea
ce Tr
ansit
ion S
urve
y
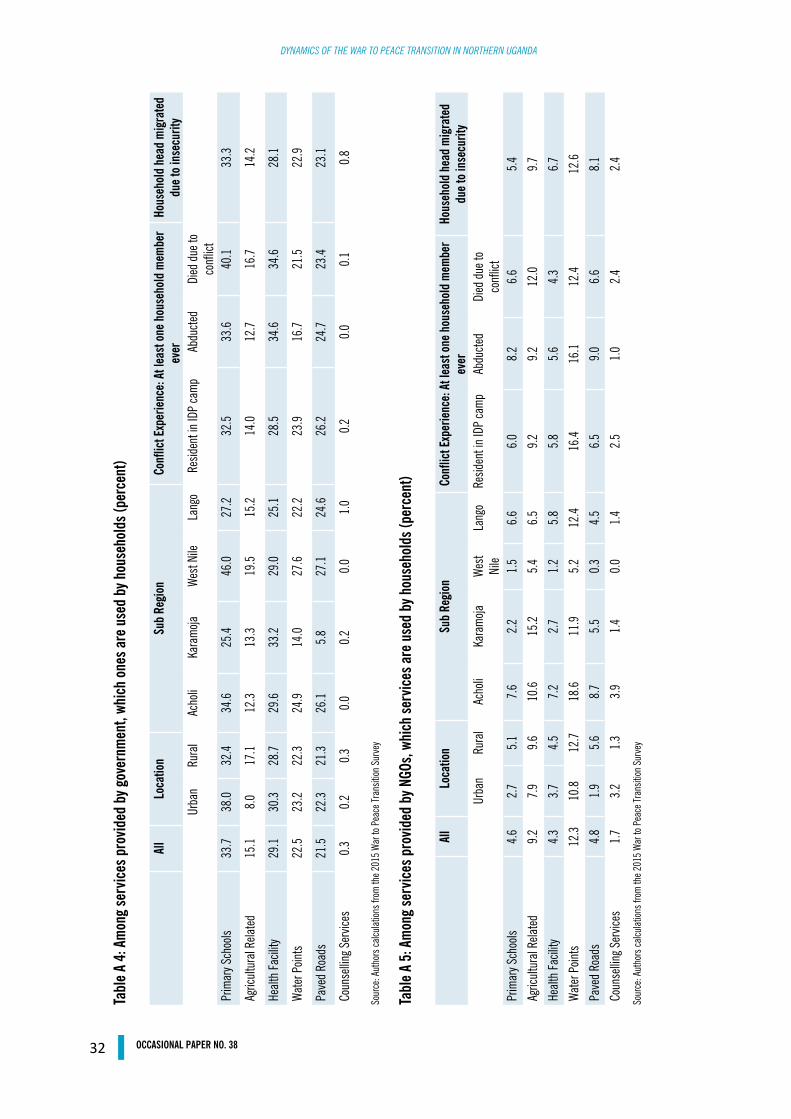
32 OccasiOnal PaPer nO. 38
DYNAMICS OF THE WAR TO PEACE TRANSITION IN NORTHERN UGANDA
Tabl
e A
4: A
mon
g se
rvic
es p
rovid
ed b
y gov
ernm
ent,
whic
h on
es a
re u
sed
by h
ouse
hold
s (pe
rcen
t)
Al
lLo
catio
nSu
b Re
gion
Conf
lict E
xper
ienc
e: A
t lea
st o
ne h
ouse
hold
mem
ber
ever
Hous
ehol
d he
ad m
igra
ted
due
to in
secu
rity
Ur
ban
Rura
lAc
holi
Kara
moja
Wes
t Nile
Lang
oRe
siden
t in
IDP
cam
pAb
duct
edDi
ed d
ue to
co
nflic
tPr
imar
y Sch
ools
33.7
38.0
32.4
34.6
25.4
46.0
27.2
32.5
33.6
40.1
33.3
Agric
ultu
ral R
elate
d 15
.18.
017
.112
.313
.319
.515
.214
.012
.716
.714
.2
Heal
th F
acilit
y 29
.130
.328
.729
.633
.229
.025
.128
.534
.634
.628
.1
Wat
er P
oints
22
.523
.222
.324
.914
.027
.622
.223
.916
.721
.522
.9
Pave
d Ro
ads
21.5
22.3
21.3
26.1
5.8
27.1
24.6
26.2
24.7
23.4
23.1
Coun
sellin
g Ser
vices
0.
30.
20.
30.
00.
20.
01.
00.
20.
00.
10.
8
Sour
ce: A
utho
rs ca
lcula
tions
from
the 2
015
War
to P
eace
Tran
sition
Sur
vey
Tabl
e A
5: A
mon
g se
rvic
es p
rovid
ed b
y NGO
s, wh
ich
serv
ices
are
use
d by
hou
seho
lds (
perc
ent)
Al
l Lo
catio
nSu
b Re
gion
Conf
lict E
xper
ienc
e: A
t lea
st o
ne h
ouse
hold
mem
ber
ever
Hous
ehol
d he
ad m
igra
ted
due
to in
secu
rity
Ur
ban
Rura
lAc
holi
Kara
moja
Wes
t Ni
leLa
ngo
Resid
ent i
n ID
P ca
mp
Abdu
cted
Died
due
to
conf
lict
Prim
ary S
choo
ls 4.
62.
75.
17.
62.
21.
56.
66.
08.
26.
65.
4
Agric
ultu
ral R
elate
d 9.
27.
99.
610
.615
.25.
46.
59.
29.
212
.09.
7
Heal
th F
acilit
y 4.
33.
74.
57.
22.
71.
25.
85.
85.
64.
36.
7
Wat
er P
oints
12
.310
.812
.718
.611
.95.
212
.416
.416
.112
.412
.6
Pave
d Ro
ads
4.8
1.9
5.6
8.7
5.5
0.3
4.5
6.5
9.0
6.6
8.1
Coun
sellin
g Ser
vices
1.
73.
21.
33.
91.
40.
01.
42.
51.
02.
42.
4
Sour
ce: A
utho
rs ca
lcula
tions
from
the 2
015
War
to P
eace
Tran
sition
Sur
vey

33
DYNAMICS OF THE WAR TO PEACE TRANSITION IN NORTHERN UGANDA
OccasiOnal PaPer nO. 38
Tabl
e A
6: W
hat t
he m
ain
3 se
rvic
es d
o yo
u th
ink
gove
rnm
ent s
houl
d pr
ovid
e in
your
are
a (p
erce
nt)
Bu
ild S
choo
ls/Im
prov
e qua
lity
Build
hos
pita
ls/Im
prov
e qua
lity
Build
m
ore
Expa
nd
Impr
ove
Impr
ove W
ater
Prom
ote
Socia
l cas
hPr
omot
e
Clas
sroo
ms
of ed
ucat
ionhe
alth
cent
res
of h
ealth
care
ro
ads
elect
ricity
Agric
ultu
rean
d sa
nita
tion
welfa
re of
wom
entra
nsfe
rswe
lfare
of yo
uth
(1
) (2
) (3
) (4
)(5
)(6
)(7
)(8
)(9
)(1
0)(1
1)
Rank
141
.331
.234
.729
.228
.437
.537
.439
.320
.031
.924
.1
Rank
233
.042
.836
.138
.433
.930
.228
.528
.723
.631
.840
.3
Rank
325
.726
.029
.231
.637
.232
.333
.831
.756
.436
.335
.6
Sub
Tota
l10
010
010
010
010
010
010
010
010
010
010
0So
urce
: Aut
hors
calcu
latio
ns fr
om th
e 201
5 W
ar to
Pea
ce Tr
ansit
ion S
urve
y

34 OccasiOnal PaPer nO. 38
DYNAMICS OF THE WAR TO PEACE TRANSITION IN NORTHERN UGANDA


Economic Policy Research CentrePlot 51, Pool Road, Makerere University Campus
P.O. Box 7841, Kampala, UgandaTel: +256-414-541023/4, Fax: +256-414-541022
Email: [email protected], Web: www.eprc.or.ug


![[DYNAMICS BETWEEN DECENTRALISATION AND …...[DYNAMICS BETWEEN DECENTRALISATION AND PEACE BUILDING ] 2011 IKV Pax Christi and VNG International M. Heijke and D. van den Berg This paper](https://static.fdocuments.in/doc/165x107/5f1252328a2c7b204e2440fd/dynamics-between-decentralisation-and-dynamics-between-decentralisation-and.jpg)

