Dynamics of the Australian Superannuation System … of the Australian Superannuation System The...
36
Dynamics of the Australian Superannuation System The next 20 years: 2013 – 2033 Deloitte Actuaries & Consultants September 2013
Transcript of Dynamics of the Australian Superannuation System … of the Australian Superannuation System The...

Dynamics of the Australian Superannuation SystemThe next 20 years: 2013 – 2033
Deloitte Actuaries & Consultants
September 2013

Dynamics of the Australian Superannuation System The next 20 years: 2011 – 2030 1
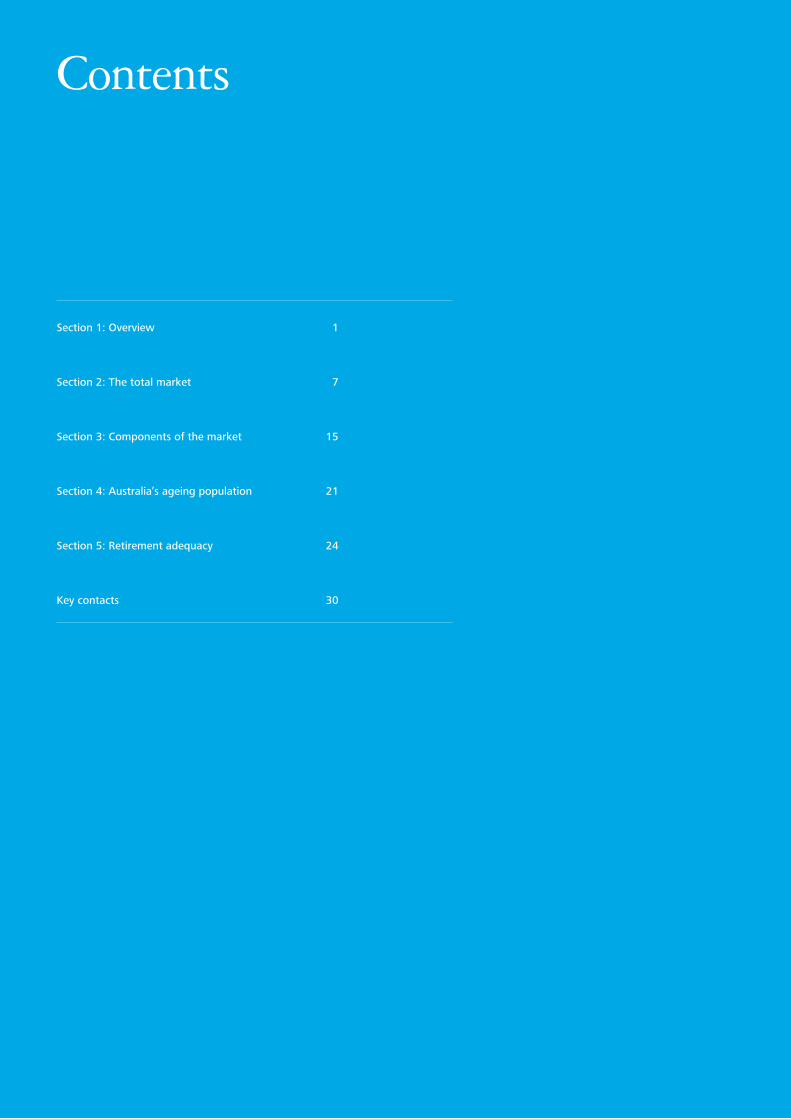
Contents
Section 1: Overview 1
Section 2: The total market 7
Section 3: Components of the market 15
Section 4: Australia’s ageing population 21
Section 5: Retirement adequacy 24
Key contacts 30

1 Dynamics of the Australian Superannuation System The next 20 years: 2013–2033
Section 1: Overview
The Australian superannuation system is the fourth largest in the world and is a source of pride for government and those working in the financial services industry. It provides the country with an enormous pool of investible funds that offer the potential to generate wealth and prosperity for our ageing population.
The Australian system, for all the praise bestowed on it, is as yet still to achieve its founding and most important objective: to deliver an adequate income in retirement to average Australians.
Some of this shortcoming is explained by the youth of the system. Many Australians now approaching retirement have only received super for a limited portion of their working lives. The system is still maturing.
Nevertheless, our projections suggest that we are still a long way from achieving this central goal. Current policy settings, including the projected increase in the Superannuation Guarantee contribution to 12%, will not of themselves deliver the level of lifestyle to the majority of those retiring over the next 20 years that we, as a nation, are aiming to achieve.
The industry post GFC to 2013
The superannuation system, as measured by a pool of assets, looks healthy. You would be forgiven for imagining that the effects of the Global Financial Crisis (GFC) have been left far behind. The $1.1 trillion held in the immediate aftermath of the GFC has increased to $1.6 trillion, and funds are posting good annual returns.
Yet, a closer examination of the last five years paints a much more complicated picture, and suggests that the Australian superannuation system has been under more pressure than many commentators think. Over this period:
• Benefitpaymentsoutofthesuperannuationsystemhave increased materially
• Contributionsintothesystemhavereduced
• Growthofpost-retirementassetsinthesystem has been less than predicted
• Thesuperannuationassetpoolhasshrunkas a portion of Australia’s GDP.
Ithasbeenatoughtimeforself-fundedretireesand for those older Australians who have lost their jobs.
Low interest rates may be popular politically, but they strike directly at the living standards of retirees, forcing those people to dip into their retirement savings to a greater extent than they had previously intended in order to make ends meet. When this occurs at a time when those savings themselves suffered negative returns, the effect can be particularly damaging.
The last five years show how much pressure the Australian superannuation system has been under.
Growth will likely continue over the next 20 years
The continuing growth of superannuation assets is underpinned by compulsory contributions, and the prospect of the return of more ‘normal’ investment returns.
In our calculations we have assumed that this also leads to a reduction in payments out of the system as retirees take the benefit of tax concessions and are able to draw down their account balances more gradually as they rely more on investment income.
Our projections show the pool of assets growing to $7.6 trillion by 2033, or in real terms from less than 100% to approximately 180% of GDP over the next 20 years.
The government has stated its intention to defer the increase in the Superannuation Guarantee by two years. This will reduce assets by only 1% over the next 20 years.
Assets in the accumulation phase
This is where the bulk of assets are, and where we see the most public and fierce competition for members. We expect the competition to intensify even further as funds release their MySuper offerings and campaign for default status under the Fair Work provisions that have been put in place over the past few months, assuming indeed that superannuation default status remains an industrial issue.
The rate of growth is more than sufficient for all industry participants to grow, even if some lose market share.

Dynamics of the Australian Superannuation System The next 20 years: 2013–2033 2
Industry funds would appear to be in the box seat. As matters stand they dominate default fund status under modern awards and we expect them to become thesinglelargestpre-retirementsegmentsometimearound 2023. Personal retail products will also grow, reflecting the strength, brand and distribution networks of the banks.
We will learn much over the next year or so. The Stronger Super and FOFA reforms have dramatically changed the competitive landscape. At first blush these changes might be thought to favour industry funds. However it is not that simple.
Many retail funds have been burdened by significant embedded advisor fees that have allowed the industry funds to compete as the low cost option. Suddenly, this is no longer the case. Costs of MySuper and choice products will likely bunch much closer together and foster competition on other dimensions – performance, insurance, services, and brand.
The battle for individual customers is something that the banks and life insurers are long experienced at. In contrast, the industry funds are on a steep learning curve.
The post-retirement challenge
Thegrowthinpost-retirementassetsislikelytobeslower than in the past. The last five years shows that post retirement assets can be quickly drawn down during periods of economic adversity.
One thing is clear.
Those Australians with substantial super at retirement are overwhelmingly voting to put their money into theirownSelf-ManagedSuperannuationFunds(SMSF).And they often establish their SMSF when they leave employment by transferring their benefit out of their corporate, industry or retail fund.
Institutional funds, whether they are industry or retail funds, have not yet been able to compete with the attraction of SMSFs. We anticipate that this will become the real battleground over the next decade. In fact the battle has started with some of the largest industry players introducing the ability for fund members to invest directly in shares and fixed term assets, as well as an increased emphasisonafter-taxreturns,andtheintroductionofnewinvestment options targeting the income needs of retirees.
It is a battle worth winning.
Retirement adequacy: the big issue
The central role of superannuation is to help Australians maintain an adequate and comfortable standard of living in retirement. We know that as of 2013 most retiring Australians do not have nearly enough super. Currently 81% are still forced to, at least partially, rely on the government aged pension to supplement their income.
And there are forces at work that will make it tougher for the super system to deliver this fundamental objective.
The population is ageing.
The number of Australians over the age of 65 will increase by 75% over the next 20 years (from 3.3 million in 2012 to 5.8 million in 2032), and at a much faster rate than the working population. The implication for government is clear. There will be proportionately fewer working Australians available to fund those in retirement.
Australians are living longer.
They are spending longer in retirement and need a correspondingly larger amount to provide for their retirement.
The battle for individual customers is something that the banks and life insurers are long experienced at...
3 Dynamics of the Australian Superannuation System The next 20 years: 2013–2033
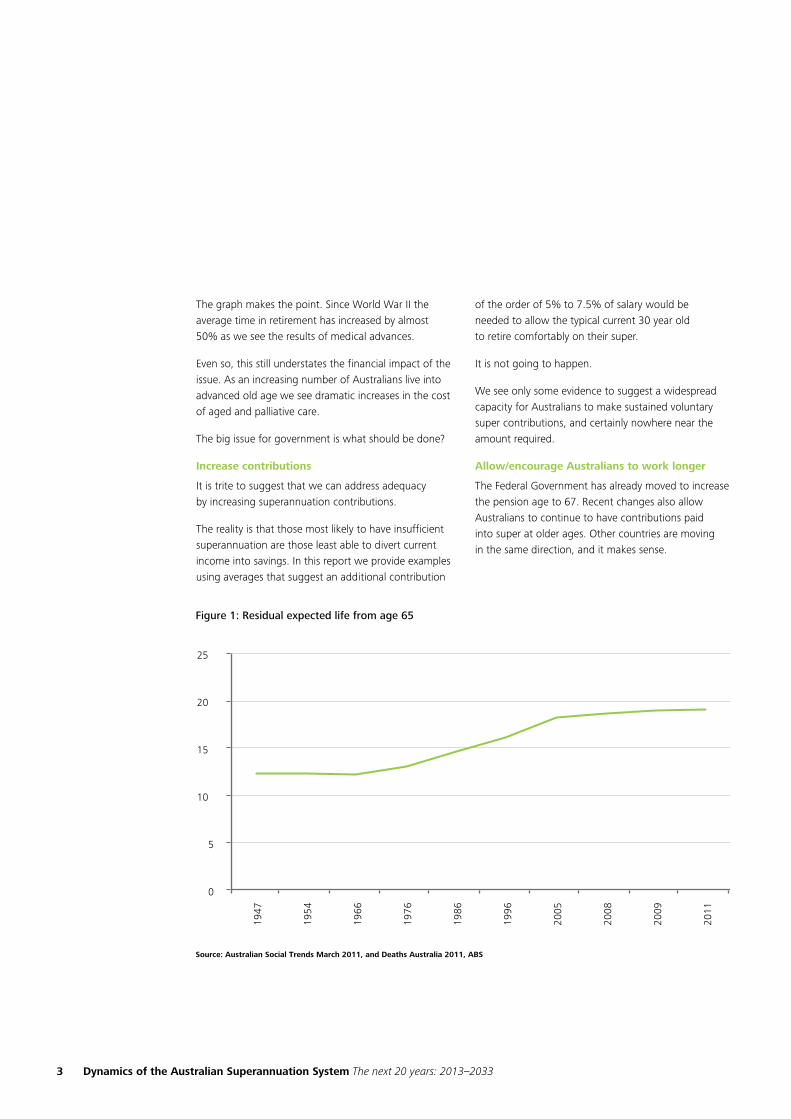
The graph makes the point. Since World War II the average time in retirement has increased by almost 50% as we see the results of medical advances.
Even so, this still understates the financial impact of the issue. As an increasing number of Australians live into advanced old age we see dramatic increases in the cost of aged and palliative care.
The big issue for government is what should be done?
Increase contributions
It is trite to suggest that we can address adequacy by increasing superannuation contributions.
The reality is that those most likely to have insufficient superannuation are those least able to divert current income into savings. In this report we provide examples using averages that suggest an additional contribution
of the order of 5% to 7.5% of salary would be needed to allow the typical current 30 year old to retire comfortably on their super.
It is not going to happen.
We see only some evidence to suggest a widespread capacity for Australians to make sustained voluntary super contributions, and certainly nowhere near the amount required.
Allow/encourage Australians to work longer
The Federal Government has already moved to increase the pension age to 67. Recent changes also allow Australians to continue to have contributions paid into super at older ages. Other countries are moving in the same direction, and it makes sense.
Dynamics of the Australian Superannuation System The next 20 years: 2013–2033 4
There is a doubly positive impact on the person’s standard of living in retirement. The extra time spent in the workforce increases the superannuation that the person accumulates. At the same time the period spent in retirement is reduced by the extra time working.
We have performed calculations assuming that Australians work an extra two and five years.
At an individual level the impact is clear. There is a materially greater ability to live at a more comfortable standard to an older age.
For the system as a whole we see the accumulation of a substantially greater pool of assets. If retirement is deferred by two years there is an extra $400 billion in the system in 2033, and if deferred by five years the pool of assets increases by a full $1 trillion from $7.6 trillion to $8.6 trillion.
Pensions address longevity risk
The long standing weakness in the Australian superannuation system is that individual Australians accumulate a lump sum balance in their superannuation account throughout their working lifetime with the aim of using that lump sum to deliver an income during their retirement.
The system breaks down on a number of fronts:
1. Some draw directly on their super to pay off debts and/or to maximise their ability to draw on social security
2. Some die before their super is exhausted but on their death any remaining balance is moved out of the system
3. Some outlive their superannuation and ultimately are forced to rely on social security.

5 Dynamics of the Australian Superannuation System The next 20 years: 2013–2033
Lifetime pensions address these inefficiencies by pooling longevityrisk.Un-neededassetsheldinrespectofthosewho die at younger ages are made available to support continuing income payments to those who live to advanced age.
We are not the first to point out the benefits of pensionsvis-à-vislumpsums.Wealsounderstandthatit is an enormous challenge for our politicians. The conventional wisdom is that Australians are devoted to their lump sums and will not countenance any government that even thinks of changing things.
Nevertheless, the impact of not pooling longevity risk is hugely underestimated.
Calculations we have undertaken suggest that if Australia moved to a genuine lifetime annuity or pension system then, other things being equal, we would reduce the amount of assets needed to fund adequate retirement benefits by about 15%.
Let us be clear. The fixation on maintaining lump sums in retirement means that one dollar in six is effectively wasted even if we accumulated precisely enough to provide an adequate income over average life expectancy for each individual Australian.
This is a substantial amount in a system that is already $1.6 trillion. It is an enormous amount in a system that is expected to grow to well over $7 trillion in the next 20 years.
We know that a move away from lump sums in retirement must occur and needs to be addressed sooner rather than later. Our political leaders need to enact legislation to enable this to happen irrespective ofpotentialshort-termramifications.
Concluding comments
Our 2013 report into the Dynamics of the Australian Superannuation System confirms much of the inherent strength of the system. Certainly, growth in the body of assets, underpinned by the compulsory Superannuation Guarantee contribution, is certain. Our calculations show assets increasing to a total of about 180% of our national GDP over the next 20 years.
This is a huge sum of money.
Competition for a slice of the industry is intensifying. The major protagonists are the largest industry funds and the wealth management arms of the banks and the life offices. In the past, the battle between these segments has resembled class warfare and been dominated by cost vs. advice vs. service.
Our belief is that the Stronger Super reforms will change the competitive landscape with much greater emphasis in the future being on product design, transactional efficiency of back office operations, and the ability tosimplyandcost-effectivelyengagewithindividualmembers, as well as the use of brand, distribution, and consumer marketing to win and retain customers.
Dynamics of the Australian Superannuation System The next 20 years: 2013–2033 6
This is already happening. Enormous amounts are being spent on administrative infrastructure, developingself-servecapabilities,andinbuildingbrand presence in the market. MySuper products are being engineered in a way that will blunt the ability to compete solely on low fees.
The advantage lies with those entities and financial institutions that have the scale, physical and digital distribution, resources and product breadth to move faster and further.
Our projections confirm that industry funds will continue to grow over the next 20 years. The main bulwark supporting industry funds is their dominant position as the default funds under modern awards.
The wild card of Australian superannuation remains the huge SMSF market. Our analysis shows that its growth has slowed, reflecting in part the reduction
in concessional contribution limits. Product innovation within both industry and retail funds has also acted to blunt the advantages attaching to SMSFs in the accumulation phase.
SMSFs will however remain particularly strong and popular amongst retirees with large accounts. There are tax and estate planning advantages which make an SMSF the vehicle of choice in these circumstances, and recent experience confirms that Australians want to reap the benefits that they offer.
A return to positive investment returns and the sheer weight of contributions generating large positive net cash flow has dramatically reduced stress levels for those managing some of the smaller and boutique superannuation funds – both retail and industry funds.
We may well see a slowdown in fund mergers which have occurred in large number over the past few years. ButweshouldnotforgettheclearlessonoftheGlobalFinancial Crisis – the system is vulnerable to global economic adversity which in turn can lead to sudden shifts in individual behaviours; and this in combination with negative returns can impact materially on individual funds.
The wild card of Australian superannuation remains the huge SMSF market
7 Dynamics of the Australian Superannuation System The next 20 years: 2013–2033
Section 2: The total market
Projected total superannuation assets
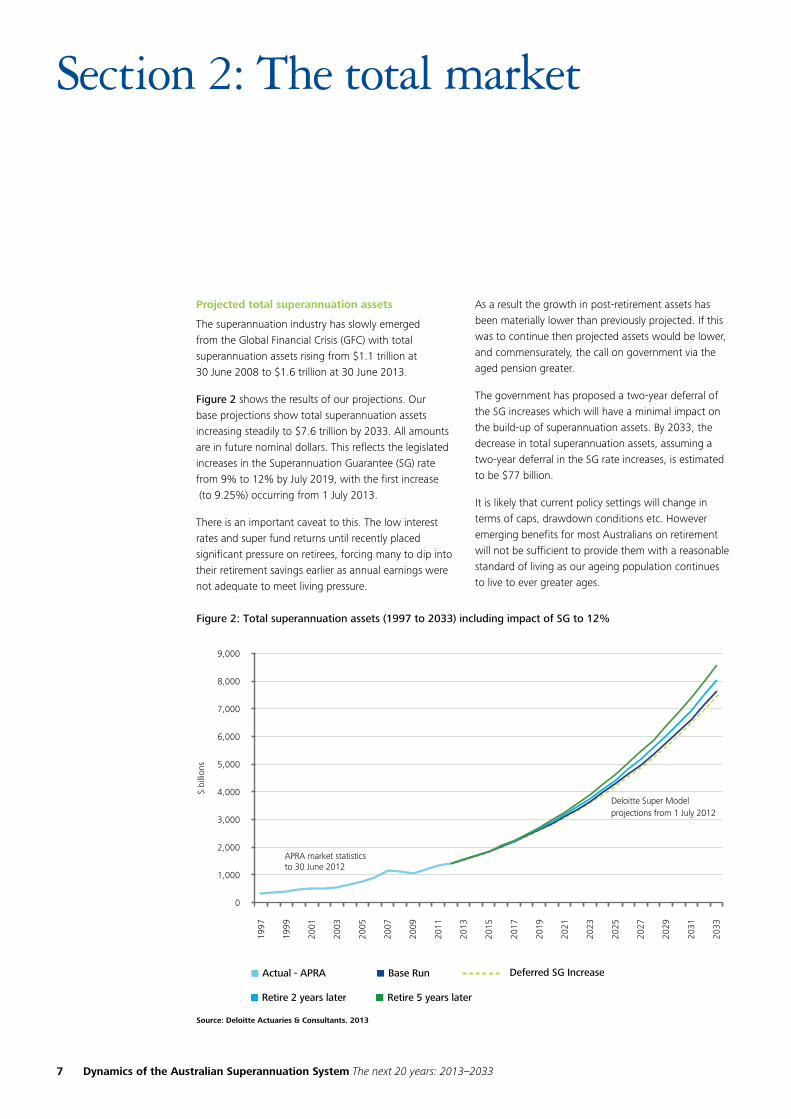
The superannuation industry has slowly emerged from the Global Financial Crisis (GFC) with total superannuation assets rising from $1.1 trillion at 30 June 2008 to $1.6 trillion at 30 June 2013.
Figure 2 shows the results of our projections. Our base projections show total superannuation assets increasing steadily to $7.6 trillion by 2033. All amounts are in future nominal dollars. This reflects the legislated increases in the Superannuation Guarantee (SG) rate from 9% to 12% by July 2019, with the first increase (to 9.25%) occurring from 1 July 2013.
There is an important caveat to this. The low interest rates and super fund returns until recently placed significant pressure on retirees, forcing many to dip into their retirement savings earlier as annual earnings were not adequate to meet living pressure.
Asaresultthegrowthinpost-retirementassetshasbeen materially lower than previously projected. If this was to continue then projected assets would be lower, and commensurately, the call on government via the aged pension greater.
Thegovernmenthasproposedatwo-yeardeferralofthe SG increases which will have a minimal impact on thebuild-upofsuperannuationassets.By2033,thedecrease in total superannuation assets, assuming a two-yeardeferralintheSGrateincreases,isestimatedto be $77 billion.
It is likely that current policy settings will change in terms of caps, drawdown conditions etc. However emerging benefits for most Australians on retirement will not be sufficient to provide them with a reasonable standard of living as our ageing population continues to live to ever greater ages.
Dynamics of the Australian Superannuation System The next 20 years: 2013–2033 8
The reality is that Australians will need to work longer and delay retirement, something that was foreshadowed by the Labor government when it recast the retirement age and so the availability of the aged pension. To that end we project the possibility of Australians deferring retirement by respectively two and five years, (illustrated in Figure 2). The results are significant.
• Delayingretirementbytwoyearsincreasessuperannuation assets in 2033 by $400 billion up to $8 trillion
• Delayingretirementbyfiveyearsincreasestheseassets by almost $1 trillion to $8.6 trillion.
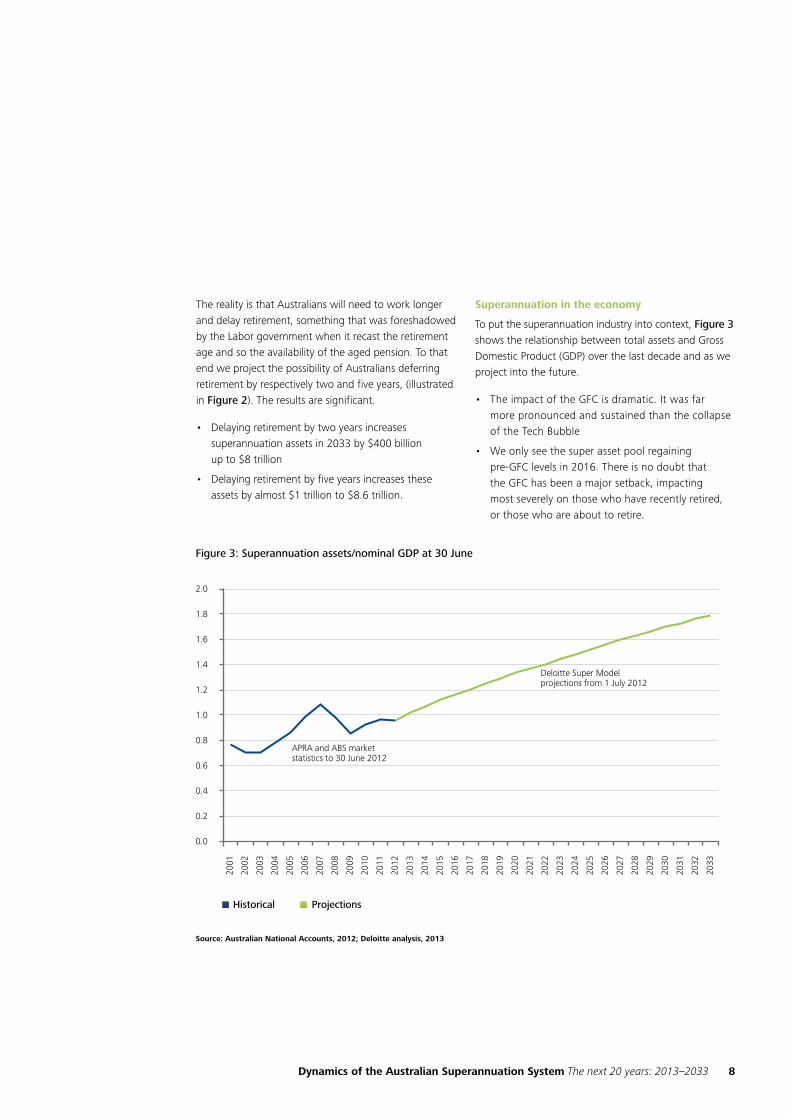
Superannuation in the economy
To put the superannuation industry into context, Figure 3 shows the relationship between total assets and Gross Domestic Product (GDP) over the last decade and as we project into the future.
• TheimpactoftheGFCisdramatic.Itwasfar more pronounced and sustained than the collapse oftheTechBubble
• Weonlyseethesuperassetpoolregaining pre-GFClevelsin2016.Thereisnodoubtthat the GFC has been a major setback, impacting most severely on those who have recently retired, or those who are about to retire.

9 Dynamics of the Australian Superannuation System The next 20 years: 2013–2033
As well as growing in terms of total assets, superannuation funds are growing their share of total financial system assets, as shown in Table 1 below. Superannuation funds have been successful in attracting monies from other parts of the financial system.
This increased share of total assets has led to superannuation funds facing higher expectations for their investment activities which has resulted in greater scrutiny of asset consultants’ comparative returns and somefundsmovingthissensitiveareain-house.
Table 1: Assets of Australian Financial Institutions
% of total ADIs
Registered financial corps
Life offices Super
Managed funds
General insurance
Securitisation vehicles
Dec 1999 46 8 10 16 9 4 3
Dec 2005 49 5 6 18 9 3 6
Dec 2007 51 5 5 19 8 3 6
Dec 2010 59 4 4 20 6 3 3
Dec 2012 60 3 4 22 5 3 2
Source: RBA and Deloitte Access Economics

Dynamics of the Australian Superannuation System The next 20 years: 2013–2033 10
Dynamics of the superannuation industry
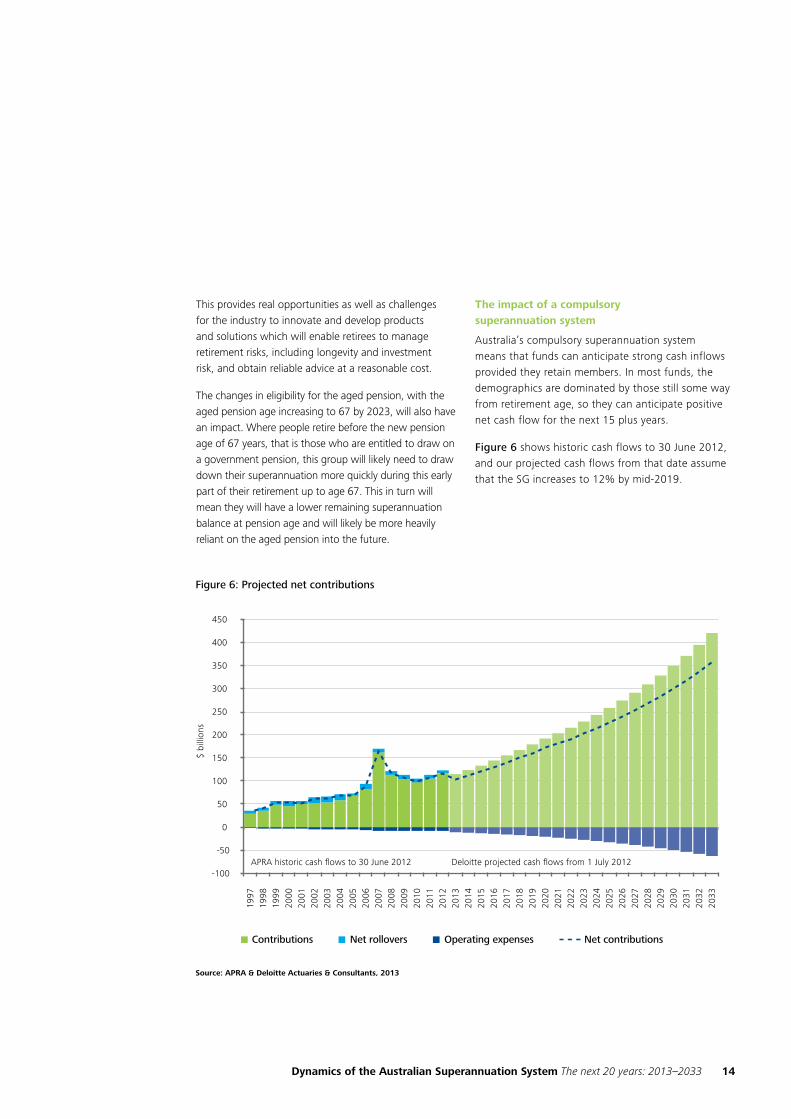
Figure 4 looks at the cash flows into and out of the superannuation system.
Benefitpaymentshavecontinuedtobeathigherlevels during the past few years. This is in part due to the fact that since July 2007, individuals aged 60 and over have been able to withdraw their superannuation benefitstax-free,andsoitappearsthatthisisaffectingmembers’benefit-takingbehaviours.
However, we believe that this is also partly due to an increased number of lump sum payments caused by increased redundancies and higher levels of early retirements since the GFC hit and the world’s economies continued their struggle with below trend growth rates and increases in unemployment.
As the Australian economy begins its shift back to more stable levels, we have based our projections on future benefit payments that are informed by previous trends.

11 Dynamics of the Australian Superannuation System The next 20 years: 2013–2033
Member contributions increased in the year following the 2006 Costello budget, most likely reflecting one-offhighertransitionallimitsbeforefutureyear reductions in the contribution limits and the tighter economic conditions that constrained many Australians’ ability to save.
Nevertheless, contributions have proven resilient. This is a feature of a system based on compulsory contributions paid into funds by employers on behalf of their employees. More recently, with confidence returning to the market, combined with a cultural tendency ‘not to change’, we are seeing superannuation returning to the box seat when it comes to the most accepted way ofsavingtosupportretirement,particularlybytheBabyBoomerswhoarefastapproachingretirementage.
To this end it is anticipated that sizeable voluntary contributions will continue into the future, with some reduction in voluntary contribution rates to offset, at least partially, the increase in the compulsory Superannuation Guarantee contributions rate to 12%.
Investment returns
Investment returns on superannuation assets are a significant contributor to the growth of the superannuation industry. It is not sufficiently appreciated
that net investment income is of a similar size each year to the total net superannuation contributions.
It is widely acknowledged, however, that it is the strategic asset allocation adopted by each superannuation member, whether that is a MySuper default option, or an investment portfolio chosen by individual members, including SMSF members, that has the greatest impact on the member’s final benefit, rather than the choice of managers within each asset sector.
It is therefore important that members do not invest too conservatively in the early to middle years of their working lives, so they can maximise the impact of investment returns compounding over time up to their final retirement date.
Thesememberswillbeabletowithstandtheshort-term volatility in their superannuation balances that is inevitable as markets fluctuate impacting the value of their growth investments. The average investment returns over the longer term will be higher with a growth strategy than if funds were only invested conservatively. This will provide higher expected final benefit at retirement.
Opportunity
Even limited advice provided by funds will assist members to make appropriate decisions on both their level of superannuation contributions and asset allocation based on individual risk appetites. Given that total benefit is funded through both contributions and investment earnings, judicious advice will be beneficial in assisting individual members calibrate these two levers according to their circumstance and market opportunity throughout their accumulation phase.
Investment returns on superannuation assets are a significant contributor to the growth of the superannuation industry

Dynamics of the Australian Superannuation System The next 20 years: 2013–2033 12
Australian superannuation – a genuine post-retirement market
The demographic challenges presented by an ageing populationcontinuetofocusattentiononthepost-retirement market. Our modelling looked at total superannuationassetssplitbetweenpre-retirementandpost-retirementwithsomeinterestingfindingsaroundthe impact of generational shifts, lump sums vs. income drawdown, and the need for advice.
• Post-retirementpensionassetsrepresentasignificantand growing pool of assets in their own right
• Formanymembersretiringinthenextdecade, the level of their final superannuation benefit will be a relatively small proportion of their final salary
As a result, it is likely that many such retirees will take a significant proportion of their benefit as a lump sum on retirement and/or draw down their superannuation as an income stream relatively quickly
Only those members with sizeable retirement benefits (say at least $150,000) will be able to draw down their superannuation progressively over their remaining lifetime
• Youngergenerations,suchasGenerationXwhowillreach retirement age in another decade or so, will have higher superannuation benefits due to having received SG contributions for most of their working lives.
This group is expected to change the current mix and increase the proportion and level of benefits retained aspost-retirementassetstobewithdrawnfromthesuperannuation system gradually over time.

13 Dynamics of the Australian Superannuation System The next 20 years: 2013–2033
Although the Australian super system is large it is still relatively immature and vulnerable to external pressures and change in regulation. The facts are that:
• MostAustraliansarecurrentlyretiringonabenefitfar less than needed to sustain them in retirement which means they will need to access social security benefits in order to support themselves
• Thenegativeinflowsandlowreturnsonfundsoverthe last few years has exacerbated these pressures on retiring individuals
• Post-retirementassetsinthesystemhavenotgrownas fast as previously anticipated. We attribute this to the economy not being at full strength over the past few years, as well as to some extent the changing nature of work.
AsBabyBoomersretireandGenerationXapproachesandentersretirement,therewillbesignificantgrowthinpost-retirement assets. However, it appears that there will also be significant leakage from the superannuation sector as a considerable proportion of benefits are withdrawn as lump sums, rather than retained to provide a regular income stream over an individual’s remaining lifetime.
The intentions, and ultimately, actions of members in choosing how they will take their superannuation benefits havemajorimplicationsforassetallocation.Inpost-retirement, members will be less able to withstand the impactofnegativereturns.Likewise,aspre-retirementmembers reach the final years of their working lives, they will also be less prepared to accept negative returns and will need to avoid the risk of a sudden drop in their
savings as they enter retirement. Consequently we expect bothpost-retirement,andmembersonthecuspofretirement, to place greater importance on capital and income protection than younger members with decades remaining to retirement.
The increase in use of lifecycle types of asset allocations (i.e. more heavily weighted to growth assets at younger ages, gradually becoming more conservative as the individual ages over time) in the MySuper offerings of superannuation funds is responding to this trend.
It is important to note that there is no ‘one size fits all’ approach that applies to individuals of any generation. In fact individuals will generally be in one of the following groups when they retire:
• Thosewithrelativelysmallsuperannuationbalancese.g. less than $75,000, who will deplete their superannuation quickly after retirement, and then need to fall back on the aged pension safety net
• Thosewithreasonablelevelsofsuperannuationandother savings, but with total balances that will not be adequate to support them over the entire period of their remaining lifetime. This group is likely to also receive additional support through the aged pension.
These individuals will be spending all of their investment earnings each year, supplemented by drawing down their capital more quickly than would be appropriate if it was to last for the rest of their lives.
• Thosewithsignificantsuperannuationandotherassets, who will have enough savings to support themselves independently throughout their retirement. A large part of their retirement income will be their investment income with potentially a small or no need to use their capital each year.
As there are no maximums applying to drawdowns from super, it is possible that some people in this group could spend at a more lavish rate than may be prudent, and hence outlive their superannuation after all.
These groups face very different investment and life challenges and will require different responses from the superannuation industry to assist them.
As Baby Boomers retire and Generation X approaches and enters retirement, there will be significant growth in post-retirement assets
Dynamics of the Australian Superannuation System The next 20 years: 2013–2033 14
This provides real opportunities as well as challenges for the industry to innovate and develop products and solutions which will enable retirees to manage retirement risks, including longevity and investment risk, and obtain reliable advice at a reasonable cost.
The changes in eligibility for the aged pension, with the aged pension age increasing to 67 by 2023, will also have an impact. Where people retire before the new pension age of 67 years, that is those who are entitled to draw on a government pension, this group will likely need to draw down their superannuation more quickly during this early part of their retirement up to age 67. This in turn will mean they will have a lower remaining superannuation balance at pension age and will likely be more heavily reliant on the aged pension into the future.
The impact of a compulsory superannuation system
Australia’s compulsory superannuation system means that funds can anticipate strong cash inflows provided they retain members. In most funds, the demographics are dominated by those still some way from retirement age, so they can anticipate positive net cash flow for the next 15 plus years.
Figure 6 shows historic cash flows to 30 June 2012, and our projected cash flows from that date assume thattheSGincreasesto12%bymid-2019.

15 Dynamics of the Australian Superannuation System The next 20 years: 2013–2033
Section 3: Components of the market
Sectors
The restructuring and consolidation of the industry that is already underway will continue. Ultimately we see the industry dominated by:
• Self-ManagedSuperannuationFunds
• Theretailgiants,predominantlythelargebanks and life insurers
• Industryfunds.
Corporate and public sector funds however are in relative decline. Indeed, the decoupling of super from specific terms of employment calls into question the raison d’etre for many previous arrangements. However for the employees of many large organisations, the residual defined benefits that exist with many of their corporate and public sector funds remain important and inextricably tied in with their employment.
Behaviours
There are inevitably quite different member behaviours betweenpre-andpost-retirementstages.SMSFshavebecome the ‘home of choice’ for those retiring with significant super balances. Fund CEOs all point to retiring members rolling benefits into SMSFs as a major challenge. SMSFs also escape some of the new Future of Financial Advice (FOFA) requirements and may now be a safe harbour for advisors.
Retail and industry funds see most of their growth in pre-retirementassetsastheoverwhelmingmajorityofnewworkers,andthosechangingjobsinmid-career,move into default or choice fund arrangements.
Asstand-aloneemployersponsoredfundshavebeenwound up, and members transferred to industry funds or corporate master trusts, one side effect has been the exercise of choice, with many individuals choosing retail personal plans as an alternative savings vehicle.
Market share by major segments
Figure 7 shows the movement of total assets in each segment from 1997 to 2012 compiled from APRA data and the Deloitte Super Model projected movement from2013to2033.NB.APRAdoesnotseparate ‘RetailEmployer-sponsored’and‘RetailPersonal’.1
1Therelationshipbetweenretailemployer-sponsoredfundsandpersonalfundsrequiresexplanation.Thedistinctionisthatemployer-sponsoredsuperisprimarilyinfluenced by the employer of the individual, whereas personal super is the fund chosen directly by the member as an individual. Retail personal also includes significant post-retirementincome-streamproducts(annuitiesandaccount-basedpensions).ThisdistinctionisimportantbecausetheunderlyingeconomicsofRetailEmployer-sponsored funds and Personal funds are significantly different. We expect that the MySuper changes occurring over the coming year will blur the distinction between RetailEmployer-sponsoredandPersonalfunds,sotheymaybecomemorealikeandlessclearlydistinguishedfromeachother.

Dynamics of the Australian Superannuation System The next 20 years: 2013–2033 16
Some highlights from these projections include:
Industry funds are expected to grow significantly over the next 20 years with their rate of growth equalling that of SMSFs over the period to 2033, with the industry fund and SMSF sector reaching $1.93 trillion and $2.23 trillion respectively (See Figure 7).
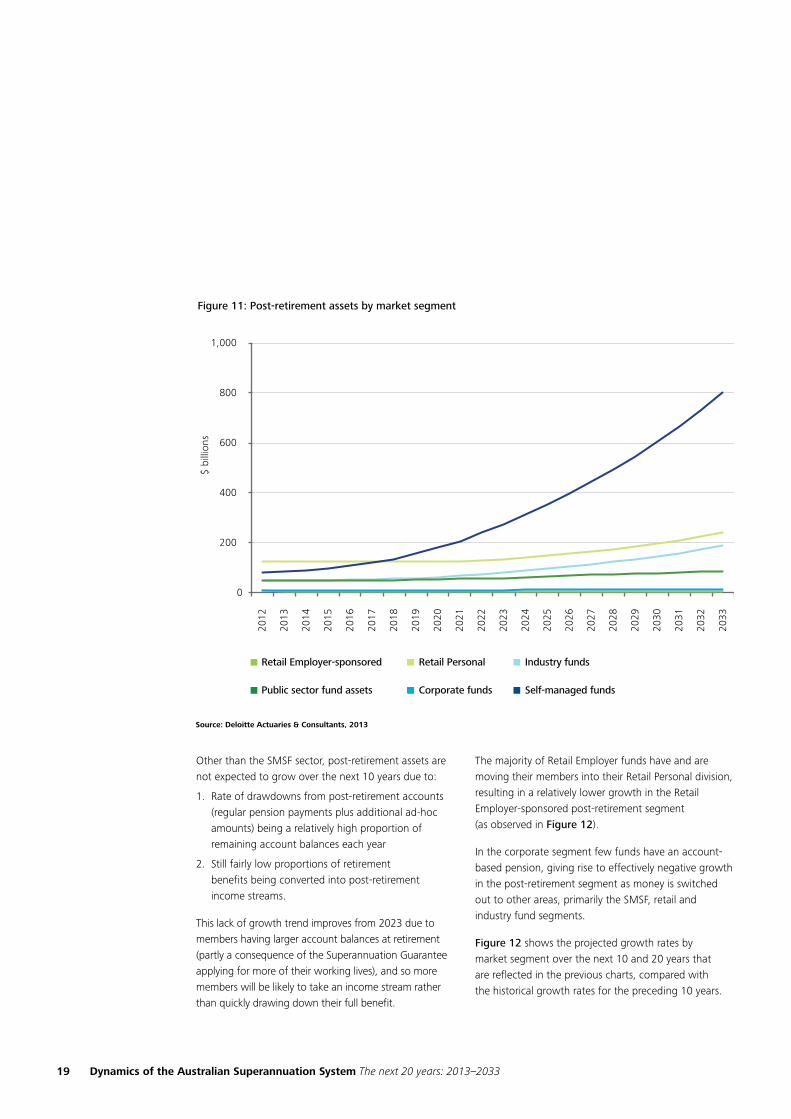
Our projections indicate that the total retail fund sector(thatisacombinationofretailemployer-sponsored and retail personal) will take over from SMSFs as the largest market segment in 2019 and reach almost $2.5 trillion in assets in 2030. However SMSFs are still expected to be the largest sector by farinthepost-retirementsuperannuationmarketreaching $800 billion in 2032, and eclipsing the retail personal segment in 2017 (See Figure 11).
Public sector funds are expected to continue to grow at a reasonable rate over the total lifecycle, while the corporate segment will remain relatively flat. Given SMSF growth curves, it is easy to see why industry funds and the large wealth management businesses are exploring ways to capture a greater share of the fairly ‘new’ phenomenon of SMSF members and/or their assets.
As the education of members continues to ramp upwithBabyBoomersapproachingretirement,thefocus is shifting to tax, and the implications of taking significant lump sums at retirement compared to income stream products. Public seminars and marketing material on this and other benefits of retaining balances in the superannuation system are being shared with members to help boost the retention of monies within thepost-retirementsuperannuationspacetomeetlongevity requirements.

17 Dynamics of the Australian Superannuation System The next 20 years: 2013–2033

Dynamics of the Australian Superannuation System The next 20 years: 2013–2033 18
Pre- and post-retirement assets
Figure 10 shows that industry funds will take over as the largestpre-retirementsectoraround2023.RetailPersonalwill also continue to grow strongly, reflecting the power of the banks and their distribution networks, to become thesecondlargestpre-retirementsectorinabout2029.
SMSFs continue to remain popular although their growth is not expected to be as strong over the next 20 years as we have seen in the past decade.
Figure 11 shows that SMSFs will continue to be very popularpost-retirementvehicles.Thosewhowishtohavea greater control over their superannuation, particularly members with larger account balances, are likely to continue to favour SMSFs.
It is common practice for people to create their own SMSF on retirement or earlier, particularly when they receive large sums of money from, for example, their current corporate plan, or their public sector plan. There are a number of factors that suggest this will continue, including the tax benefits available within an SMSF structureforthosetransitioningfrompre-retirement topost-retirement,andthepotentialthatFOFA makes SMSFs more attractive to financial advisors than MySuper or the choice products found in the APRA-regulatedfundsectorgenerally.
Other key points regarding post-retirement include:
The significant proportion of benefits which are taken as a lump sum has a dampening effect on the level ofpost-retirementassets.
19 Dynamics of the Australian Superannuation System The next 20 years: 2013–2033
OtherthantheSMSFsector,post-retirementassetsarenot expected to grow over the next 10 years due to:
1. Rateofdrawdownsfrompost-retirementaccounts(regularpensionpaymentsplusadditionalad-hocamounts) being a relatively high proportion of remaining account balances each year
2. Still fairly low proportions of retirement benefitsbeingconvertedintopost-retirement income streams.
This lack of growth trend improves from 2023 due to members having larger account balances at retirement (partly a consequence of the Superannuation Guarantee applying for more of their working lives), and so more members will be likely to take an income stream rather than quickly drawing down their full benefit.
The majority of Retail Employer funds have and are moving their members into their Retail Personal division, resulting in a relatively lower growth in the Retail Employer-sponsoredpost-retirementsegment (as observed in Figure 12).
Inthecorporatesegmentfewfundshaveanaccount-based pension, giving rise to effectively negative growth inthepost-retirementsegmentasmoneyisswitchedout to other areas, primarily the SMSF, retail and industry fund segments.
Figure 12 shows the projected growth rates by market segment over the next 10 and 20 years that are reflected in the previous charts, compared with the historical growth rates for the preceding 10 years.

Dynamics of the Australian Superannuation System The next 20 years: 2013–2033 20
21 Dynamics of the Australian Superannuation System The next 20 years: 2013–2033
Section 4: Australia’s ageing population
Generational change
The Deloitte Super Model analyses both demographic and asset data for different generational groups.
Charts in Figure 13, which show the Australian population by generation, illustrate the substantial changesoverthenext20yearsastheBabyBoomersmoveoutoftheworkforce.By2033,thispost-WorldWar II generational bulge will have all but left the workforce, which will then be dominated by Generation Yandafast-decliningproportionofGenerationX. By2033,GenerationZortheMillennialswillhavegrown to 20% of the workforce.
Thismeansthataroundone-thirdofsuperannuationassets in 20 years will be held by people currently under the age of 30 – an increasingly important segment of the market that requires funds and providers to interact with them in a very different way.
Also almost half the assets in superannuation today are held by people who are going to retire in the next decade or so, or are already retired. This also challenges the industry to find a solution to keeping them in the system.
Another important observation is the proportion of the working population to the retired population. Currently, there are approximately four individuals of working age for each retiree. Over the next 20 years to 2033, this will reduce to less than three individuals of working age for each retiree.
This will place increased pressures on tax collections – there will be fewer workers who are paying tax to fund the government’s aged pension and other social security commitments.
It is vitally important therefore, that Australia’s superannuation system both grows in totality, and grows in terms of benefit adequacy. The country needsmoreself-fundedretireestolessentheburdenon the public purse.
The following section of this report describes observations around the potential improvement in the adequacy of the system over time, which may help to satisfy this need.
Currently, there are approximately four individuals of working age for each retiree

Dynamics of the Australian Superannuation System The next 20 years: 2013–2033 22

23 Dynamics of the Australian Superannuation System The next 20 years: 2013–2033
Table 2 illustrates the generational transfer of assets, fromtheBabyBoomersandGenXnow,toGenXandGen Y in 20 years’ time.
Generation Y in particular will grow in significance and own 12% of total superannuation assets within the next five years; increasing to 30% within the next twenty years. This is a huge amount of money in the hands of individuals currently under the age of 30, many of whom have not yet even entered the workforce!
The superannuation industry will therefore undergo a significant transition period in the next ten to twenty years.
How will the industry capture, engage, and advise this new generation of members who are likely to expect more sophisticated delivery and communication mechanisms,inparticulare-commerceandactiveinternet channels, with information sought increasingly through social networking and social media?
WiththeSilentGeneration,BabyBoomers,andGenXallapartoftheearlygrowthofcompulsorysuperannuation, this coming period will be the first time that the industry has had to consider the growth of an entirely new generation within the system.
To add to this shift, the next ten years will also see the first generation of members retiring after a substantial period accumulating assets within the compulsory superannuation system. Hence, in addition to managing the growth of a young, technology savvy generation, the industry must also for the first time grapple with how to retain a significant amount of assets – nearly one-halfofcurrentsuperannuationassets–intothepost-retirementphase.Thisisacriticaltransitionperiod,the success of which will have a significant impact upon thelivingstandardsoftheBabyBoomergenerationthrough advanced ages.
Table 2: Shift in ownership of superannuation assets by generational groupings
Year of birth 2013 2023 2033
Silent generation 1925 – 1942 9% 2% –
Baby Boomers 1943 – 1960 47% 29% 11%
Generation X 1961 – 1981 39% 52% 53%
Generation Y 1982 – 2000 5% 16% 30%
Generation Z 2001 – onwards – 1% 6%
Source: Deloitte Actuaries & Consultants, 2013
Dynamics of the Australian Superannuation System The next 20 years: 2013–2033 24
Section 5: Retirement adequacy
Nearly $8 trillion dollars! That’s certainly a lot of superannuation.Butwillitbeenough?
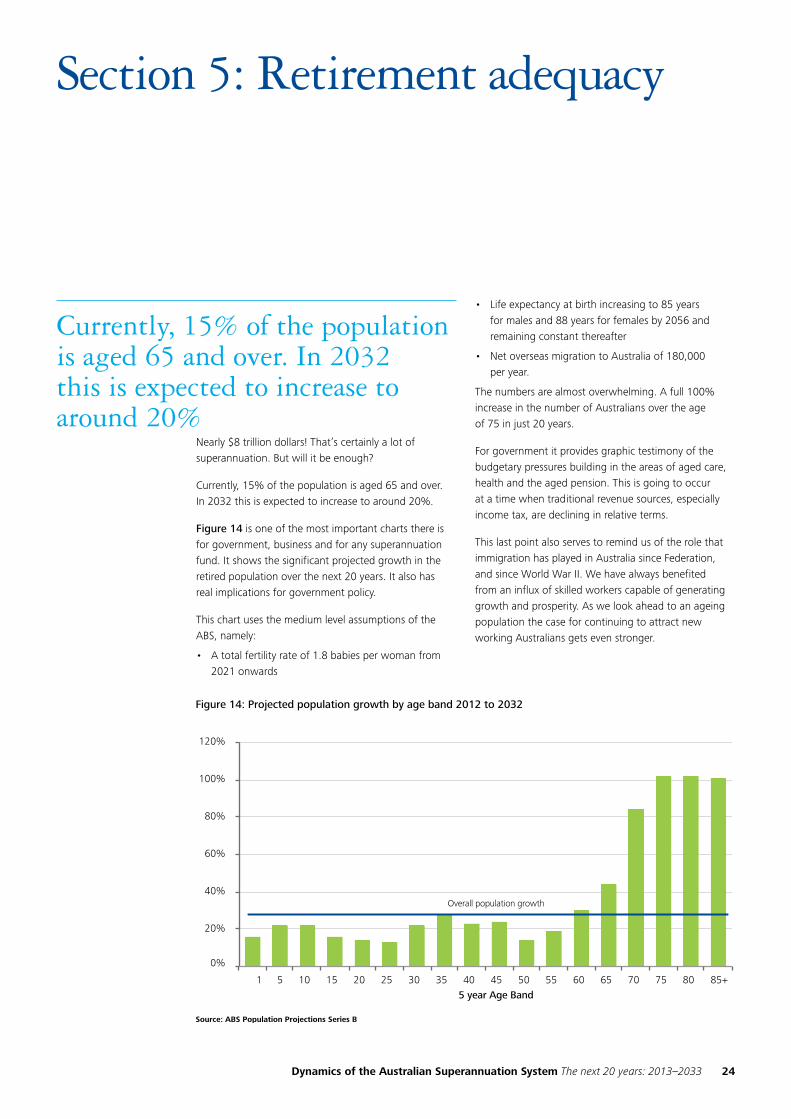
Currently, 15% of the population is aged 65 and over. In 2032 this is expected to increase to around 20%.
Figure 14 is one of the most important charts there is for government, business and for any superannuation fund. It shows the significant projected growth in the retired population over the next 20 years. It also has real implications for government policy.
This chart uses the medium level assumptions of the ABS,namely:
• Atotalfertilityrateof1.8babiesperwomanfrom2021 onwards
• Lifeexpectancyatbirthincreasingto85yearsfor males and 88 years for females by 2056 and remaining constant thereafter
• NetoverseasmigrationtoAustraliaof180,000 per year.
The numbers are almost overwhelming. A full 100% increase in the number of Australians over the age of 75 in just 20 years.
For government it provides graphic testimony of the budgetary pressures building in the areas of aged care, health and the aged pension. This is going to occur at a time when traditional revenue sources, especially income tax, are declining in relative terms.
This last point also serves to remind us of the role that immigration has played in Australia since Federation, and since World War II. We have always benefited from an influx of skilled workers capable of generating growth and prosperity. As we look ahead to an ageing population the case for continuing to attract new working Australians gets even stronger.
Currently, 15% of the population is aged 65 and over. In 2032 this is expected to increase to around 20%

25 Dynamics of the Australian Superannuation System The next 20 years: 2013–2033
Theimplicationsforbusinessarealsostark.Bettertobuild retirement villages than prams. It is no coincidence that insurers and wealth management firms are rapidly developing products to meet the needs of retired Australians.
So what does all this mean for the individual Australian? When planning for retirement adequacy a person needs to consider three things:
1. Amount of money at retirement
2. Level of income required in retirement
3. Projected length of time that money will need to last.
A useful benchmark when discussing retirement adequacy is the ASFA Retirement Standard.
This benchmarks the annual budget needed by Australians to fund either a comfortable or modest standardoflivinginthepost-workyears.
The analysis in this section uses the budgets released by ASFA for the June Quarter 2013 (see Table 3).
According to the most recent mortality tables a65-year-oldmaleisexpectedtoliveto84and a female to 87 years. This has been increasing steadily and these trends are expected to continue. Figure 15 shows the increase in life expectancy at age 65 over the past decade.
Looking ahead, a person reaching 65 in 2032 is likely to expect to live longer than a 65 year old today.
Table 3: ASFA Retirement Standards
Modest lifestyle in retirement Comfortable lifestyle in retirement
Male Age 65 Female Age 65 Male Age 65 Female Age 65
ASFA Standard Income pa
$22,654 $22,654 $41,197 $41,197
Source: ASFA

Dynamics of the Australian Superannuation System The next 20 years: 2013–2033 26
How much is enough?
Using the ASFA Retirement Standard and life expectancy at age 65 we can calculate the lump sums that would be required by Australians if they retired today. Table 4 shows the required lump sums for the two ASFA retirement standards for both males and females.
Although averages do not give the complete story, they certainly indicate that many Australians will not have enough savings in superannuation alone to fund their retirement.
One of the challenges facing retirees is that they do not know how long their superannuation benefits need to last.
As shown above, the life expectancy for a male aged 65 is 84. However this is an average for the whole population. The actual retirement life span for each person will vary considerably. There are two sources of this variation or uncertainty.
1. Half the population is expected to live past age 84
2. Life expectancy is expected to increase (also uncertain).
Figure 16 shows the lump sums a retiree aged 65 would currently require to fund these budgets on a range of life spans.
Table 4: ASFA Retirement Standards and lump sums required at age 65
Modest lifestyle in retirement Comfortable lifestyle in retirement
Male Age 65 Female Age 65 Male Age 65 Female Age 65
ASFA Standard Income pa
$22,654 $22,654 $41,197 $41,197
Required lump sum at retirement*
$330,000 $360,000 $590,000 $660,000
* Rounded to the nearest $10,000
Source: ASFA

27 Dynamics of the Australian Superannuation System The next 20 years: 2013–2033
Will Australians have enough?
Currently: the average 65 year old does not have nearly sufficient superannuation to fund these amounts. The recently released AMP Retirement Adequacy 2012 shows the following average superannuation balances as at December 2012.
Table 5: Average superannuation balances
Male Female All
60 – 64 year olds $85,000 $59,000 $77,000
65 – 69 year olds $77,000 $55,000 $72,000
* Rounded to the nearest $1,000
Source: ASFA
Dynamics of the Australian Superannuation System The next 20 years: 2013–2033 28
Looking ahead
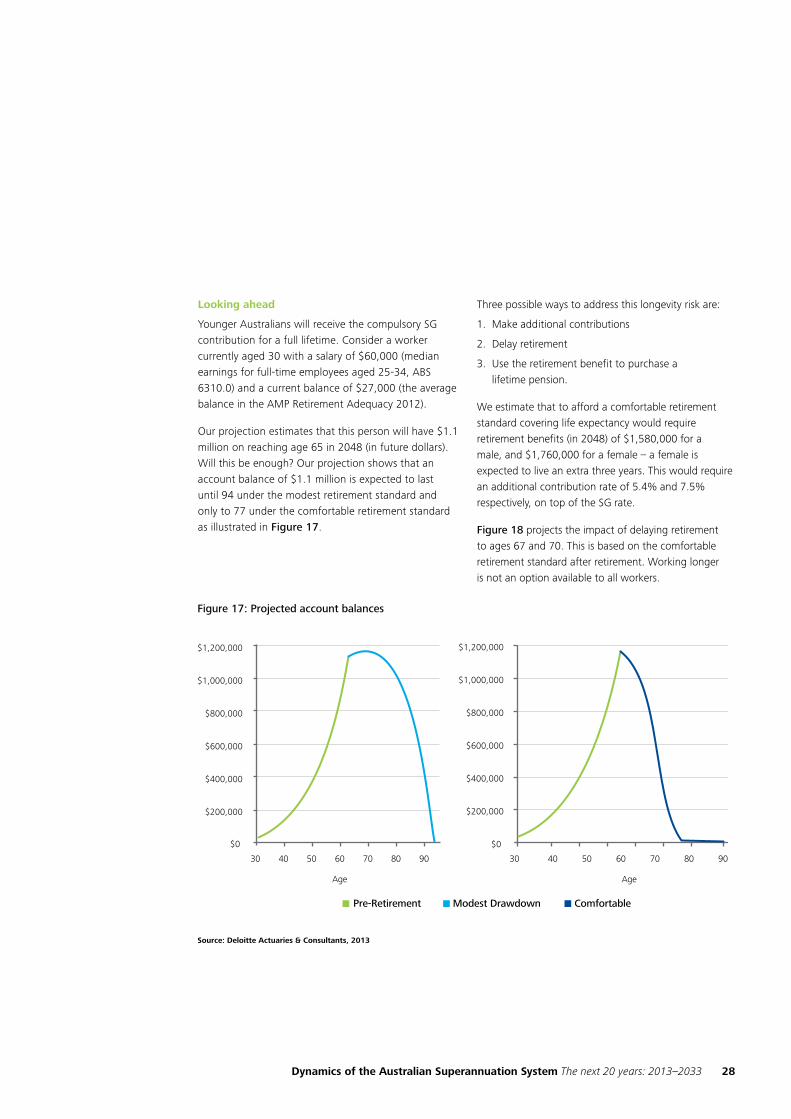
Younger Australians will receive the compulsory SG contribution for a full lifetime. Consider a worker currently aged 30 with a salary of $60,000 (median earningsforfull-timeemployeesaged25-34,ABS6310.0) and a current balance of $27,000 (the average balance in the AMP Retirement Adequacy 2012).
Our projection estimates that this person will have $1.1 million on reaching age 65 in 2048 (in future dollars). Will this be enough? Our projection shows that an account balance of $1.1 million is expected to last until 94 under the modest retirement standard and only to 77 under the comfortable retirement standard as illustrated in Figure 17.
Three possible ways to address this longevity risk are:
1. Make additional contributions
2. Delay retirement
3. Use the retirement benefit to purchase a lifetime pension.
We estimate that to afford a comfortable retirement standard covering life expectancy would require retirement benefits (in 2048) of $1,580,000 for a male, and $1,760,000 for a female – a female is expected to live an extra three years. This would require an additional contribution rate of 5.4% and 7.5% respectively, on top of the SG rate.
Figure 18 projects the impact of delaying retirement to ages 67 and 70. This is based on the comfortable retirement standard after retirement. Working longer is not an option available to all workers.
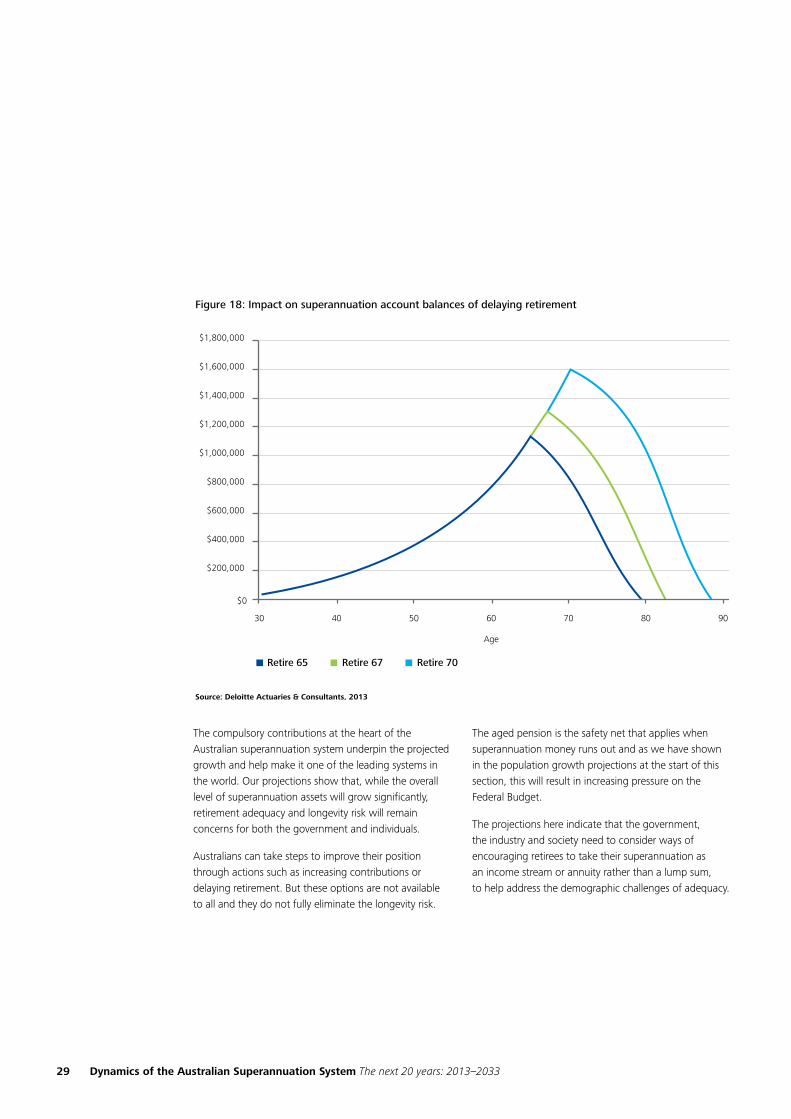
29 Dynamics of the Australian Superannuation System The next 20 years: 2013–2033
The compulsory contributions at the heart of the Australian superannuation system underpin the projected growth and help make it one of the leading systems in the world. Our projections show that, while the overall level of superannuation assets will grow significantly, retirement adequacy and longevity risk will remain concerns for both the government and individuals.
Australians can take steps to improve their position through actions such as increasing contributions or delayingretirement.Buttheseoptionsarenotavailableto all and they do not fully eliminate the longevity risk.
The aged pension is the safety net that applies when superannuation money runs out and as we have shown in the population growth projections at the start of this section, this will result in increasing pressure on the FederalBudget.
The projections here indicate that the government, the industry and society need to consider ways of encouraging retirees to take their superannuation as an income stream or annuity rather than a lump sum, to help address the demographic challenges of adequacy.

Dynamics of the Australian Superannuation System The next 20 years: 2013–2033 30
Key contacts
Russell MasonPartnerTel: +61 2 9322 5347Email: [email protected]
Wayne WalkerPartnerTel: +61 3 9671 6916Email: [email protected]
Stephen HuppertPartnerTel: +61 3 9671 7778Email: [email protected]
Ben FacerPrincipal Tel: +61 2 9322 3493Email: [email protected]
Diane SomervilleDirector Tel: +61 2 9322 7636Email: [email protected]
Louise DenverDirector Tel: +61 2 9322 7615 Mob: +61 414 889 857Email: [email protected]
Authors

31 Dynamics of the Australian Superannuation System The next 20 years: 2013–2033
Neil BrownPartner Tel: +61 3 9671 7154Email: [email protected]
Sarah WoodhousePartnerTel: +61 2 9322 7510Email: [email protected]
Frances BorgPartnerTel: +61 2 9322 7202Email: [email protected]
David RodgersPartnerTel: +61 7 3308 7453Email: [email protected]
James OliverPartnerTel: +61 3 9671 7969Email: [email protected]
Adele WatsonPartnerTel: +61 2 9322 7752Email: [email protected]
John RandallPartnerTel: +61 2 9322 7550Email: [email protected]
Peter LarsenPrincipalTel: +61 3 9671 6929Email: [email protected]

Dynamics of the Australian Superannuation System The next 20 years: 2013–2033 32
Rick PorterPartner Tel: +61 3 9671 7922Email: [email protected]
Caroline BennetPartner Tel: +61 3 9671 6572Email: [email protected]
Katherine HowardPartner Tel: +61 2 9322 3428Email: [email protected]
Joel LipmanPartner Tel: +61 3 9671 7302Email: [email protected]
Vivienne TangPartner Tel: +61 3 9671 6742Email: [email protected]
John McCourtPartnerTel: +61 8 8407 7326Email: [email protected]
Robert JacksonDirectorTel: +61 3 9671 6830Email: [email protected]
Dave SalmonDirector Tel: +61 2 6263 7110Email: [email protected]

Deloitte Sydney
225 George StreetSydney, New South WalesAustralia
Tel: +61 2 9322 7000Fax: +61 2 9322 7001
Deloitte Melbourne
550BourkeStreet Melbourne, VictoriaAustralia
Tel: +61 3 9671 7000Fax: +61 3 9671 7001
Deloitte Canberra
Level2,8BrindabellaCircuit, BrindabellaBusinessPark, Canberra Airport Canberra ACTAustralia
Tel: +61 2 6263 7000 Fax: +61 2 6263 7004
Deloitte Brisbane
123 Eagle StreetBrisbane,QueenslandAustralia
Tel: +61 7 3308 7000Fax: +61 7 3308 7001
email: [email protected]
This publication contains general information only, and none of Deloitte Touche Tohmatsu Limited, its member firms, or their related entities (collectively the “Deloitte Network”) is, by means of this publication, rendering professional advice or services.
Beforemakinganydecisionortakinganyactionthatmayaffectyourfinancesoryourbusiness,youshouldconsultaqualifiedprofessionaladviser. No entity in the Deloitte Network shall be responsible for any loss whatsoever sustained by any person who relies on this publication.
About Deloitte
Deloitte refers to one or more of Deloitte Touche Tohmatsu Limited, a UK private company limited by guarantee, and its network of member firms, each of which is a legally separate and independent entity. Please see www.deloitte.com/au/about for a detailed description of the legal structure of Deloitte Touche Tohmatsu Limited and its member firms.
Deloitte provides audit, tax, consulting, and financial advisory services to public and private clients spanning multiple industries. With a globallyconnectednetworkofmemberfirmsinmorethan150countries,Deloittebringsworld-classcapabilitiesandhigh-qualityserviceto clients, delivering the insights they need to address their most complex business challenges. Deloitte has in the region of 200,000 professionals, all committed to becoming the standard of excellence.
About Deloitte Australia
In Australia, the member firm is the Australian partnership of Deloitte Touche Tohmatsu. As one of Australia’s leading professional services firms, Deloitte Touche Tohmatsu and its affiliates provide audit, tax, consulting, and financial advisory services through approximately 6,000 people across the country. Focused on the creation of value and growth, and known as an employer of choice for innovative human resources programs, we are dedicated to helping our clients and our people excel. For more information, please visit Deloitte’s web site at www.deloitte.com.au.
Liability limited by a scheme approved under Professional Standards Legislation.
Member of Deloitte Touche Tohmatsu Limited
© 2013 Deloitte Touche Tohmatsu.
MCBD_STD_09/13_049080