Dynamics of Separation Bubbles Formed on Rounded...
12
1 Dynamics of Separation Bubbles Formed on Rounded Edges by S. COURTINE (1) and A. SPOHN (2) Laboratoire d’Etudes Aérodynamiques, UMR 6609 Ecole Nationale Supérieure de Mécanique et d’Aérotechnique TELEPORT 2 – 1, avenue Clément Ader B.P. 40109 86961 FUTUROSCOPE Cedex FRANCE (1) E-Mail: [email protected] (2) E-Mail: [email protected] ABSTRACT The front part of many bluff bodies contains rounded edges, which lead to the formation of separation bubbles. The separated flow inside these bubbles is highly unstable causing unsteadiness and turbulence. The ability to predict and control the dynamical behaviour of these separations is of great practical importance. The existence of separation bubbles on rounded front edges of bluff bodies contributes to the overall drag of the body. Its reduction is closely related to the control of the eddying wake flow caused by flow separation. While the influence of adverse pressure gradients on separation bubbles has been studied extensively, studies on the influence of flow geometry remain scarce. The aim of this study is to get a better understanding of the physical mechanisms which control this phenomenon on curved bodies Complementary measurements based on flow visualizations, P.I.V. technique and hot-film data acquisition are presented to analyse the dynamic behaviour of separation bubbles. Generic bluff-body models with variable front edge radius and aspect ratio were placed in the test-section of a low-speed water tunnel. The flow velocities of the order of 0.1 m/s allow the confrontation of the time-resolved P.I.V. measurements with the flow visualizations and hot-film measurements. All results confirm the strong influence of the front edge radius on the break-up length of the separation bubble. In addition the results show that the dynamic behaviour of the separation bubble depends on the aspect ratio of the bluff-body. For high aspect ratios the bubble break-up scenario takes place by three-dimensional instabilities in agreement with recent numerical simulations of Yang & Voke (2001). However, for small aspects ratios a new mechanism due to the influence of the lateral limitations of the bubble has been identified. It leads to low frequency flapping of the bubble with rapid onset of three-dimensional flow inside the bubble. a) b) Fig. 0: Separation bubble formed on a rounded edge (configuration h = 0.8, L = 2.2, Re = 1750) a) Single-shot P.I.V. velocity field of the bubble side view
Transcript of Dynamics of Separation Bubbles Formed on Rounded...

1
Dynamics of Separation Bubbles Formed on Rounded Edges
by
S. COURTINE (1) and A. SPOHN (2)
Laboratoire d’Etudes Aérodynamiques, UMR 6609
Ecole Nationale Supérieure de Mécanique et d’Aérotechnique
TELEPORT 2 – 1, avenue Clément Ader B.P. 40109
86961 FUTUROSCOPE Cedex FRANCE (1)E-Mail: [email protected]
(2)E-Mail: [email protected]
ABSTRACT
The front part of many bluff bodies contains rounded edges, which lead to the formation of separation bubbles. The separated flow inside these bubbles is highly unstable causing unsteadiness and turbulence. The ability to predict and control the dynamical behaviour of these separations is of great practical importance. The existence of separation bubbles on rounded front edges of bluff bodies contributes to the overall drag of the body. Its reduction is closely related to the control of the eddying wake flow caused by flow separation. While the influence of adverse pressure gradients on separation bubbles has been studied extensively, studies on the influence of flow geometry remain scarce. The aim of this study is to get a better understanding of the physical mechanisms which control this phenomenon on curved bodies
Complementary measurements based on flow visualizations, P.I.V. technique and hot-film data acquisition are presented to analyse the dynamic behaviour of separation bubbles. Generic bluff-body models with variable front edge radius and aspect ratio were placed in the test-section of a low-speed water tunnel. The flow velocities of the order of 0.1 m/s allow the confrontation of the time-resolved P.I.V. measurements with the flow visualizations and hot-film measurements. All results confirm the strong influence of the front edge radius on the break-up length of the separation bubble. In addition the results show that the dynamic behaviour of the separation bubble depends on the aspect ratio of the bluff-body. For high aspect ratios the bubble break-up scenario takes place by three-dimensional instabilities in agreement with recent numerical simulations of Yang & Voke (2001). However, for small aspects ratios a new mechanism due to the influence of the lateral limitations of the bubble has been identified. It leads to low frequency flapping of the bubble with rapid onset of three-dimensional flow inside the bubble.
a) b)
Fig. 0: Separation bubble formed on a rounded edge (configuration η = 0.8, Λ = 2.2, Re = 1750)
a) Single-shot P.I.V. velocity field of the bubble side view

2
b) Visualization from behind in the downstream direction: ejection of “mushroom like” longitudinal vortices by the bubble flapping
3
1. INTRODUCTION
The formation of separation bubbles in the front part of bluff-bodies is of great practical importance in many engineering applications. Drag and noise reduction of automotive vehicles, for example, are closely related to the control of the eddying wake flow caused by such separation bubbles. From a physical point of view the flow inside the bubbles gives rise to a complex dynamic behavior leading to unsteadiness and turbulence (Brown & Stewartson 1969). Two different physical mechanisms can be at the origin of flow separation: first the flow can separate owing to the action of an imposed adverse pressure gradient or second the flow separates due to curvature effects. While two-dimensional flow configurations with flat or nearly flat boundary layers exposed to an adverse pressure gradient have been studied extensively both numerically and experimentally (Pauley et al. 1990, Rist et al. 2002), studies on the influence of curvature, which are particularly relevant for bluff-bodies, remain scarce. In a more qualitative approach Cooper (1986) compared the overall drag of bodies with different front edge radius and found the critical radius with minimum drag as a function of Reynolds number. He attributed the minimum drag to the absence of flow separation for that radius. However, at present a complete understanding of the flow structure, the dynamical behavior of separation bubbles and its impact on drag is still far from complete. In particular recent numerical computations of Yang & Voke (2001) show that beside the classical Kelvin-Helmholtz instability three-dimensional secondary instabilities and secondary motions, the so-called bubble flapping, may play a major role in the bubble break-up.
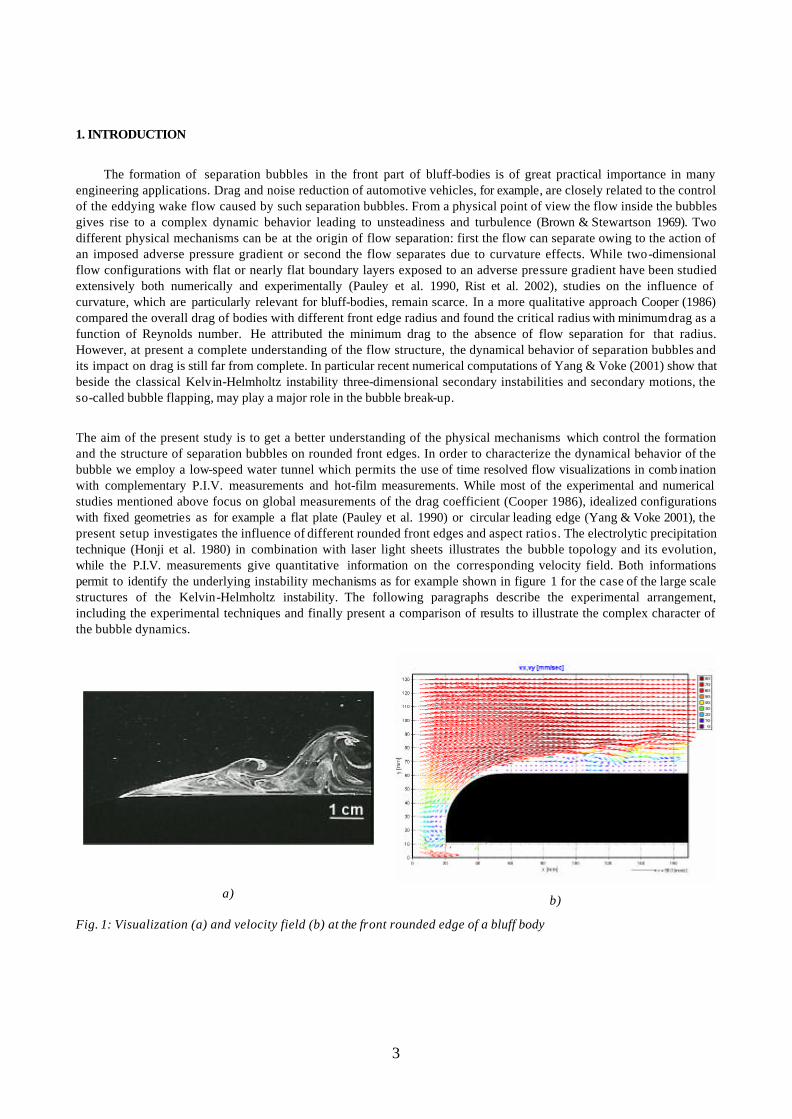
The aim of the present study is to get a better understanding of the physical mechanisms which control the formation and the structure of separation bubbles on rounded front edges. In order to characterize the dynamical behavior of the bubble we employ a low-speed water tunnel which permits the use of time resolved flow visualizations in comb ination with complementary P.I.V. measurements and hot-film measurements. While most of the experimental and numerical studies mentioned above focus on global measurements of the drag coefficient (Cooper 1986), idealized configurations with fixed geometries as for example a flat plate (Pauley et al. 1990) or circular leading edge (Yang & Voke 2001), the present setup investigates the influence of different rounded front edges and aspect ratios. The electrolytic precipitation technique (Honji et al. 1980) in combination with laser light sheets illustrates the bubble topology and its evolution, while the P.I.V. measurements give quantitative information on the corresponding velocity field. Both informations permit to identify the underlying instability mechanisms as for example shown in figure 1 for the case of the large scale structures of the Kelvin-Helmholtz instability. The following paragraphs describe the experimental arrangement, including the experimental techniques and finally present a comparison of results to illustrate the complex character of the bubble dynamics.
a)
b)
Fig. 1: Visualization (a) and velocity field (b) at the front rounded edge of a bluff body

4
2. EXPERIMENTAL ARRANGEMENT
2.1 The low-speed water tunnel
Figure 2 shows a schematic diagram of the low-speed water tunnel used in this study. The tunnel is especially designed for flow visualizations purposes. The test-section has a rectangular cross-section of 0.5 x 0.25 m² over a length of 1 m with a free surface. In the present study the flow velocity U8 varies between 0.03 to 0.3 m/s. The homogeneity and steadiness of the flow inside the test bed is achieved by filters and a convergent nozzle with a contraction ratio of 9. All surfaces of the test-section are made of clear prespex. Due to the special arrangement of the tunnel, observations can be made either through the lateral side-walls, from above through the free surface or from behind in the upstream direction.
Fig. 2: Schematic diagram of the low-speed water tunnel. The model can be observed through the lateral side-walls, from above and from behind
2.2 Geometry of the flow configuration
The geometry of the flow configuration is shown in figure 3. Different half-models with variable front edge radius R and variable frontal cross section (height H x width L) are investigated. In some experiments lateral side-walls were added to analyze the influence of lateral boundary conditions on the separation bubbles .
MODEL
HLR
Optional side walls
Fig. 3: Geometry of the model with front edge radius R, height H, width L
For given boundary conditions the flow depends on three non-dimensional parameters: the non-dimensional radius of the rounded front-edge η = R / H, the aspect ratio of the frontal section of the model Λ = L / H and the Reynolds number based on the model height H and the free stream velocity Re = H·U8 / ν, where ν represents the kinematic viscosity of the working fluid. Configurations with the non-dimensional radius η between 0 and 0.8 and aspect ratios Λ between 1 and 8.8 were studied. The Reynolds number varied between O(103) and O(104).
As shown in figure 4 the model was fixed on a flat separated ground plate 2.5 cm above the tunnel wall. In this way the boundary layer along the low tunnel wall did not influence the flow around the model. To avoid flow separation of the

5
boundary layer directly upstream the model, a gap of 2.5 mm was left between the ground plate and the model. Due to the existence of this small suction tunnel the position of the stagnation point can be controlled and adjusted according to visualizations obtained with the hydrogen bubble technique as described in the next section.
MAIN FLOW
LASER LIGHT SHEETSMODEL
VIEW IN THEUPSTREAMDIRECTION
ELEVATED GROUND PLANESIDE VIEW
VIEW FROM ABOVE
DISTANCE HOLDER
lr
Fig. 4: Experimental arrangement. Observations are possible through the side walls of the tunnel or from behind in the upstream direction. The model is fixed outside the boundary layer of the working section, 2.5 cm above the tunnel wall
2.3 Experimental techniques
Three different complementary visualization techniques are used to analyse the separation bubbles:
- The hydrogen bubble technique (Schraub et al. 1965) was used to illustrate the flow structure outside the bubble. A stainless steel wire of 0.05 mm diameter was used as cathode while a stainless steel plate fixed on the channel wall served as anode. When applying a tension between 10 and 60 V hydrogen bubbles form on the cathode and are convected with the flow. Although difficult to use in regions where the velocity decreases below the order of mm/s, this technique has the advantage that the bubbles dissolve in a few seconds. By using an electronic relay the hydrogen bubbles could be pulsed to produce timelines which illustrate the velocity profile. Figure 5 shows examples obtained with this technique. In both cases the flow was illuminated by a line of three 50 Watt halogen lamps with 10° divergence.
We used either continuous emission of hydrogen bubbles to control the position of the stagnation point on the front edge of the body (Fig. 5a) or pulsed emission to study the velocity profile near the model wall (Fig. 5b). The streaklines are recorded with a standard SONY video camera recorder (CCD-TR3200E) at 25 frames per second and the timelines with a 2560 x 1920 pixels MINOLTA DIMAGE 7.
a)
b)
Fig. 5: Examples of the use of hydrogen bubbles technique
a) Position of the stagnation point (η = 0.8, Λ = 1.0, Re = 3500). The hydrogen bubbles emission is continuous from a “zigzag shaped” wire
b) Velocity profile near the wall for the configuration “η = 0.8, Λ = 2.2, Re = 3500”. The hydrogen bubbles emission is pulsed at 30 Hz

6
- The electrolytic precipitation of tin (Honji et al. 1980) was principally used to observe the position of the separation line and the limitations of the separation bubble. The tracer was emitted from a 0.1 mm thick and 5 mm large tin band which was fixed on the model surface, inside the separation bubble. By the action of the wall shear stress the white tracer produced by the electrolyse was convected along the model surface until the separation line, where it leaves the wall and penetrates into the interior of the flow. Side views of the separation bubble were obtained by illumination with laser light sheets. At this end a cylindrical lens expanded the light beam of a 5 Watt Argon laser in a sheet of light with about 1 mm thickness. The vertical sheet is orientated either parallel or perpendicular to the free stream velocity. The visualizations are recorded with the SONY video camera in combination with a PINACLE DV 30 Plus frame grabber. All visualizations presented in the following are done with this technique.
- P.I.V. measurements were used to obtain the instantaneous velocity fields. Since the flow velocities were only of the order of 10 cm/s, the 5 Watt Argon Laser already installed for visualizations turned out to be a sufficient light source. The flow was seeded with spores of lycopodium with diameters between 0.02 and 0.04 mm. The tracer distribution in the about 1 mm thick light sheets were recorded by 8 bit JAI CV-M1 progressive scan camera with 1024 x 1296 pixel resolution at 12 Hz. In combination with a NIKON objective with a focal distance of 105 mm, the typical dimensions of the maximal flow field length varied between 10 and 15 cm. The illumination time was regulated by an optoelectronic shutter in front of the camera. The velocity field is determined by direct cross-correlation in combination with correlation based correction (Hart 2000). Due to the low flow velocities this technique allows to obtain single-shot velocity fields at a frequency of 6 Hz. For velocities smaller than 7 cm/s this is sufficient to get a time-resolved velocity field of the flow.
For higher velocities hot-film measurements turned out to furnish a useful complementary information. The device consists of a TSI probe in combination with a DISA 56C17 CTA Bridge anemometer. Power density spectrum analysis of the signal was used to determine the frequency of vortex shedding.
3. RESULTS AND DISCUSSION
3.1 Influence of the non dimensional parameters η , Λ and Re
The influence of the non-dimensional radius η on the structure of the recirculation bubble is shown in figure 6. The visible white powder is released directly on the wall downstream of the separation line. The tracer particles progress first upstream along the wall until they reach the separation line where they leave the body. The limitation between dark and white regions marks the extensions of the separation bubble.
a) η = 0.8
c) η = 0.25
Fig. 6: Influence of the non-dimensional radius η of the rounded front edge on the structure of the separation zone at Re = 3500 and Λ = 2.2. The separation angle decreases with increasing η
The comparison between Fig. 6a and Fig. 6b clearly shows that the separation angle increases with decreasing η. Moreover, for η = 0.8, the bubble seems to reattach. The corresponding measurements of the separation angle are shown in figure 7. The evolution of the angle γ taken between the separation line and the surface tangent is drawn as a function of the Reynolds numbers (between 1750 and 12500) for η = 0.8 (with Λ = 2.2 and Λ = 8.8) and η = 0.25 (with Λ = 2.2).
γ decreases with increasing Reynolds number. In the theoretical very high Reynolds number limit the separation angle should tend to zero. This evolution is more rapid for smaller aspect ratios.

7
Evolution of the separation angle γ
y = 243,88x-0,336
R2 = 0,9727
y = 736,12x-0,4277
R2 = 0,9339
y = 403,83x-0,4149
R2 = 0,9767
0
5
10
15
20
25
30
35
0 1000 2000 3000 4000 5000 6000 7000 8000 9000 10000 11000 12000 13000 14000
Re
γ (°
)
η=0.8, Λ=2.2 η=0.25, Λ=2.2 η=0.8, Λ=8.8
Fig. 7: Evolution of the separation angle γ defined between the separation line and the model’s tangent as a function of Re and of the model’s geometry
Moreover if we compare the configurations Λ = 2.2 and Λ = 8.8 for the same radius η = 0.8 (see figure 7), it appears that the aspect ratio Λ also influences the separation angle γ: In fact, for the small aspect ratio, boundary conditions have a strong influence on the separation bubble. The lower the aspect ratio is, the closer the two separation foci are as shown in figure 8. The 3-dimensional effects become more important with secondary flow.
Foci of separation
Λ = 2.2 Λ = 8.8
Fig. 8: Influence of the aspect ratio Λ on the structure of the bubble break-up at η = 0.8 and Re = 1750. The foci are closer for lower aspect ratio and strongly influence the bubble break-up length
In figure 8 it appears clearly that the bubble break-up length decreases with increasing Λ. The interaction between the two foci leads to a motion of lateral flapping of the bubble and a periodical ejection of large vortices in the bubble wake. This motion is described in section 3.3 in more details .
3.2 Appearance of the separation bubble
The scenario of the bubble break-up appears to be always the same: first the separation bubble is laminar, steady; further downstream the velocity differences between the flow inside and outside the bubble lead to the formation of a shear layer which becomes unstable with the formation of discrete Kelvin-Helmholtz vortices. Figure 9 shows visualizations for Λ = 2.2, Re = 1750 and respectively η = 0.8 (a) and η = 0.8 (b), and the corresponding velocity fields. For both configurations an example of the velocity profile in a vertical section where the separation bubble is still laminar is plot.

8
Visualizations
Velocity fields
Configuration η = 0.8, Λ = 2.2, Re = 1750Velocity profile for x/H = 1.3
60
70
80
90
100
110
120
130
140
-10 0 10 20 30 40
Vx (mm/s)
y (m
m)
Configuration η = 0.0, Λ = 2.2, Re = 1750Velocity profile for x/H = 0.44
60
70
80
90
100
110
120
130
140
-10 0 10 20 30 40
Vx (mm/s)
y (m
m)
Velocity profiles
a) η = 0.8 b) η = 0.0 Fig. 9: Influence of the non-dimensional radius η of the rounded front edge on the structure of the separation zone at
Re = 1750 and Λ = 2.2: visualizations and associated velocity fields
The velocities inside the bubble are about 5 times smaller than the free stream velocity. This high velocity gradient along the bubble limitations makes instantaneous measurements of the whole velocity field with P.I.V. measurements difficult. Nevertheless, the measurements clearly show that the growth rate of the Kelvin-Helmholtz instabilities increases with decreasing non-dimensional curvature. The velocity field inside the bubble is rather complicated with the formation of numerous eddies leading to unsteadiness and fluctuating break-up lengths of the bubble. The white powder inside the

9
laminar separation bubble in figure 8 (Visualizations) indicates that there are strong three-dimensional effects. Details of the break-up mechanisms become evident when looking from behind in the upstream direction as done in section 3.3.
In further studies the analysis of those velocity profiles will also give us the dynamics of the vortex shedding with the determination of the Kelvin-Helmholtz frequency (for frequency less than 3 Hz). Until now we have two methods to determine this frequency: the visualizations and hot-film measurements. The diagram in figure 10 compares the frequencies found with those 2 methods for the configuration “η = 0.8, Λ = 2.2” at a Reynolds number of 1750.
Λ = 2.2 ; η = 08 - Kelvin-Helmholtz vorticies frequency (really ?) evolution as a function of Re
0.1
1
10
100
1000 10000 100000
Re
f
Hot-film measurements strange frequency (bubble flapping) Visualizations
Fig. 10: Measurements of the Kelvin-Helmholtz vortices frequency as a function of Re for the configuration η = 0.8,
Λ = 2.2 with two methods: by using a hot-film probe and by visualizations
Both methods give the same results, except for Re = 1750. The frequency found with the visualisations is twice as large: the Kelvin-Helmholtz vortices frequency determined by the visualisations is about 0.53 Hz (periodicity of about 2 s) whereas the signal measured by the hot-film probe has a frequency of 0.23 Hz (periodicity of about 4 s). The visualizations in the downstream direction show that the bubble has a low frequency flapping motion, and it’s this flapping which is measured by the hot-film probe. This underlines the necessity of visualizations to understand clearly the phenomena studied! We are now going to describe the bubble flapping and its break-up.
3.3 Analyze of the bubble break-up
The width of the separation bubble exerts a strong influence on the separation. First we have seen in section 3.1 the influence of the aspect ratio on the separation angle. And then the comparison between hot-film measurements and visualizations pointed out a low-frequency motion in the bubble dynamics which is different from the Kelvin-Helmholtz vortex shedding frequency. Figures 10(a)&(b) compare the evolution of the bubble structure with increasing distance x/H from the leading edge for Λ = 8.8 and Λ = 2.2 respectively (with the same radius η = 0.8). In figure 10(a) with the large aspect ratio the bubble break-up begins at x/H = 3 with the onset of two-dimensional Kelvin-Helmholtz vortices. Further downstream at x/H = 4.2 mushroom-like longitudinal vortices mark the onset of three-dimensional instabilities. With smaller aspect ratios, shown in figure 10(b), the transition to three-dimensional flow takes place more rapidly. The mechanism is now dominated by the interaction between periodic inflow into the bubble along its lateral limitations and periodic eruptions of fluid in the middle plane. A low frequency bubble flapping appears.

10
x/H = 1.6
x/H = 3.0
x/H = 4.2
a) ? = 8.8 b) ? = 8.8
Fig. 11: Spatial evolution of the bubble structure with increasing distance in the downstream direction for Re = 1900 and η = 0.8
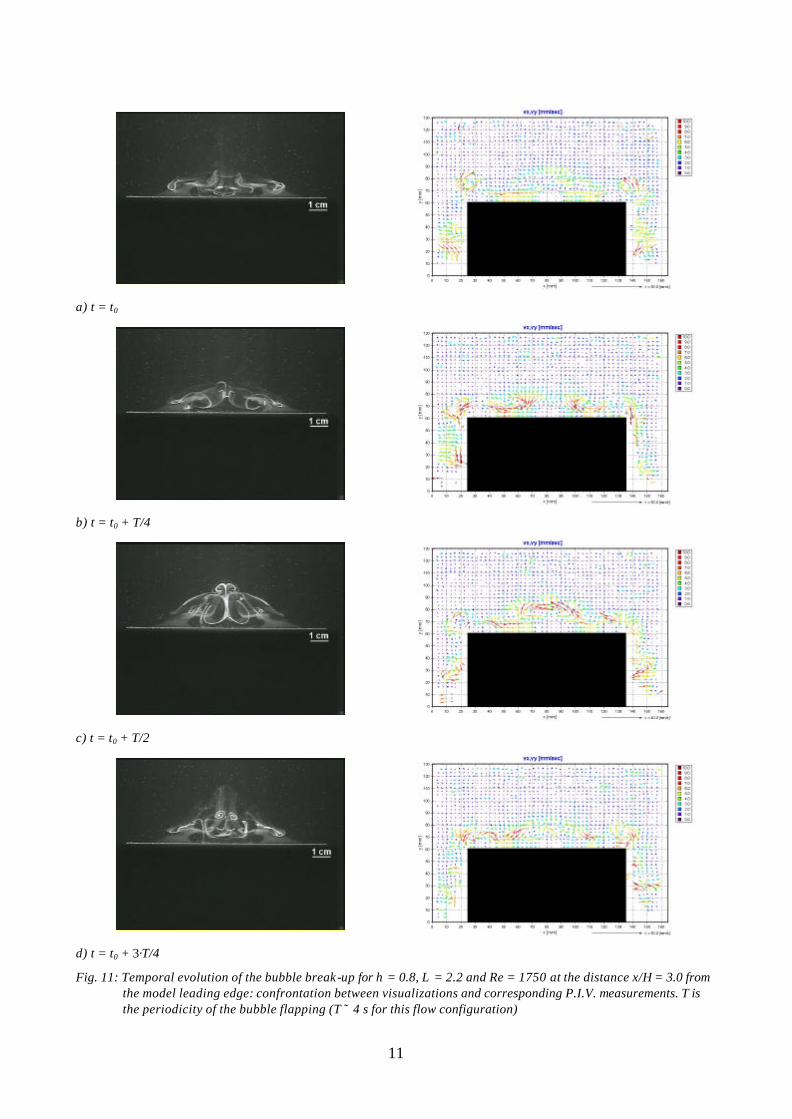
The P.I.V. measurements in figure 12 illustrate the inversion of the flow direction in the middle plane during this bubble flapping. In figure 12(b) the bubble is completely empty and fluid begins to enter the bubble from above, while in figure 12(d) the bubble is completely filled and begins to eject fluid. Since this motion is of low frequency for moderated Reynolds numbers, the time-resolved P.I.V. measurements will permit to determine the dynamics of this flapping.
4. SUMMARY
The complementary informations obtained by flow visualizations and P.I.V. measurements confirm the strong influence of curvature on the bubble structure in close agreement with interpretations of drag measurements by Cooper (1986). In addition our results highlight the influence of the bubble aspect ratio on its dynamics. For high aspect ratios the bubble break-up scenario takes place by three-dimensional instabilities in agreement with recent numerical simulations of Yang & Voke (2001). However, for small aspect ratios a new mechanism due to periodic lateral inflow into the separation bubble has been identified. It leads to a low frequency flapping of the bubble with rapid onset of three-dimensional flow and periodic ejections of fluid outside the bubble. It appears that according to the flow rate, this phenomenon play a major role. In further studies an analysis in depth of the velocity fields for example with P.O.D. may point out the vortex-shedding governing the bubble break-up.
11
a) t = t0
b) t = t0 + T/4
c) t = t0 + T/2
d) t = t0 + 3·T/4
Fig. 11: Temporal evolution of the bubble break-up for η = 0.8, Λ = 2.2 and Re = 1750 at the distance x/H = 3.0 from the model leading edge: confrontation between visualizations and corresponding P.I.V. measurements. T is the periodicity of the bubble flapping (T ˜ 4 s for this flow configuration)

12
REFERENCES
Brown S.N. & Stewartson K. “Laminar separation” in Annual Review of Fluid Mechanics, Vol. 1, pp. 45-72. (1969)
Cooper K.R. “The Effect of Front-Edge Rounding and Rear-Edge Shaping on the Aerodynamic Drag of Bluff Vehicles in Ground Proximity” in Society of Automotive Engineers Inc., pp2.727-2.757. (1986)
Hart D.P. “PIV error correction” in Exp. in Fluids, Vol. 29, pp. 13-22. (2000)
Honji H., Tandea S. & Tatsuno M. “Some practical details of the electrolytic precipitation method of flow visualisation” in Reports of the Research Institute of Applied Mechanics, XXVIII, Kyushu University, Fukuoka, Japan. (1980)
Pauley L.L., Moin P. & Reynolds W.C. “The structure of two-dimensional separation” in Journal of Fluid Mechanics, pp. 397-411. (1990)
Rist U., Maucher U. “Investigations of time-growing instabilities in laminar separation bubbles” in European Journal of Mechanics B/Fluids, Vol. 20, pp. 495-509 (2002)
Schraub F.A., Kline S.J., Henri J., Runstadler P.W.JR. & Little A. “Use of Hydrogen Bubbles for Quantitative Determination of Time-Dependent Velocity Fields in Low-Speed Water Flows” in Journal of basic Engineering, pp. 429-443. (June 1965)
Yang Z. & Voke P.R. “Large-eddy simulation of boundary-layer separation and transition at a change of surface curvature” in Journal of Fluid Mechanic, pp. 305-333. (2001)