Dynamics of Price Discovery and Indian Index Futures ...amity.edu/UserFiles/admaa/189Paper 3.pdf ·...
12
36 Amity Journal of Finance ADMAA Amity Journal of Finance 1(1), (36-47) ©2016 ADMAA Dynamics of Price Discovery and Indian Index Futures Market (A case of S&P CNX NIFTY) Sheetal Kapoor Ministry of Parliamentary Affairs, Parliament House, New Delhi, India (Received: 04/11/2015; Accepted: 31/03/2016) Introduction The era of globalization and integration of financial markets round the globe has necessitated the development of new financial instruments capable to deal and counteract increased market risks. This dire need for risk management paved the way for introduction and use of derivatives all over the world. With the inception of index futures on the trading bourses, the relationship between spot price index and index futures have been an area of detailed investigation. Derivatives tend to provide greater liquidity at lower transaction costs both for hedging and devising cross-market investment strategies. Specifically, futures contracts were developed as an instrument of risk transfer and price discovery as they provide a mechanism through which information about spot and futures prices gets assimilated and thereafter gets disseminated to all the players in the market mechanism. In common parlance, price discovery is the dynamic process Abstract The continuous economic expansion concurrently occurring round the world has given birth to financial innovations, both in technologies as well as products, one such being derivatives. Derivative contracts saw light of the day on Indian trading bourses in the year 2000 and ever since they have been associated with elements like volatility, price discovery etc. The present paper studies price discovery in conjunction with index futures for the Indian derivative market where S&P CNX NIFTY, the benchmark index of National Stock Exchange of India Limited and FUTIDX (the futures underlying NIFTY) have been chosen as proxy for the study. The study deploys Johansen Co-integration test, Granger Causality test to pinpoint the lead lag relationship between spot and futures market. The time frame of the study stretches from 12th June, 2000 (the day of introduction of index futures on the S&P CNX NIFTY) to 31st March, 2015. This shows that there exists a bi-directional relationship between the two set of markets under study. There are also evidences of long term relationship between the spot index (NIFTY) and futures index (FUTIDX). Keywords: Co-Integration, Index Futures, Granger Causality, Price Discovery JEL Classification: C3, C15, C5, G1 Paper Classification: Research Paper
Transcript of Dynamics of Price Discovery and Indian Index Futures ...amity.edu/UserFiles/admaa/189Paper 3.pdf ·...

36 Amity Journal of FinanceADMAA
Volume 1 Issue 1 2016AJF
Amity Journal of Finance1(1), (36-47)
©2016 ADMAA
Dynamics of Price Discovery and Indian Index Futures Market(A case of S&P CNX NIFTY)
Sheetal KapoorMinistry of Parliamentary Affairs, Parliament House, New Delhi, India
(Received: 04/11/2015; Accepted: 31/03/2016)
IntroductionThe era of globalization and integration of financial markets round the globe has necessitated
the development of new financial instruments capable to deal and counteract increased market risks. This dire need for risk management paved the way for introduction and use of derivatives all over the world. With the inception of index futures on the trading bourses, the relationship between spot price index and index futures have been an area of detailed investigation. Derivatives tend to provide greater liquidity at lower transaction costs both for hedging and devising cross-market investment strategies. Specifically, futures contracts were developed as an instrument of risk transfer and price discovery as they provide a mechanism through which information about spot and futures prices gets assimilated and thereafter gets disseminated to all the players in the market mechanism. In common parlance, price discovery is the dynamic process
AbstractThe continuous economic expansion concurrently occurring round the world has given birth to financial
innovations, both in technologies as well as products, one such being derivatives. Derivative contracts saw light of the day on Indian trading bourses in the year 2000 and ever since they have been associated with elements like volatility, price discovery etc. The present paper studies price discovery in conjunction with index futures for the Indian derivative market where S&P CNX NIFTY, the benchmark index of National Stock Exchange of India Limited and FUTIDX (the futures underlying NIFTY) have been chosen as proxy for the study. The study deploys Johansen Co-integration test, Granger Causality test to pinpoint the lead lag relationship between spot and futures market. The time frame of the study stretches from 12th June, 2000 (the day of introduction of index futures on the S&P CNX NIFTY) to 31st March, 2015. This shows that there exists a bi-directional relationship between the two set of markets under study. There are also evidences of long term relationship between the spot index (NIFTY) and futures index (FUTIDX).
Keywords: Co-Integration, Index Futures, Granger Causality, Price Discovery
JEL Classification: C3, C15, C5, G1
Paper Classification: Research Paper

37Amity Journal of Finance
Volume 1 Issue 1 2016 AJF
ADMAA
by which market prices tend to incorporate new information. The essence of price discovery function is whether or not new information is reflected in spot or futures market. On theoretical forefront, the cost-carry model clearly explains the underlying relationship between prices in cash and futures market. Any departure from the existing equilibrium between the two sets of prices is automatically corrected either by price in one or both the markets. An efficient market, not only futures market, tends to generate such prices reflecting consciously formed opinions on cash prices about the futures, but also transmits the same so as to attain equilibrium, thereby, defining price discovery.
In India, index futures were introduced as a part of financial market reforms for risk management in the year 2000 on the recommendations of L.C. Gupta Committee’s Report. Accordingly, derivatives in the form of index futures were started BSE SENSEX on 9th June, 2000 and on NSE NIFTY on 12th June, 2000; followed by other derivative products like stock futures, index options etc. Since the time of its inception, the turnover in derivative segment has been far more promising than expected. Out of the total derivatives traded, almost 99.9% of them are traded on the derivatives segment at National Stock Exchange of India Limited-there by emerging as the true representative of derivatives market of the Indian economy. India is emerging as one among the few successful developing countries, as it provides a vibrant market for exchange-traded derivatives. The turnover of derivative contracts on the bourses of NSE reached to a figure of Rs.382114.1 billion against Rs.315330 billion rupees and Rs.24 billion in the year bracket of 2012-13 and 2000-01 respectively. Not only this, the average daily turnover in the equity derivative segment at National Stock Exchange of India Limited rose from Rs.1266.4 billion in 2012-13 to Rs.1522.37 billion in 2012-13. Interestingly, the product which had just 21,635,449 contracts to its credit for the year 2004-05 has seen a mammoth rise and by the end of 2014, the number of contracts traded rose to 105,270,529, hitting a turnover of 30,852,965 million for the year 2013-14. The given figure illustrates the turnover of FUTIDX and CNX NIFTY under the period of study:
Figure 1. Turnover of NSE Index Futures vis-à-vis Total Derivatives Turnover
The study of price discovery and information flow across spot and futures market has gained much attention in the recent past and has been pivot of several empirical literatures. One school of thought opined that there exists a unidirectional relationship between the futures and spot and either of the two precedes the other in affecting prices. The other bench of scholars is of the view that there exists a bi-directional relationship between spot and futures prices. In order to analyze the same, the present study makes a serious attempt to bring to light the dynamics of price discovery in the context of Indian economy. The present study is a sincere effort to add

38 Amity Journal of FinanceADMAA
Volume 1 Issue 1 2016AJF
to the existing literature on price discovery through empirical results. Evidences on the flow of information across spot and futures market are quite mixed and thus requires unfurling of not only the nature of relationship but also direction of information flow. There is an examination of linkages between the market sets and the way in which information is reflected in the futures and spot prices. Such investigation is pertinent on price discovery mechanism as these have stronger implications for traders, regulators and practitioners.
Review of LiteratureA wide body of research has been devoted to the study of market volatility in conjunction
with the trading of derivatives. But the relationship between spot and futures market has several other dimensions; one such parameter is price discovery. While some studies have revealed that spot market serves as a vehicle for price discovery, others have deemed futures market as the game changer by leading the former as it offers a basket of benefits in the form of low transaction cost, reduced risk, greater liquidity etc. In fact, the contribution of spot and futures prices have a great say in the price discovery dynamics; having greater relevance for investors, regulators and portfolio managers. The present section details out a gist of certain studies in a chronological order elucidating the increasing recognition of the phenomenon of price discovery.
Earliest study was made by Koch, Kwaller and Kosh (1987) who studied lead lag relationship between S&P 500 futures and S&P 500 index and remarked that spot prices hardly affect futures prices rather the corollary is true. Their study deployed Least Squares Regression to comment upon the minute to minute data on the prices of nearby S&P 500 futures contracts and the S&P 500 index for all the trading days during 1984 and 1985. In the context of Australian stock market, Frino, Walter and West (2000) studied the price discovery dynamics for a period of five years between 1992 and 1997 and concluded that a bi-directional set of forces counteract between the index futures and index returns under the framework of their study. Also, the analysis conducted on a year-to-year basis suggests that the extent to which the futures market lead the equity market has decreased over time and the relationship between the two markets has strengthened. In the recent study, Kim, Kim and Nam (2009) examined the intra-day relationship for the data set of Korea KOSPI 200 index options and its related spot market. The empirical results revealed that both the call and put options are efficiently led by the Korean stock market index. Tan (2002) in his study with respect to Malaysian stock market investigated the causal relationship for Malaysian stock composite index and the KLFI, i.e., the underlying futures index. Using the Hsiao’s sequential approach (HSM), Johansen co-integration test, Granger causality test, the study analyzed both short term and long run price dynamics. The study not only revealed a bi-directional relationship for the short run but there were evidences of co-integration in long run too. In the context of Indian futures market, the earliest study was that of Raju and Karande (2003) who analyzed the dynamics of price discovery using Vector Error Correction Model (VECM), Co-integration test for the Bombay Stock Exchange Index and its related futures. Though the study was based on a shorter time frame it disclosed that price discovery occurs both in spot and futures market. However, it is the futures market which leads its counterpart. One of the recent studies of the past decade by Pati and Pradhan (2009) also highlights the price discovery process at NSE. Pati and Pradhan (2009) in their study for a time span of five years examined the process of price discovery in context of S&P CNX Nifty Index Futures and its relevant spot market. With the use of tools like Johansen Co-integration test, Vector Error Correction Model, Variance Decomposition Analysis, the results pinpoint that short run unidirectional causality exists between futures to spot market. Their results also advocated the existence of a long run relationship between S&P Nifty and its related futures.

39Amity Journal of Finance
Volume 1 Issue 1 2016 AJF
ADMAA
Rajput, Kakkar, Batra and Gupta (2012) have examined the phenomenon of price discovery for a period ranging from January, 2003 to March, 2011. The study utilizes Co-integration test and VECM Model on the data set of S&P CNX Nifty and the related Index futures contracts. The results indicated that the futures price exhibit a higher pace of adjustment to the previous deviations, i.e., there is an existence of a lead lag relationship. To put it in simple terms, the study identifies a dominant role of Nifty spot which leads the relevant futures market. Kumar and Chakrapani (2007) conducted a study on the intra-day data set of 46 stocks traded on the bourses of National Stock Exchange and their respective stock futures during January 2004 to March 2007. The study identifies the role of single stock futures for the analysis of intra-day price discovery. Using the Hasbrouck methodology, the study reports a greater role of spot markets in the price discovery process thereby, dismantling the fact that futures market attract more informed investors and hence, play a major role in price discovery.
Another study of Kenourgious (2004) reveals the price discovery mechanism of the Athens futures market where by FTSE/ASE-20 and its futures counterpart is taken up for the study. The empirical results for the data set of three years pinpoint that futures are an efficient means of price discovery and attributes a dominant role to the same. Owing to the transparent and secure functioning in the FTSE/ASE-20 futures market, the futures prices leads the spot prices. The study uses the VECM and Johnasen co-integration test. The same market was further analyzed using bi-variate GARCH in the study of Floros and Vougas (2007). They, however, also included FTS/ASE 40 futures along with the FTSE/ASE-20 futures of the Athens Derivative Exchange. Existence of a long run relationship was churned out for a period of 2 years. Their results conformed to the findings of their predecessors and identified futures market as informationally more efficient, thereby, controlling the price discovery mechanism.
In the study by Debasish (2011), an empirical analysis for the data set of Nifty for a period of 8 years was conducted with respect to futures and options traded on Nifty. The results revealed that it is the futures market which leads the spot market though the impact degenerates over time. The study also revealed that the spot market is led more by the options market rather than the futures market. Apart from these, there have been several studies both in the Indian and international contexts, which have tried to study and establish the thumb rule of the lead-lag relationship between the two sets of market. Where initial studies had made use of ARMA model or some form of bi-variate GARCH, gradually the studies have started using Granger Causality and Vector Error Correction Model for establishing the relationship. Further, certain studies have also examined volatility in conjunction with price discovery. This study, however, is an improvement over others as it is based on the data set of one and a half decade i.e. fifteen years. The study does not lose its focus by combining several other dimensions associated with derivative contracts. Rather, it converges on the issue of price discovery specifically. This study is a serious attempt to analyze the short and long run dynamics of price discovery and aims to enrich the existing state of literature on empirical grounds.
Contribution of the StudyThe present study ventures to unveil the lead lag relationship existing between spot and
futures market. The study covers a total period of fifteen years with respect to near month contract. The study pinpoints pertinent implications with regard to the role of futures market and establishes the important link between the two sets of market under study. Finally, the study also highlights whether or not the futures serve the very purpose of their introduction.

40 Amity Journal of FinanceADMAA
Volume 1 Issue 1 2016AJF
Research GapIn the past, there have been several studies with regard to determination of the lead lag
relationship between spot and futures markets. Not only in the market for commodities futures, there has been ample number of empirical researches in the arena of financial futures as well. But as a matter of fact, the studies in the past have accounted for empirical findings on basis of relatively smaller time frame. While the present study stretches over a data set spanning from 12th June, 2000 (the very first day of commencement of Nifty on the bourses of NSE) to 31st March, 2015 (the recently ended financial year). Owing to such a longer time frame, the results of the present study have a broader basis and thus account for a relatively greater importance than the studies with time frame of 3-5 years. The study covers both the short run and long term behavior pattern between spot and futures market rather than any one of the issue in isolation. The result so obtained, thus, marks a great relevance for traders, regulatory bodies and practitioners.
Objective of the StudyThe study covers the index futures market of National Stock Exchange of India Limited, as
the representation of the entire index futures market of the country. The index futures market being more than a decade old offers an ample set of data, at hand, to study the dynamics of price discovery as futures contracts have prima facie role of price discovery. This study proceeds with the objective of unfurling the fact that whether futures market lead spot market or vice versa. The study also strives to find out the long term relationship latent between the two set of markets.
Research Methodology
Data of the Study The study is based on the daily closing prices of both S&P CNX NIFTY and FUTIDX. The data
spans from 12th June, 2000 (the day when index futures were introduced on CNX NIFTY) to 31st March, 2015. The data for FUTIDX has been extracted for the near month contracts. All the daily data have been taken from the official website of National Stock Exchange of India Limited.
Hypotheses of the StudyThe study proceeds to find the viability of the following sets of hypotheses:
H01 : There exists no short run causal relationship between spot and futures market.
Also,
H02 : Futures prices do not lead spot prices.
MethodologyThe study uses daily data of spot and futures prices to detail the relation between the spot and
futures market. The daily log returns is calculated by using the following:
Rt = Log (Pt /Pt-1)
Where
Rt is the daily log return
Pt is the closing price on day t

41Amity Journal of Finance
Volume 1 Issue 1 2016 AJF
ADMAA
Pt-1 is the closing price on t-1
Where t= 1, 2, 3….. n days
After computation of daily log return, the basic descriptive statistics are calculated to have an initial insight about the time series data. The Jarque-Bera test rejects the assumption of the data being normal. Another preliminary exercise for the econometric analysis is the testing for stationarity and co-integration.
The Augmented-Dickey Fuller test is then deployed to find out whether the series is stationary i.e., the presence of unit root. As such, the simple unit root test is appropriate only if the series at hand is of an AR (1) type. But ADF test is deemed for series with higher- order correlation. Once the series are found to be non-stationery, the series is differentiated for the first difference. It is indicative of the fact that both futures and spot market may have co-integration between each other in long run.
Further, Johansen Co-integration test is deployed to find out whether or not co-integration exists between the spot and futures prices. A long run relationship is indicative of the fact that the variables move together over time so that disturbances owing to short term relationship are corrected from the long term trends. The Johansen Co-integration test, as given by Johansen (1988) helps to determine the number of co-integration equations, as per multi-variate approach.
Moreover, one cannot discard the causal relationship of the short run while studying the dynamics of price discovery. Granger (1969) gave a bi-variate framework where standard F-test is set to determine the causal relationship between variables. It is pertinent here to mention that the lag length determination for both Granger Causality and VAR estimation has been ascertained using Schwartz Criterion. In order to determine the long run relationship existent between spot and futures markets, the Vector Error Correction Model is deployed. The following equations represent the VECM approach:-
∆Yt= ϑ1 αt-1 + lagged (∆Y,∆X)+ε1t
∆Xt= ϑ2 αt-1+lagged (∆Y,∆X)+ε2t
Where
|ϑ1 | + |ϑ2 | ≠ 0
Also,
αt-1 → error lagged one period derived from the co-integrating regression.
Further, Vector Error Correction Model incorporates the lag terms of short run as an adjustment factor for long run equilibrium. In addition to this, Vector Error Correction Model also quantifies the relative magnitude of adjustment occurring between the two markets in an attempt to attain equilibrium. The next section of the study presents the empirical results as per the above detailed research methodology.
Empirical ResultsThe present section details the empirical results after different statistical operations are
carried out on the data set. The preliminary exercise of gathering information about the basic characteristics of the time series is achieved by calculation of descriptive statistics portrayed in Table 1.
42 Amity Journal of FinanceADMAA
Volume 1 Issue 1 2016AJF
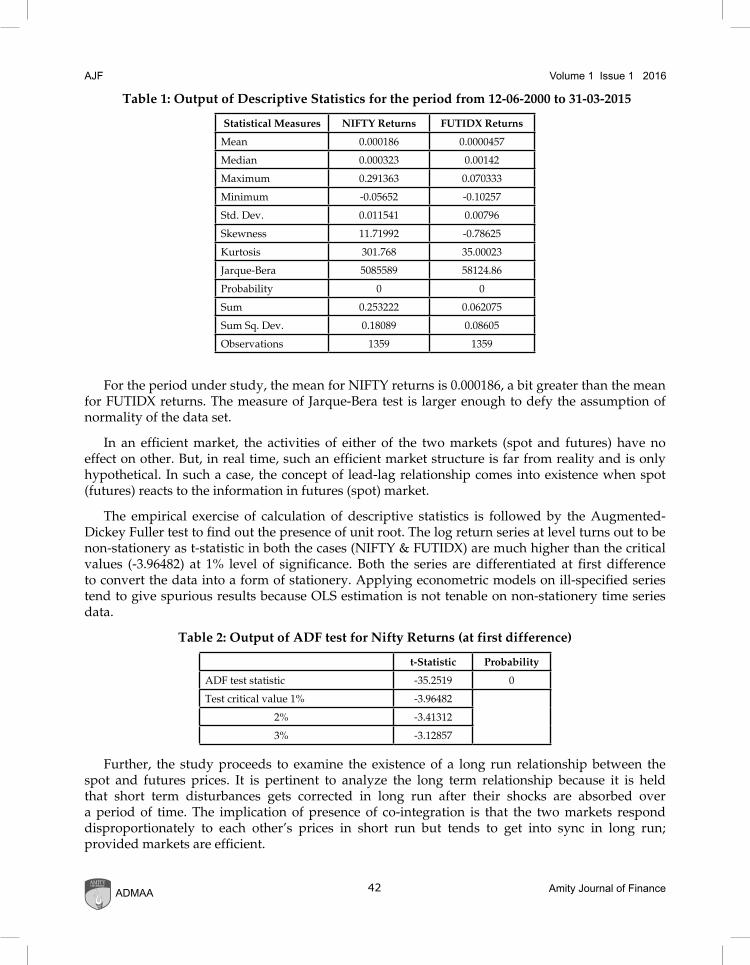
Table 1: Output of Descriptive Statistics for the period from 12-06-2000 to 31-03-2015
Statistical Measures NIFTY Returns FUTIDX Returns
Mean 0.000186 0.0000457
Median 0.000323 0.00142
Maximum 0.291363 0.070333
Minimum -0.05652 -0.10257
Std. Dev. 0.011541 0.00796
Skewness 11.71992 -0.78625
Kurtosis 301.768 35.00023
Jarque-Bera 5085589 58124.86
Probability 0 0
Sum 0.253222 0.062075
Sum Sq. Dev. 0.18089 0.08605
Observations 1359 1359
For the period under study, the mean for NIFTY returns is 0.000186, a bit greater than the mean for FUTIDX returns. The measure of Jarque-Bera test is larger enough to defy the assumption of normality of the data set.
In an efficient market, the activities of either of the two markets (spot and futures) have no effect on other. But, in real time, such an efficient market structure is far from reality and is only hypothetical. In such a case, the concept of lead-lag relationship comes into existence when spot (futures) reacts to the information in futures (spot) market.
The empirical exercise of calculation of descriptive statistics is followed by the Augmented-Dickey Fuller test to find out the presence of unit root. The log return series at level turns out to be non-stationery as t-statistic in both the cases (NIFTY & FUTIDX) are much higher than the critical values (-3.96482) at 1% level of significance. Both the series are differentiated at first difference to convert the data into a form of stationery. Applying econometric models on ill-specified series tend to give spurious results because OLS estimation is not tenable on non-stationery time series data.
Table 2: Output of ADF test for Nifty Returns (at first difference)
t-Statistic Probability
ADF test statistic -35.2519 0
Test critical value 1% -3.96482
2% -3.41312
3% -3.12857
Further, the study proceeds to examine the existence of a long run relationship between the spot and futures prices. It is pertinent to analyze the long term relationship because it is held that short term disturbances gets corrected in long run after their shocks are absorbed over a period of time. The implication of presence of co-integration is that the two markets respond disproportionately to each other’s prices in short run but tends to get into sync in long run; provided markets are efficient.

43Amity Journal of Finance
Volume 1 Issue 1 2016 AJF
ADMAA
Table 3: Output of ADF test for FUTIDX Returns (at first difference)
t-Statistic Probability
ADF test statistic -37.4539 0
Test critical value 1% -3.96482
2% -3.41312
3% -3.12857
Table 4: Output of Johansen Co-Integration Test
No. of Co-integrating Equations
Eigen value Trace Statistic Critical Value (at 5%) Probability
None 0.180783 520.343 15.49471 0.0001
At most 1 0.168808 250.3467 3.841466 0
Table 4 provides the results of Johansen Co-integration test. The null hypothesis is rejected thus pinpointing that there exists two co-integration equations between spot and futures prices. Ahead of Johansen Co-integration test, the VAR estimation is conducted with a lag length structure as specified by Schwartz Criterion.
Moreover, the ground for estimating Vector Error Correction Model is that the markets under study play an important role in price discovery process. Table 5 presents the empirical statistics of Vector Error Correction Model.
Table 5: Output of Vector Error Correction Model (VECM)
Error Correction: D(NIFTY_R) D(FUTIDX_R)
CointEq1 -0.826496 0.275457
-0.0426 -0.03182
[-19.4022] [ 8.65639]
D(NIFTY_R(-1)) -0.070544 -0.182563
-0.03565 -0.02663
[-1.97889] [-6.85569]
D(NIFTY_R(-2)) -0.076299 -0.106005
-0.02674 -0.01998
[-2.85320] [-5.30653]
D(FUTIDX_R(-1)) -0.460615 -0.545208
-0.04069 -0.0304
[-11.3187] [-17.9347]
D(FUTIDX_R(-2)) -0.230302 -0.304128
-0.03502 -0.02616
[-6.57583] [-11.6247]
C 9.34E-06 -6.53E-06
-0.00032 -0.00024
[ 0.02911] [-0.02724]
`

44 Amity Journal of FinanceADMAA
Volume 1 Issue 1 2016AJF
Table 6: Output of Granger Causality Test
Null Hypothesis Observations F-Statistic Probability
NIFTY returns do not Granger Cause FUTIDX returns 1357 0.12298 0.008843
FUTIDX returns do not Granger Cause NIFTY returns 1.69104 0.1847
After estimating the presence and nature of long run relationship between the spot and futures prices, the study deploys Granger Causality test to check and comment on the short run causality between the two market forms. It is found that in short run, it is the spot market of NIFTY which leads/influences the futures market, FUTIDX.
DiscussionThe purpose of this research has been examination of price discovery between the benchmark
index of National Stock Exchange of India (i.e. S&P CNX Nifty) and the corresponding futures market. The justification for the introduction of index and stock futures was to minimize the level of risk and provide an efficient mechanism of price discovery, thereby, improving the market efficiency. However, the empirical findings suggest that it is not the futures market which contributes towards price discovery. Rather, the spot market leads the futures market. The results so obtained conforms the existence of long run relationship between the two sets of market, but when it comes to influencing the price discovery mechanism, the spot prices comes to the forefront and hence play a dominant, role i.e., information is first reflected in spot prices. The result of the present study is in line with the results of Thenmozhi and Thomas (2007); Kumar and Chakrapani (2007); Koch, Kwaller and Kosh (1987).
These results conform to the line of thought where changes in spot prices are attributed to trigger action on the part of different market participants, thereby, causing subsequent changes in the futures price. However, in context of Indian derivatives market, the studies in the past have revealed different indications. Studies of Raju and Karande (2003); and Pati and Pradhan (2009) are in sharp contrast to the present study in terms of impounding. This can be attributed to shorter time frame considered in these studies or the market so chosen (Bombay Stock Exchange is the market under study in the former case).
ConclusionThe study has examined the causality and price discovery for spot and futures prices in the
case of S&P CNX NIFTY. The Augmented-Dickey Fuller (ADF) test has reported both the series to be non-stationery at level and hence at first differentiation, the series are turned to be one of stationery. The empirical results of Granger-Causality test indicate that the spot prices do affect the futures prices and hence the spot market leads the futures market in the short run. A h e a d of this, the output of Johansen co-integration test suggests the presence of long run relationship dynamics between spot and futures prices. Further, the Vector Error Correction Model comes out with the results of price discovery by revealing that spot prices play a dominant role in price discovery. It is because prices of spot market tend to discover and assimilate new information faster than futures prices, i.e., spot market serves as an efficient channel of price discovery. It is, therefore, evident that spot market leads futures market. This can be traced to the amateur market for futures which is not as old as spot market and thus needs time to grow and contribute in the process of price discovery. The spot market in India is more actively traded and is thus, upheld in contrast to the market for futures. The results reveal that futures market make greater adjustments in order to re-establish the equilibrium and thus, pinpoint that spot market leads the futures

45Amity Journal of Finance
Volume 1 Issue 1 2016 AJF
ADMAA
market. No doubt, the study is based on daily closing data rather than high frequency data but still it is sufficient enough in elucidating that price discovery does occur in spot market of NIFTY index and that the spot and its counterpart are co-integrated to an extent.
Such evidences of price discovery in spot market is of great use to regulators as they can develop new policies to enable futures market to grow in a way so as to contribute in faster dissemination of new information leading to price discovery.
Limitations of the StudyThe present study tracks the relationship existing between spot and futures market during a
period of fifteen years. The study has not considered the time intervals while obtaining empirical outputs. It could be possible that owing to several financial developments, there could be different price discovery phenomenon prevalent, i.e., a set of financial data summarizes within itself a great set of changes both in market forces and policy decision. It may happen that if the data is clubbed into sets of three years on the basis of certain parameters, each period may exhibit different pattern. In other words, price discovery process in one market may exhibit “spot leading the futures price” while the other may take a reverse pattern (probability of such indication is very less). Also, the results are based on daily log returns. However, minute to minute data may be capable of altering the direction of lead-lag relationship to some extent of not significantly. However, the study reveals the lead lag relationship in the best possible way for a time frame of fifteen years and is well sufficed with a larger number of observations.
ReferencesAthanasios, V. (2010). Lead-lag relationship between futures market and spot market. Evidence from the
Greek stock and derivative market. International Journal of Finance and Economics, 41, 163-176.
Black, F. (1975). Fact and fantasy in use of options. Financial Analyst Journal, 31, 36-41.
Brooks, C., Rew, A. G., & Ritson, S. (2001). A trading strategy based on the lead-lag relationship between the spot index and futures contract for the FTSE100. International Journal of Forecasting, 17, 31-44.
Chan, K. (1993). A further analysis of the lead-lag relationship between the cash market and stock index futures market. Review of Financial Studies, 5, 123-152.
Cheung, Y. W., & Lai, K. (1993). A fractional co-integration analysis of purchasing power parity. Journal of Business and Economic Statistics, 11, 103-112.
Cornell, B., & French, K. R. (1983). Taxes and the pricing of stock index futures. The Journal of Finance, 38(3), 675-694.
Debasish, S. S. (2011). A study on relative volatility in spot and futures market in selected stock indices of NSE. Viewpoint Journal, 2(1), 5-18.
Dickey, D. A., Jansen, D. W., & Thornton, D. C. (1991). A primer on co-integration with an application to money and income. Review Federal Reserve Bank of St. Louis, 73(2), 58-78.
Dickey, D., & Fuller, W. (1979). Distribution of the estimators for autoregressive time series with a unit root. Journal of the American Statistical Association, 74(366), 427-431.
Engle, R. T., & Granger, C. W. J. (1987). Co-integration and error correction: representation, estimation and testing. Econometrica, 55, 251-276.

46 Amity Journal of FinanceADMAA
Volume 1 Issue 1 2016AJF
Finnerty, J. E., & Park, H. Y. (1987). Stock index futures: Does the tail wag the dog? A technical note. Financial Analysis Journal, 43, 57-61.
Floros, C., & Vougas, D. (2007). Lead-lag relationship between futures and spot markets in Greece: 1999 - 2001. International Research Journal of Finance and Economics, 7, 168-174.
Frino, A., Walter, T., & West, A. (2000). The lead-lag relationship between equities and stock index futures markets around information releases. The Journal of Futures Markets, 20(5), 467-487.
Garbade D., & Silber, W. L. (1983). Price movement and price discovery in futures and cash markets. Review of Economics and Statistics, 65, 289-297.
Granger, C. W. (1969). Investigating causal relations by econometric models and cross-spectral methods. Econometrica, 37, 423-438.
Gupta, K., & Singh, B. (2006). Price discovery and causality in spot and futures market in India. ICFAI Journal of Derivatives Market, 3(1), 30-41.
Herbst, A. F., McCormack, J. P., & West, E. N. (1987). Investigation of a lead-lag relationship between spot stock indices and their futures contracts. The Journal of Futures Markets, 7, 373-338.
Hernandez, M., & Torero, M. (2010). Examining the dynamic relationship between spot and future prices of agricultural commodities. IFPRI Discussion Paper 00988.
Hong, T. J. (2002). Temporal causality between the Malaysian stock Price and indexed futures market amid the selective controls regime. ASEAN Economic Bulletin, 19(2), 191-203.
Huang, R. D., & Syoll, H. R. (1994). Market microstructure and stock return predictions. Review of Financial Studies, 7, 179-213.
Johansen, S. (1988). Statistical analysis of co-integration vectors. Journal of Economic Dynamics and Control, 12, 231-254.
Johansen, S. (1991). Estimation and hypothesis testing of co-integration vectors in Gaussian vector autoregressive models. Econometrica, 59(6), 1551–1580.
Kedarnath, M., & Mishra, R. K. (2006). Lead-Lag relationship between equities and stock index futures market and its variation around information release: empirical evidence from India. NSE Working Paper No. 39, July. Retrieved from http://nseindia.com/content/research/comppaper155.pdf
Kenourgios, D. F. (2004). Price discovery in the Athens derivatives exchange: Evidence for the FTSE/ASE-20 futures market. Economic and Business Review, 6(3), 229-243.
Kim, S. K., Joon, I., Nam, S. O. (2009). The lead-lag relationship between stock index options and the stock index market: model, moneyness and news. International Journal of Managerial Finance, 5(3), 311-332.
Koch, P. D., Kawaller, I. G., & Kosh, T. W. (1987). The temporal price relationship between S&P 500 futures and the S&P 500 index. Journal of Finance, 42, 1309-1329.
Kumar, K., & Chaturvedula, C. (2013). Price leadership between spot and futures markets. Journal of Applied Finance & Banking, 3(1), 93-107.
Pati, P. C., & Pradhan, P. C. (2009). Information, price discovery and causality in the Indian stock index futures market. IUP Journal of Financial Risk Management, 3(4), 7-21.

47Amity Journal of Finance
Volume 1 Issue 1 2016 AJF
ADMAA
Pradhan, K. C., & Bhatt, K. S. (2009). An empirical analysis of price discovery, causality and forecasting in the Nifty futures markets. International Research Journal of Finance and Economics, 26, 83-92.
Rajput, N., Kakkar, R., Batra, G., & Gupta, M. (2012). Price discovery in Indian stock market: the case of S&P CNX Nifty Index. Investment Management and Financial Innovations, 9(3), 120-129.
Raju, M. T., & Karande, K. (2003). Price discovery and volatility on NSE futures market. Working Paper, Series No. 7, Securities and Exchange Board of India.
Thenmozhi, M., & Thomas, S. M. (2007). Price discovery and volatility spillovers in spot and futures markets: evidence from India. Indian Journal of Capital Market, 4(2), 1-28.
Author’s Profile
Sheetal Kapoor obtained her doctorate in the area of derivatives from Banaras Hindu University, Varanasi, India. She has to her credit fifteen research papers in international and national journals and has presented papers at several conferences at national and international levels. Her research interest includes stock market phenomenon, derivatives, merchant banking etc.