Dynamics of poverty and its drivers: Ethiopian experiences
25
Dynamics of poverty and its drivers: Ethiopian experiences Tassew Woldehanna Associate Professor of Economics (Addis Ababa University) Young Lives Principal Investigator (Ethiopian Development Research Institute, EDRI) Policies, institutions, and markets breakout session
-
Upload
independent-science-and-partnership-council-of-the-cgiar -
Category
Science
-
view
199 -
download
1
Transcript of Dynamics of poverty and its drivers: Ethiopian experiences

Dynamics of poverty and its drivers: Ethiopian experiences
Tassew WoldehannaAssociate Professor of Economics
(Addis Ababa University)
Young Lives Principal Investigator(Ethiopian Development Research Institute, EDRI)
Policies, institutions, and markets breakout session
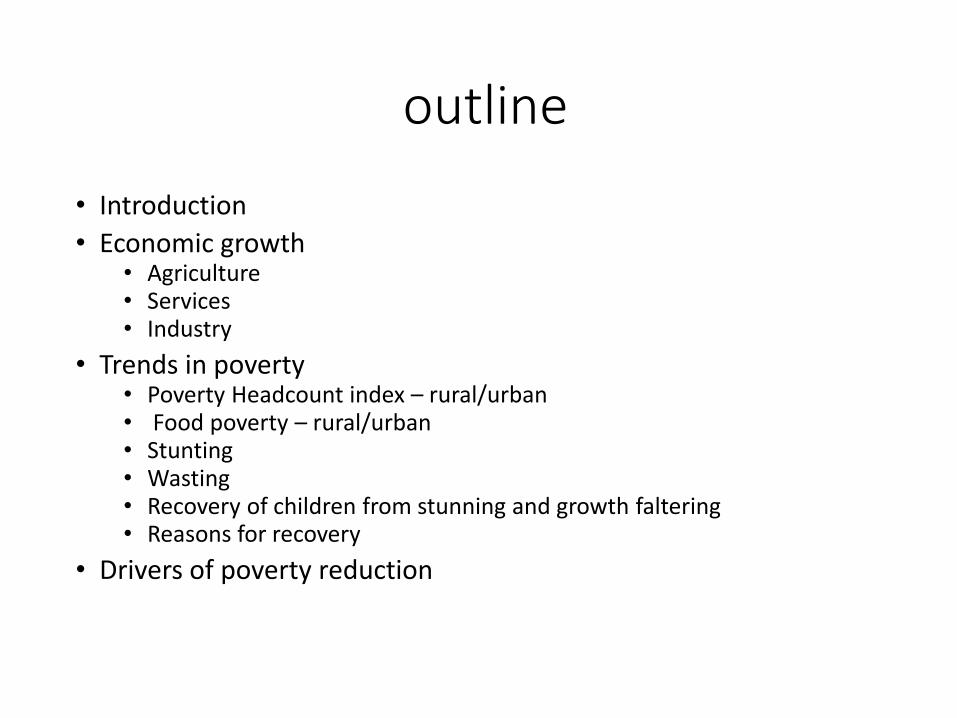
outline
• Introduction
• Economic growth • Agriculture • Services • Industry
• Trends in poverty • Poverty Headcount index – rural/urban • Food poverty – rural/urban• Stunting• Wasting • Recovery of children from stunning and growth faltering • Reasons for recovery
• Drivers of poverty reduction
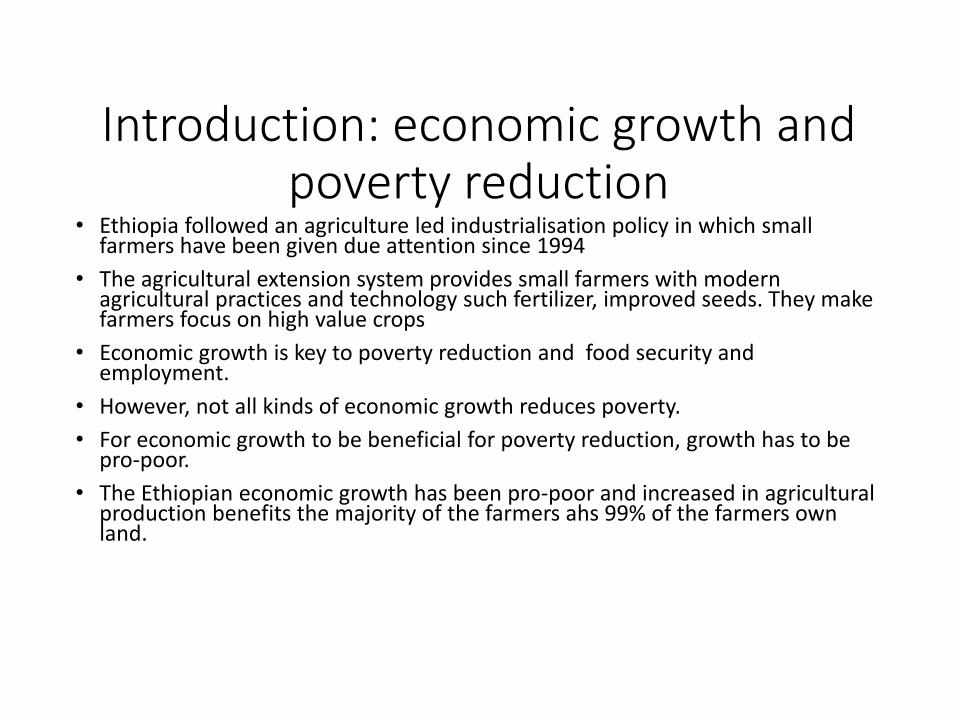
Introduction: economic growth and poverty reduction
• Ethiopia followed an agriculture led industrialisation policy in which small farmers have been given due attention since 1994
• The agricultural extension system provides small farmers with modern agricultural practices and technology such fertilizer, improved seeds. They make farmers focus on high value crops
• Economic growth is key to poverty reduction and food security and employment.
• However, not all kinds of economic growth reduces poverty.
• For economic growth to be beneficial for poverty reduction, growth has to be pro-poor.
• The Ethiopian economic growth has been pro-poor and increased in agricultural production benefits the majority of the farmers ahs 99% of the farmers own land.
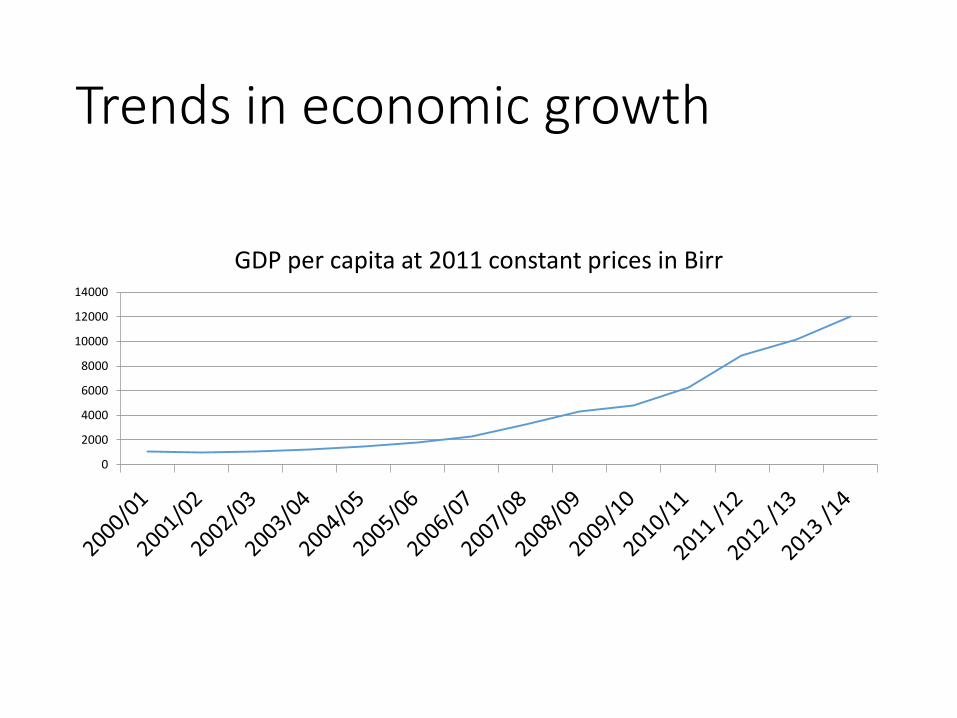
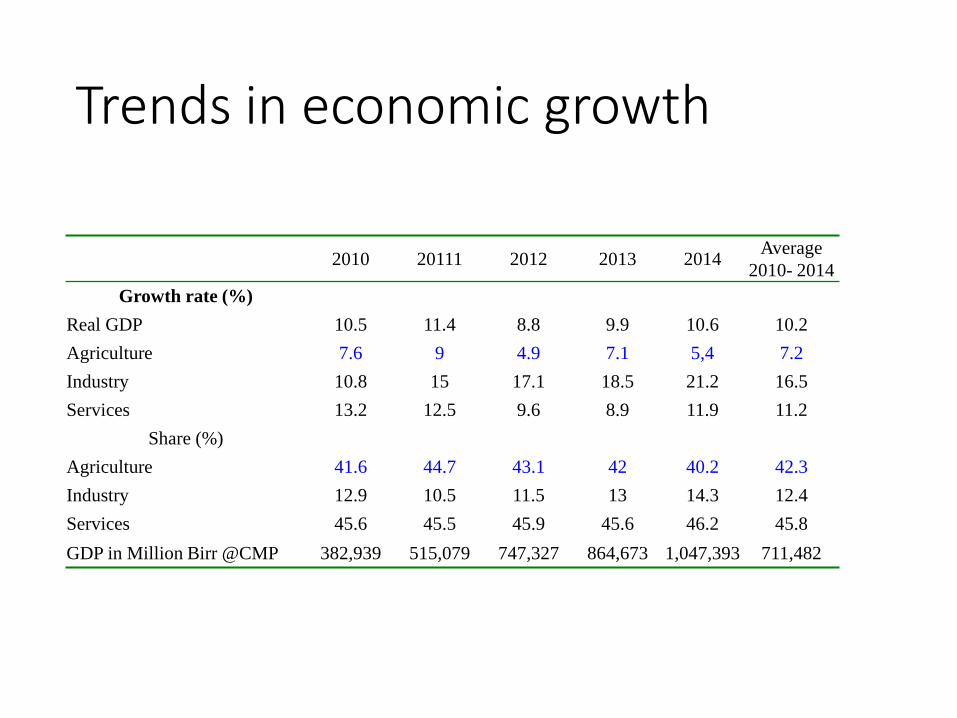
Trends in economic growth
0
2000
4000
6000
8000
10000
12000
14000
GDP per capita at 2011 constant prices in Birr
Trends in economic growth
2010 20111 2012 2013 2014Average
2010- 2014
Growth rate (%)
Real GDP 10.5 11.4 8.8 9.9 10.6 10.2
Agriculture 7.6 9 4.9 7.1 5,4 7.2
Industry 10.8 15 17.1 18.5 21.2 16.5
Services 13.2 12.5 9.6 8.9 11.9 11.2
Share (%)
Agriculture 41.6 44.7 43.1 42 40.2 42.3
Industry 12.9 10.5 11.5 13 14.3 12.4
Services 45.6 45.5 45.9 45.6 46.2 45.8
GDP in Million Birr @CMP 382,939 515,079 747,327 864,673 1,047,393 711,482
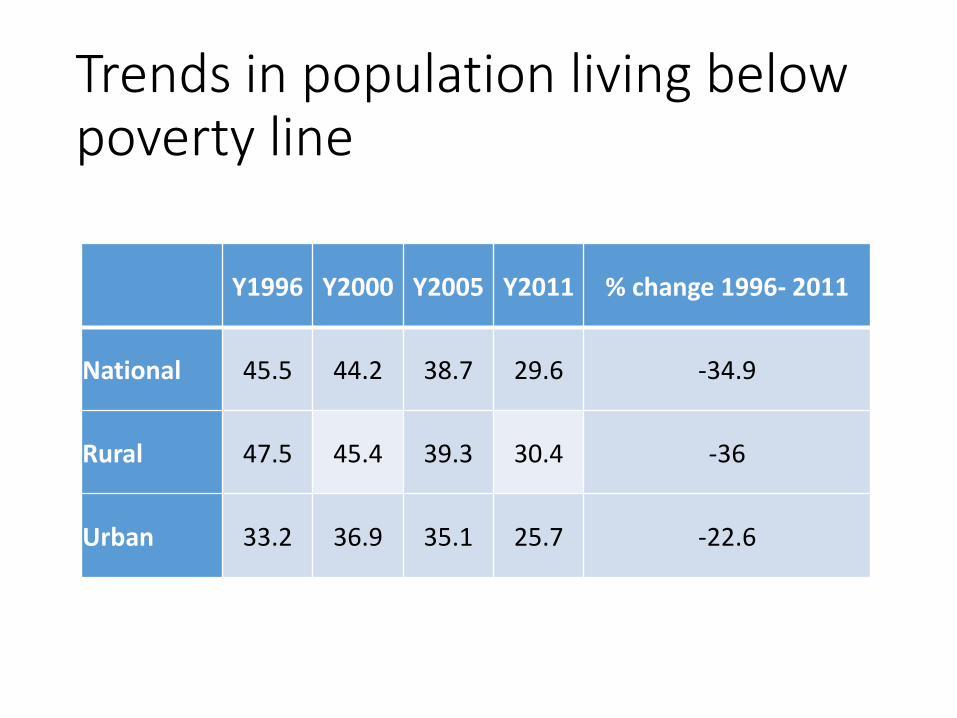
Trends in population living below poverty line
Y1996 Y2000 Y2005 Y2011 % change 1996- 2011
National 45.5 44.2 38.7 29.6 -34.9
Rural 47.5 45.4 39.3 30.4 -36
Urban 33.2 36.9 35.1 25.7 -22.6
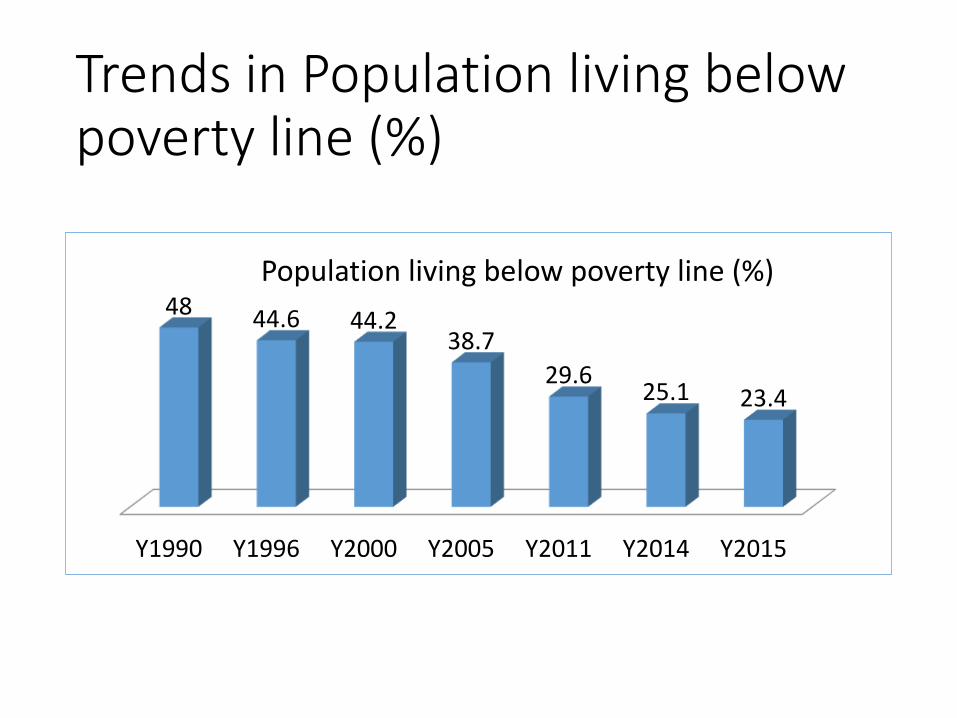
Trends in Population living below poverty line (%)
Y1990 Y1996 Y2000 Y2005 Y2011 Y2014 Y2015
48 44.6 44.238.7
29.625.1 23.4
Population living below poverty line (%)
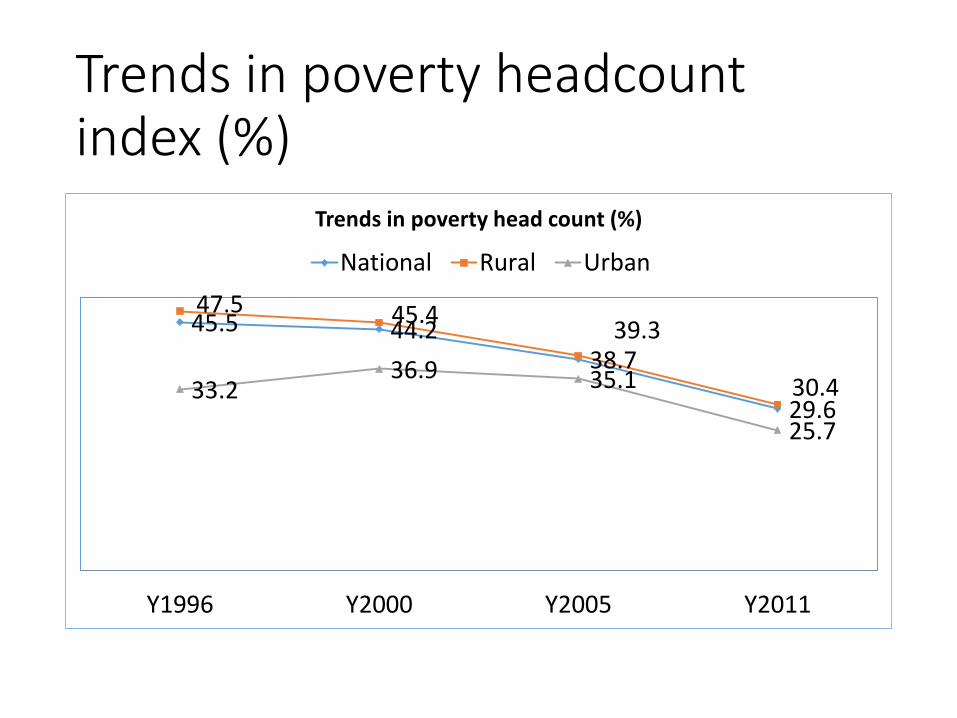
Trends in poverty headcount index (%)
45.5 44.238.7
29.6
47.5 45.439.3
30.433.236.9 35.1
25.7
Y1996 Y2000 Y2005 Y2011
Trends in poverty head count (%)
National Rural Urban
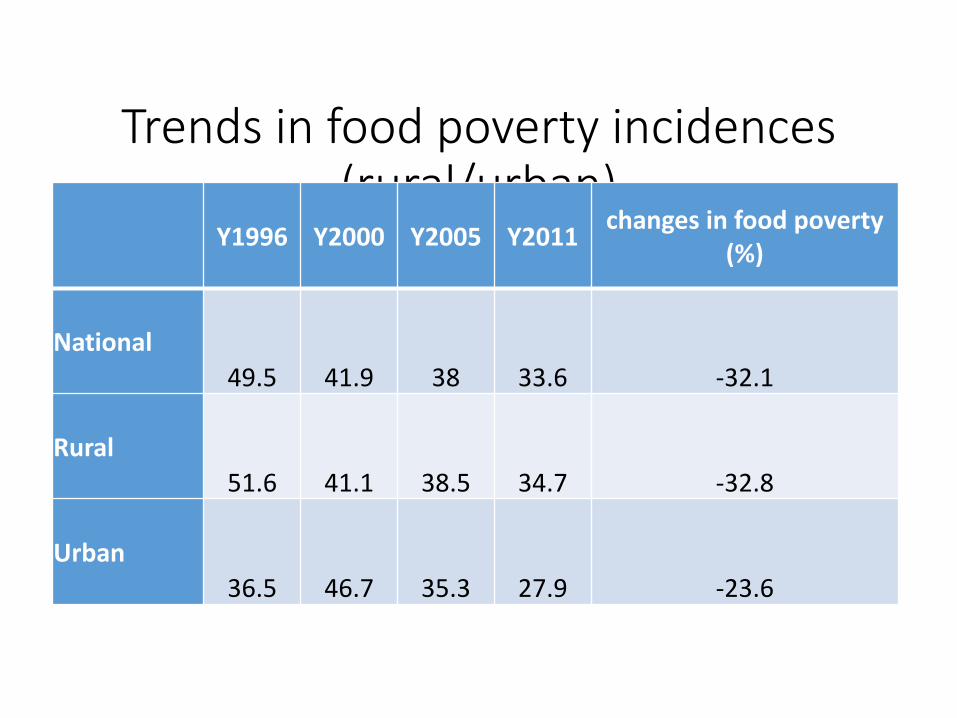
Trends in food poverty incidences (rural/urban)
Y1996 Y2000 Y2005 Y2011changes in food poverty
(%)
National
49.5 41.9 38 33.6 -32.1
Rural
51.6 41.1 38.5 34.7 -32.8
Urban
36.5 46.7 35.3 27.9 -23.6
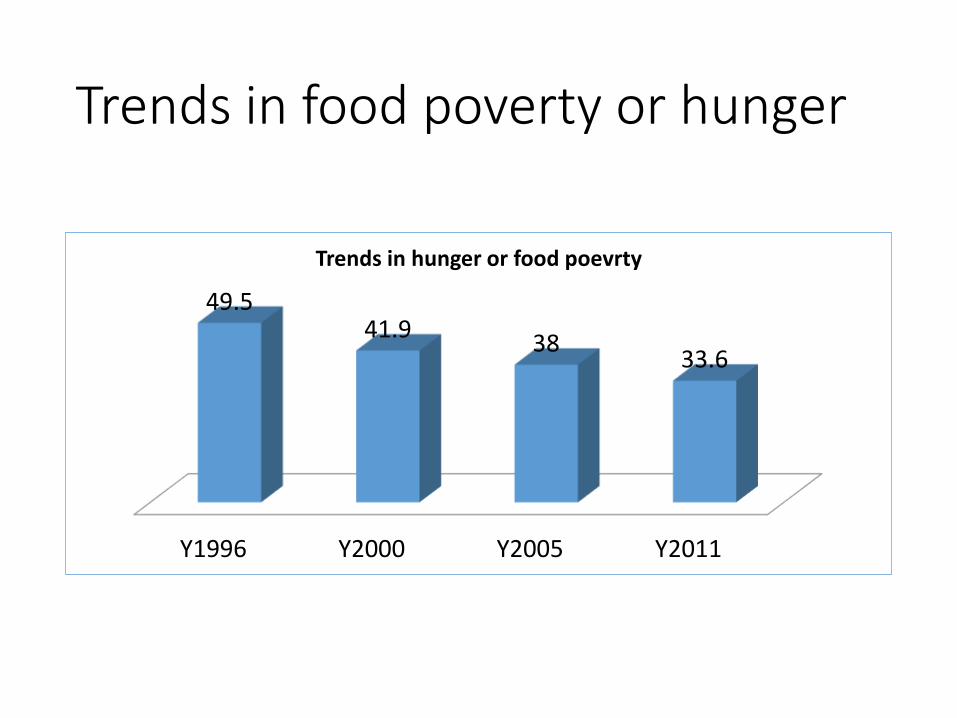
Trends in food poverty or hunger
Y1996 Y2000 Y2005 Y2011
49.541.9
3833.6
Trends in hunger or food poevrty
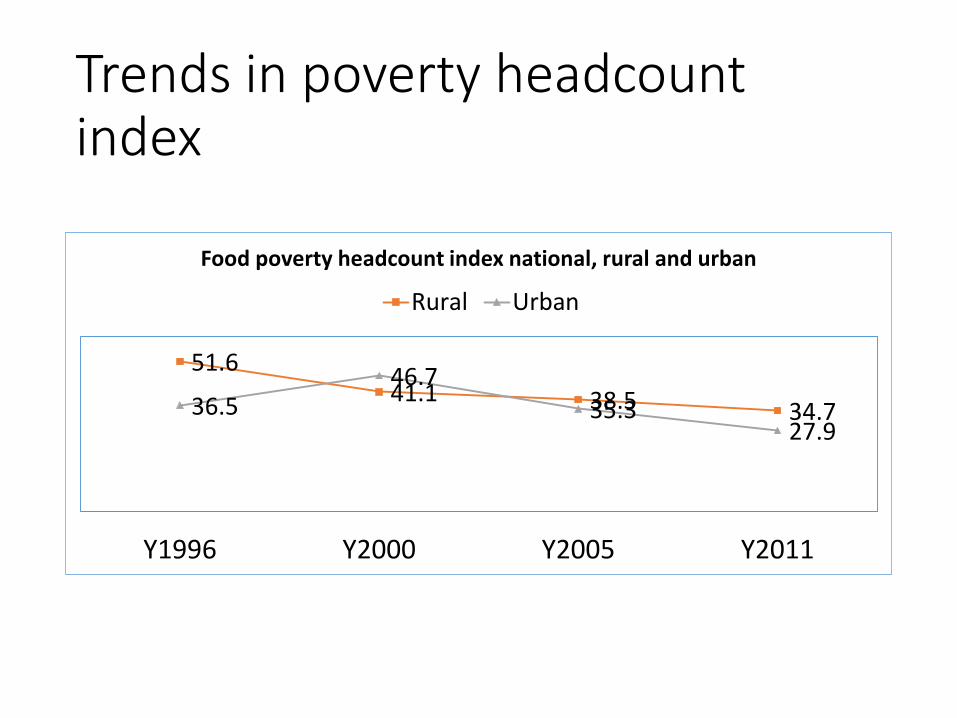
Trends in poverty headcount index
51.641.1 38.5 34.736.546.7
35.327.9
Y1996 Y2000 Y2005 Y2011
Food poverty headcount index national, rural and urban
Rural Urban
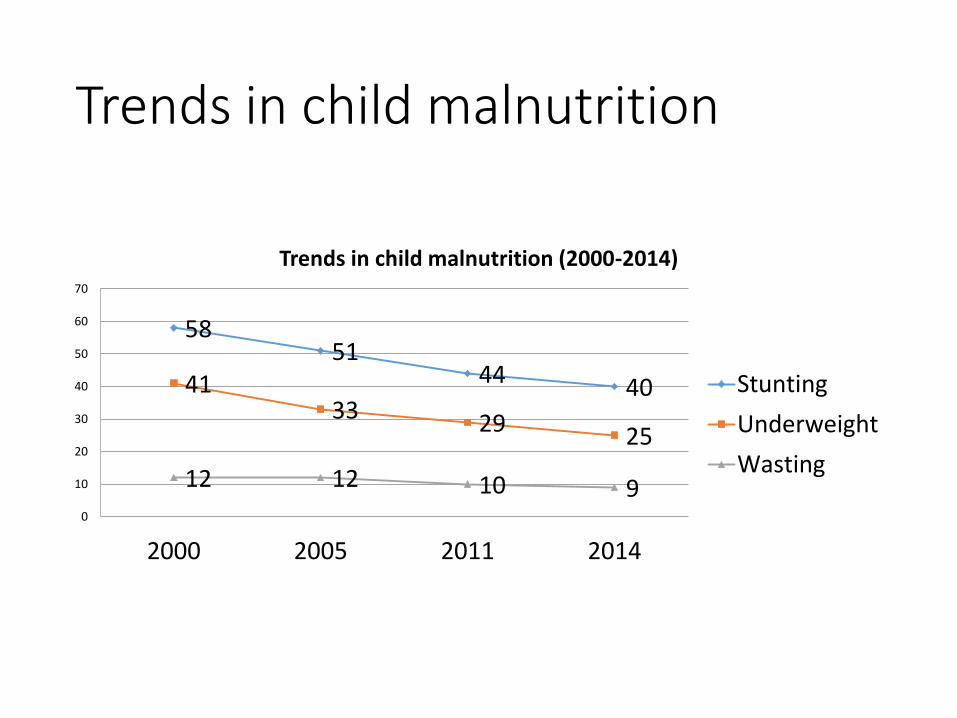
Trends in child malnutrition
5851
44 404133 29 25
12 12 10 90
10
20
30
40
50
60
70
2000 2005 2011 2014
Trends in child malnutrition (2000-2014)
Stunting
Underweight
Wasting
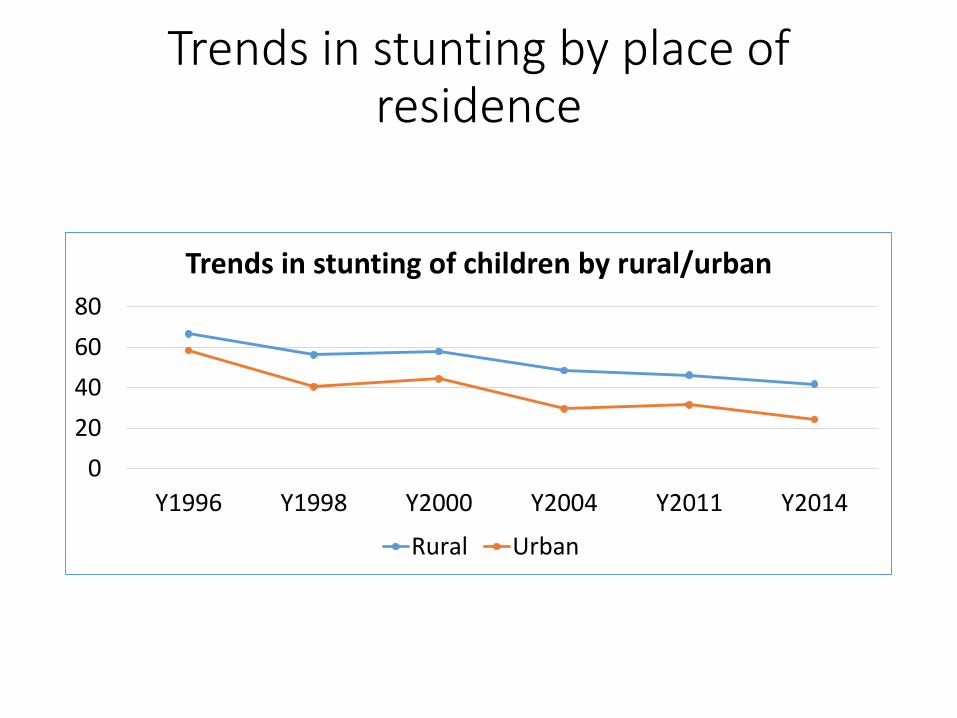
Trends in stunting by place of residence
0
20
40
60
80
Y1996 Y1998 Y2000 Y2004 Y2011 Y2014
Trends in stunting of children by rural/urban
Rural Urban
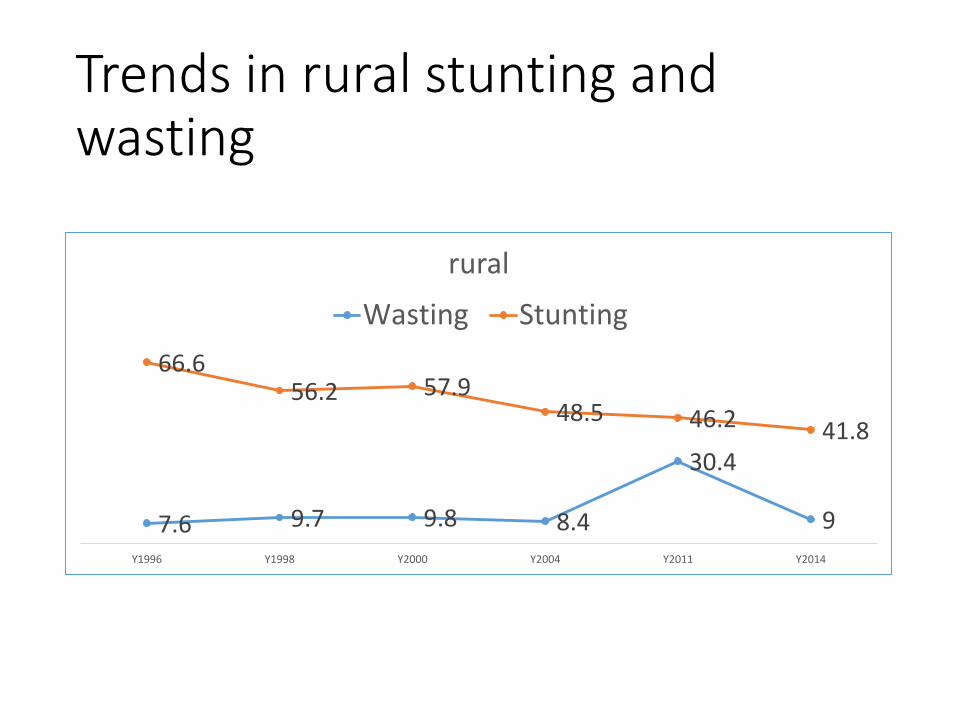
Trends in rural stunting and wasting
7.6 9.7 9.8 8.4
30.4
9
66.656.2 57.9
48.5 46.2 41.8
Y1996 Y1998 Y2000 Y2004 Y2011 Y2014
rural
Wasting Stunting
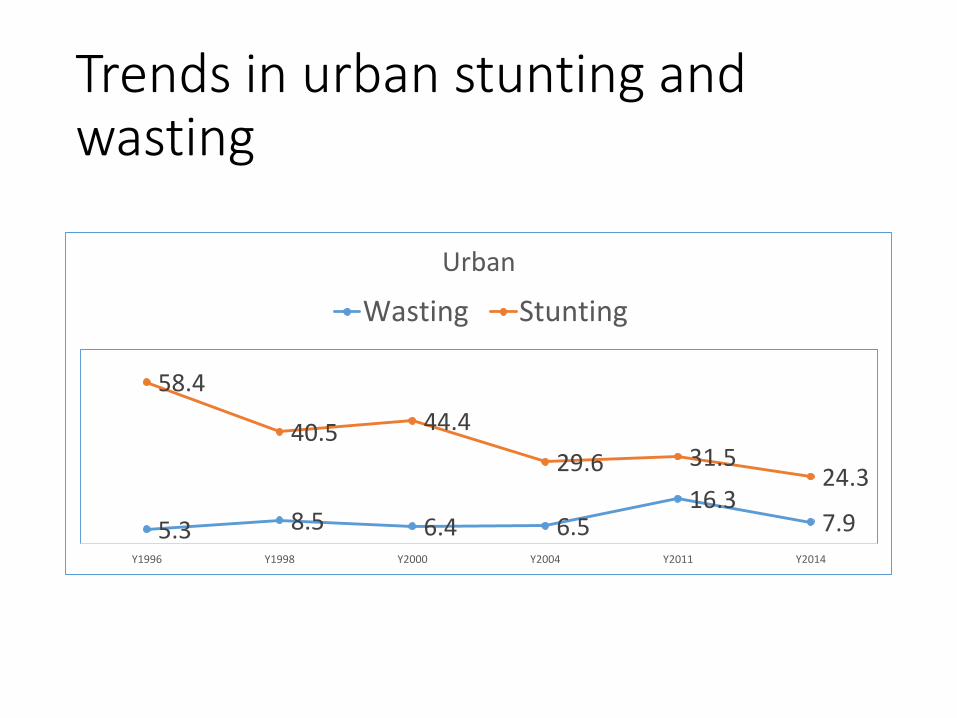
Trends in urban stunting and wasting
5.3 8.5 6.4 6.516.3
7.9
58.4
40.5 44.4
29.6 31.524.3
Y1996 Y1998 Y2000 Y2004 Y2011 Y2014
Urban
Wasting Stunting
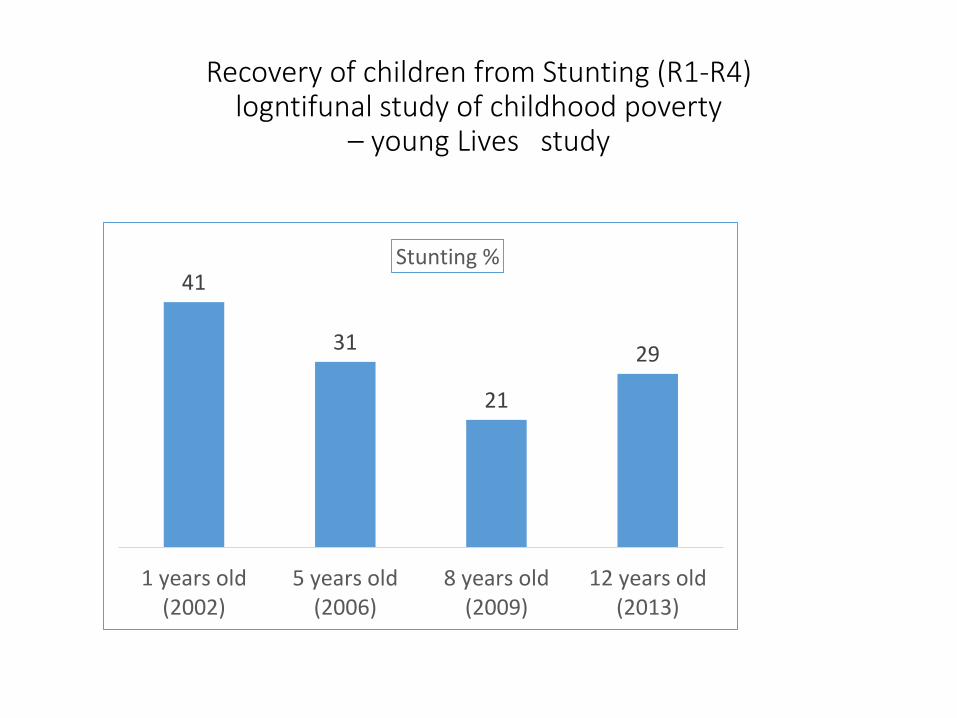
Recovery of children from Stunting (R1-R4) logntifunal study of childhood poverty
– young Lives study
41
31
21
29
1 years old(2002)
5 years old(2006)
8 years old(2009)
12 years old(2013)
Stunting %

Associates of linear growth catch-up or growth recovery • Children has recovered from their stunting, not only
within 1000 days, but after• Between 1 and 4 year• Between 5 and 8 years• Very few between 8 and 12 years
• Many factors including improved wealth, protection of people from shock, improvement in sanitation facilities, and access to health services, safety net has contributed for recover of children from stunting
• We found stunting has negative impact of on cognitive development (receptive vocabulary and maths test)
• HAZ at both 1yr, 5yr and 8yr are found to have effect on cognitive development at age 8
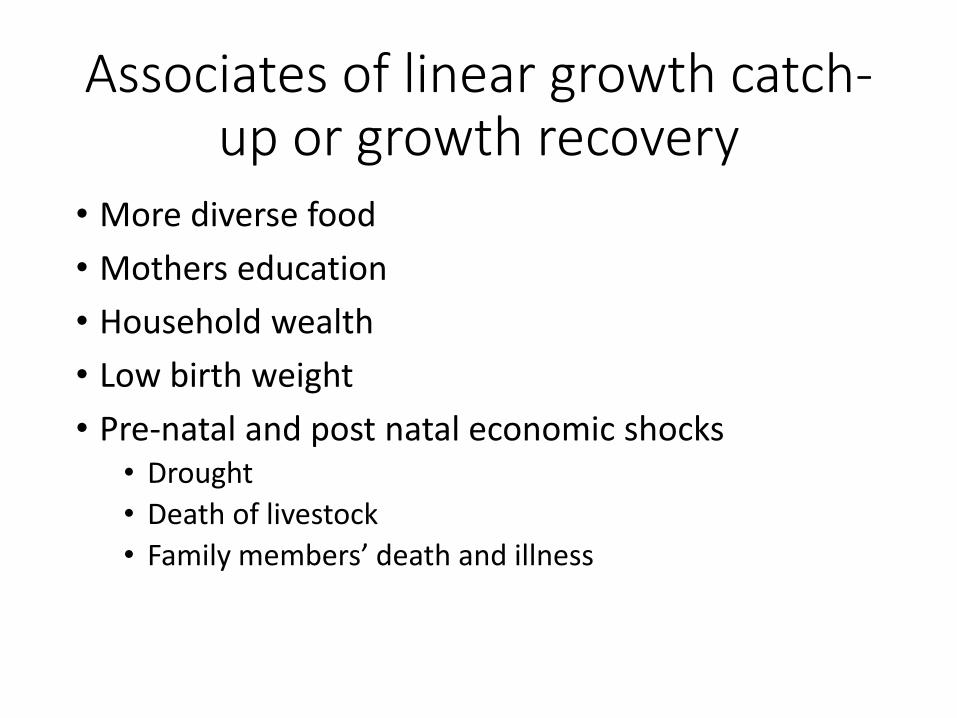
Associates of linear growth catch-up or growth recovery
• More diverse food
• Mothers education
• Household wealth
• Low birth weight
• Pre-natal and post natal economic shocks • Drought
• Death of livestock
• Family members’ death and illness
Other drivers of poverty
• Increased agricultural production (mainly cereals and legume and oil crops)
• Increased area of land cultivated
• increased agricultural productivity
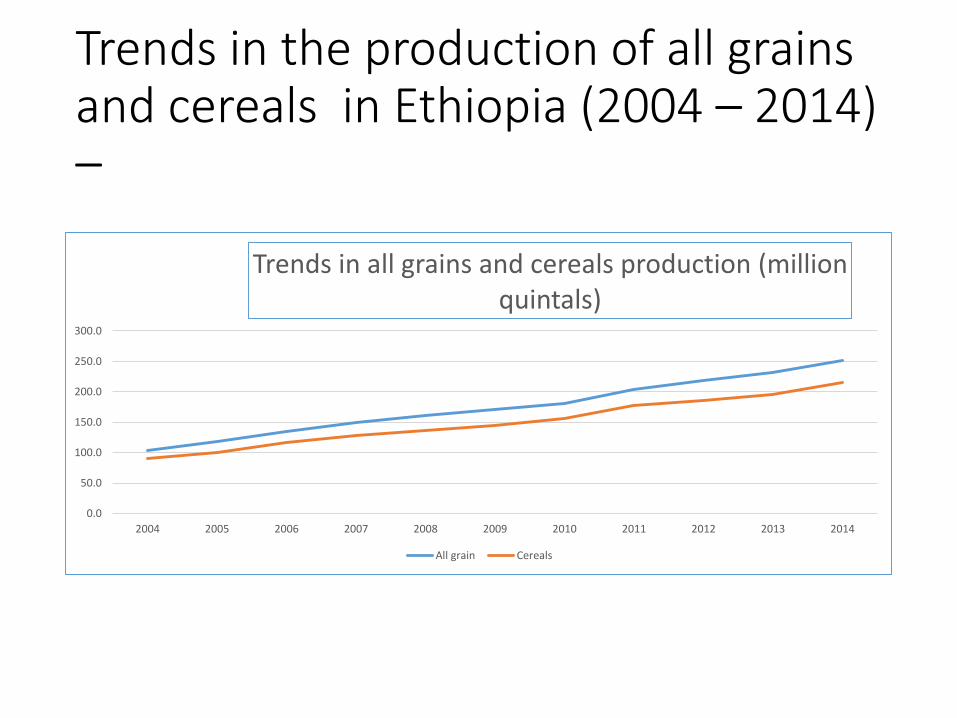
Trends in the production of all grains and cereals in Ethiopia (2004 – 2014) –
0.0
50.0
100.0
150.0
200.0
250.0
300.0
2004 2005 2006 2007 2008 2009 2010 2011 2012 2013 2014
Trends in all grains and cereals production (million quintals)
All grain Cereals
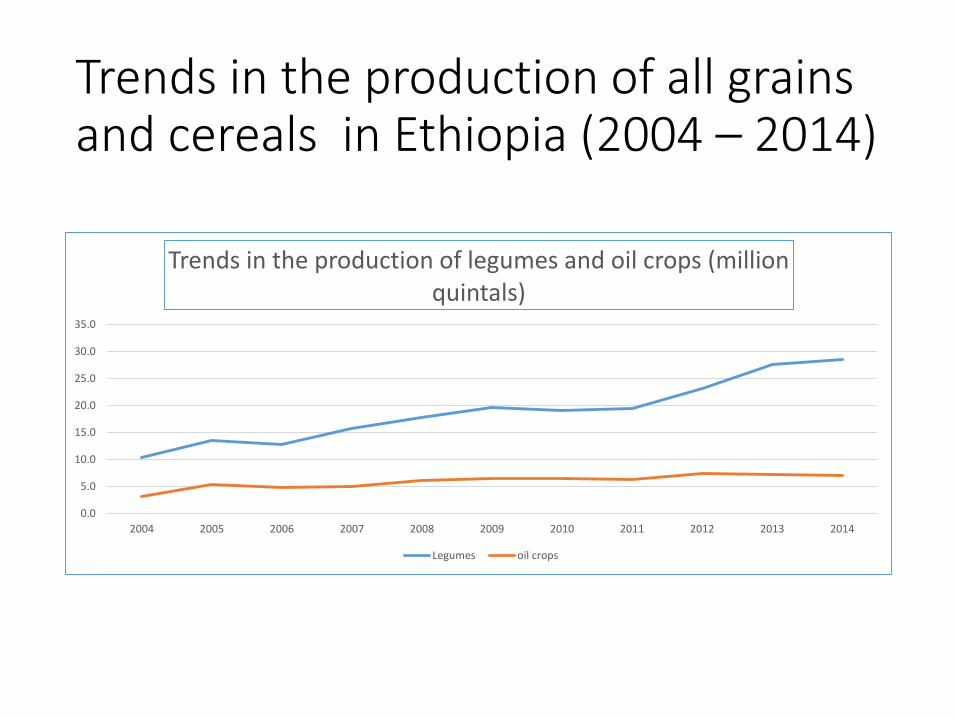
Trends in the production of all grains and cereals in Ethiopia (2004 – 2014)
0.0
5.0
10.0
15.0
20.0
25.0
30.0
35.0
2004 2005 2006 2007 2008 2009 2010 2011 2012 2013 2014
Trends in the production of legumes and oil crops (million quintals)
Legumes oil crops
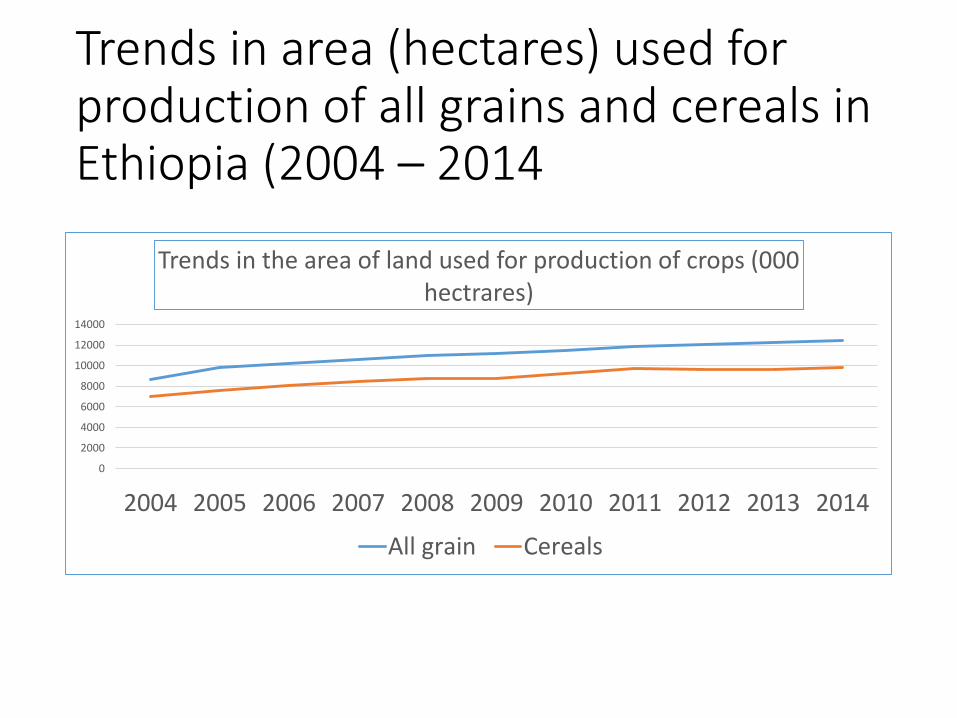
Trends in area (hectares) used for production of all grains and cereals in Ethiopia (2004 – 2014
0
2000
4000
6000
8000
10000
12000
14000
2004 2005 2006 2007 2008 2009 2010 2011 2012 2013 2014
Trends in the area of land used for production of crops (000 hectrares)
All grain Cereals
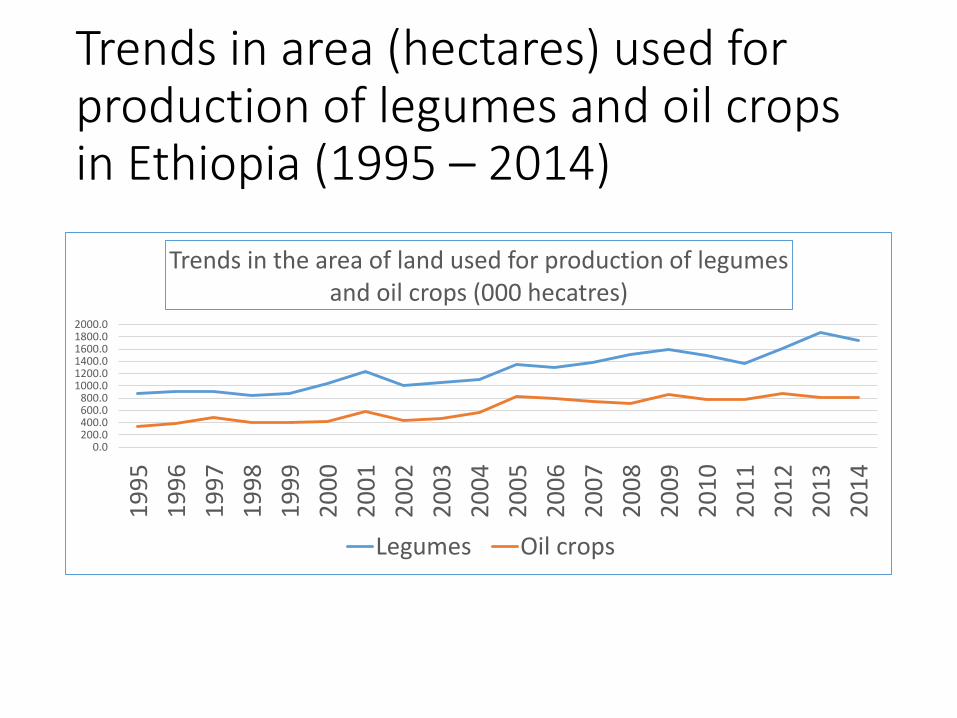
Trends in area (hectares) used for production of legumes and oil crops in Ethiopia (1995 – 2014)
0.0200.0400.0600.0800.0
1000.01200.01400.01600.01800.02000.0
19
95
19
96
19
97
19
98
19
99
20
00
20
01
20
02
20
03
20
04
20
05
20
06
20
07
20
08
20
09
20
10
20
11
20
12
20
13
20
14
Trends in the area of land used for production of legumes and oil crops (000 hecatres)
Legumes Oil crops
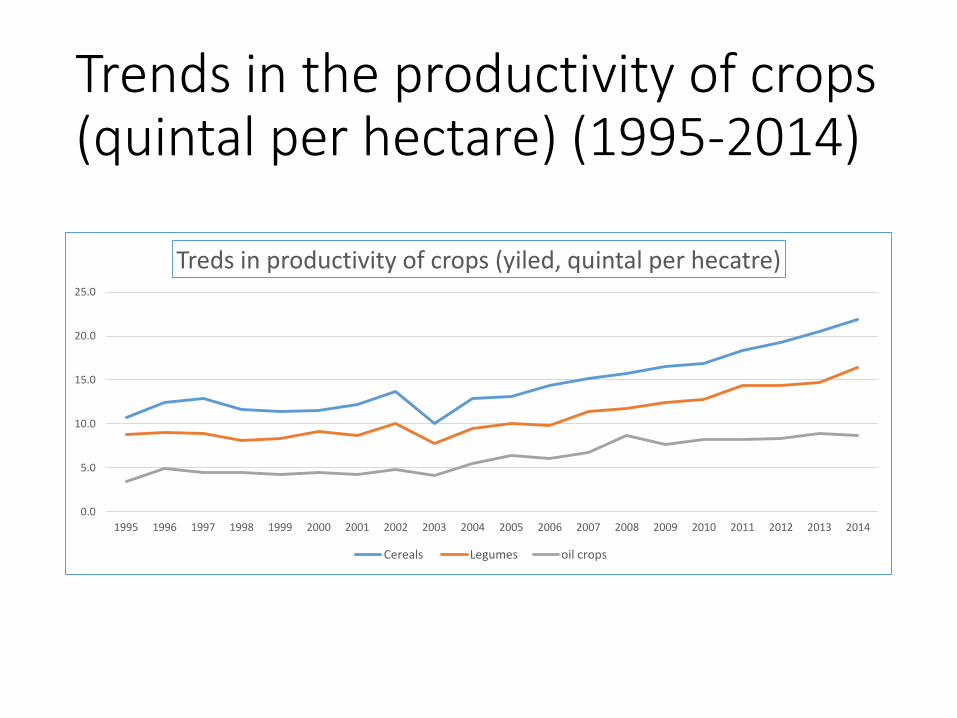
Trends in the productivity of crops (quintal per hectare) (1995-2014)
0.0
5.0
10.0
15.0
20.0
25.0
1995 1996 1997 1998 1999 2000 2001 2002 2003 2004 2005 2006 2007 2008 2009 2010 2011 2012 2013 2014
Treds in productivity of crops (yiled, quintal per hecatre)
Cereals Legumes oil crops
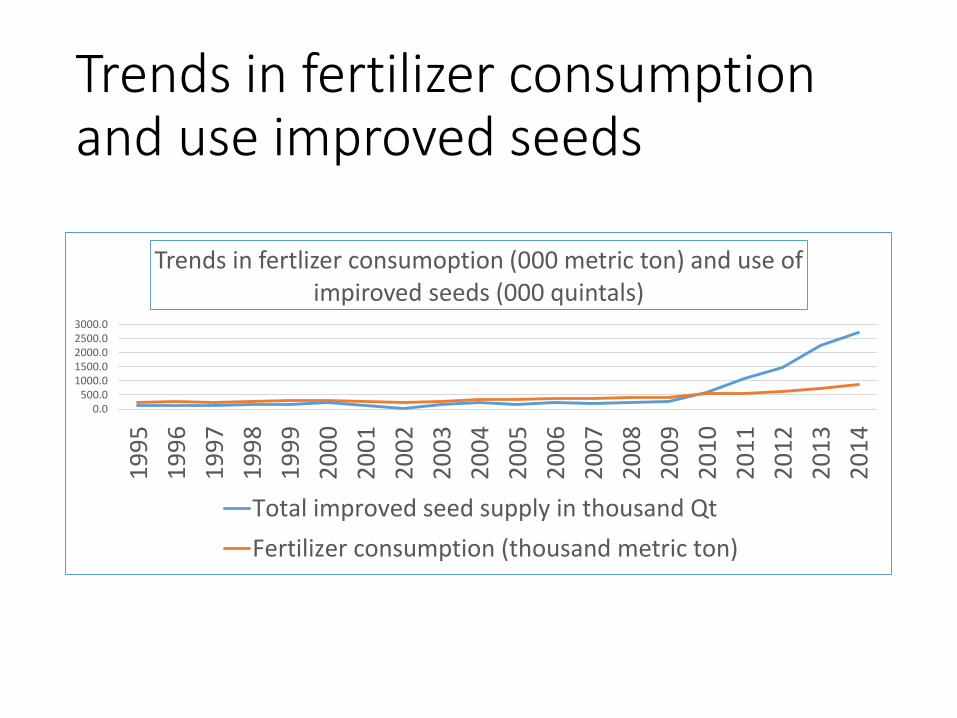
Trends in fertilizer consumption and use improved seeds
0.0500.0
1000.01500.02000.02500.03000.0
19
95
19
96
19
97
19
98
19
99
20
00
20
01
20
02
20
03
20
04
20
05
20
06
20
07
20
08
20
09
20
10
20
11
20
12
20
13
20
14
Trends in fertlizer consumoption (000 metric ton) and use of impiroved seeds (000 quintals)
Total improved seed supply in thousand Qt
Fertilizer consumption (thousand metric ton)