
Dynamics of information spread on networks · Dynamics of information spread on networks Kristina...
71
Dynamics of information spread on networks Kristina Lerman USC Information Sciences Institute
Transcript of Dynamics of information spread on networks · Dynamics of information spread on networks Kristina...

Dynamics of information spread on networks
Kristina Lerman
USC Information Sciences Institute

USC Information Sciences Institute
Information spread in online social networksDiffusion of activation on a graph, where each infected
(activated)
node infects neighbors with some probability

USC Information Sciences Institute
Why now? Data‐driven network science
Availability of largelarge‐‐scalescale, timetime‐‐resolvedresolved
data on the Social Web allows us to ask new questions about social
behavior•
How does information spread on networks?
•
How far and how fast does information flow?
•
How does the network structure affect information flow?
•
What does this tell us about the quality of information?
•
What is the structure of the network?•
Who are the influential users and communities?
•
How does network structure affect the flow of information?
•
What is the collective behavior of users?•
How does individual behavior affect collective behavior?
USC Information Sciences Institute
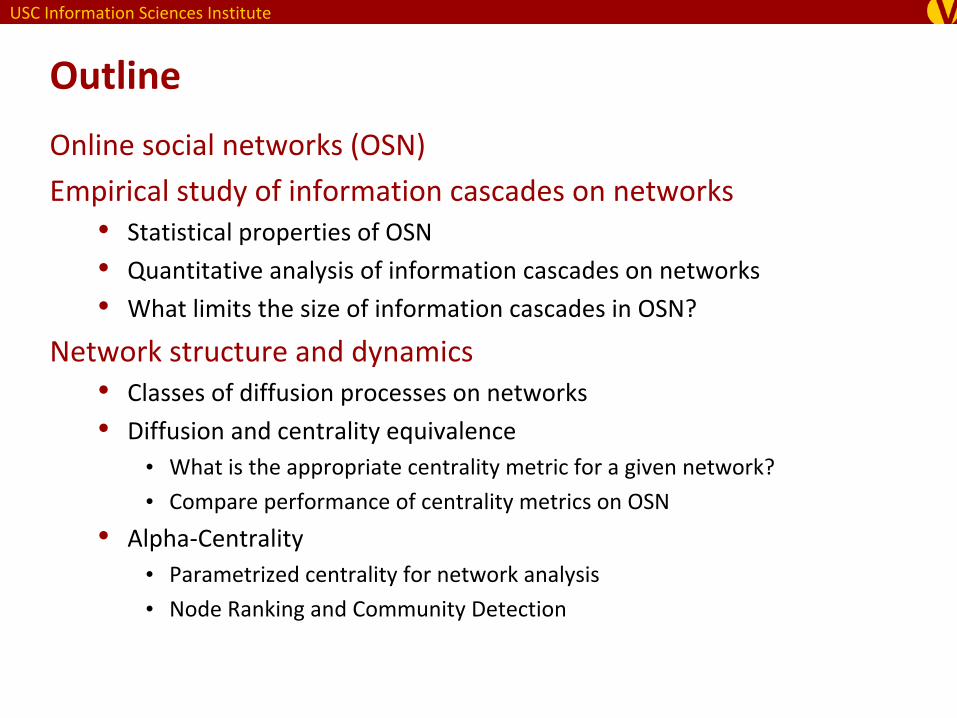
Outline
Online social networks (OSN)
Empirical study of information cascades on networks•
Statistical properties of OSN
•
Quantitative analysis of information cascades on networks
•
What limits the size of information cascades in OSN?
Network structure and dynamics•
Classes of diffusion processes on networks
•
Diffusion and centrality equivalence•
What is the appropriate centrality metric for a given network?
•
Compare performance of centrality metrics on OSN
•
Alpha‐Centrality•
Parametrized centrality for network analysis
•
Node Ranking and Community Detection

USC Information Sciences Institute
Social News: Digg
Users submitsubmit
or votevote
for (digg)
news stories
Online social networks •
Users follow ‘friends’
to see•
Stories friends submit
•
Stories friends vote for
•
Shown in My News
Trending stories•
Digg promotes most popular
stories to its Top News page

USC Information Sciences Institute
Microblogging: Twitter
Users tweet short text posts•
Retweet posts of others
•
140 characters long
Online social networks•
Users follow ‘friends’
to see•
Tweets by friends
•
Retweets by friends
Trending topics•
Twitter analyzes activity to
identify popular trends
USC Information Sciences Institute
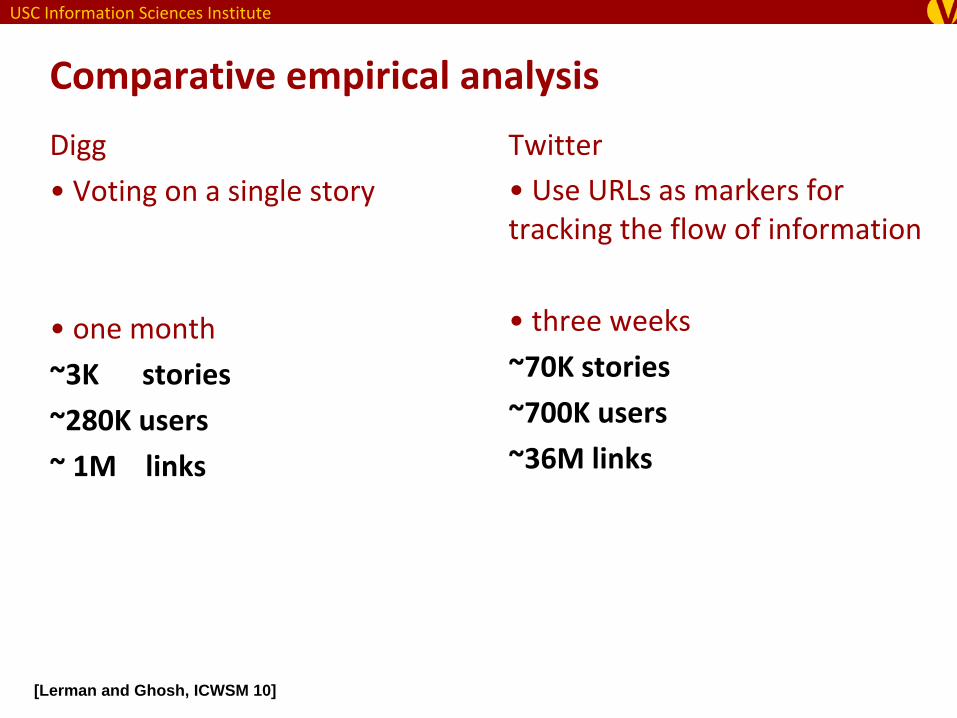
Comparative empirical analysis
Digg
• Voting on a single story
• one month
~3K stories
~280K users
~ 1M links
Twitter•
Use URLs as markers for
tracking the flow of information
• three weeks
~70K stories
~700K users
~36M links
[Lerman and Ghosh, ICWSM 10]

USC Information Sciences Institute
Dynamics of story popularity
Digg Twitter
1: U.S. Government Asks Twitter to Stay Up
for #IranElection2: Western Corporations Helped Censor
Iranian Internet3: Iranian clerics defy ayatollah, join protests
1: U.S. Government Asks Twitter to Stay Up
for #IranElection2: Western Corporations Helped Censor
Iranian Internet3: Iranian clerics defy ayatollah, join protests
USC Information Sciences Institute
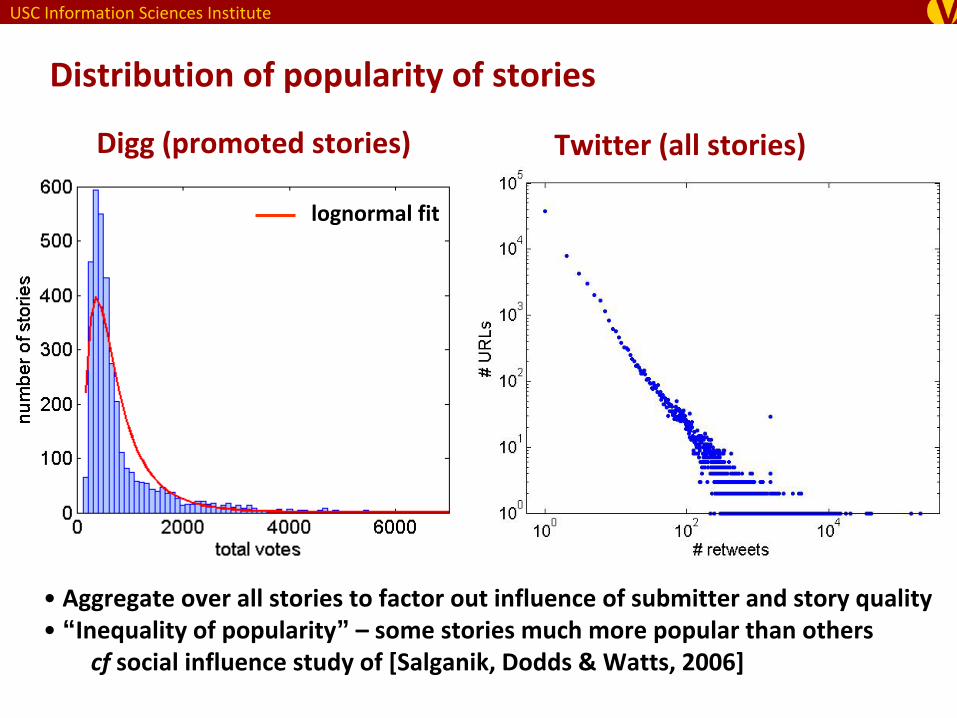
Distribution of popularity of stories
Digg (promoted stories)
lognormal fit
• Aggregate over all stories to factor out influence of submitter
and story quality • “Inequality of popularity” – some stories much more popular than others
cf
social influence study of [Salganik, Dodds & Watts, 2006]
Twitter (all stories)

USC Information Sciences Institute
Network structure: Distribution of followers
Digg Twitter
follower friend
USC Information Sciences Institute
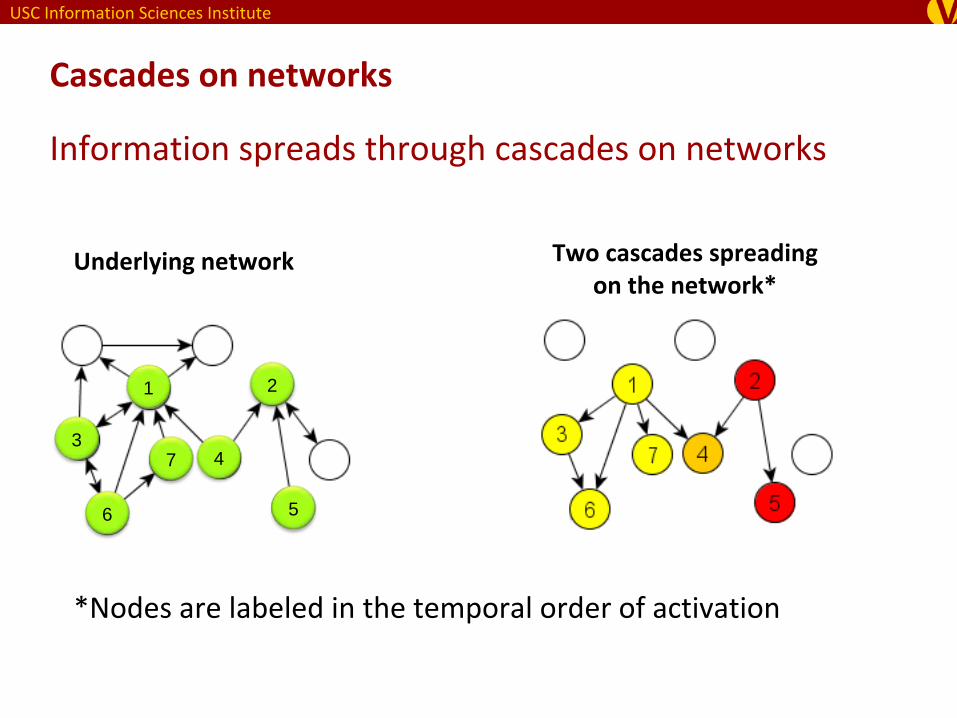
Cascades on networks
Information spreads through cascades on networks
*Nodes are labeled in the temporal order of activation
1 2
34
56
7
Underlying network Two cascades spreading
on the network*

USC Information Sciences Institute
Analysis of information cascades
[Leskovec, McGlohon, & Faloutsos, Cascading Behavior in Large Blog Graphs, in SDM (2007)]

USC Information Sciences Institute
Cascade generating functionQuantitative framework for measuring the structure of
evolving cascades• Microscopic
• Macroscopic
Efficient compression• Time sequence of real numbers carries information about
cascade structure
• Allows to reconstruct the cascadeFast and Scalable
•
O(kN) space •
O(dkN) runtime complexity (k=#of seeds, d=max. degree,
N=#of nodes)
[Ghosh and Lerman, A Framework for Quantitative Analysis of Cascades on Networks. WSDM11]

USC Information Sciences Institute
1 2
44
Calculating cascade generating function
( j,) (i,)i friend( j )
66
(6,) (3,)(1,) ( 2)c1
3
(1,) c1 (2,) c2
(4,) (1,)(2,) c1 c2
(3,) (1,) c1
USC Information Sciences Institute
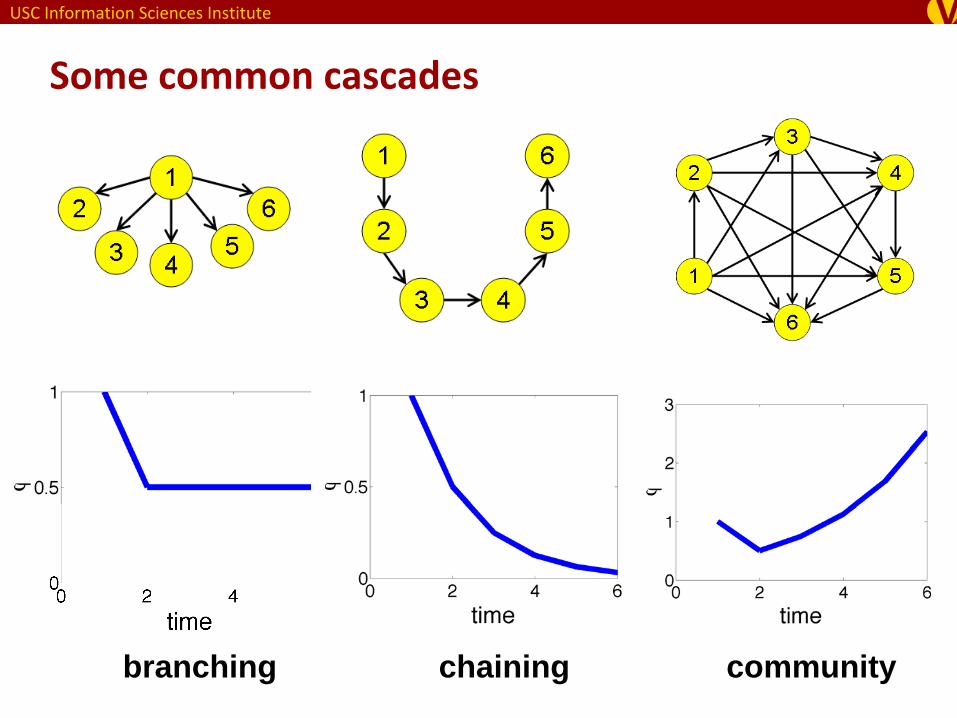
Some common cascades
branching chaining community
USC Information Sciences Institute
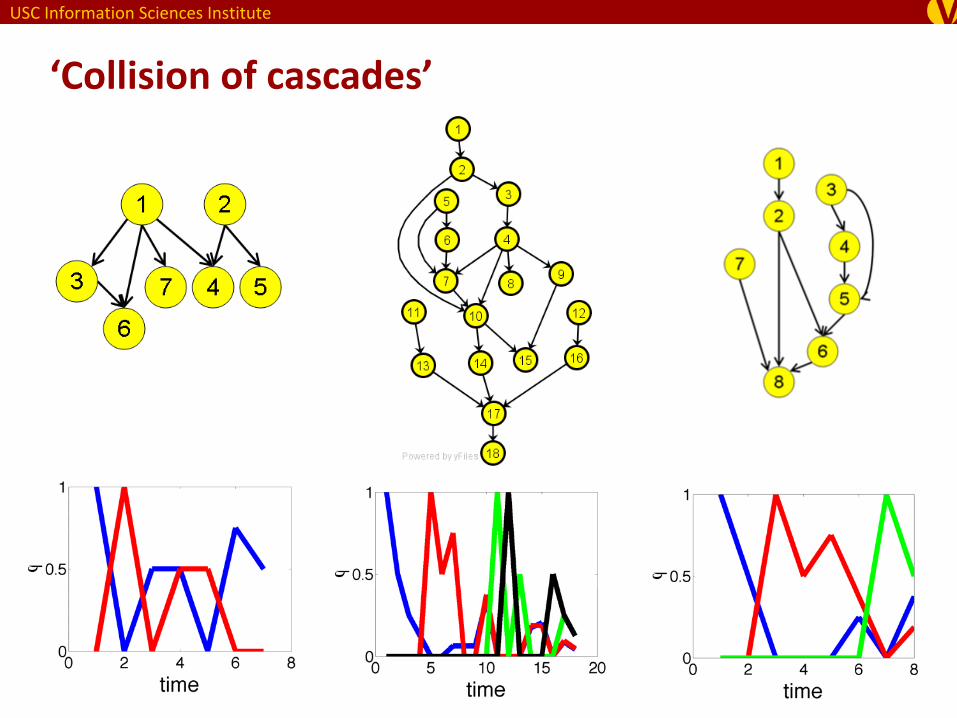
‘Collision of cascades’
USC Information Sciences Institute
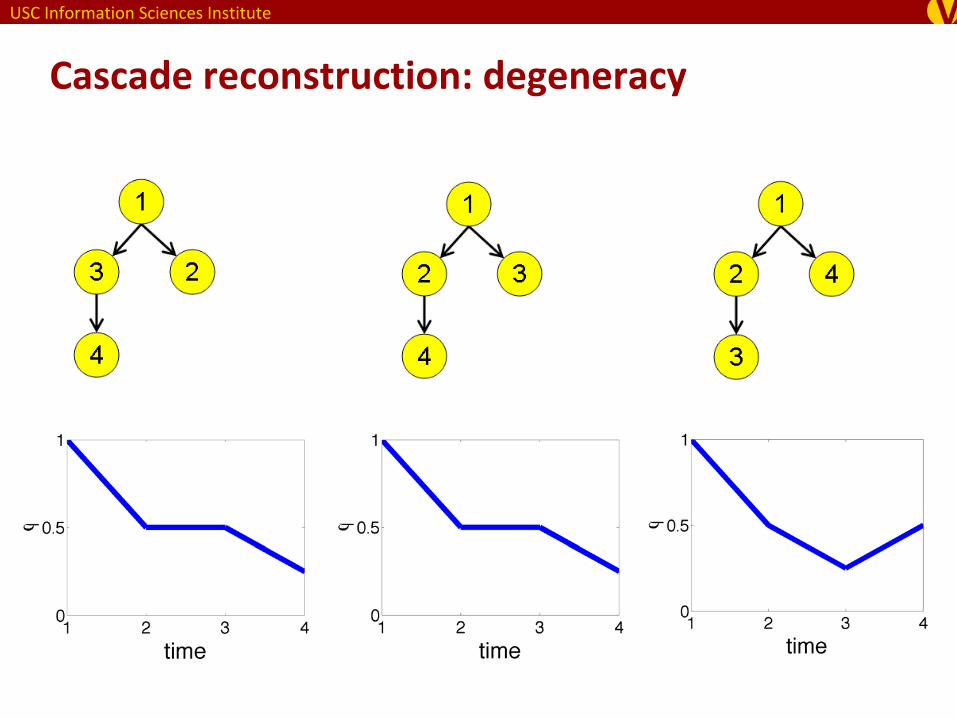
Cascade reconstruction: degeneracy

USC Information Sciences Institute
Play Doctor On Yourself: 16 Things To Do Between Checkups
APOD: 2009 July 1 – Three Galaxies in Draco
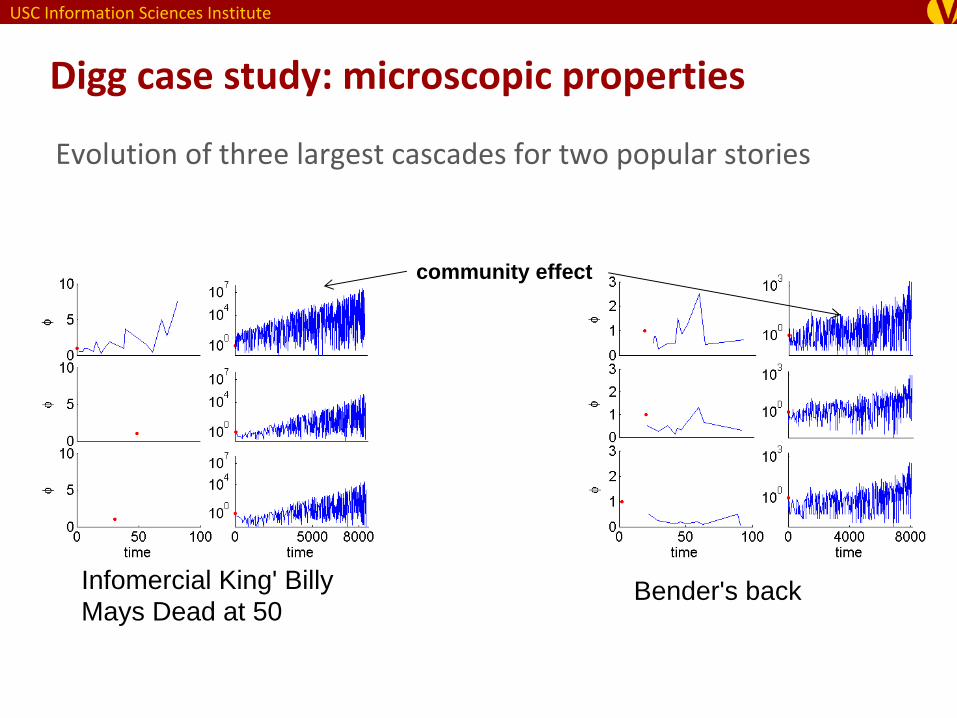
Digg case study: microscopic properties
chaining effect
branching effect
community effect
Evolution of three largest cascades for two non‐popular stories
USC Information Sciences Institute
Digg case study: microscopic properties
Infomercial King' Billy Mays Dead at 50
Bender's back
Evolution of three largest cascades for two popular stories
community effect
USC Information Sciences Institute
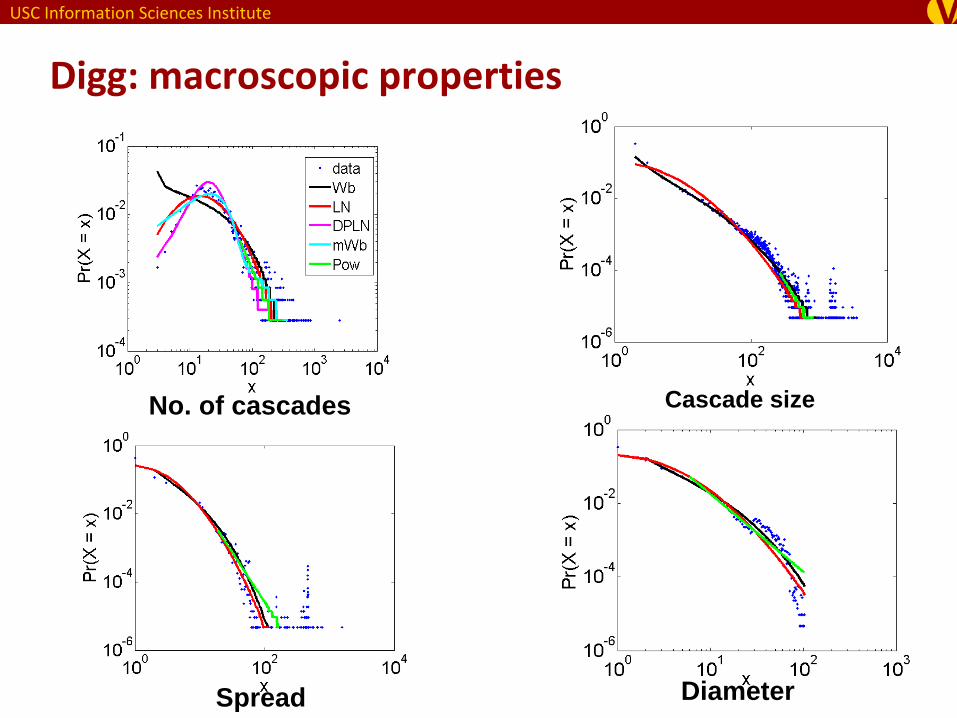
Digg: macroscopic properties
No. of cascades
Spread Diameter
Cascade size

USC Information Sciences Institute
Cascade sizeWhy are Digg cascades so small?

USC Information Sciences Institute
What limits cascade size?
Network structure•
Clustering
•
Degree heterogeneity
Dynamics•
Social contagion mechanism
•
Change in transmissibility (e.g., novelty decay)
[Ver Steeg, Ghosh & Lerman, What stops social epidemics? in ICWSM 11]

USC Information Sciences Institute
Effect of network structure
Study the effect of clustering by simulating cascades on syntheticsynthetic
and realreal
graphs
Digg graph•
Power law degree distribution with exponent ‐2
Synthetic graph•
Constructed using directed configuration Model [Newman et al.]
•
Preserves degree distribution but destroys clustering and degree
correlation
Cascade simulations•
Independent Cascade Model (ICM)
•
Widely used to model epidemics, viral marketing campaigns, etc.•
Start with infected seed (submitter)•
Susceptible
fans are infected with probability
(transmissibility)−
If user has n contagious friends, she has n chances to be infected•
Users can infect friends during a single round, then they are removed•
When cascade stops, measure its size (# of infected nodes)
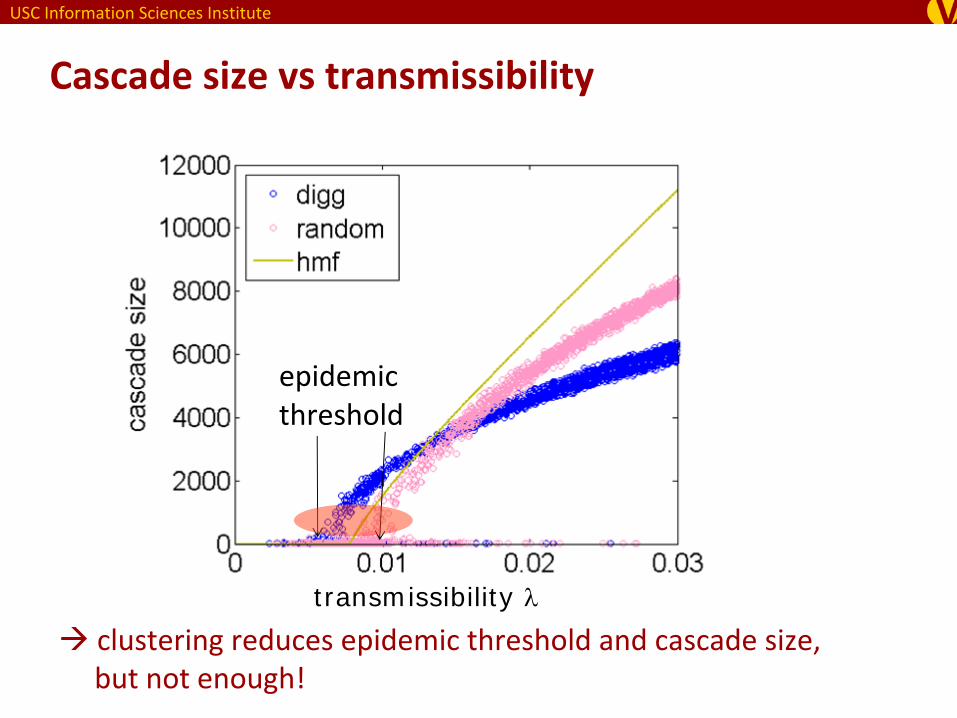
USC Information Sciences Institute
Cascade size vs transmissibility
clustering reduces epidemic threshold and cascade size, but not enough!
transmissibility
epidemic
threshold

USC Information Sciences Institute
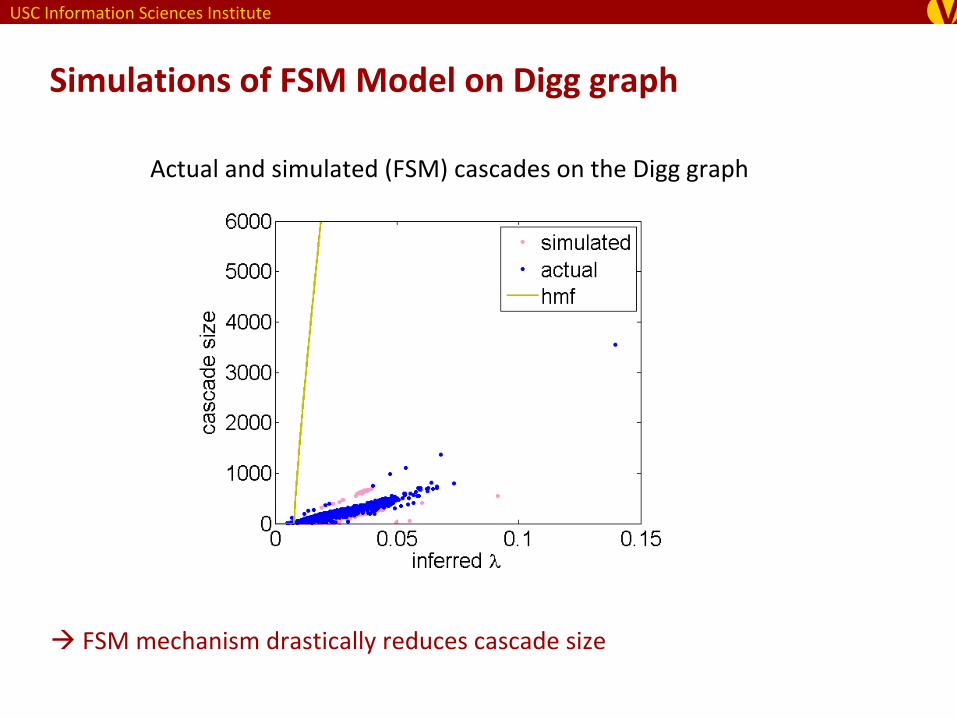
Friend Saturation Model
Perhaps we got the contagion
mechanism wrong?•
ICM: each friend has probability
to
infect the node; therefore, pICM
(vote|n friends voted)=1‐(1‐
)n
•
On Digg, empiricallyp(vote|n friends voted) ~
Friend Saturation Model (FSM)•
Repeated exposure to a story does
not make the user much more likely
to vote for it •
Cf, market saturation effect,
decreasing cascade model [Kempe et
al, 2005]
Probability user votes given n of his
friends have voted
USC Information Sciences Institute
Simulations of FSM Model on Digg graph
FSM mechanism drastically reduces cascade size
Actual and simulated (FSM) cascades on the Digg graph

USC Information Sciences Institute
Outline
Online social networks (OSN)
Empirical study of information cascades on networks•
Online social networks (OSN) and their properties
•
Quantitative analysis of information cascades on networks
•
What limits the size of information cascades in OSN?
Network structure and dynamics•
Classes of diffusion processes on networks
•
Diffusion and centrality equivalence•
What is the appropriate centrality metric for a given network?
•
Compare performance of centrality metrics on OSN
•
Alpha‐Centrality•
Parametrized centrality for network analysis
•
Node Ranking and Community Detection

USC Information Sciences Institute
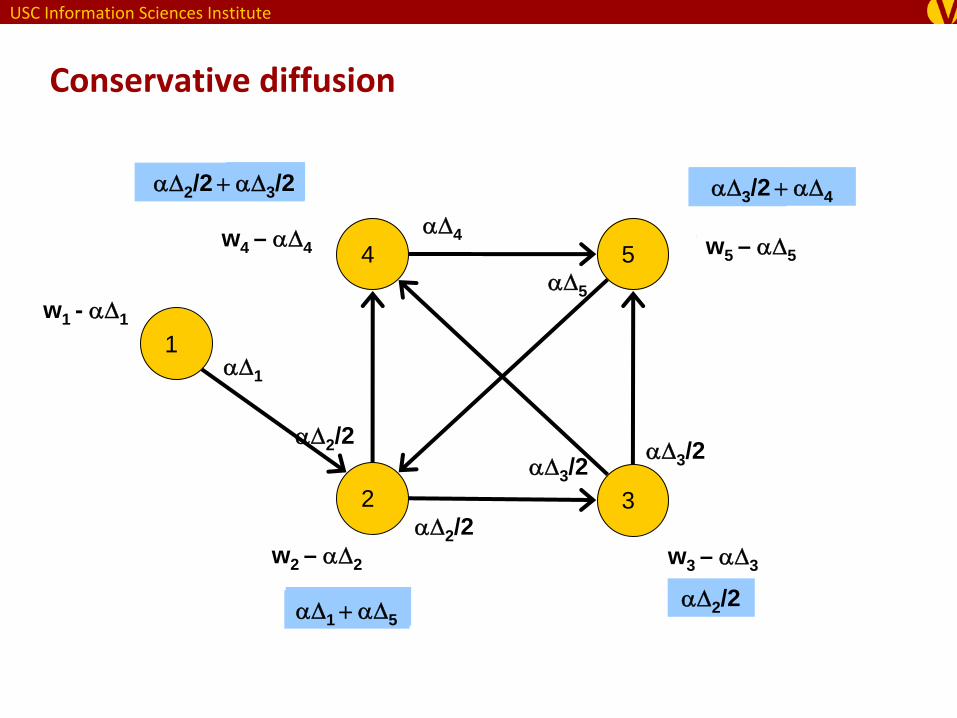
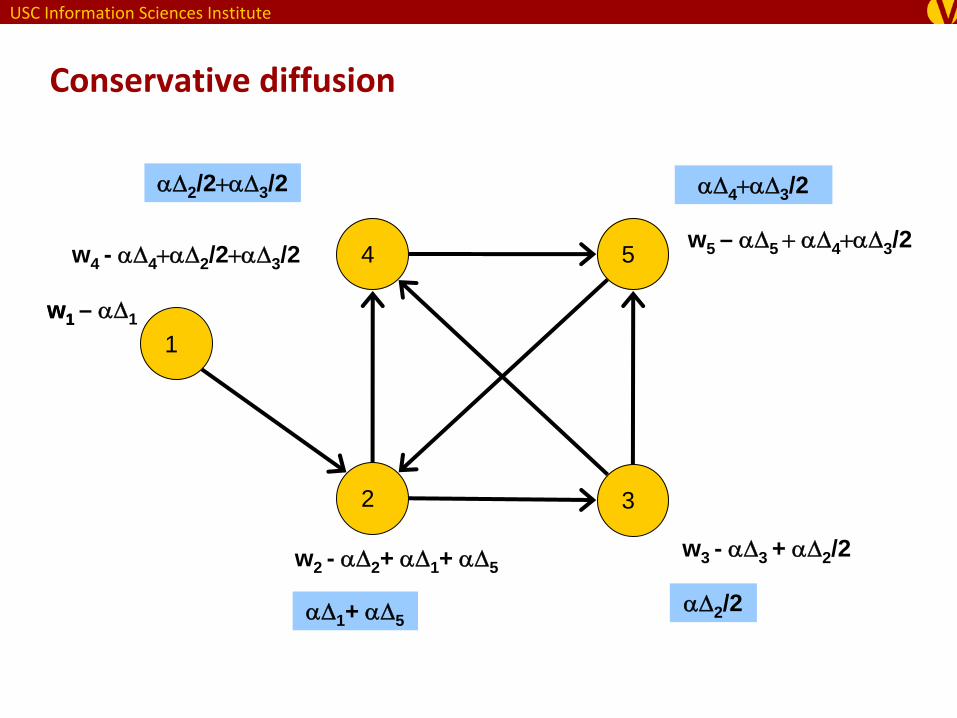
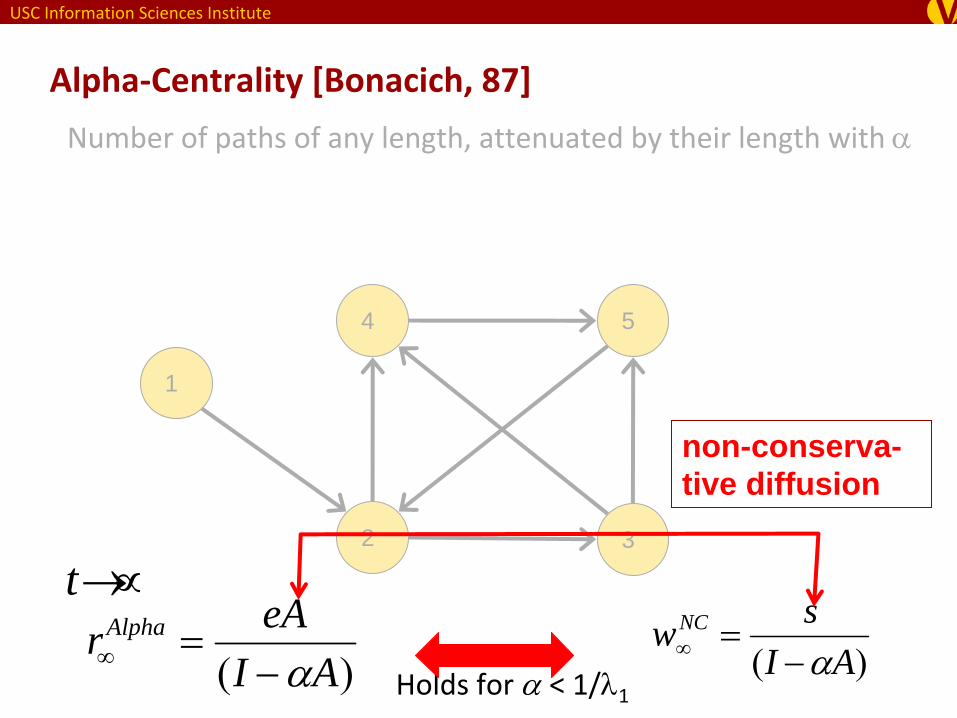
Conservative diffusion
Conservative diffusion: models money
transfer, conversations, etc. where some
quantity ($, attention) is conserved
Two classes of diffusion on networksNon‐conservative diffusion
Non‐conservative diffusion: models
epidemics, spread of information, etc.,
where quantity (viruses) is not conserved.
Post Post
Post
1
2 3
4 5$ $
1
2 3
4 5
$
Mathematical formulation of two types of diffusion• Equivalence of steady state solutions and centrality metrics•
Unifies social network analysissocial network analysis
and epidemic modelsepidemic models
•
Existence of threshold for epidemic processes•
Location of the epidemic threshold
[Ghosh and Lerman, Predicting Influential Users in Online Social Networks. SNAKDD10]
USC Information Sciences Institute
3 /23 /2 42 /22 /2 3 /2
w5
w3
w4
w2
w1
12 /2
1
4
2
5
3
1
2 /2 3 /23 /2
5
4
2 /2
Conservative diffusion
w5 – 5
w1 - 1
w2 – 2 w3 – 3
w4 – 4
1 5
USC Information Sciences Institute
w5
w3
w4
w2
w1
2 /2
1
4
2
5
3
Conservative diffusion
w1 – 1
w2 - 2
w4 - 4
w3 - 3
2 /23 /2 4 3 /2
w5 – 5
1 + 5
w2 - 2 + 1 + 5w3 - 3 + 2 /2
w4 - 4 2 /23 /2w5 – 5 4 3 /2

USC Information Sciences Institute
Matrix formulation
1
2 3
4 50 1 0 0 0
0 0 1 1 0
0 0 0 1 1
0 0 0 0 1
0 1 0 0 0
1 0 0 0 0
0 2 0 0 0
0 0 2 0 0
0 0 0 1 0
0 0 0 0 1
A =
D =
Adjacency matrix
of the network
Outdegree matrix
USC Information Sciences Institute
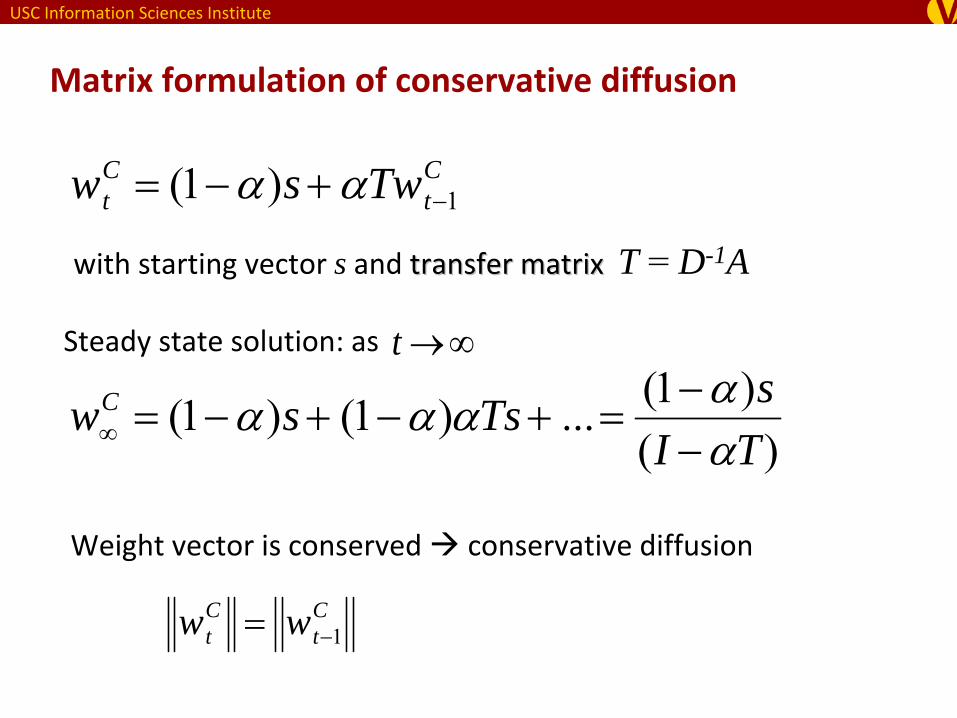
Matrix formulation of conservative diffusion
with starting vector s and transfer matrixtransfer matrix
T =
D-1A
Weight vector is conserved conservative diffusion
Steady state solution: as t
wtC (1)sTwt1
C
wC (1)s (1)Ts ... (1)s
(I T)
wtC wt1
C

USC Information Sciences Institute
w5
w3
w4
w2
w1
12
2 3
1
4
2
5
3
1
2 33
5
4
2
Non‐conservative diffusion
w5 – 5
w1 - 1
w2 – 2 w3 – 3
2 3
w4 – 4
3 4
1 5

USC Information Sciences Institute
1 5
3 42 3
w5
w3
w4
w2
w1
2
1
4
2
5
3
Non‐conservative diffusion
w5 – 5
w1 - 1
w2 – 2 w3 – 3
w4 – 4
w2 – 2 + 1 5 w3 – 3 + 2
w4 – 4 2 3 w5 – 5 3 4
USC Information Sciences Institute
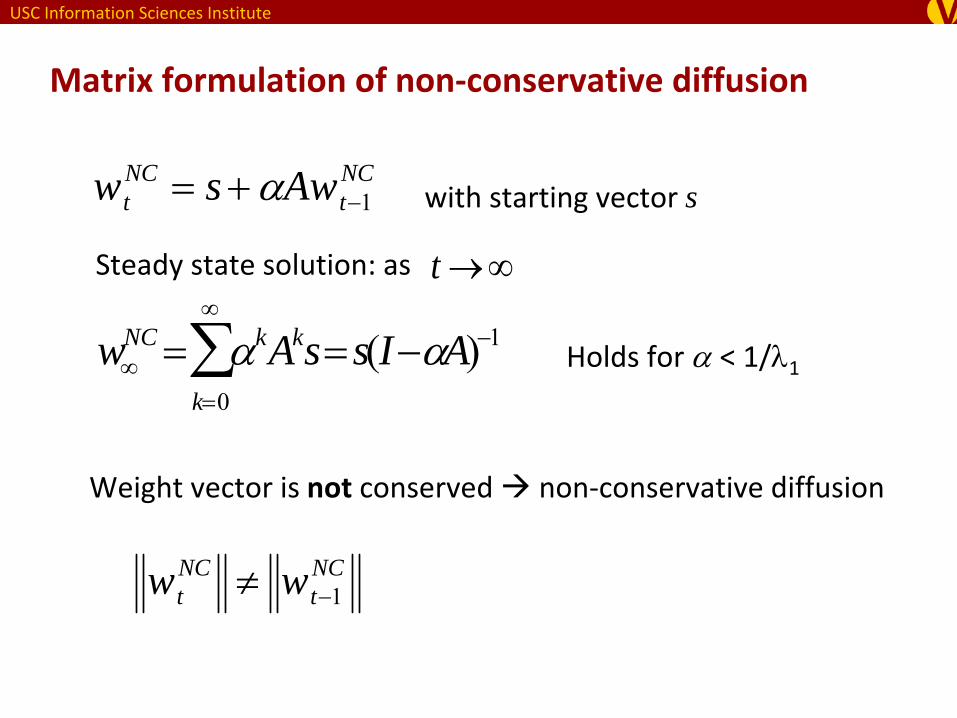
Matrix formulation of non‐conservative diffusion
wtNC sAwt1
NCwith starting vector s
Weight vector is not
conserved non‐conservative diffusion
wtNC wt1
NC
wNC k
k0
Akss(IA)1t Steady state solution: as
Holds for < 1/1

USC Information Sciences Institute
Epidemics as non‐conservative diffusion
time = t-1

USC Information Sciences Institute
[Wang et al. 2003 ]
Transmissibility
Epidemics as non‐conservative diffusion
time = t

USC Information Sciences Institute
Epidemics as non‐conservative diffusion
time = t
Ptcum Pk
k0
t
A kk0
t
P0
Expected # of virus up to time t

USC Information Sciences Institute
Epidemics as non‐conservative diffusion
time = t
Ptcum Pk
k0
t
A kk0
t
P0
Expected # of virus up to time t
w A k
k 0
s
nonnon--conservaconserva-- tive tive diffusion
USC Information Sciences Institute
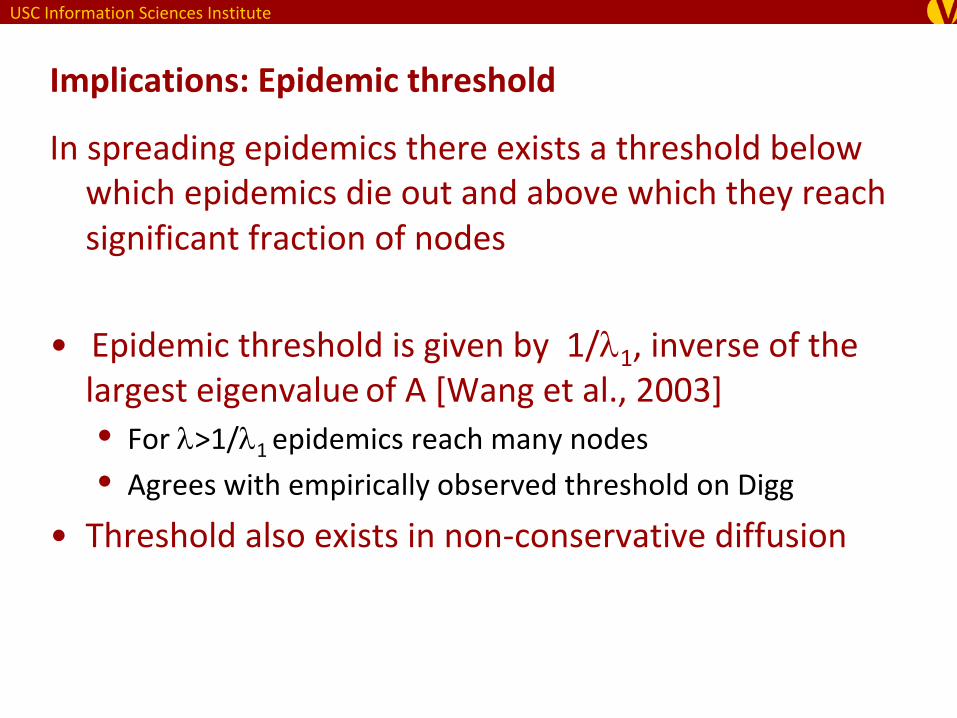
Implications: Epidemic threshold
In spreading epidemics there exists a threshold below which epidemics die out and above which they reach
significant fraction of nodes
•
Epidemic threshold is given by 1/1
, inverse of the largest eigenvalue
of A [Wang et al., 2003]
• For >1/1
epidemics reach many nodes
• Agrees with empirically observed threshold on Digg
•
Threshold also exists in non‐conservative diffusion

USC Information Sciences Institute
c=0.006
c=0.009
transmissibility

USC Information Sciences Institute
Implications for network analysis
Who is important in a network?Geodesic path‐based ranking
measures• Betweenness centrality
[Freeman, 1979]
Topological ranking measures• Page Rank [Brin et al., 1998] • Degree Centrality
Path‐Based Ranking Measures• Alpha‐centrality [Bonacich,
1987]
• Katz score [Katz, 1953]• EigenVector centrality
[Bonacich, 2001]
1
2 3
4 5
PageRankBetweenness Centrality
1
2 3
4 5
1
2 3
4 5
Alpha-Centrality
[Node size = importance]
1
2 3
4 5
Degree Centrality
USC Information Sciences Institute
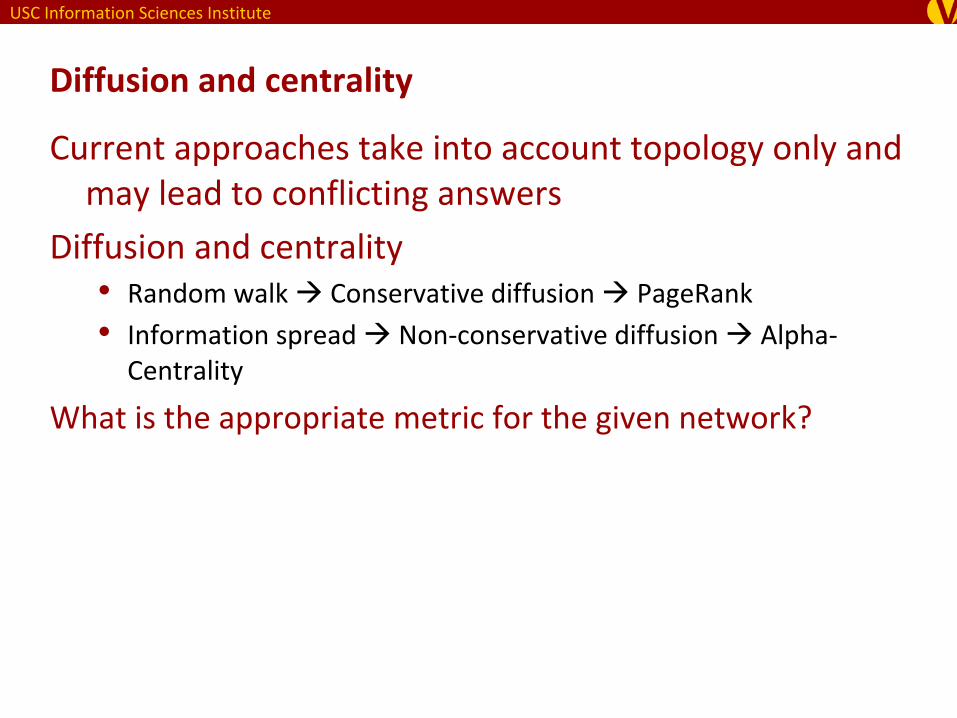
Diffusion and centrality
Current approaches take into account topology only and may lead to conflicting answers
Diffusion and centrality•
Random walk Conservative diffusion PageRank
•
Information spread Non‐conservative diffusion Alpha‐
Centrality
What is the appropriate metric for the given network?

USC Information Sciences Institute
w5
w5 /5
w5 /5
w5 /5w5 /5
w5 /5
1
4
2
5
3
PageRank [Page & Brin, 98]
rt
PR (1)r0PR (1)D1Ar0
PR K D1A t r0PR
Web surfer: with probability
navigates to a neighboring node
…. with probability (1 ‐
jumps to a random node
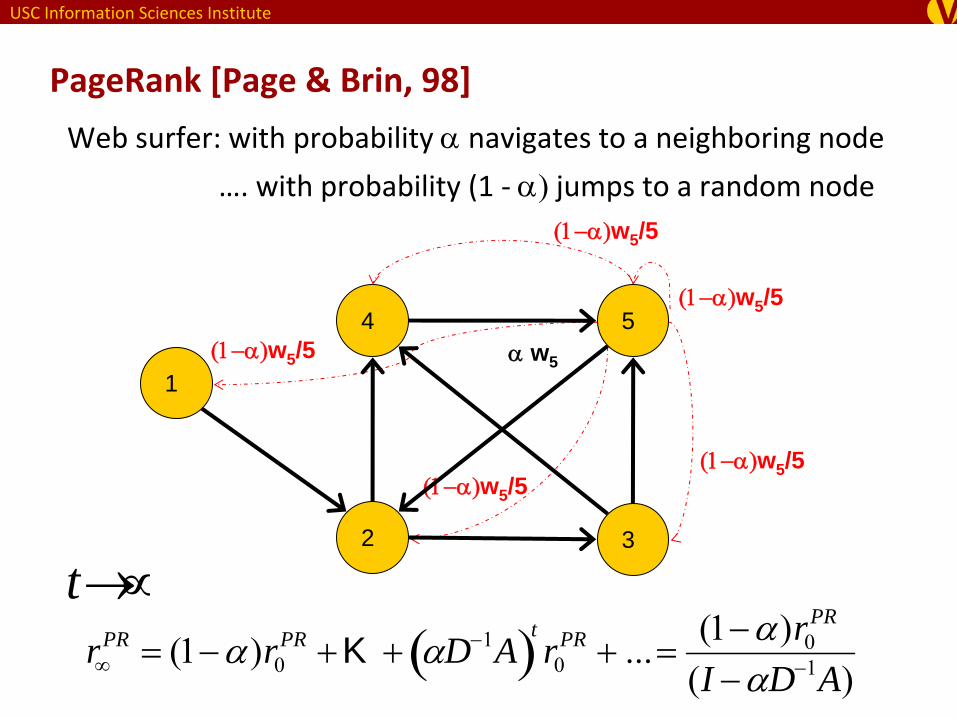
USC Information Sciences Institute
w5
w5 /5
w5 /5
w5 /5w5 /5
w5 /5
1
4
2
5
3
PageRank [Page & Brin, 98]
r
PR (1)r0PR K D1A t r0
PR ... (1)r0PR
(I D1A)
Web surfer: with probability
navigates to a neighboring node
…. with probability (1 ‐
jumps to a random node
t

USC Information Sciences Institute
w5
w5 /5
w5 /5
w5 /5w5 /5
w5 /5
1
4
2
5
3
PageRank [Page & Brin, 98]
rPR
(1)r0PR
(I D1A)
Web surfer: with probability
navigates to a neighboring node
…. with probability (1 ‐
jumps to a random node
wC
(1)s(I T)
conservative diffusion
t

USC Information Sciences Institute
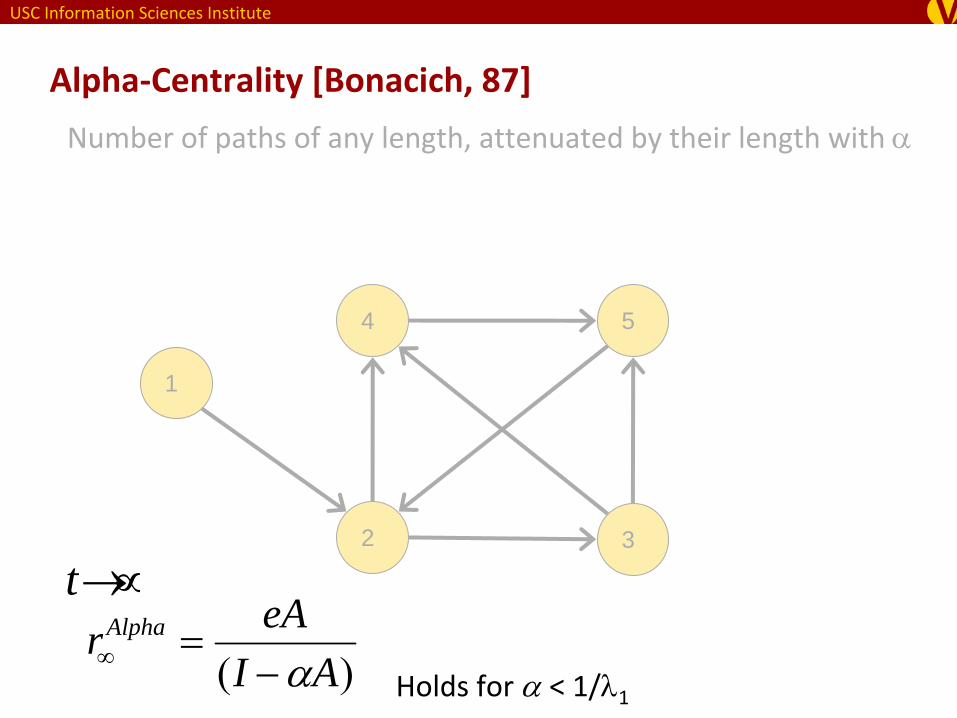
rtAlpha eA eA 2 ... teAt1
Alpha‐Centrality [Bonacich, 87]
1
4
2
5
3
Number of paths of any length, attenuated by their length with

USC Information Sciences Institute
rtAlpha eA eA 2 ... teAt1
Alpha‐Centrality [Bonacich, 87]
1
4
2
5
3
Number of paths of any length, attenuated by their length with
USC Information Sciences Institute
rAlpha
eA(I A)
Alpha‐Centrality [Bonacich, 87]
1
4
2
5
3
Number of paths of any length, attenuated by their length with
t
Holds for < 1/1
USC Information Sciences Institute
rAlpha
eA(I A)
Alpha‐Centrality [Bonacich, 87]
1
4
2
5
3
Number of paths of any length, attenuated by their length with
t
Holds for < 1/1
wNC
s(I A)
non-conserva- tive diffusion

USC Information Sciences Institute
Ranking nodes by centrality
PageRank Alpha‐Centrality
89
7
6
5
1 2 3
4
89
7
6
5
1 2 3
4
1010

USC Information Sciences Institute
Ranking nodes by centrality
PageRank Alpha‐Centrality
89
7
6
5
1 2 3
4
10
89
7
6
5
1 2 3
4
10
1/3
1/3 1/2 1/2
1 1
11 1
1

USC Information Sciences Institute
Which metric is right?
How can we evaluate centrality metrics?
•
User activity in social media provides an independent measure of importance/influence
• Serves as ground truth for evaluating centrality metrics
Evaluation methodology• Define an empirical measure of influence (ground truth)
•
Compare centrality metrics with the ground truth
USC Information Sciences Institute
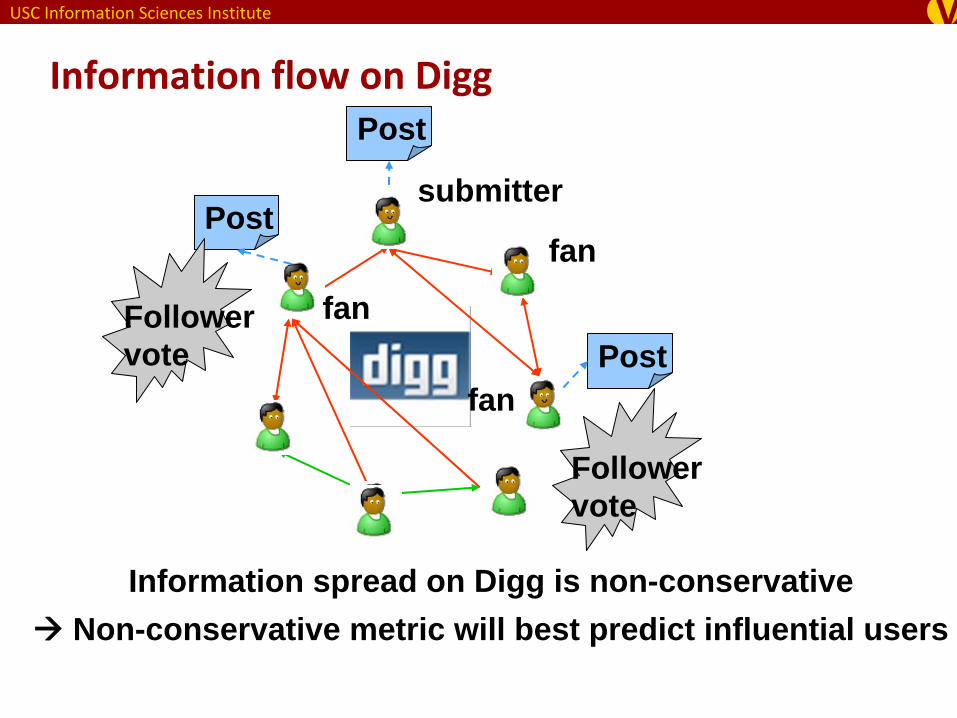
submitter
Post
Post
Post
Information spread on Digg is non-conservative Non-conservative metric will best predict influential users
Information flow on Digg
Follower vote
Follower vote
fan
fan
fan

USC Information Sciences Institute
Empirical estimate of influence
1.
Average follower votes•
Likelihood a follower votes for the story
•
Influence of submitter
•
Quality of the story
•
Story quality•
Random variable•
Average out by aggregating fan votes over all stories submitted
by
the same submitter−
289 users submitting at least 2 stories
2.
Average Cascade size• How far does the story spread into the network
Ground truth(s): Rank users according to each estimate

USC Information Sciences Institute
Statistical significance estimate 1
Fans of submitter in OSN (K) White balls in the urn (K)Users in OSN (N) Balls in the urn (N)
No. of users who voted (n) No. of balls picked (n)
No. of fans who voted (k)
Post
submitter
No of white balls picked (k)
URN MODEL
P(X k | K,N,n)
Kk
N kn k
Nn
(Hypergeometric Dist.)
follower follower
follower
USC Information Sciences Institute
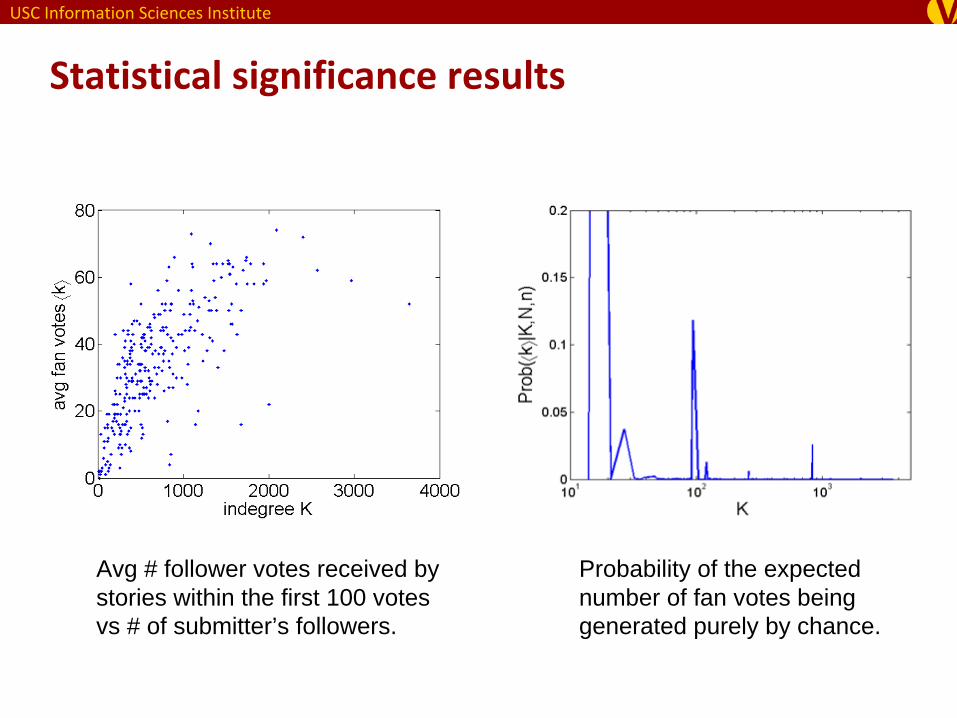
Statistical significance results
Avg # follower votes received by stories within the first 100 votes vs # of submitter’s followers.
Probability of the expected number of fan votes being generated purely by chance.
USC Information Sciences Institute
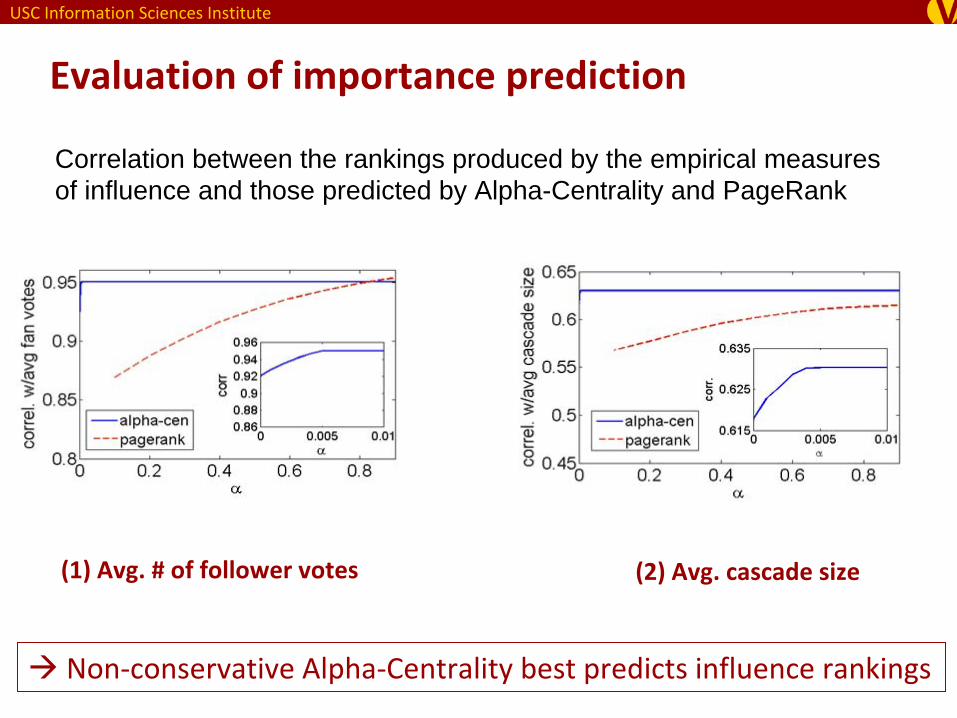
Evaluation of importance prediction
(1) Avg. # of follower votes (2) Avg. cascade size
Correlation between the rankings produced by the empirical measures of influence and those predicted by Alpha-Centrality and PageRank
Non‐conservative Alpha‐Centrality best predicts influence rankings

USC Information Sciences Institute
Time check?
USC Information Sciences Institute
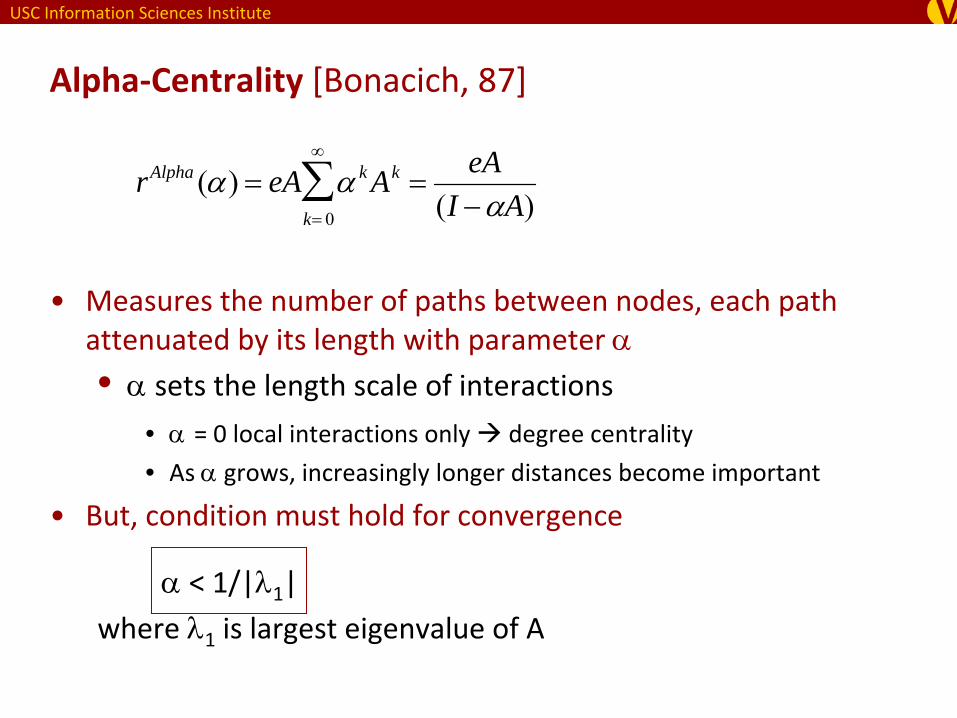
Alpha‐Centrality [Bonacich, 87]
•
Measures the number of paths between nodes, each path
attenuated by its length with parameter •
sets the length scale of interactions
•
= 0 local interactions only degree centrality
• As
grows, increasingly longer distances become important
•
But, condition must hold for convergence
< 1/|1
|
where 1
is largest eigenvalue of A
rAlpha () eA k Ak
k 0
eA
(I A)

USC Information Sciences Institute
Normalized Alpha‐Centrality
• No longer bounded by eigenvalue: holds for 0 1
• Parameterized centrality metric
sets the length scale of interactions•
Local: For = 0 leads to the same rankings as degree centrality
•
Meso: As
grows, increasingly longer distances become important
•
Global: As
1/1
, leads to the same rankings as eigenvector centrality
•Relation to Alpha‐Centrality•
For 0
< 1/1
leads to the same rankings as Alpha‐Centrality
•
For > 1/1
, rankings independent of
r Alpha ( ) eA k A k
k 0
k A k
k 0
iji, j
n
[Ghosh and Lerman, Parameterized Metric for Network Analysis, Physical Review 2011]
<_<_
<_

USC Information Sciences Institute
Applications to network analysis
•
RankingChange in ranking with a
• Leaders: individuals with high importance score• Bridges: individuals whose importance score grows with a
Mediate communication between communities
• Peripherals: low importance score
•
Community DetectionModularity maximization [Newman & Girvan, 04]
• Modularity Q=(actual connectivity)‐(expected connectivity)
• Connectivity measured using normalized Alpha‐Centrality
USC Information Sciences Institute
Advantages
Multi‐scale analysis of networks•
Parameter sets the length scale of interaction
Connect the rankings produced by well‐known local and global centrality metrics
•
Degree Centrality
•
Eigenvector Centrality
Can differentiate between locally and globally connected nodes and structures
•
Leaders and bridges
•
Local and global communities
USC Information Sciences Institute
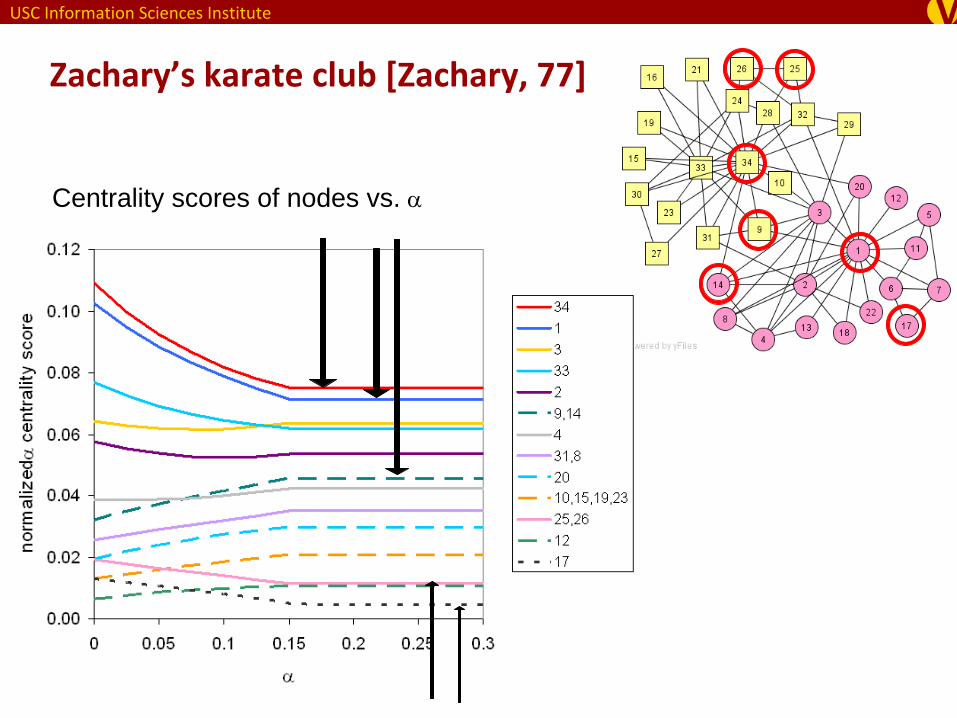
Zachary’s karate club [Zachary, 77]
Centrality scores of nodes vs.

USC Information Sciences Institute
Communities in Zachary’s karate club network
= 0
< 0.14
>= 0.14
0.1487)Newman’s modularity
USC Information Sciences Institute
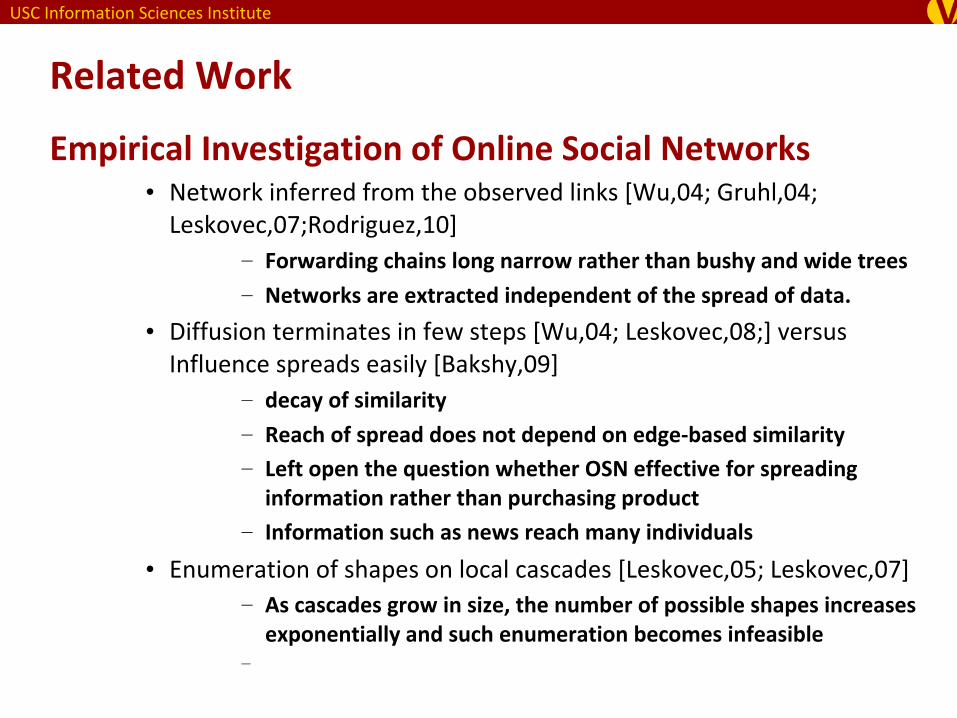
Related Work
Empirical Investigation of Online Social Networks•
Network inferred from the observed links [Wu,04; Gruhl,04;
Leskovec,07;Rodriguez,10] −
Forwarding chains long narrow rather than bushy and wide trees
−
Networks are extracted independent of the spread of data.
•
Diffusion terminates in few steps [Wu,04; Leskovec,08;] versus
Influence spreads easily [Bakshy,09]−
decay of similarity
−
Reach of spread does not depend on edge‐based similarity−
Left open the question whether OSN effective for spreading
information rather than purchasing product
−
Information such as news reach many individuals
•
Enumeration of shapes on local cascades [Leskovec,05; Leskovec,07] −
As cascades grow in size, the number of possible shapes increases
exponentially and such enumeration becomes infeasible
−
USC Information Sciences Institute
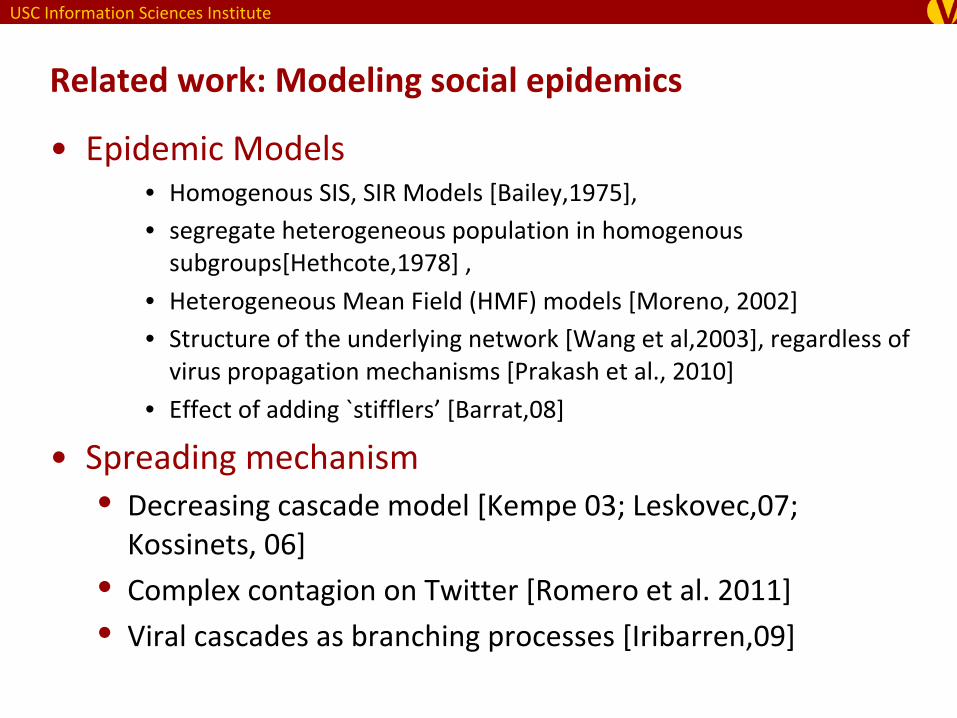
Related work: Modeling social epidemics
•
Epidemic Models• Homogenous SIS, SIR Models [Bailey,1975], • segregate heterogeneous population in homogenous
subgroups[Hethcote,1978] ,
• Heterogeneous Mean Field (HMF) models [Moreno, 2002]• Structure of the underlying network [Wang et al,2003], regardless of
virus propagation mechanisms [Prakash
et al., 2010]
• Effect of adding `stifflers’
[Barrat,08]
•
Spreading mechanism• Decreasing cascade model [Kempe
03; Leskovec,07;
Kossinets, 06]
• Complex contagion on Twitter [Romero et al. 2011]
• Viral cascades as branching processes [Iribarren,09]

USC Information Sciences Institute
Related work: Centrality and diffusion
•
Network structure and diffusion processes• Epidemic models and spectral radius [Wang,03]
• Random walk and Laplacian
[Chung,97]
•
Most centrality metrics make implicit assumptions about network flow [Borgatti, 05]
• We advocate a simpler classification scheme
•
Ranking of Twitter users • Comparison with centrality metrics [Cha,10; Lee,10]
•
Community detection• We extend the edge‐based modularity maximization
[Newman,04] to take path‐based connectivity into account
USC Information Sciences Institute
Conclusion
Empirical Investigations of Networks•
Leverage the power of OSN
•
Studied Digg
and Twitter
•
Structure•
Degree distribution
•
Dynamics‐Information Propagation•
How stories evolve?
•
Metric to Quantify Cascades−
Macroscopic and Microscopic Properties
•
Puzzle: Why are cascades so small?−
Analysis and Simulations
−
Clustering
−
Contagion Mechanism‐FSM
USC Information Sciences Institute
Conclusion
Modeling Networks•
Structure and Functionality
•
Dynamic Processes−
Conservative and Non‐Conservative
•
Prediction of dynamics uses structure (Spectral radius)−
Epidemic Models
−
Non‐Conservative
•
Prediction of structure uses dynamics−
Importance and Centrality Metrics
−
Conservative and non‐conservative
−
How to choose centrality metrics?
−
Evaluation of centrality metrics
−
Alpha centrality better models information diffusion
−
Parameterized and useful for network analysis
−
Normalized Alpha Centrality
−
Communities, leaders and bridges

USC Information Sciences Institute
Thanks
Collaborators• Rumi
Ghosh
(USC)
• Greg Ver
Steeg
(USC)
• Tad Hogg (IMM)
• Tawan
Surachawala
(USC)
Funding agencies• NSF• AFOSR• AFRL