Nature of Fuel Ethanol—Roger Listenberg, National Ethanol ...
Dynamics of Evolution in the Global Fuel-Ethanol Industry
Jin Hooi Chan and David Reiner
March 2011
CWPE 1129 & EPRG 1111

www.eprg.group.cam.ac.uk
EP
RG
WO
RK
ING
PA
PE
R
Abstract
Dynamics of Evolution in the Global Fuel-Ethanol Industry
EPRG Working Paper 1111 Cambridge Working Paper in Economics CWPE 1129
Jin Hooi Chan & David Reiner
We employ a value chain analysis approach to examine the forces shaping the industry structure, entry and inter-firm governance modes. Forty largest global and regional companies in the ethanol manufacturing stage have been classified according to their pre-entry industry of origin. Firms with pre-entry history in feedstock supply have shown higher resilient to market shock especially compared to de novo firms. In addition, we observe a trend of dual-directional vertical integration. Firms backward integrate to secure feedstock supply; firms forward integrate to gain access to the retail market. Security of feedstock has been identified as a critical success factor of the manufacturer in this resource intensive industry. Another critical success factor is gaining control over the end user market via forward integration. We propose that critical success factor is the important determinants of inter-firm governance mode.
Keywords Inter-firm governance, Biofuels, Entry, Vertical integration
JEL Classification L11, L70,N5, Q42
Contact [email protected]; [email protected] Publication March 2011 Financial Support ESRC-Cambridge Commonwealth Trust Dorothy
Hogdkin Postgraduate Award
EPRG No 1111
1
Dynamics of Evolution in the Global Fuel-Ethanol
Industry1
Jin Hooi Chan2 &
Dr David Reiner
26 Oct 2010
Abstract There is a growing body of literature on the rapidly expanding global fuel-ethanol industry but little understanding on the evolution of the structure and the dynamics of industrial governance. We employ a value chain analysis approach to examine the forces shaping the industry structure and inter-firm governance modes. Forty largest global and regional companies in the ethanol manufacturing stage have been selected. We classify the firms according to pre-entry industry of origin and study the vertical movement of these firms along the value chain. Firms with pre-entry history in feedstock supply have shown higher resilient to market shock especially compared to de novo firms, which is in line with observation by Klepper & Simons (2000). In addition, we observe a trend of dual-directional vertical integration. Firms backward integrate to secure feedstock supply; firms forward integrate to gain access to the retail market. On one hand, security of feedstock is a critical success factor of a fuel-ethanol manufacturer as it is a resource intensive industry with high cost exposure to feedstock. Another critical success factor for the industry is to gain control over the end user market via forward integration. Incumbent oil and gas firms currently dominate the fuel-ethanol retail market; ironically, fuel ethanol is the substitute of their product (i.e. gasoline). We propose that critical success factors are the important determinants of inter-firm governance mode rather than efficient based transaction cost or agency theory. Introduction The global bio-ethanol industry has expanded rapidly in the past decade, increasing at an average annual rate of 15%3. About 80% of the production is supplied to the 1 This paper is expected to be published in March 2011 in the Working Paper Series of Electricity Policy Research Group, Judge Business School & Faculty of Economics, University of Cambridge. 2 Corresponding Author – [email protected]; PhD Candidate, Judge Business School, University of Cambridge Acknowledgments : Dorothy Hodgkin Postgraduate Award 3 Calculated based on data estimated by F.O. Lichts as in Figure 3.

EPRG No 1111
2
rapidly growing fuel-ethanol market and the rest is for the rather stable demand in the industrial and beverage sectors. Fuel-ethanol, as an additive/substitute for gasoline in Otto-cycle transport fuel market, is gaining substantial market share, especially in Europe, North and South America and reached about 6% of the global gasoline fuel market in 20094. Bio-ethanol, or biofuels in a broader sense, has attracted substantial research. There is a growing body of literature related to biofuels, which has been primarily preoccupied with policy instruments (Sorda et al., 2010; Balat & Balat, 2009), environmental impacts and greenhouse gas emission reductions (Searchinger et al., 2008; Kim et al., 2009)), food and poverty interactions (FAO, 2009; Pfuderer & Castillo, 2008), and technology advances (Himmel and Bayer, 2009; Escobar et al., 2009; Balat et al., 2008). Hitherto, there has been however no attempt to understand the evolution of the structure of this rapidly growing industry and the dynamics of industrial governance in a complex political economy landscape over time. We analyse the forces behind the evolution of the bio-ethanol industry by examining the dynamics along the entire value chain, with a particular focus on the core stage of ethanol manufacturing. The global bio-ethanol value chain can be divided into three distinct groups - the upstream agro-commodity stages, the midstream ethanol manufacturing stages, and downstream transport fuel stages. Three forces that shape the evolution of the structure of industry will be discussed in a greater detail, namely: (i) permeable industry boundaries, (ii) security of supplies and (iii) access to the retail market. These forces encourage a trend towards vertical integration as observed in recent development in the industry. The impact of permeability of industry boundaries has been observed by Fransman (2001) in the study of telecommunications industry. The permeability of boundaries can be seen in the ease of entry from neighbouring industries. There are many different types of industry players with different industry of origin and de novo firms entering the bio-ethanol industry at various stages along the value chain, especially in the manufacturing stage. These actors include engineering companies, major oil & gas firms, agro-food processors and agro-commodity traders. These companies have their respective competitive advantages in terms of resources and experience. Klepper & Simons (2000) have also observed the heterogeneity among entrants in terms of pre-entry experience and background in television receiver industry. The second driving force is security of supply. There are two important supply points along the value chain - supply of feedstock for ethanol production and supply of ethanol for gasoline blending. The majority of ethanol manufacturers face substantial risks in feedstock supply and price volatility. In many countries, ethanol is neither the primary market nor large enough to have influence on pricing of major feedstock. This has created a propensity towards upstream integration in the industry, but the degree of integration from market to market has been strongly influenced by local and national political economy of feedstock production and supply markets. On the other hand, upstream integration to manufacturing stage in order to secure ethanol supply 4 Ethanol data based on estimation done by F.O. Lichts. Gasoline data from Euromonitor.

EPRG No 1111
3
has been relatively easier and politically less sensitive. Therefore, a stronger wave of integration is observed in this stage. The third dynamic that shapes the industry structure is access to the retail market. There are three markets along the value chain. The first market is the market for feedstock. Feedstock producers and traders integrate downstream to ethanol manufacturing in order to create a stable market for their feedstock. It is also inline with the motivation of pursuing additional downstream rents. The other two markets – ethanol and retail fuel – are closely linked. The size of the ethanol market is linked to the size of retail fuel market, in particularly its ethanol component. There are mainly three stages - low blend (E5 or E10), mid blend (E15 to E25) and high blend (E85 or E100)5. The low blend market is highly regulated in all markets. Governments have created markets for ethanol blending with a specific blending ratio and consequently have limited the expansion of these markets by putting a cap on blending ratio. Table 1 provides the main biofuels policy instrument for major producing and consuming countries/region and their respective blending market stages. The blending caps vary across countries and change over time, depending on the economics of oil market and agricultural & ethanol industry, political pressure from lobbying groups of industries and/or technical/design/emission issues of automobiles. In order to break through the cap set by the government and a market strangled by oil and gas industry, ethanol manufacturers integrate upstream to gain market access particularly in the high blend markets. It is a niche market where petroleum refiner has smaller market power and has not much interest to develop it. Strategic consideration as a basis of vertical integration has been suggested by Porter (1980) who wrote that firms employed vertical strategy to assure supply of inputs and market for outputs. Perry (1988:206) proposes that "assuring supply" should mean more than simply acquiring inputs at low prices or avoiding random fluctuations in price but include the ability to obtain imput at the prevailing input prices; and "assuring market" should mean much more than selling outputs at high prices but the ability of firm to sell a quantity of output at the prevailing output prices. We propose that "assuring supply" is a paramount factor in a resource base industry, especially during scarcity. And "accessing market" is a paramount factor when incumbent's product is to be substituted. This fast-growing ethanol industry with its special characteristics of crossover from agricultural value chain to energy value chain provides a different evolution patterns and dynamics in the formation of industrial structure. Working together with other political economy factors, these three fundamental forces have shaped the structure of bio-ethanol industry. We observe not only the creation of giant horizontally consolidated firms but also some evidence of increasing vertical integration. Table 1: Biofuel Policy and Blending Segments in Four Major Countries/Region
5 E denotes ethanol. E5 is a fuel with 5% ethanol content in gasoline. This low blend ethanol-gasoline is marketed to existing car mostly without any requirement for engine modification. Government regulates the percentage of blending and the quality to protect consumer’s right. High blend ethanol-gasoline, for example E85, serves a niche market – new car designed to run specifically for the blending ratio. There are a few countries with markets for mid-blending ratio of 15% to 25%.

EPRG No 1111
4
No Country & Main Policy Instruments Blending Segment Remarks 1 USA Energy Policy Act, 2005 and Energy Independence and Security Act, 2007: demands blending of renewable and set a target of 36 billion gallons of biofuels consumption by 2022. Each state has a quota to meet but do not specific mandatory blending requirements. Incentives: federal tax credit and import tariff as well as states specific subsidies.
E10 Prior 1978 Energy Tax Act: for light duty motor vehicles E15 Approved by Environmental Protection Agency in Oct 2010 over oil industry objections for light duty motor vehicles manufactured in 2007 and since. Approved in Jan 2011 for vehicle manufactured from 2001 to 2006. Up-to E85 For flexifuel car with small but growing market 2 Brazil National Alcohol Program -Pró-Álcool, 1975 & Federal Degree No.83, 700/1979. Currently no subsidies provided to the ethanol industry but to small sugarcane producers in the poorer region of north-northeast. Nevertheless, there are higher taxes on gasoline. Temporarily elimination of import tariff until end of 2011 - Resolution No.21/2010 of the Foreign Trade Chamber.
E10-E22 Mandatory blending with varying ratios e.g. Petroleum National Council No. 144/1984, National Environmental Council Conama Resolution No.18/1986. E22 National Bill No.8, 723/1993, set the mandatory blending ratio nationwide E20-E25 anhydrous ethanol Federal Degree No.3, 966/2001 allows varying ratios across country. E100 hydrous ethanol Since 1979, running on special made engine Up-to E100 For flexifuel car with aggressively growing market, ~70-90% new car sold in recent 5 years. 3 EU Biofuels Directive 2003/03/EC - national indicative targets of 2% by the end of 2005 and 5.75% by the end of 2010, based on energy content. Renewable Energy Directive, 2009/28/EC - a mandatory target of 10 % share of energy from renewable sources in transport by 2020. Differentiated tax regimes supporting biofuel to gasoline. Impose import tax for fuel-ethanol.
5% v/v Directive 98/70/EC on the quality of petrol and diesel fuels. 10% v/v Directive 2009/30/EC - regards the specification of petrol, diesel and gas-oil and introducing a mechanism to monitor and reduce greenhouse gas emissions. 4 China The 10th Five-Year Plan (2001-05): Specific Project Development - initiated four fuel-ethanol plants to consume degraded government grain stockpiles. The 11th Five-Year Plan (2006-10): set targets at 5.22 million tonnes by 2010; 15 million tonnes by 2020. The 12th Five-Year Plan (2011-05): target 1 million tonnes by 2015 (expected). Pegged fuel-ethanol price to retail gasoline price and subsiding producers for losses. Import tax reduced from 30% to 5% in 2010.
E10 Trial programme of E10 extended to fully in six provinces (Heilongjiang, Jilin, Shenyang, Henan, Anhui, Guangxi) and partially in another four provinces.
Sources: Authors

EPRG No 1111
5
In this paper, we first provide a description of the core stages in the value chain of the industry. The second section describes the degree of horizontal concentration in the ethanol manufacturing stage on a global scale. The top 30 manufacturers are ranked and their market shares are estimated. Concentration ratios are also calculated and discussed. Section three examines vertical integration of the top 30 global firms in the manufacturing stage. In addition, 10 other major regional or national firms in the value chain are also included in the analysis. We analyse the fundamental forces that shape the structure and the drivers of vertical integration in the industry. Finally, a discussion is offered to compare the empirical reality of the ethanol industry with the various theories of vertical integration. We propose that a wider perspective to include socio-political factors into the analysis of governance structure is important to understand the trends in this new and fast growing fuel-ethanol industry. Bio-ethanol Value Chain Bio-ethanol value chain is created by a crossover of two value chains, i.e. the agro-commodity value chain and energy value chain as depicted in Figure 1. The upstream of the industry is the traditional agricultural value chain, which consists of three stages - the land, cultivation, and trading and transporting of agricultural produces. The midstream consists of ethanol manufacturers and traders. An auxiliary stage, which is not a stage along the main value chain, is also included to capture technology providers and other suppliers of production inputs such as chemicals, yeast, enzymes and utility. The downstream stages are similar to the downstream chains of conventional transport fuel, where ethanol is blended and distributed to retail fuel stations.
Figure 1: Ethanol Value Chain: A crossover of Agro-commodity to Energy Sources: Authors
EPRG No 1111
6
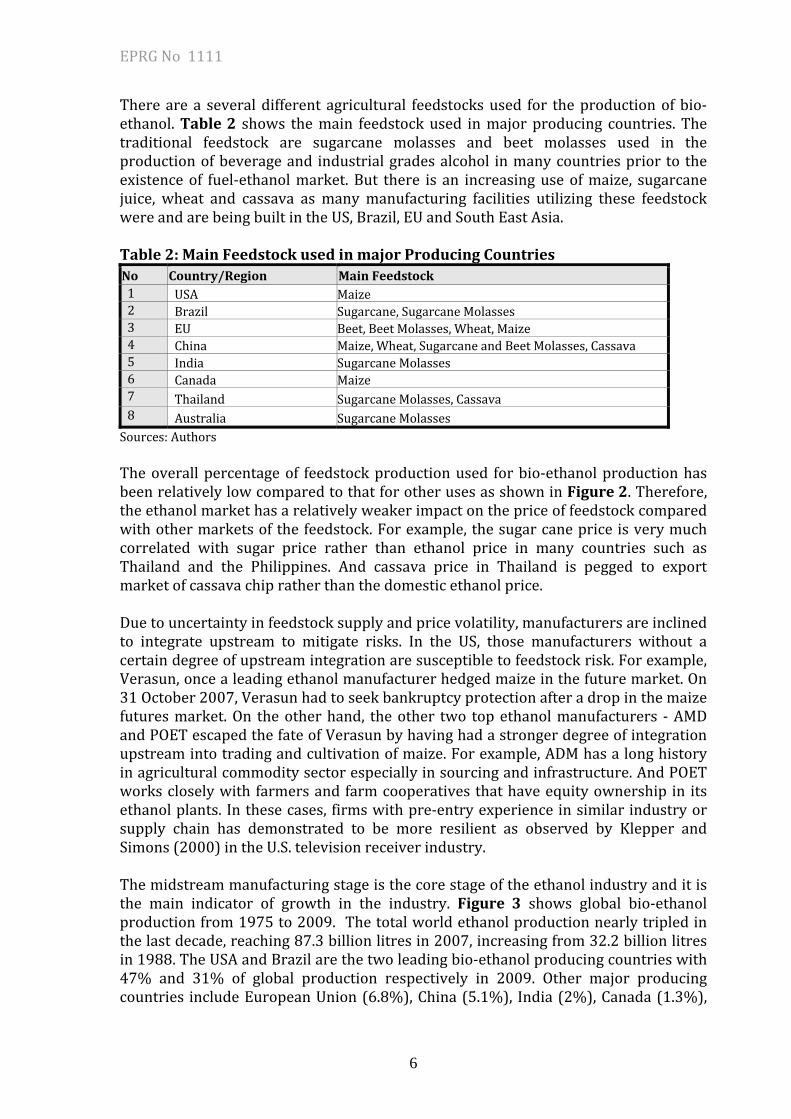
There are a several different agricultural feedstocks used for the production of bio-ethanol. Table 2 shows the main feedstock used in major producing countries. The traditional feedstock are sugarcane molasses and beet molasses used in the production of beverage and industrial grades alcohol in many countries prior to the existence of fuel-ethanol market. But there is an increasing use of maize, sugarcane juice, wheat and cassava as many manufacturing facilities utilizing these feedstock were and are being built in the US, Brazil, EU and South East Asia. Table 2: Main Feedstock used in major Producing Countries No Country/Region Main Feedstock1 USA Maize 2 Brazil Sugarcane, Sugarcane Molasses 3 EU Beet, Beet Molasses, Wheat, Maize 4 China Maize, Wheat, Sugarcane and Beet Molasses, Cassava 5 India Sugarcane Molasses 6 Canada Maize 7 Thailand Sugarcane Molasses, Cassava 8 Australia Sugarcane Molasses Sources: Authors The overall percentage of feedstock production used for bio-ethanol production has been relatively low compared to that for other uses as shown in Figure 2. Therefore, the ethanol market has a relatively weaker impact on the price of feedstock compared with other markets of the feedstock. For example, the sugar cane price is very much correlated with sugar price rather than ethanol price in many countries such as Thailand and the Philippines. And cassava price in Thailand is pegged to export market of cassava chip rather than the domestic ethanol price. Due to uncertainty in feedstock supply and price volatility, manufacturers are inclined to integrate upstream to mitigate risks. In the US, those manufacturers without a certain degree of upstream integration are susceptible to feedstock risk. For example, Verasun, once a leading ethanol manufacturer hedged maize in the future market. On 31 October 2007, Verasun had to seek bankruptcy protection after a drop in the maize futures market. On the other hand, the other two top ethanol manufacturers - AMD and POET escaped the fate of Verasun by having had a stronger degree of integration upstream into trading and cultivation of maize. For example, ADM has a long history in agricultural commodity sector especially in sourcing and infrastructure. And POET works closely with farmers and farm cooperatives that have equity ownership in its ethanol plants. In these cases, firms with pre-entry experience in similar industry or supply chain has demonstrated to be more resilient as observed by Klepper and Simons (2000) in the U.S. television receiver industry. The midstream manufacturing stage is the core stage of the ethanol industry and it is the main indicator of growth in the industry. Figure 3 shows global bio-ethanol production from 1975 to 2009. The total world ethanol production nearly tripled in the last decade, reaching 87.3 billion litres in 2007, increasing from 32.2 billion litres in 1988. The USA and Brazil are the two leading bio-ethanol producing countries with 47% and 31% of global production respectively in 2009. Other major producing countries include European Union (6.8%), China (5.1%), India (2%), Canada (1.3%),

EPRG No 1111
7
Thailand (0.8%), Columbia (0.4%) and Australia (0.3%). Production is expected to increase in the next few years not only in the USA and Brazil but also across many countries in Latin America, Africa and Asia. It is due to a large number of distilleries will be coming on stream in view of recent expansion in investment and markets driven by both favourable policies and its competitiveness as a gasoline substitute.
Figure 2: Percentage of Utilisation of Feedstock In Ethanol Production Sources: Data from F.O. Licht’s 7(5), 2008 & FAO Online Statistics on Agricultural Products 2009
Figure 3: Global Bio-ethanol Production, 2009 Sources: Date based on World Ethanol and Biofuels Report, 6(4) 2007 & 8(16) 2010 by F.O. Lichts. Note: Fuel ethanol production by countries in colour coded bars. The top series is the total global production of non-fuel ethanol. Data for non-fuel production prior to 1998 is not available. The above estimation is derived from extrapolation.

EPRG No 1111
8
Figure 4 shows the market cycle of the bio-ethanol industry. It is currently in the Growth stage with a characteristic of a rapid increase in market penetration. Nevertheless, the potential for further growth depends on a number of factors, in particularly land and feedstock availability and costs. This is especially contentious for food based feedstock in long-term as the competition with food escalated and receiving heavy social political pressure. Other important factors that could induce or limit the growth of fuel-ethanol industry are the relative price of feedstock and oil, certainty in government policies, environmental sustainability requirements of these policies and any possible technological breakthrough in 2nd generation production technology, in particularly technology using non-food based feedstock. There are many government, research institutes and private companies have begun to invest heavily in 2nd generation fuel-alcohol research. Any breakthrough could have a disruptive effect on the production processes and feedstock requirements as well as pushing the market penetration of ethanol much further into the share of fossil gasoline.
Figure 4: Bio-ethanol Market Cycle Source: Authors In the downstream stages, the majority of bio-ethanol produced is to supply the rapidly expanding fuel-ethanol market. In 2009, about 84% (73 billion litres) of bio-ethanol was produced for fuel-ethanol market compared to 60% a decade ago. On the other hand, the beverage and industry markets are relatively stagnant, fluctuating between 13 and 16 billion litres as shown in Figure 3. Another feature of this industry is that the majority of fuel-ethanol produced serves domestic markets. Brazil as the main global exporter only exported 13% of the 25.2 billion litres it produced in 2009. The two major importers are the US and EU. Other major importing countries are Japan, South Korea and Canada. This trend could change when more countries, especially China, open its market for import.

EPRG No 1111
9
The bio-ethanol share in global oil supply was about 1.4% in 2009. For Otto-cycle transport fuel, ethanol contributed 5.7% by volume. The USA consumed 42,000 million litres of fuel-ethanol, which was about 7.4% by volume of total motor gasoline, followed by Brazil (22,650 million litres), which amounted to over 55% by volume of total motor gasoline. The EU27, China, Canada and Thailand respectively consumed 4,200, 1,700, 1,500 and 460 million litres as shown in Table 3. Fuel-ethanol is increasingly penetrating into gasoline markets as a substitute. Market share depends very much on government targets and mandates but it also varies with the relative price of ethanol to gasoline. There are other factors that could increase or be the barriers to the expansion of ethanol market share, which will be discussed in later sections. Table 3: Estimation of Ethanol Share in Otto-cycle Transport Fuel in 2009 Country Gasoline (million litres) Ethanol (million litres) % Ethanol by Vol. Global 1,227,000 74,443 5.7% USA 524,444 42,026 7.4% Brazil 18,462 22,650 55.1% EU 131,500 4,187 3.1% China 72,730 1,730 2.3% Canada 40,853 1,500 3.5% Thailand 7,063 460 6.1% Source: Gasoline data based on Euromonitor, Ethanol data based on US EIA & F.O. Lichts Horizontal Consolidation in the Ethanol Manufacturing Stage Over the last decade, there has been a strong trend towards merger and acquisition in the global ethanol manufacturing stage. We estimate the market concentration for the global ethanol manufacturing stage in order to identify top global and regional manufacturers. The global concentration ratios have also been calculated based on four-, eight- and twenty-firm ratios. The measure of market share is based on nameplate production capacity of each manufacturer. The production capacity of a manufacturer includes the capacity of all plants under its control or management. These include the design capacity at the year of interest, the capacity of new plant and expansion of existing plants under construction as of 2009. In the US, the difference between production and capacity share could be significant and with high volatility. For example there are idle plants especially those under bankruptcy administration. However, a firm's capacity (including near future capacity increase) is likely the best measure of its competitiveness because ethanol is an undifferentiated commodity (with the exception of differentiation by the criteria of sustainability & carbon emission reduction such as those stipulated in European Renewable Energy Directive). This is inline with the method used by U.S. Federal Trade Commission on calculating U.S. ethanol market concentration (FTC, 2009). For most plants, therefore, a firm's capacity has been used in the calculation but with an exception of Brazil.

EPRG No 1111
10
In Brazil, a distillery is normally an integral part of a sugar mill. The manufacturer adjusts the ratio of production for sugar to ethanol based on price signals of both commodities. Therefore, a firm's plant capacity might not reflect the full picture as manufacturer switching between ethanol and sugar production. Therefore, we see that the actual production is a better parameter reflecting on the balancing act of manufacturer on ethanol vs. sugar. Therefore, the actual production data is used for Brazil. In addition, there is no data available on total global production capacity. The denominator of the measurement of concentration is based on the actual global production of bio-ethanol in 2009. Therefore, these estimates of market shares and concentration ratios are expected to be on the high side6. Table 4 shows the top 30 global bio-ethanol manufacturers in 2009. The top three manufacturers are all domestic American players, i.e. ADM, POET, and Valero, controlling 7.9%, 6.8% and 5.5% respectively of global market share. The American agribusiness giant, Archer Daniels Midland Co. (ADM) bought Minnesota Maize Processors, the then 3rd largest ethanol manufacturer in 2002, increasing its total annual capacity to 4.2 billion litres of ethanol. As a result of continued expansion and building new facilities, ADM was the largest manufacturer in the US (11%) and also the world (7.9%) in 2009. POET came second with 6.8%. Even through POET does not have controlling equity stake in all its name-plated distilleries, it expanded rapidly in the last five years especially in the number of distilleries it manages and the volume of ethanol it markets. Valero, the oil refiner, became the third largest manufacturer by acquiring assets from bankrupted firms, mostly those of Verasun in 2009. Some ethanol manufacturers operate across several regions. The best example is Abengoa Bioenergy, which has a significant presence in the manufacturing stage on the three most important continents for ethanol production and consumption i.e. USA, South America and Europe. The total installed capacity is expected to reach 4.1 billion litres by 2010. It was the 4th largest manufacturer in the world with a 5.5% market share in 2009. Cosan SA Industria e Comercio, the world’s largest sugarcane processor and the largest ethanol manufacturer in Brazil was in the 5th place globally with a 2.8% global share. As of 2009, Cosan owned 23 cane processing plants increased from 17 in 2007. The mills crushed 44.2 million tonnes of cane, about 10% of total Brazilian harvested in 2008/09 session. Cosan produced more than 2.4 billion litres of ethanol in 2009, up from 1.4 billion litres in 2007. 6 The data used is from publicly available information. The Renewable Fuel Association (RFA) of the USA publishes annual production capacity for each manufacturer, capacity expansion and new plant under construction. The Brazilian Sugarcane Industry Association (UNICA) publishes annual ethanol production of manufacturers in Brazil. Other sources of data include public announcements, industrial magazines, and manufacturers’ websites, which provide information on the capacities and expansion/construction plans of the company.

EPRG No 1111
11
Table 4: Top 30 Global Manufacturers in 2009 (CR4=25.0, CR8=34.3, CR20=49.3)
No Holding Company HQ
Location Main Production
Location Production/Capacity (million litre/year)
Global Share (%)1 ADM USA USA 6,937 7.9% 2 POET USA USA 5,957 6.8% 3 Valero USA USA 4,806 5.5% 4 Abengoa Spain USA/EU/Brazil 4,094 4.7% 5 Cosan Brazil Brazil 2,468 2.8% 6 Shree Renuka India Brazil/India 2,020 2.3% 7 GPRE USA USA 1,860 2.1% 8 ETH Bioenergia Brazil Brazil 1,748 2.0% 9 Hawkeye USA USA 1,628 1.9% 10 Bunge USA Brazil 1,486 1.7% 11 Tereos France France/Brazil 1,415 1.6% 12 Louis Dreyfus France Brazil 1,364 1.6% 13 Andersons USA USA 1,066 1.2% 14 White Energy USA USA 1,000 1.2% 15 Pacific Ethanol USA USA 961 1.1% 16 COFCO China China 925 1.1% 17 Biofuel Energy USA USA 891 1.0% 18 Tate&Lyle USA USA 814 0.9% 19 Glacial Lake Energy USA USA 802 0.9% 20 Aventine RE USA USA 802 0.9% 21 Noble HK Brazil 800 0.9% 22 Jian Shenghua CN CN 750 0.9% 23 AltraBiofuels USA USA 711 0.8% 24 Sudzecker Germany Germany 700 0.8% 25 Sao Martinho Brazil Brazil 676 0.8% 26 Cristal Union France France 650 0.7% 27 Global Ethanol Australia USA 600 0.7% 28 PedroAgroindustry Brazil Brazil 586 0.7% 29 Moreno Brazil Brazil 569 0.7% 30 Zilor Brazil Brazil 559 0.6% Note: Information and ranking is based on data and information as of March 2010. Source: Authors. Shree Renuka was in the 6th place with a 2.1% share after its acquisition of Group Equipav in Brazil on 21 Feb 2010. The second largest ethanol manufacturer in Brazil, ETH Bioenergy, was in the 8th place after GRPE (7th) of the USA. With continuous expansion and acquisition, ETH Bioenergy formed in the mid 2007 is expected to have ethanol production capacity up to 1.7 billion litres by 2012. International commodity giant, Bunge was in the 10th place after another US manufacturer, Hawkeye (9th). Bunge continues to expand with the acquisition of Moema Grupa on 11 Feb 2010. Two other international commodity giants, Tereos and Louis Dreyfus were in 11th and 12th places respectively after some acquisitions in Brazil. Globally, the four-firm concentration ratio was only at 25% suggesting there was little oligopolistic market power in international market. However, if consolidation trends

EPRG No 1111
12
continue in the USA and Brazil, there is a possibility that fuel-ethanol production giants will be created, which will have significant global market power. Vertical Integration in the Ethanol Industry From the list of top manufacturer, we noticed that their pre-entry backgrounds are very diverse. They come from not only agricultural and fossil fuel chains but also technology companies and de novo firms of new entrepreneurial start-ups as illustrated in Figure 5. We investigate the degree of vertical integration and drivers of the changes in the bio-ethanol industry structure by examining 30 largest global manufacturers. In order to capture specific aspects of the integration trends, an additional 10 players in the value chain has also been selected. They are either major regional manufacturers or oil and gas corporations with a certain degree of involvement in the bio-ethanol chain.
Figure 5: Pre-entry Background of Global Ethanol Manufacturers Sources: Authors In addition to the origin industry of the manufacturers, their vertical involvement in the bio-ethanol value chain is also investigated. These forty firms have been categorised into five main groups and colour coded based on their pre-entry background as in Table 5. These five main groups are: i) Group 1: Technology, engineering and construction firms; ii) Group 2: Farmer & farmer cooperatives and Agro-food & Sweetener Manufacturers. They are firms with a long history in food/sweetener production, and some in ethanol production as well; iii) Group 3: Agriculture commodities traders. Their main activities are sourcing and market agriculture commodities, but some firms have diversified extensively or have been involved in food processing industry for a long time; iv) Group 4: De novo entrepreneurial start-ups with minimal or no background in the biofuel supply chain; and v) Group 5: Oil and Gas firms and downstream marketers of motor gasoline.
EPRG No 1111
13
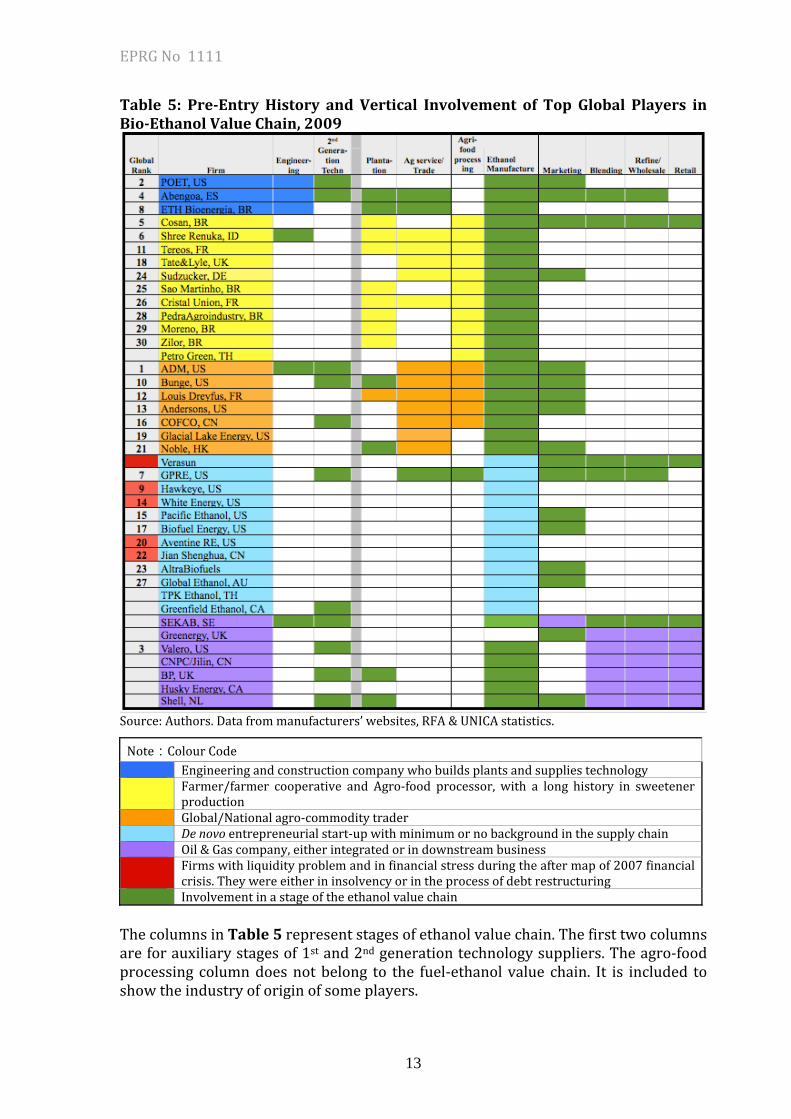
Table 5: Pre-Entry History and Vertical Involvement of Top Global Players in Bio-Ethanol Value Chain, 2009
Source: Authors. Data from manufacturers’ websites, RFA & UNICA statistics.
The columns in Table 5 represent stages of ethanol value chain. The first two columns are for auxiliary stages of 1st and 2nd generation technology suppliers. The agro-food processing column does not belong to the fuel-ethanol value chain. It is included to show the industry of origin of some players.
Note:Colour Code Engineering and construction company who builds plants and supplies technology Farmer/farmer cooperative and Agro-food processor, with a long history in sweetener production Global/National agro-commodity trader De novo entrepreneurial start-up with minimum or no background in the supply chain Oil & Gas company, either integrated or in downstream business Firms with liquidity problem and in financial stress during the after map of 2007 financial crisis. They were either in insolvency or in the process of debt restructuring Involvement in a stage of the ethanol value chain

EPRG No 1111
14
In Table 5, these cells shaded in the colour of the corresponding firm denote the historical activities of the firm. Whereas, cells shaded in green indicate new business activities along the value chain that the firm is involved in. We observe that Group 1-Engineering firms, are not only involved in R&D on 2nd generation technology but have also expanded vertically into the manufacturing and other downstream activities of the value chain. The most vertically integrated firm in this group is Abengoa, which comes from an engineering & construction sector background, building distilleries all over the world. On the other hand, some ethanol manufacturers have also venturing into this auxiliary stage. In the USA, POET and ADM both design and build their own distilleries. A newcomer into this stage is Shree Renuka of India, which is a sugar-ethanol company that has operating units in both India and Brazil. In 2007, it acquired KBK, an engineering and construction company based in India, which builds distilleries throughout Asia. The firms with food processing background in Group 2 have been involved heavily in the ethanol manufacturing stage. They have a natural competitive advantage because of a long history of knowhow in feedstock processing and sourcing. Firms in Group 2 enjoy a high level of security of feedstock supply. There are only a few of these firms integrating further into downstream stages. For example, Cosan is the most vertically integrated ethanol firm in the world as seen by its involvement in every stage along the sugarcane-based ethanol value chain. In 2007, Cosan acquired ExxonMobil’s downstream operation in Brazil. In early 2010, it announced the signing of an MOU with Shell to form a giant ethanol group in Brazil. Similarly leveraging their pre-entry knowledge in feedstock supply and market capability, firms in Group 3, such as agricultural commodity traders, farmers and farmer cooperatives, have also ventured into the ethanol industry. They are primarily active in the manufacturing and marketing stages but shied away from the downstream blending, distribution and retailing businesses. In Group 4, de novo firms are new start-ups with generally little corporate background in the ethanol and related industry. They entered the market because of favourable government policies in ethanol manufacturing and use as transport fuel. Some firms have moved extremely quickly to expand horizontally by raising equity in the stock market or from private equity funds. Many of these firms in both the USA and Brazil have expanded too quickly and began to face liquidity problems during the 2007 global financial crisis such as Pacific Ethanol, Panda Ethanol and Renew Energy in the US. A few firms in the USA have also employed a vertical integration strategy especially into downstream in order to gain market access. For example, GPRE acquired Blendstar to penetrate into downstream blending and distribution markets. Before going into bankruptcy, Verasun Energy was the largest ethanol manufacturer with 11 operational plants and another 6 new plants in construction or under development. Verasun blended and marketed its own brand of E85 ethanol to 150 retailing stations across 15 states. The final group is oil and gas corporations. Many corporations with downstream gasoline businesses have to comply with national policies on ethanol blending and have therefore become involved in the value chain. Oil and gas firms have diverse

EPRG No 1111
15
interests in moving upstream along the ethanol value chain. Their involvement in sourcing and trading ethanol has been very substantial already. For example, Greenergy, claimed to be the top UK’s road fuel supplier and have a 20% market share, is also one of the largest ethanol suppliers in the UK with extensive upstream sourcing and logistic capabilities. Shell and BP have been moving and trading large quantities of ethanol globally. BP has also claimed that it has blended and distributed 2.89 and 0.34 billion litres of fuel-ethanol in 2007 respectively in the USA and Europe, which in total is about 6.5% of the world’s downstream market share in 2007. In 2008, BP has also committed to purchase and market 103 million litres of fuel-ethanol in Australia. On the other hand, Shell claimed to distribute more than 5 billion litres of ethanol in 2007. Total and Statoil have also marketed ethanol blended fuel in their respective domestic markets. In addition, these firms have shown interest in moving further upstream into the manufacturing of ethanol and supplying of feedstock. BP has invested in two major greenfield projects in Brazil and a 420 million litres distillery joint venture with British Sugar and Du Pont in the UK. BP is expected to have a total installed capacity of 1.42 billion litres if all its projects materialised. On the other hand, Shell has taken a big step in the proposed JV with Cosan. Valero, one of the largest refiners in the USA, has invested substantially in ethanol production units and disposing some of its petroleum refining facilities (Valero, 2010). In 2009, it was the third largest ethanol manufacturer in the USA and the world. The oil and gas giants have also heavily invested7 in R&D of various 2nd generation technologies in bio-alcohol fuels with JV and acquisition of some biotech firms. Drivers of evolution in ethanol industry structure The bio-ethanol industry is not a new industry but rather one with a long history of serving the beverage and industrial markets. Nevertheless, fuel-ethanol industry is a rather new in many countries and firms. Rent-seeking actors venture into this new and rapidly growing market trying to occupy and extracting rents along the ethanol value chain. It should also be noted that firms predominantly operate in downstream are integrating upstream and vice versa. The bi-directional movement contradicts assumption that firms seek to occupy the highest rent stage in the value chain. Downstream integration into the manufacturing stage by engineering firms, traditional food processors and commodity traders could be understood by taking a resource-based view. The strategic resources available to the firm could be utilised by the firm to gain long-term competitive advantage (Wernerfelt, 1984). The firm utilises its resources, e.g. technological knowhow or feedstock supply, to develop a new line of businesses in an expanding market. Based the analysis above, we propose that the primary factor that motivates ethanol manufacturing firms to integrate upstream is for security of supply for feedstock. Security of supply is in terms of quantity required as well as at a stable price. As shown in Figure 2, various feedstocks for ethanol production have their existing markets, which are far larger. Ethanol manufacturer is a price taker in most of the market conditions. 7 Accurate estimation is difficult because acquisition cost is normally not fully disclosed.
EPRG No 1111
16
However, there are socio-economy and political aspects of integration in upstream cultivation stages, which might incentivise or prohibit integration. Land rights and ownership structure in a specific country are important factors that shape the governance structure of this stage. For example, there are land ownership restrictions based on whether the actor is an individual or corporation, local or foreign, when seeking control of a large piece of land for cultivation. But these restrictions are less stringent, for example in Brazil, compare with those in countries such as China, the Philippines and Indonesia. In the cultivation stage, type of crop is an important factor. Some crops require substantial input such as seeds, fertiliser and pesticides. Other such as cassava requires only one off seeding purchase and the next planting material is obtained from previous harvesting. Dependency on substantial farm inputs and credits could be a factor for integration in this stage. But, on the other hand, farm size, farm management, and farm labour will also have a significant impact on how and whether upstream integration may happen. For example, high number of small size family farms in cassava cultivation in central Thailand makes equity or even contract farming prohibitive when ethanol manufacturer attempts to integrate upstream. On the other hand, the traditional sugar-ethanol industry in Brazil owns a substantial portion of their sugarcane land or in long-term contracts with large farmers. However, upstream integration into the feedstock production stage by oil and gas firms is not yet prevalent. Most oil and gas firms are not familiar with the traditional agricultural sector or agricultural commodity markets. BP and Shell chose to invest in the producing stage in Brazil rather than the USA, which might be attributable to sugarcane based ethanol delivering more environmental and carbon emission reduction benefits than their maize-based counterpart in the USA. Nevertheless, one of the crucial factors is due to a lesser concern on security of supply of sugarcane. The risk could be more easily mitigated because of site-specificity of cane due to its bulkiness. Moreover, upstream integration of oil and gas firms into manufacturing stage will of course enhance security of supply of ethanol, as the firms are required to fulfil regulatory targets. On the other hand, firms in the refining sector without upstream oil and gas exploration business are also moving out of this increasing lower margin business. This type of firm is venturing into a new substitute, ethanol, and seeking rents in this new industry. A typical example is Valero. Other gasoline refiners and distributors, which have been moving upstream to source and market blended products, include Suncor in the USA, and Greenergy in the UK. On the other hand, the price of gasoline does have some bearing on the price of ethanol in particular in the US market (CBOT futures prices of ethanol and gasoline). Manufacturer’s margin could be squeezed with a high feedstock price but a low ethanol price. In most countries, with notable exception of Brazil, these stages are dominated by the downstream oil and gas businesses. Ethanol volume is relatively small compared to gasoline in the overall blending. As petroleum refining capacity in excess in most parts of the world, refiners are generally reluctant to pursue ethanol blending and putting barriers on government’s aspiration to mandate any blending.

EPRG No 1111
17
For example, oil and gas firms struggled with excess refining capacity and were non-cooperative with the Japanese government in pilot rollouts of ethanol programme in the 2000s. Ethanol manufacturers such as SEKAB in Sweden and Verasun in the USA have integrated downstream, especially into the higher blend market stage that might over the long-term provide a solution to the above situation. In our analysis, we observe that there have been a substantial number of entries from neighbouring industries indicating ethanol industry boundaries are highly permeable. This permeability has created a structure where groups of firms with diverse pre-entry industry backgrounds and resources compete at various stages along the value chain. In summary, our analysis shows four phenomena of integration along the value: 1) Backward integration of manufacturers to farming/commodity trading. This is less prevalent in both the US and Brazil. Barriers of entry could be too high including capital requirements, skills, and land acquisitions. 2) Backward integration of oil & gas firms into manufacturing of ethanol is increasing but lagging, possibly due to inertia or mismatch between the set of organisational skills required (Teece at al., 1997) for conventional operations (in oil and gas, especially upstream activities) and those of the new venture (agro-business), including different in investment scale and expected returns, inexperience in agricultural commodity markets, agricultural management and social political aspects of agricultural activities. Nevertheless, we noticed a large-scale entry by Valero, the largest independence crude refiner in the US into the manufacturing stage. Other refiners in the US do entry but in a smaller scale. There is a better overlap of skill sets between refiner and ethanol manufacturer compared with most of the upstream exploration orientated oil and gas companies. 3) Forward integration of commodity traders and farmer/cooperatives into manufacturing is very prevalent. Entrants with some pre-entry history in the value chain as (Klepper & Simons, 2000) are noted in countries such as the US, Brazil, China, France, Thailand and Vietnam. These de alio firms are more resilient in facing supply risks compared with de novo new start-ups. In addition, experience increased the value of entry as well as encouraging entry into new markets (King & Tucci, 2002). In addition, de novo firm survival rate is expected to be lower than de alio (Geroski, 1995; Helfat & Lieberman, 2002). Nevertheless, it must be much more than having 'leveragable' asset of dynamic competencies (Teece & Pisano, 1994) or a bundle of skills and technologies (Hamel & Prahalad, 1994). As downstream oil and gas firms are backward integrated and upstream commodity traders are forward integrated, which are the keys capability for performance and survival? 4) There are good examples of forward integration of manufacturers into marketing, blending, distribution/retail. We also observe that firms of de novo and upstream de alio nature integrate further forward to marketing, blending, distribution/retail. As

EPRG No 1111
18
Perry (1988:206) has suggested that the one of the motivations for firm to employ vertical integration strategy is not only to secure the market for its product but also to gain the ability to sell the quantity of output the firm would wish. This factor appears to be significantly important in the instant of the market being controlled by incumbents that their very product is to be substituted. Discussion and Conclusions Coase (1937) argued that firms and markets are mutually substitutable governance mechanisms. Transactions will be organised within a firm that is vertically integrated when the cost of doing so is lower than the cost involved in using the markets. Developing from this concept, the transaction cost economists such as Klein et al. (1978) and Williamson (1979) suggests that due to the prohibitive cost of contracting, firm tends to integrate vertically especially there exist asset specificities. This propounds that the choice of governance structure is a decision based on the aim to achieve higher efficiency. On the other hand, Bain (1956, 1959) proposed from an industrial organisation perspective that a firm only expands horizontally or vertically in order to respond to external market power or to create and exploit market power. But, Joskow (2005), agreeing with transaction cost perspective, proposed that there was substantial support in the empirical literature for various efficiency motivations compared to a lesser support for market power exploitation as motivations in choosing vertical integration approach to inter-firms governance. Some studies in strategic management literature (e.g. Van de Vrande et al., 2009; Argyres, 1996), however, have shown that strategic factors are important considerations for manager during the selection of governance modes. Nevertheless, we propose that strategic factor particularly critical success factor of an industry should be taken into consideration when analysing determinants of governance mode. However, our analysis of the ethanol industry indicates that two important strategic forces shape the dynamic of ethanol industrial structure i.e. security of feedstock supply and access to retail market. It has to be acknowledged that the growing ethanol industry is a considerably tiny in both feedstock and fuel markets. Ethanol manufacturers have to compete for feedstock supply with a much larger and more mature food industry and ethanol manufacturers have to fight for market share as a substitute for gasoline in the downstream distribution/retail stages dominated by “supermajor” integrated oil companies. Another dynamic force that curves the evolution of the structure of the industry is the permeability of the industry boundaries. Due to ease of entry and the absence of major technological barriers, not only neighbouring industries with specific competitive advantages but also de novo new start-ups entered the manufacturing sector. Successful firms, that possess resources and distinctive competencies such as capital, technology, specialised skills, organisational culture and knowledge from their original operation, could leverage these pre-entry assets into other markets and industries. (Teece & Pisano, 1994; Carroll et al., 1996). We observe that firms with prior industry experience do have higher resilient to shock and is expected to perform better as theory on "dominance by birthright" propounded by Klepper & Simons (2000). But, the question remains on which are the critical pre-entry capabilities of a

EPRG No 1111
19
firm affecting performance and ultimate exit. Nevertheless, for fuel-ethanol industry, the structure may change dramatically when 2nd generation technology becomes available. As also demonstrated above, there are social and political factors that prohibit or influence a firm’s decision in vertical integration. Firms in some countries do not integrate upstream to agriculture production and land ownership because of social-political factors. It is due to neither the absence of substantial rents in the stage nor market arrangement does not increase transaction costs. Any analysis of the governance structure has to take account of a wider perspective including the environment and social-political factors in terms of regulation on land ownership, rural social structure, and farm size and practices. References: Bain, J. (1956). Barriers to New Competition. Harvard University Press. Bain, J. (1959). Industrial Organization. John Wiley & Sons. Balat, M., Balat, H. and Oz, C. (2008). Progress in Bioethanol Processing. Progress in Energy and
Combustion Science, 3(5): 551-573. Balat, M. and Balat H. (2009). Recent Trends in Global Production and Utilization of Bio-ethanol. Applied Energy, 86: 2273-2282. Carroll, G.R., Bigelow, L.S., Seidel, M-D.L., Tsai, L.B. (1996). The Fates of De Novo and De Alio Producers in the American Automobile Industry 1885-1981. Strategic Management Journal, 17:117-137. Coase, R. (1937). The Nature of the Firm. Economica, 4:386-405. Escobar, J.C., Lora, E.S., Venturini, O.J., Yanez, E.E., Castillo, E.F. and Almazan, O. (2009). Biofuels: Environment, Technology and Food Security. Renewable and Sustainable Energy Reviews, 13: 1275-1287. Euromonitor (2010). Euromonitor Database on Gasoline Demand. http://www.euromonitor.com/ EIA (2008). Annual Energy Outlook 2008 Overview. Energy Information Administration, USA. FAO (2009). High Food Prices and the Food Crisis – Experiences and Lessons Learned. FAO. FAO (2010). FAOSTAT: Online Statistics on Agricultural Production at http://faostat.fao.org/site/339/default.aspx Federal Trade Commission (FTC) (2009). Report on Ethanol Market Concentration, 2009. USA. http://www.ftc.gov/os/2009/12/091201ethanolreport.pdf F.O. Lichts (2007). World Ethanol & Biofuels Report, 6(4). 23 October 2007. F.O. Lichts (2008). World Ethanol & Biofuels Report, 7(5). 07 November 208. F.O. Lichts (2010). World Ethanol & Biofuels Report, 8(16). 28 April 2010. Fransman, M. (2001). Analysing the Evolution of Industry: The Relevance of the Telecommunications Industry. Econ, Innov, New Tech., 10: 109-140. Geroski, P.A. (1995). What do we know about entry? International Journal of Industrial Organization, 13(4), 421-440, Hamel, G. & Prahalad, C.K. (1994). Competing for the Future. Harvard Business School Press. Helfat, C.E. & Lieberman, M.B. (2002). The Birth of Capabilities: Market Entry and Importnat of Pre-History. Industry and Corporate Change, 11(4):725-760. Himmel, M.E. & Bayer, E.A. (2009). Lignocellulose Conversion to Biofuels: Current Challenges, Global Perspectives. Curr Opin Biotechnol. 20 (3): 316-317. Joskow, P.L. (2005). Vertical Integration. in Handbook of New Institutional Economics, ed. Menard, C. & Shirley, M. Springer.

EPRG No 1111
20
Kim, H., K im, S. and Dale, B.E. (2009). Biofuels, Land Use Change, and Greenhouse Gas Emissions: Some Unexplored Variables. Environ. Sci. Technol., 43: 961-967. Klein, B., Crawford, R.G. & Alchian, A.A. (1978). Vertical Integration, Appropriable Rents, and the Competitive Contracting Process. J. Law and Econ. 21: 297-326. Klepper, S. & Simons, K.L. (200). Dominance by Birthright: Entry of prior Radio Producers and Competitive Ramifications in the U.S. Television Receiver Industry. Strategic Management Journal, 21:997-1016. Perry, M.K. (1988). Vertical Integration. In Handbook of Industrial Organisation, Vo. 1, eds. R. Schmalensee and R.D. Wilig. Elservier Science. Pfudere, S. and M. del Castillo (2008). The Impact of Biofuels on Commodity Prices. Defra, UK. Porter, M.E. (1980). Competitive Strategy. Free Press. Renewable Fuels Association (RFA) (2002 to 2010). Annual Ethanol Industry Outlook, for year 2002 to 2010. Washington, DC. Searchinger, T., Heimlich, R., Houghton, R.A., Dong, F., Elobeid, A., Fabiosa, J., Tokgoz, S., Hayes, D. and Yu, T. (2008). Use of U.S Croplands for Biofuels Increases Greenhouse Gases Through Emissions from Land-Use Change. Science, 319: 1238 Shane, P. & Kindler K. (2003). The Economic Potential for Ethanol Production Expansion in Illinois. : The Illinois Corn Growers Association. Sorda, G., Banse, M. and Kemfert, C. (2010). An overview of biofuel policies across the world. Energy Policy (2010), doi:10.1016/ j.enpol.2010.06.066 Energy Policy. Teece, D. J. & Pisano, G. (1994). The Dynamic Capabilities of Firms: An Introduction, Industrial and Corporate Change, 3:537-556. Teece, D. J., Pisano, G., & Shuen, A. (1997). Dynamics Capabilities and Strategic Management. Strategic Mnaagement Journal, 18(7):509-533. Valero (2010) Valero Energy Corporation Reports 2009 Fourth Quarter and Annual Results, 27 Jan 2010. Van de Vrande, V., Vanhaverbeke, W., & Duysters, G. (2009). External Technology Sourcing: The Effect of Uncertainty on Governance Mode Choice. Journal of Business Venturing, 24:62-80. Wernerfelt, B. (1984). A resource-based view of the firm. Strategic Management Journal, 5: 171–180 Williamson, O.E. (1979). Transaction-Cost Economics: The Governance of Contractual Relations. J. Law and Econ., 22: 233-261