Dynamics of coarse and fine particles exposure in ...epubs.surrey.ac.uk/845793/1/Dynamics of coarse...
33
Citation details: Kumar, P., Rivas, I., Singh, A.P., Ganesh, V.J., Ananya, M., Frey, H.F, 2018. Dynamics of coarse and fine particles exposure in transport microenvironments. npj Climate and Atmospheric Science, doi: 10.1038/s41612-018-0023-y 1 Dynamics of coarse and fine particles exposure in transport microenvironments Prashant Kumar a, 1 , Ioar Rivas a , Anant Pratap Singh a, b , Vikas Julius Ganesh a, c , Monirupa Ananya a, c , H. Christopher Frey d a Global Centre for Clean Air Research (GCARE), Department of Civil and Environmental Engineering, Faculty of Engineering and Physical Sciences, University of Surrey, Guildford GU2 7XH, United Kingdom b Department of Civil Engineering, Indian Institute of Technology Roorkee, 247 667, Uttarakhand, India c Department of Civil Engineering, Saveetha School of Engineering, Saveetha University, Saveetha Nagar, Thandalam, Chennai 602105, Tamil Nadu, India d Department of Civil, Construction and Environmental Engineering, North Carolina State University, Campus Box 7908, NC, Raleigh 27695-7908, United States 1 Corresponding author: Address as above. E-mail addresses: [email protected], [email protected]
Transcript of Dynamics of coarse and fine particles exposure in ...epubs.surrey.ac.uk/845793/1/Dynamics of coarse...

Citation details: Kumar, P., Rivas, I., Singh, A.P., Ganesh, V.J., Ananya, M., Frey, H.F, 2018.
Dynamics of coarse and fine particles exposure in transport microenvironments. npj Climate and
Atmospheric Science, doi: 10.1038/s41612-018-0023-y
1
Dynamics of coarse and fine particles exposure in transport
microenvironments
Prashant Kumara, 1, Ioar Rivasa, Anant Pratap Singha, b, Vikas Julius Ganesha, c,
Monirupa Ananyaa, c, H. Christopher Freyd
aGlobal Centre for Clean Air Research (GCARE), Department of Civil and Environmental
Engineering, Faculty of Engineering and Physical Sciences, University of Surrey, Guildford
GU2 7XH, United Kingdom
bDepartment of Civil Engineering, Indian Institute of Technology Roorkee, 247 667,
Uttarakhand, India
cDepartment of Civil Engineering, Saveetha School of Engineering, Saveetha University,
Saveetha Nagar, Thandalam, Chennai 602105, Tamil Nadu, India
dDepartment of Civil, Construction and Environmental Engineering, North Carolina State
University, Campus Box 7908, NC, Raleigh 27695-7908, United States
1 Corresponding author: Address as above. E-mail addresses: [email protected],
Citation details: Kumar, P., Rivas, I., Singh, A.P., Ganesh, V.J., Ananya, M., Frey, H.F, 2018.
Dynamics of coarse and fine particles exposure in transport microenvironments. npj Climate and
Atmospheric Science, doi: 10.1038/s41612-018-0023-y
2
ABSTRACT
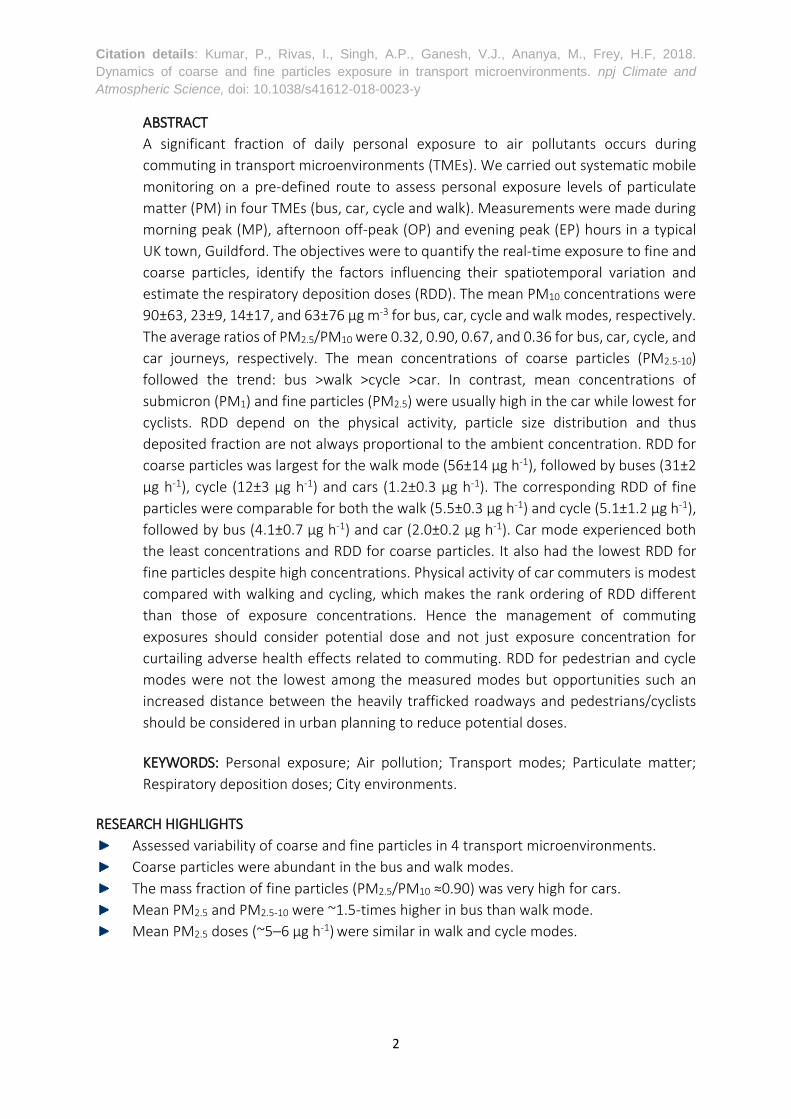
A significant fraction of daily personal exposure to air pollutants occurs during
commuting in transport microenvironments (TMEs). We carried out systematic mobile
monitoring on a pre-defined route to assess personal exposure levels of particulate
matter (PM) in four TMEs (bus, car, cycle and walk). Measurements were made during
morning peak (MP), afternoon off-peak (OP) and evening peak (EP) hours in a typical
UK town, Guildford. The objectives were to quantify the real-time exposure to fine and
coarse particles, identify the factors influencing their spatiotemporal variation and
estimate the respiratory deposition doses (RDD). The mean PM10 concentrations were
90±63, 23±9, 14±17, and 63±76 μg m-3 for bus, car, cycle and walk modes, respectively.
The average ratios of PM2.5/PM10 were 0.32, 0.90, 0.67, and 0.36 for bus, car, cycle, and
car journeys, respectively. The mean concentrations of coarse particles (PM2.5-10)
followed the trend: bus >walk >cycle >car. In contrast, mean concentrations of
submicron (PM1) and fine particles (PM2.5) were usually high in the car while lowest for
cyclists. RDD depend on the physical activity, particle size distribution and thus
deposited fraction are not always proportional to the ambient concentration. RDD for
coarse particles was largest for the walk mode (56±14 μg h-1), followed by buses (31±2
μg h-1), cycle (12±3 μg h-1) and cars (1.2±0.3 μg h-1). The corresponding RDD of fine
particles were comparable for both the walk (5.5±0.3 μg h-1) and cycle (5.1±1.2 μg h-1),
followed by bus (4.1±0.7 μg h-1) and car (2.0±0.2 μg h-1). Car mode experienced both
the least concentrations and RDD for coarse particles. It also had the lowest RDD for
fine particles despite high concentrations. Physical activity of car commuters is modest
compared with walking and cycling, which makes the rank ordering of RDD different
than those of exposure concentrations. Hence the management of commuting
exposures should consider potential dose and not just exposure concentration for
curtailing adverse health effects related to commuting. RDD for pedestrian and cycle
modes were not the lowest among the measured modes but opportunities such an
increased distance between the heavily trafficked roadways and pedestrians/cyclists
should be considered in urban planning to reduce potential doses.
KEYWORDS: Personal exposure; Air pollution; Transport modes; Particulate matter;
Respiratory deposition doses; City environments.
RESEARCH HIGHLIGHTS
Assessed variability of coarse and fine particles in 4 transport microenvironments.
Coarse particles were abundant in the bus and walk modes.
The mass fraction of fine particles (PM2.5/PM10 ≈0.90) was very high for cars.
Mean PM2.5 and PM2.5-10 were ~1.5-times higher in bus than walk mode.
Mean PM2.5 doses (~5‒6 μg h-1) were similar in walk and cycle modes.
Citation details: Kumar, P., Rivas, I., Singh, A.P., Ganesh, V.J., Ananya, M., Frey, H.F, 2018.
Dynamics of coarse and fine particles exposure in transport microenvironments. npj Climate and
Atmospheric Science, doi: 10.1038/s41612-018-0023-y
3
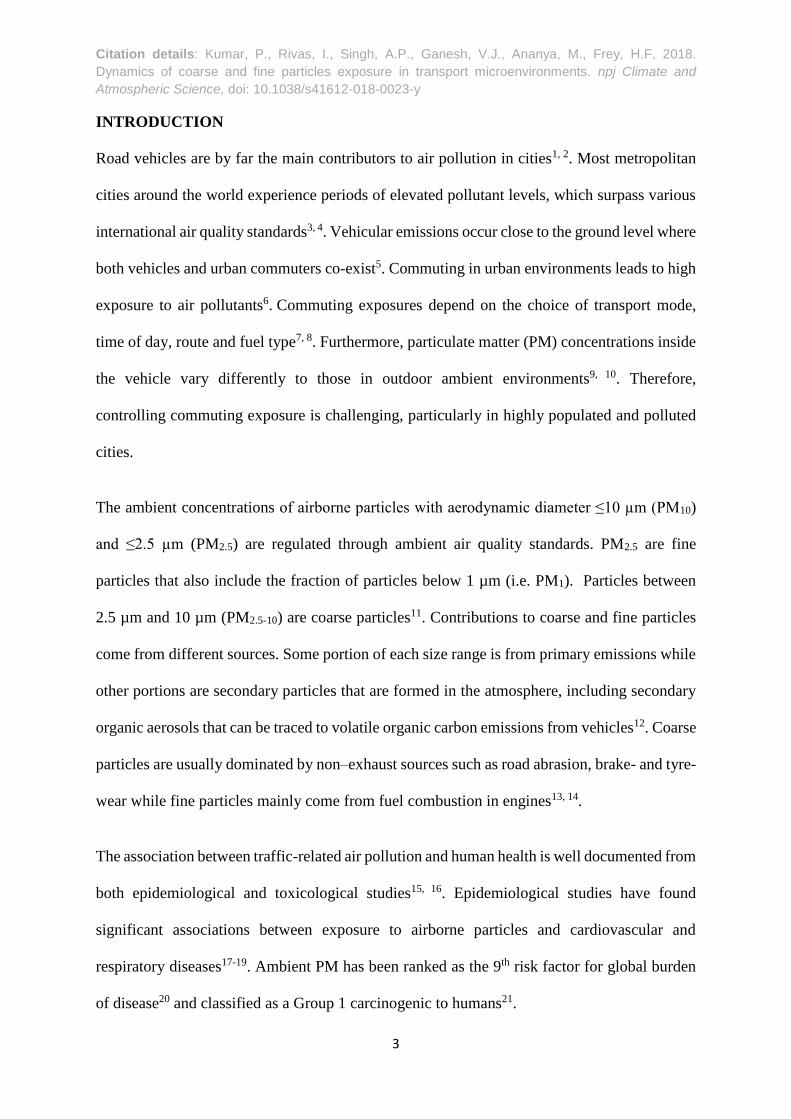
INTRODUCTION
Road vehicles are by far the main contributors to air pollution in cities1, 2. Most metropolitan
cities around the world experience periods of elevated pollutant levels, which surpass various
international air quality standards3, 4. Vehicular emissions occur close to the ground level where
both vehicles and urban commuters co-exist5. Commuting in urban environments leads to high
exposure to air pollutants6. Commuting exposures depend on the choice of transport mode,
time of day, route and fuel type7, 8. Furthermore, particulate matter (PM) concentrations inside
the vehicle vary differently to those in outdoor ambient environments9, 10. Therefore,
controlling commuting exposure is challenging, particularly in highly populated and polluted
cities.
The ambient concentrations of airborne particles with aerodynamic diameter ≤10 µm (PM10)
and ≤2.5 µm (PM2.5) are regulated through ambient air quality standards. PM2.5 are fine
particles that also include the fraction of particles below 1 µm (i.e. PM1). Particles between
2.5 µm and 10 µm (PM2.5-10) are coarse particles11. Contributions to coarse and fine particles
come from different sources. Some portion of each size range is from primary emissions while
other portions are secondary particles that are formed in the atmosphere, including secondary
organic aerosols that can be traced to volatile organic carbon emissions from vehicles12. Coarse
particles are usually dominated by non–exhaust sources such as road abrasion, brake- and tyre-
wear while fine particles mainly come from fuel combustion in engines13, 14.
The association between traffic-related air pollution and human health is well documented from
both epidemiological and toxicological studies15, 16. Epidemiological studies have found
significant associations between exposure to airborne particles and cardiovascular and
respiratory diseases17-19. Ambient PM has been ranked as the 9th risk factor for global burden
of disease20 and classified as a Group 1 carcinogenic to humans21.

Citation details: Kumar, P., Rivas, I., Singh, A.P., Ganesh, V.J., Ananya, M., Frey, H.F, 2018.
Dynamics of coarse and fine particles exposure in transport microenvironments. npj Climate and
Atmospheric Science, doi: 10.1038/s41612-018-0023-y
4
Exposure is the contact of a pollutant with the outer boundary of the body. Exposure takes into
account the concentration of a pollutant in the air at the point of contact with a person.
Exposure assessment also takes into account the frequency and duration of contact, such as
travel time. However, the health risk from exposure also depends on how much pollution
penetrates into the body. For example, breathing rates while walking or cycling are likely to
be considerably greater than those in-car or bus due to the higher level of physical activity22.
Respiratory lung deposition doses (RDD) are therefore better indices than merely exposure
concentration for assessing health risk and their relative comparison during different modes of
commuting. Past studies affirm such a deposition to be three or more times greater under
moderate activity than when at rest23.
Because on-road and roadside pollutant concentrations can be high during peak periods,
commuters may gain a significant proportion of their daily pollutant exposure when in traffic
even though such individuals travel for no more than 6–8% of the daily time24. PM
concentration usually peaks during the morning commuting hours because of lower mixing
height coupled with peak traffic volume. Congestion increases in-vehicle exposure duration
and is associated with emissions hotspots related to repeated vehicle accelerations6, 25-28. For
instance, as little as 2% of commuting time spent in the car at traffic intersections can contribute
as high as ~25% of total commuting exposure10.
Active transport (cycling, walking) is beneficial to health due to increased physical activity.
However, it is also associated with increased inhalation rate due to physical activity, which
increases RDD29. For example, even though some cyclists experience low concentrations of
PM, they have significant potential dose when inhalation rates and trip duration are taken into
consideration30. Proximity to motorised traffic is associated with higher cyclist exposure
concentrations31, 32. Moreover, PM exposures for pedestrians and cyclists are higher on high-
Citation details: Kumar, P., Rivas, I., Singh, A.P., Ganesh, V.J., Ananya, M., Frey, H.F, 2018.
Dynamics of coarse and fine particles exposure in transport microenvironments. npj Climate and
Atmospheric Science, doi: 10.1038/s41612-018-0023-y
5
traffic routes than on low-traffic routes33, 34. Nonetheless, contemporary studies have found that
the health benefits of walking and cycling outweigh the negative consequences and, hence,
should be encouraged35.
A number of studies have assessed the air pollution exposure of urban dwellers under different
transport microenvironments (TMEs) such as cars10, 36, 37, buses38, 39, trains40, 41, 42 and cycles43,
44. Particles of different sizes originate from different sources. Thus, being able to apportion
exposures by particle size in different TMEs can be helpful in targeting exposure mitigation to
those sources that are the most influential. Furthermore, there are few evaluations of exposure
apportionment to particles in transport modes based on particle size, as seen from the summary
of relevant studies in Table 1 In addition, exposure estimates databases for TMEs are yet
inadequate. Findings of the current study could benefit in validating exposure models,
evaluating the risk-benefit of active physical activity modes (e.g. walk and cycle)45 and
developing strategies to control the dominant factors for increased exposure in various TMEs.
Quantification of personal exposure to different PM fractions in different transport modes is
therefore an essential first step toward identifying the most effective strategies for reducing
exposure. Toward this broader goal, we carried out a systematic investigation of exposure
concentrations and RDD for four transport modes (bus, car, cycle and walk). The objectives
were to (i) compare fine and coarse particles exposure concentrations among transport modes
and for different times of day; (ii) assess the real-time RDD of fine and coarse particles during
peak and off-peak periods; and (iii) identify the factors that influence the temporal variability
of particles in different TMEs.
RESULTS

Citation details: Kumar, P., Rivas, I., Singh, A.P., Ganesh, V.J., Ananya, M., Frey, H.F, 2018.
Dynamics of coarse and fine particles exposure in transport microenvironments. npj Climate and
Atmospheric Science, doi: 10.1038/s41612-018-0023-y
6
Overall PM concentration during mobile measurements. Figure 2 shows the concentrations
of PM size fractions in four commuting modes, with Table 3 showing their detailed summary.
The widest range of variability in PM10 mass concentrations was observed during walk mode
(1.2‒975 μg m-3), followed by cycle (1.4‒899 μg m-3), buses (2.6‒717 μg m-3) and car (6.9‒
169 μg m-3). Irrespective of the time of the day, average PM10 concentrations have the
following trend: buses >walk >car >cycle (Table 3).
Average fine and coarse particles have a different trend (Fig 2). For fine particles, the trend in
average concentration was bus >car >walk >cycle (Fig 3). Fine particles in the bus and walk
modes were time-dependent. For example, concentrations were lower for walk mode than for
buses during the MP and EP periods whereas higher concentrations in walk mode during the
OP period. PM1 was always highest for car mode and lowest for cycle mode. The concentration
trend of PM1 in the bus and walk modes was similar to that of PM2.5. For coarse particles, the
trend was bus >walk >cycle >car (Fig 3). Besides the infiltration through the bus envelope and,
especially, the entrance of outdoor particles during the natural ventilation periods when the
doors were open, the highest concentrations in buses may also be affected by high rates of re-
suspension of particles due to inflow and outflow of travellers at bus stops27, 34, 42, 57.
Concentrations of coarse particles in the car mode were comparable during the MP, OP and EP
periods (Fig 3). The ratio of in-cabin to ambient particles is a function of whether windows are
open, and, if windows are closed, whether air is recirculated or there is fresh air intake from
the HVAC system10, 70. The lowest concentrations in the car with respect to the rest of modes
could be explained by the hindered entrance of outdoor sourced pollutants to the cabin owing
to the closed windows. Therefore, infiltration of outdoor particles was expected to be low.
Natural ventilation was absent, but mechanical ventilation was forced through the activation of
air conditioning. Besides the hindered infiltration by closed windows, the lowest concentrations

Citation details: Kumar, P., Rivas, I., Singh, A.P., Ganesh, V.J., Ananya, M., Frey, H.F, 2018.
Dynamics of coarse and fine particles exposure in transport microenvironments. npj Climate and
Atmospheric Science, doi: 10.1038/s41612-018-0023-y
7
in the car could also be explained by an efficient removal of coarse particles compared with
fine particles by the air conditioning filtration system23, 37. However, the low concentrations
observed in the cycle mode, even less than the walk mode, could be attributable to forced de-
routing on some occasions from busy traffic to quiet areas due to roads work during some runs.
In addition, the concentrations usually decay exponentially with height in near-road
environments71, 72, the relatively higher sampling height during cycle measurements may have
made some contributions to the differences. The differences in meteorological conditions and
traffic volume were trivial during the walk (February/March) and cycle (March/April)
measurements and hence a modest effect of dispersion conditions could be expected to
contribute to concentration differences.
Comparison of the concentrations during different time periods revealed that the PM1 and PM2.5
concentrations exhibited a similar trend in each mode: EP >MP >OP in bus and cycle modes;
MP >EP >OP in car, and MP >OP >EP in walk mode (Table 3). The trend for coarse particles
was different in all modes: MP >EP >OP in bus, MP >EP ≈OP in cycle, EP ≈OP >MP in car,
and EP >OP >MP in walk mode. Despite high traffic volume, previous studies have shown
lower coarse particles in comparison with fine particles during morning periods during the
walk, owing to the wetness of pavement due to overnight dew73. The walk and car modes
followed a similar trend; EP periods had higher concentrations of coarse particles than those in
MP and OP periods (Table 3). The bus and cycle mode showed an opposite trend with higher
concentrations of coarse particles during MP and EP compared with OP periods (Table 3),
presumably because of high re-suspension in these TMEs. Fine particle concentrations were
always lower in all modes during OP versus MP and EP periods. These lower concentrations
could be attributed to lower traffic volume during OP periods and relatively better dispersion
conditions compared with EP/MP periods71.

Citation details: Kumar, P., Rivas, I., Singh, A.P., Ganesh, V.J., Ananya, M., Frey, H.F, 2018.
Dynamics of coarse and fine particles exposure in transport microenvironments. npj Climate and
Atmospheric Science, doi: 10.1038/s41612-018-0023-y
8
Fractional contributions of different sized PM in TMEs. The absolute and fractional
contributions of different sized PM in studied TMEs are shown in Figures 4a-b. The average
total PM mass concentrations, based on the sum of PM1, PM1-2.5, and PM2.5-10 size ranges, are
clearly greater for bus and walk modes than for car and cycle modes. However, the bus and
walk mode total concentrations are dominated by the larger PM2.5-10 size fraction. The fraction
of particles that penetrate to the bronchioles and alveoli is smaller for the larger sized particles.
The smaller size particles, such as PM1 and PM1-2.5, are therefore typically of more health
concern. In this regard, the bus, car, and walk modes are approximately similar, with PM2.5
mass concentrations ranging from approximately 20 g m–3 to 40 g m–3, depending on the
time of day. There is less variability by time of day for the car and walk modes than for the
bus mode. The cycle mode clearly has lower total PM and PM2.5 mass concentrations than any
other mode, regardless of time of day. The car and cycle modes have a relatively little total
mass contribution from coarse particles.
The PM1/PM2.5 ratio was nearly identical (≈0.73) for cycle and walk modes. Usually smaller
the size of particles, more risk such particles poses to human health. About 2/3rd of PM2.5 being
PM1 clearly suggest exposure to such high health-damaging particles. The similarity in the
particle size fractions coupled with the differences in exposure concentration implies that the
cyclists were exposed to more diluted particles than were the pedestrians. However, the
PM2.5/PM10 ratio of the cycle mode (0.68±0.04) was different from the walk mode (0.37±0.04;
Fig. 4b). The coarse particles, predominantly resulting from re-suspension of dust and tyre
wear37 in near-road environments, contain larger settling velocity compared with their smaller
counterparts. A distinct reasoning was unavailable but the differences in height of
measurements may have partly attributed to higher coarse PM exposure to pedestrians versus
cyclists.
Citation details: Kumar, P., Rivas, I., Singh, A.P., Ganesh, V.J., Ananya, M., Frey, H.F, 2018.
Dynamics of coarse and fine particles exposure in transport microenvironments. npj Climate and
Atmospheric Science, doi: 10.1038/s41612-018-0023-y
9
Fine particles dominate (PM2.5/PM10 ≈90%) the PM concentrations in car mode. The windows
were closed (low infiltration) and air conditioning system was on (removing more efficiently
coarse particles) during our car measurements (Section 2.2). Coarse particles are more
efficiently filtered out by the air conditioning system of the car compared to fine particles23, 42,
74, explaining the relatively low fraction of coarse particles inside the car.
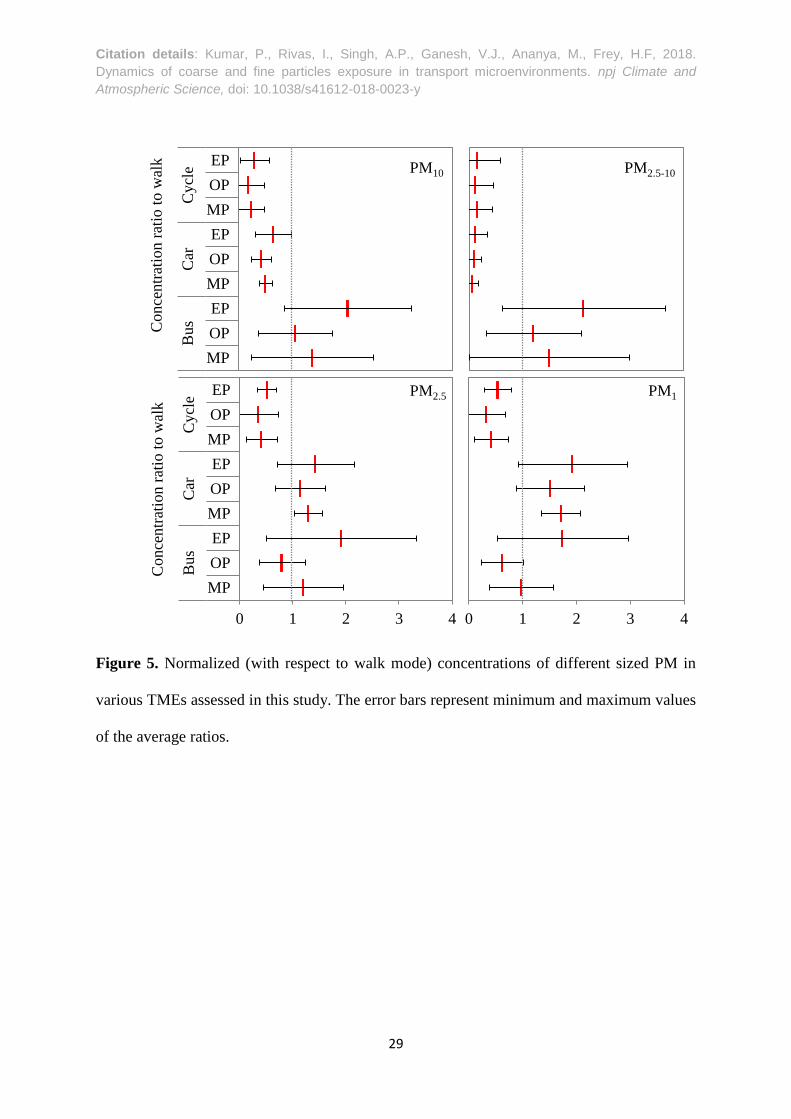
Normalised PM mass concentrations. We normalized the MP, OP and EP concentrations
measured on cycle, car and bus modes with respect to those observed in the walk mode to
assess differences between the transport modes. PM10, PM2.5-10, PM2.5 and PM1 concentrations
were significantly lower for cycle mode compared to the walk mode (Fig 5). In the car mode,
during all three observation periods (i.e. MP, OP and EP), the total PM10 and coarse particles
concentrations were low, but the average concentrations of fine and submicron (PM1) particles
were higher compared to walk mode (Fig 5). In this regard, commuting in cars could be more
harmful than by walk from the viewpoint of exposure to fine and PM1, which can penetrate
deeper into the bronchiole and alveoli regions and cause adverse health effects. Compared to
walk, bus concentrations were approximately comparable for all size ranges for OP and
approximately twice as high for EP, with MP values closer to OP than EP.
As compared to the walk mode higher levels of coarse particles were observed in the buses,
while higher concentrations of fine and submicron particles were observed in the cars and,
sometimes, also in the buses. The cycle mode had the lowest average levels of PM1, PM2.5, and
PM10. Fine particle abundance in vehicle modes, including car and bus, compared to walk mode
is consistent with earlier observations of a higher in-vehicle versus walk exposure
concentrations in Central London56. However, the fine particle concentration ratio for cycle
versus walk mode of only 0.41 is much lower than a ratio of 1.2 reported from Central London,
presumably due to street canyon effects compared with mostly open road conditions in our
Citation details: Kumar, P., Rivas, I., Singh, A.P., Ganesh, V.J., Ananya, M., Frey, H.F, 2018.
Dynamics of coarse and fine particles exposure in transport microenvironments. npj Climate and
Atmospheric Science, doi: 10.1038/s41612-018-0023-y
10
study56. In the highly polluted city of Delhi (India), the mass ratios of fine particles between
modes were 1.5 for cycle-to-walk, 0.3 for car-to-walk and 0.9 for bus-to-walk49.
Concentrations of PM2.5-10 as compared to PM2.5 were relatively high in the bus and walk modes
(SI Fig S3). The average mass concentration ratio of PM2.5-10/PM2.5 in bus mode varied from
1.6‒3.0 whereas in walk mode it ranged from 1.4‒2.0, as high as by a factor of 2 to 3 (SI Fig
S3). Conversely, PM2.5 predominates in the car and cycle modes: PM2.5-10/PM2.5 in cars ranged
from 0.05‒0.1 (i.e. 5 to 10% of fine particles) whereas it varied from ~0.4‒0.55 on cycle mode
(i.e. 40 to 55%). Re-suspension effect is the main cause for elevated levels of coarse particles
in the bus and in walk modes.
Exposure assessment. RDD accounts for differences in physical activity and the time spent in
a microenvironment75, 76. We estimated RDD for both fine and coarse particles using inhalation
rates for males (Fig 6) and females (SI Fig S4). Since the trend of results for male and female
RDD are similar, the discussion in the subsequent text are valid for both genders. Here, we
only refer to male doses in the discussion for the brevity reasons. The RDD for coarse particles
(Fig 6a) was the highest during the walk mode, with mean RDD ranging from 40 μg h-1 to 66
μg h-1 among the MP, OP and EP periods. These were followed by buses (28‒32 μg h-1), cycle
(10‒15 μg h-1) and cars (0.8‒1.3 μg h-1). However, fine particle based RDD were comparable
for walk (5‒6 μg h-1) and cycle (4‒6.5 μg h-1) and were higher than for bus (3.5‒5 μg h-1) and
car (1.8‒2 μg h-1) modes. The fine particle based RDD for walk mode is comparable to that
reported by Kumar and Goel37 for the same city (7 μg h-1). Likewise, Rivas et al.42 reported
that mean PM2.5-based RDD decreased when comparing walk to bus and car modes. A
Barcelona-based study also found that walk and cycle modes had similar RDD, with walk at
6.8 µg h-1 and cycle at 6.7 µg h-1, and that RDD was lower for bus (5.4 µg h-1) and car (5.6 µg
h-1) modes8.

Citation details: Kumar, P., Rivas, I., Singh, A.P., Ganesh, V.J., Ananya, M., Frey, H.F, 2018.
Dynamics of coarse and fine particles exposure in transport microenvironments. npj Climate and
Atmospheric Science, doi: 10.1038/s41612-018-0023-y
11
Relative to fine particles, the mean RDD for coarse particles were 8‒12, 6.5‒8.3 and 1.8‒3.7
times higher during walk, bus and cycle modes, respectively, but only between 0.3 and 0.8 for
car mode. This shows the effect of traffic-related sources such as re-suspension in the walk,
bus and cycle modes while the in-car exposure to coarse particles is hindered by the closed
windows and the filtration system. The difference in RDD between coarse and fine particles
can be explained by the difference in fine and coarse PM mass concentrations, particle mean
diameter and size-dependent DF.
The RDD were lowest for cars among all modes for both particle size ranges and for all three
time periods. Recently, Rivas et al. 42 reported that PM2.5-based RDD follows a similar trend
to that found herein that RDD is the highest for walk (4.9±1.0; 3.7‒6.1 µg h-1) and is smaller
for bus (2.7±1.1; 1.9‒4.3 µg h-1) and smallest for car (1.0±0.2; 0.7‒1.2 µg h-1). A Barcelona
study reported a nearly similar trend when comparing PM2.5-based average RDD among the
modes: walk (6.8 µg h-1) ≈ cycle (6.7 µg h-1) >bus (5.4 µg h-1) ≈ car (5.6 µg h-1)8. Although
cars show the lowest personal doses among all the transport modes studied, it should be
highlighted that they have the highest emission per passenger. Therefore, the contribution of
private transportation is actually leading to an increased exposure and dose of those commuters
choosing an environmental-friendly transport options such as cycling and walking.
DISCUSSION
The comparison of fine and coarse particles exposure concentrations among transport modes
and for different times of day showed that:
For coarse particles, exposure concentrations were lower for cyclists than for
pedestrians or occupants of cars or buses, for all three times of day that were measured.
The highest coarse particle exposures were in buses for all three times of the day. There
was substantial inter-run variability. Many runs are needed to develop a statistically

Citation details: Kumar, P., Rivas, I., Singh, A.P., Ganesh, V.J., Ananya, M., Frey, H.F, 2018.
Dynamics of coarse and fine particles exposure in transport microenvironments. npj Climate and
Atmospheric Science, doi: 10.1038/s41612-018-0023-y
12
stable estimate of mean exposure concentrations. A higher infiltration of outside
pollutants into the buses through the frequent opening of their doors and accumulation
of particles can be attributed to this trend. A close proximity of pedestrians with the
traffic exhaust emissions and likely re-suspension of mineral dust particles lead to high
coarse particles exposure during walk mode. The larger-sized particles are likely to be
restricted in car cabins if windows are kept closed to prevent infiltration and by the car
filtering system, hence resulting in reduced exposure concentrations.
For fine particles, the average concentrations of PM2.5 in closed modes (car and bus)
were higher than those in open modes (cycle and walk) due to their shorter distance to
the source as well as the accumulation of particles within the vehicles (especially in the
car mode, where fine particles get inside the cabin through mechanical ventilation by
their dispersion is then hindered by the closed windows). The cycle mode also had the
lowest average concentrations. However, there was more variability in the rank
ordering of exposure among the transport modes based on time of day. For example,
pedestrian exposures were much lower during the evening peak than during the
morning peak or off-peak periods. Bus exposure concentrations were higher than for
other transport modes in the MP and EP, but lower than for car and pedestrian in OP.
Some of the variability among modes with regard to time of day may be because of
operational factors (e.g., numbers of passengers boarding and alighting from the bus),
traffic flow, traffic-induced turbulence and mixing of vehicle-emitted pollutants, and
others are related to meteorological factors (e.g., atmospheric stability). The trend in
exposure to PM1 among modes and times of day is usually similar to that for PM2.5.
The assessment of the real-time RDD of fine and coarse particles during peak and off-peak
periods showed that:

Citation details: Kumar, P., Rivas, I., Singh, A.P., Ganesh, V.J., Ananya, M., Frey, H.F, 2018.
Dynamics of coarse and fine particles exposure in transport microenvironments. npj Climate and
Atmospheric Science, doi: 10.1038/s41612-018-0023-y
13
Pedestrians are estimated to have the highest RDD for coarse particles. Cyclists have much
lower RDD than pedestrians or those riding buses, but higher than those in cars. As for
fine particles, RDD is approximately equally high for pedestrians and cyclists, an
approximately 20% higher than for bus passengers and 2.5-times higher than for car
occupants (if windows are closed and AC is on).
For coarse particles, the rank ordering of RDD is different than the rank ordering of
exposure concentrations. Pedestrians and cyclists have higher breathing rates than do
occupants of cars and buses. Thus, even though buses have the highest average exposure
concentrations for all times of day, the highest RDD is for pedestrians for all times of the
day. Similarly, for fine particles, pedestrians and cyclists have high RDD even though their
exposure concentrations are lower than for the motorised transport modes.
The identification of the factors that influenced the temporal variability of particles in different
TMEs indicated that:
Management of commuting exposures should consider potential dose, such as RDD, and
not just exposure concentration, to help reduce adverse health effects from air pollution
related to commuting.
Although there is variability in both exposure and RDD with respect to time of day, the
differences in both exposure and RDD between transport modes tend to be larger than the
differences within a mode related to the time of the day. Thus, choices of modes to
minimise either exposure or RDD can be relatively robust to the time of the day. For
example, for both coarse and fine particles, the car mode had the lowest RDD for each of
the three measured times of day. However, it is worth mentioning that private car
commutes contribute to the highest emissions per passenger, thus contributing to increased
Citation details: Kumar, P., Rivas, I., Singh, A.P., Ganesh, V.J., Ananya, M., Frey, H.F, 2018.
Dynamics of coarse and fine particles exposure in transport microenvironments. npj Climate and
Atmospheric Science, doi: 10.1038/s41612-018-0023-y
14
exposure of those commuting using cleaner modes (such as cycle and walk).
There are sources of variability established in prior work37 that was not the focus of
quantification here, such as the role of opening vehicle windows or operating the vehicle
HVAC system with fresh air intake versus recirculating air. Choices of these ventilation
practices can lead to substantial changes in bus and car exposure concentration.
Although RDD for pedestrian and cycle modes were not the lowest among the four
measured modes, there are opportunities to reduce RDD for these modes by reducing
exposure concentrations. Pedestrian and cyclist exposures could be further reduced by
routing pedestrian and cycling paths away from heavily trafficked roadways. Such a
change would require that urban planning incorporate a goal of separating pedestrians and
cyclists from vehicle traffic when designing paths and roads.
Our study showed that the exposure concentrations vary depending on the choice of a mode.
Fresh fumes from the tailpipe emissions result in commuters’ exposure to frequent transient
peaks in near-road environments12,71. Therefore, further studies are recommended to estimate
the exposure concentrations based on shorter averaging time for specific segments of the route,
to enable quantification of spatial variability in exposure concentrations. Alternative routes
between a particular origin and destination pair could be measured to assess whether exposure
concentrations in a given mode are sensitive to route choice. Measurements could also be made
in other seasons, such as summer, to assess seasonal variability. Routes for walk and cycle
could be specified to keep pedestrians and cyclists as far from major thoroughfares as possible,
to assess by how separation from traffic could lead to lower exposures. The design of future
studies should consider the micro assessment of route characteristics such as getting on/off the
buses, effect of de-routing of cyclists or pedestrians to quieter routes and the effect of sampling
heights. Such studies could also consider quantification of metals and polycyclic aromatic

Citation details: Kumar, P., Rivas, I., Singh, A.P., Ganesh, V.J., Ananya, M., Frey, H.F, 2018.
Dynamics of coarse and fine particles exposure in transport microenvironments. npj Climate and
Atmospheric Science, doi: 10.1038/s41612-018-0023-y
15
hydrocarbons in aerosol particles to allow risk assessment due to these toxic species.
METHODS
Route characteristics. TME exposure concentrations were measured in the town of Guildford
(UK). Guildford has a total population of 130,000, is situated 50 km southwest of London, and
has a maritime climate. On average, each household owns about two cars which is more than
the national average61. Commuting exposures are compared for four travel modes, including
car, cycle, walk (hereafter referred to as the CCW) and bus modes, based on strategically
selected routes. As shown in Figure 1, a 5.3 km route was used for CCW routes, whereas a
different 13.8 km route was selected for the bus mode. The CCW and bus routes have 1.6 km
in common (Fig. 1). The CCW route is shorter than the bus route so that walk mode can be
completed during a peak period. Both routes are circular closed loops and include a variety of
road type and land use patterns.
Description of travel modes. To assess the variability in exposure among different times of
the day, measurements were made during morning peak (MP: 08:30‒11:00 h; local time),
afternoon off-peak (OP: 13:00‒15:00 h) and evening peak (EP: 17:00‒19:00 h). All
measurements were made on weekdays. The respective sunrise and sunset times during the
measurement periods were 05:38-07:40 h and 16:51-20:21 h, respectively, with a total day
length varying between 09:10 and 14:41 h62. The average trip time to complete a CCW route
run by car was 17 min while it was 18 min by cycle, and 80 min by walk. A single run on the
bus route typically took 50 min to complete (Table 2). The differences in travel time by each
of these modes arise because of differences in speed and route length. The car (model: Vauxhall
Corsa SXi, 2014) measurements were performed in traffic and represent typical driving. During
all the runs, the car windows were closed and the air-conditioning was kept on with air intake
from outside. The buses were mostly fuelled with diesel. In the buses, air conditioning was in
Citation details: Kumar, P., Rivas, I., Singh, A.P., Ganesh, V.J., Ananya, M., Frey, H.F, 2018.
Dynamics of coarse and fine particles exposure in transport microenvironments. npj Climate and
Atmospheric Science, doi: 10.1038/s41612-018-0023-y
16
use and windows were closed, except for a partially opened window near the driver. Table 2
shows the summary of route lengths and travel times for each mode. Monitoring by cycling
and walk modes was performed at normal cycling and walking speeds.
Instrumentation. A GRIMM optical particle spectrometer (OPC; model 1.107) was used to
measure the mass distribution of PM in the size range from 0.25‒32 µm following the principle
of light-scattering. The lower size cut-off of 0.25 µm means that these quasi-ultrafine particles
are not measured. However, these particles contains negligible mass compared with their
larger-counterparts and hence have a modest effect on measured mass concentrations6. The
sensitivity of the instrument was 1 µg m-3 and reproducibility were within ±2%. Ambient air
was drawn continuously at a flow rate of 1.2 L min–1 into the OPC and size-resolved PM
concentrations were recorded every 6 seconds. The instrument was calibrated by the
manufacturer prior to the deployment in field work. Following our previously used approach48,
we also carried out on-site calibration by weighing the Polytetrafluoroethylene filters used at
the back of the instrument and compared it with the data of PM mass monitored by the
instrument. The instruments were kept inside an open shoulder bag while walking and cycling,
at the passenger front seat while commuting by car, and at the centre row when commuting by
bus. Meteorological data were retrieved from a nearby Heathrow airport station63. The average
wind speed, ambient temperature, and relative humidity (±standard deviation) were 10±4 km
h-1, 13±5 ºC and 62±8%, respectively.
Data collection and analysis. Measurements were made during February to April 2015. Real-
time exposure concentrations for PM1, PM2.5 and PM10 were measured for four TMEs (bus and
CCW modes) during MP, OP and EP. A total of 142 round trips were made; of which 30 trips
were carried out by bus, 52 by car, 30 by cycle and 30 by walk (Table 2). The details on the
number of trips and sampling dates for the different TMEs are given in SI Table S1. The typical

Citation details: Kumar, P., Rivas, I., Singh, A.P., Ganesh, V.J., Ananya, M., Frey, H.F, 2018.
Dynamics of coarse and fine particles exposure in transport microenvironments. npj Climate and
Atmospheric Science, doi: 10.1038/s41612-018-0023-y
17
average speed varied by mode. The total time invested in air monitoring was 88 h and 29 min
(Table 2).
Respiratory lung deposition doses. RDD was estimated for each PM fraction according to
the approach used in our earlier work37, 64. The RDD largely depends on the shape, size,
mass, and density of the particles65 and is estimated based on the International Commission
on Radiological Protection (ICRP)66:
RDD of PM (fractions, i) = (VT × f) × DFi × PMi (1)
[µg s–1] = [cm3 breath–1 × breaths s–1] × [-] × [µg cm–3] (2)
where VT is the tidal volume of human subjects. This was taken as 750 (460), 1920 (1360) and
1250 (990) cm3 per breath and during sitting condition (for bus and car), heavy (for cycle),
light (for walk) exercises, respectively, for adult males (females, shown by values within the
brackets)22. The variable f represents typical breathing frequency, which is taken as 0.43 (0.55),
0.33 (0.35) and 0.20 (0.23) breaths per second during heavy exercise, light exercise and sitting,
respectively for males (females)22. DFi (deposition fractions) are estimated using mass median
diameter (dp) of PM for each size bin22. The dp represents optical diameter that would be
different to aerodynamic diameter67, especially for coarse particles that contains irregular
shapes and varying density68. For example, Chien et al.67 confirms that the optical diameter is
affected by refractive index and morphology and hence the relationships between optical and
aerodynamic diameters could be different for pure substances such as salt or oleic acid particles
than those for the complex mixture of particles measured here. This difference will add
uncertainty into the calculated deposition fractions, from modest to more than a factor of two
in equivalent aerodynamic diameter and deposition fraction for some TMEs, as demonstrated
in Supplementary Information (SI) Figure S1. We have not made conversion to ensure that our
estimates are comparable with published studies, using optical diameter during mobile personal

Citation details: Kumar, P., Rivas, I., Singh, A.P., Ganesh, V.J., Ananya, M., Frey, H.F, 2018.
Dynamics of coarse and fine particles exposure in transport microenvironments. npj Climate and
Atmospheric Science, doi: 10.1038/s41612-018-0023-y
18
exposure measurements. Since we were required to make numerous assumptions due to lack
of specific information, we have not considered the hygroscopic properties69 of the particles
for estimating the lung deposition fractions. For the calculation of the dp we calculated the mass
concentrations of each size bin and, afterwards, we plotted the percentage of cumulative mass
concentration to each size bin (i.e., the addition of the mass concentration of the corresponding
size bin and the mass concentration of all bins of smaller sizes). The DF is calculated according
to the following equation:
DF = 𝐼𝐹( 0.058 +0.911
1+exp (4.77+1.485 ln 𝑑𝑝)+
0.943
1+exp (0.508−2.58 ln 𝑑𝑝)) (3)
SI Figure S2 shows the approach used to calculate dp for PM10, PM2.5 and PM1. IF is the
inhalable fraction:
IF = 1 − 0.5(1 −1
1+0.00076 𝑑𝑝2.8) (4)
The resulting product of various parameters in Eq. (1) including the VT, f and DF with PM2.5-
10 or PM2.5 mass concentrations represents the mass-specific RDDs due to coarse and fine
particles, respectively. We have chosen to estimate RDD as mass per unit time (µg s-1) for
comparison purposes across different microenvironments on a time basis. It also allows to
calculate total mass deposited in each microenvironment by multiplying RDD by time spent in
a TME.
ACKNOWLEDGEMENTS
PK and HCF acknowledge the funding received from the University Global Partnership
Network (UGPN) through the project – Comparison of Air Pollution in Transportation
Environments (CAPTEN): Development and Demonstration Based on Selected UK and US
Cities – for supporting this research work. The authors thank Disha Gadre, Vee Bahat and Anju
Goel for their help in data collection and Prashant Rajput for suggesting preliminary text on
some figures. PK also thanks the funding received from to the iSCAPE (Improving Smart

Citation details: Kumar, P., Rivas, I., Singh, A.P., Ganesh, V.J., Ananya, M., Frey, H.F, 2018.
Dynamics of coarse and fine particles exposure in transport microenvironments. npj Climate and
Atmospheric Science, doi: 10.1038/s41612-018-0023-y
19
Control of Air Pollution in Europe) project through the European Community’s H2020
Programme under the Grant Agreement No. 689954.
AUTHORS CONTRIBUTIONS
PK and HCF conceptualised and designed the study; they both assisted in data collection,
interpreted results and wrote the manuscript. IR contributed to the preliminary draft of the
article. APS and MA contributed to data analysis and preparing some of the figures. VJG
assisted in data collection, its indexing, generating route map and preliminary text for
methodology sections.
CONFLICT OF INTERETS
The authors declare no conflict of competing interests.
DATA AVAILABILITY
The datasets used in this study are available upon request from the corresponding author.
REFERENCES
1. HEI Panel on the Health Effects of Traffic-Related Air Pollution. 2010. Traffic-related
air pollution: A critical review of the literature on emissions, exposure, and health effects.
HEI Special Report 17. Health Effects Institute, Boston, MA. pp.386. Available from:
http://pubs.healtheffects.org/getfile.php?u=553 (accessed 06.07.2016).
2. Kumar, P.; Khare, M.; Harrison, R. M.; Bloss, W. J.; Lewis, A. C.; Coe, H.; Morawska,
L., New directions: Air pollution challenges for developing megacities like Delhi. Atmos.
Environ. 2015, 122, 657-661.
3. Guerreiro, C. B. B.; Foltescu, V.; de Leeuw, F., Air quality status and trends in Europe.
Atmos. Environ. 2014, 98, 376-384.
4. Kumar, P.; Jain, S.; Gurjar, B. R.; Sharma, P.; Khare, M.; Morawska, L.; Britter, R., New
Directions: Can a “blue sky” return to Indian megacities? Atmospheric Environment
2013, 71, 198-201.
5. Knibbs, L. D.; Cole-Hunter, T.; Morawska, L., A review of commuter exposure to
ultrafine particles and its health effects. Atmos. Environ. 2011, 45, (16), 2611-2622.
6. Goel, A.; Kumar, P., A review of fundamental drivers governing the emissions,
dispersion and exposure to vehicle-emitted nanoparticles at signalised traffic
intersections. Atmos. Environ. 2014, 97, 316-331.
7. Zuurbier, M.; Hoek, G.; Oldenwening, M.; Lenters, V.; Meliefste, K.; van den Hazel, P.;
Brunekreef, B., Commuters’ exposure to particulate matter air pollution is affected by
mode of transport, fuel type, and route. Environ. Health Perspect. 2010, 118, 783-789.
Citation details: Kumar, P., Rivas, I., Singh, A.P., Ganesh, V.J., Ananya, M., Frey, H.F, 2018.
Dynamics of coarse and fine particles exposure in transport microenvironments. npj Climate and
Atmospheric Science, doi: 10.1038/s41612-018-0023-y
20
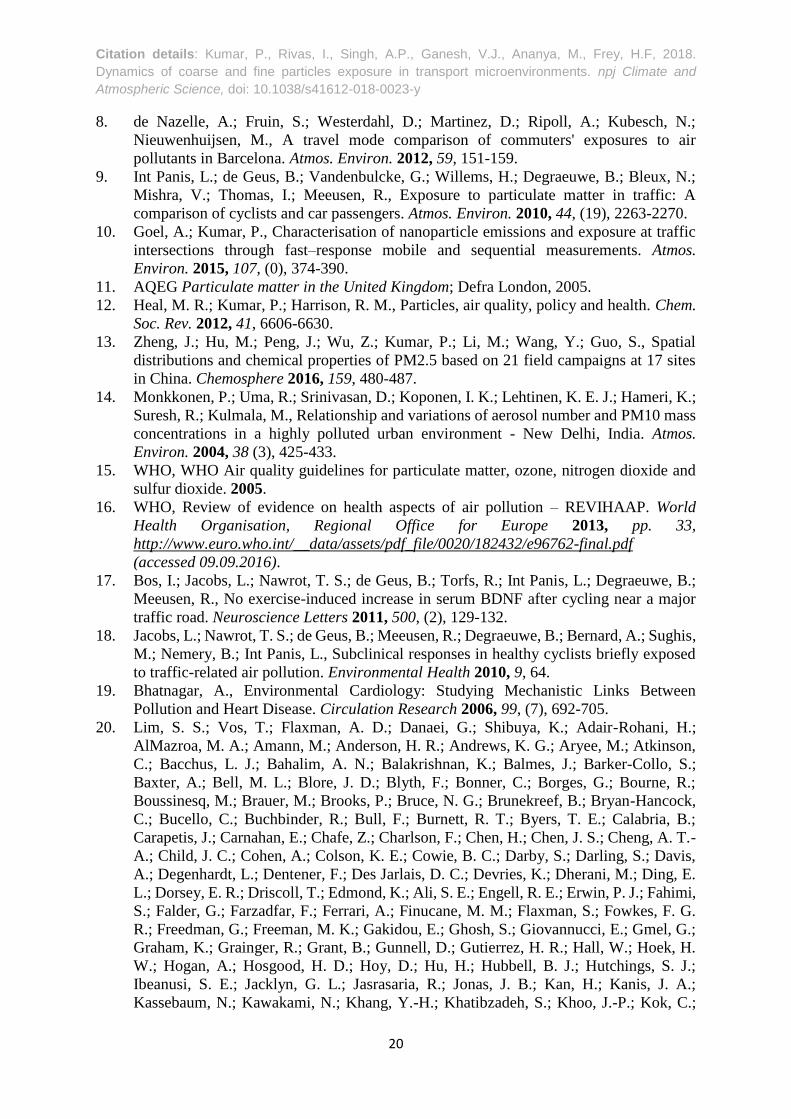
8. de Nazelle, A.; Fruin, S.; Westerdahl, D.; Martinez, D.; Ripoll, A.; Kubesch, N.;
Nieuwenhuijsen, M., A travel mode comparison of commuters' exposures to air
pollutants in Barcelona. Atmos. Environ. 2012, 59, 151-159.
9. Int Panis, L.; de Geus, B.; Vandenbulcke, G.; Willems, H.; Degraeuwe, B.; Bleux, N.;
Mishra, V.; Thomas, I.; Meeusen, R., Exposure to particulate matter in traffic: A
comparison of cyclists and car passengers. Atmos. Environ. 2010, 44, (19), 2263-2270.
10. Goel, A.; Kumar, P., Characterisation of nanoparticle emissions and exposure at traffic
intersections through fast–response mobile and sequential measurements. Atmos.
Environ. 2015, 107, (0), 374-390.
11. AQEG Particulate matter in the United Kingdom; Defra London, 2005.
12. Heal, M. R.; Kumar, P.; Harrison, R. M., Particles, air quality, policy and health. Chem.
Soc. Rev. 2012, 41, 6606-6630.
13. Zheng, J.; Hu, M.; Peng, J.; Wu, Z.; Kumar, P.; Li, M.; Wang, Y.; Guo, S., Spatial
distributions and chemical properties of PM2.5 based on 21 field campaigns at 17 sites
in China. Chemosphere 2016, 159, 480-487.
14. Monkkonen, P.; Uma, R.; Srinivasan, D.; Koponen, I. K.; Lehtinen, K. E. J.; Hameri, K.;
Suresh, R.; Kulmala, M., Relationship and variations of aerosol number and PM10 mass
concentrations in a highly polluted urban environment - New Delhi, India. Atmos.
Environ. 2004, 38 (3), 425-433.
15. WHO, WHO Air quality guidelines for particulate matter, ozone, nitrogen dioxide and
sulfur dioxide. 2005.
16. WHO, Review of evidence on health aspects of air pollution – REVIHAAP. World
Health Organisation, Regional Office for Europe 2013, pp. 33,
http://www.euro.who.int/__data/assets/pdf_file/0020/182432/e96762-final.pdf
(accessed 09.09.2016).
17. Bos, I.; Jacobs, L.; Nawrot, T. S.; de Geus, B.; Torfs, R.; Int Panis, L.; Degraeuwe, B.;
Meeusen, R., No exercise-induced increase in serum BDNF after cycling near a major
traffic road. Neuroscience Letters 2011, 500, (2), 129-132.
18. Jacobs, L.; Nawrot, T. S.; de Geus, B.; Meeusen, R.; Degraeuwe, B.; Bernard, A.; Sughis,
M.; Nemery, B.; Int Panis, L., Subclinical responses in healthy cyclists briefly exposed
to traffic-related air pollution. Environmental Health 2010, 9, 64.
19. Bhatnagar, A., Environmental Cardiology: Studying Mechanistic Links Between
Pollution and Heart Disease. Circulation Research 2006, 99, (7), 692-705.
20. Lim, S. S.; Vos, T.; Flaxman, A. D.; Danaei, G.; Shibuya, K.; Adair-Rohani, H.;
AlMazroa, M. A.; Amann, M.; Anderson, H. R.; Andrews, K. G.; Aryee, M.; Atkinson,
C.; Bacchus, L. J.; Bahalim, A. N.; Balakrishnan, K.; Balmes, J.; Barker-Collo, S.;
Baxter, A.; Bell, M. L.; Blore, J. D.; Blyth, F.; Bonner, C.; Borges, G.; Bourne, R.;
Boussinesq, M.; Brauer, M.; Brooks, P.; Bruce, N. G.; Brunekreef, B.; Bryan-Hancock,
C.; Bucello, C.; Buchbinder, R.; Bull, F.; Burnett, R. T.; Byers, T. E.; Calabria, B.;
Carapetis, J.; Carnahan, E.; Chafe, Z.; Charlson, F.; Chen, H.; Chen, J. S.; Cheng, A. T.-
A.; Child, J. C.; Cohen, A.; Colson, K. E.; Cowie, B. C.; Darby, S.; Darling, S.; Davis,
A.; Degenhardt, L.; Dentener, F.; Des Jarlais, D. C.; Devries, K.; Dherani, M.; Ding, E.
L.; Dorsey, E. R.; Driscoll, T.; Edmond, K.; Ali, S. E.; Engell, R. E.; Erwin, P. J.; Fahimi,
S.; Falder, G.; Farzadfar, F.; Ferrari, A.; Finucane, M. M.; Flaxman, S.; Fowkes, F. G.
R.; Freedman, G.; Freeman, M. K.; Gakidou, E.; Ghosh, S.; Giovannucci, E.; Gmel, G.;
Graham, K.; Grainger, R.; Grant, B.; Gunnell, D.; Gutierrez, H. R.; Hall, W.; Hoek, H.
W.; Hogan, A.; Hosgood, H. D.; Hoy, D.; Hu, H.; Hubbell, B. J.; Hutchings, S. J.;
Ibeanusi, S. E.; Jacklyn, G. L.; Jasrasaria, R.; Jonas, J. B.; Kan, H.; Kanis, J. A.;
Kassebaum, N.; Kawakami, N.; Khang, Y.-H.; Khatibzadeh, S.; Khoo, J.-P.; Kok, C.;
Citation details: Kumar, P., Rivas, I., Singh, A.P., Ganesh, V.J., Ananya, M., Frey, H.F, 2018.
Dynamics of coarse and fine particles exposure in transport microenvironments. npj Climate and
Atmospheric Science, doi: 10.1038/s41612-018-0023-y
21
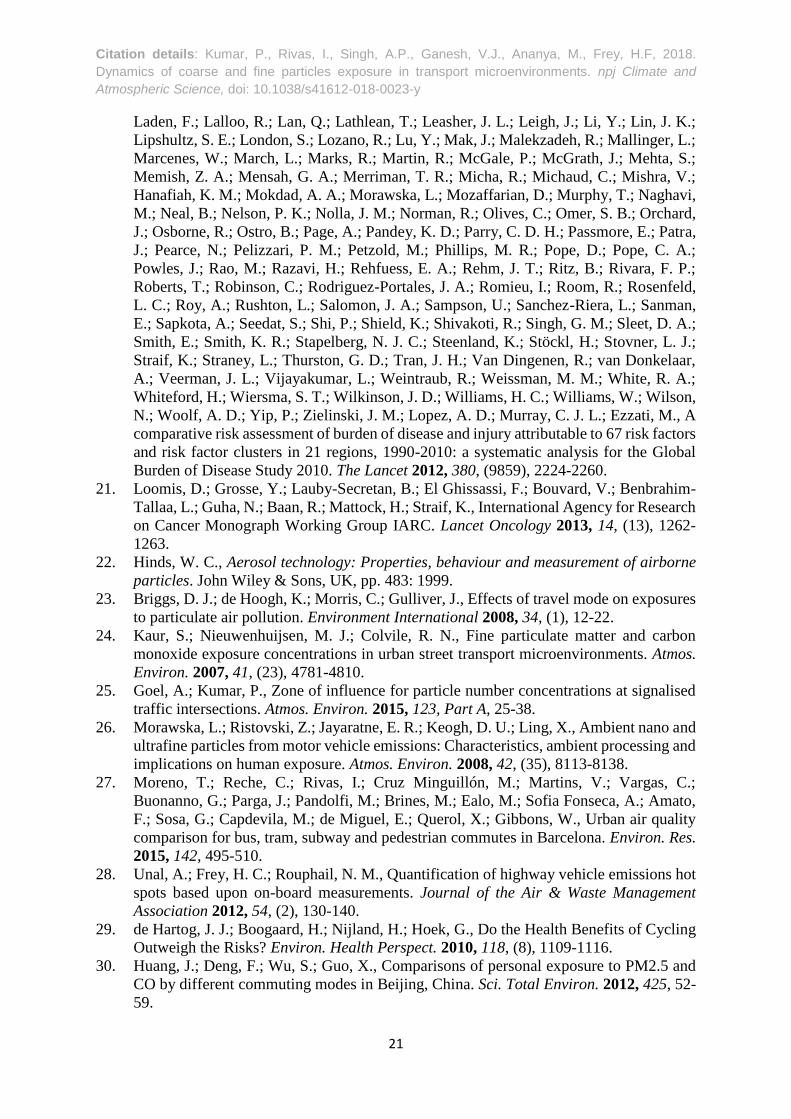
Laden, F.; Lalloo, R.; Lan, Q.; Lathlean, T.; Leasher, J. L.; Leigh, J.; Li, Y.; Lin, J. K.;
Lipshultz, S. E.; London, S.; Lozano, R.; Lu, Y.; Mak, J.; Malekzadeh, R.; Mallinger, L.;
Marcenes, W.; March, L.; Marks, R.; Martin, R.; McGale, P.; McGrath, J.; Mehta, S.;
Memish, Z. A.; Mensah, G. A.; Merriman, T. R.; Micha, R.; Michaud, C.; Mishra, V.;
Hanafiah, K. M.; Mokdad, A. A.; Morawska, L.; Mozaffarian, D.; Murphy, T.; Naghavi,
M.; Neal, B.; Nelson, P. K.; Nolla, J. M.; Norman, R.; Olives, C.; Omer, S. B.; Orchard,
J.; Osborne, R.; Ostro, B.; Page, A.; Pandey, K. D.; Parry, C. D. H.; Passmore, E.; Patra,
J.; Pearce, N.; Pelizzari, P. M.; Petzold, M.; Phillips, M. R.; Pope, D.; Pope, C. A.;
Powles, J.; Rao, M.; Razavi, H.; Rehfuess, E. A.; Rehm, J. T.; Ritz, B.; Rivara, F. P.;
Roberts, T.; Robinson, C.; Rodriguez-Portales, J. A.; Romieu, I.; Room, R.; Rosenfeld,
L. C.; Roy, A.; Rushton, L.; Salomon, J. A.; Sampson, U.; Sanchez-Riera, L.; Sanman,
E.; Sapkota, A.; Seedat, S.; Shi, P.; Shield, K.; Shivakoti, R.; Singh, G. M.; Sleet, D. A.;
Smith, E.; Smith, K. R.; Stapelberg, N. J. C.; Steenland, K.; Stöckl, H.; Stovner, L. J.;
Straif, K.; Straney, L.; Thurston, G. D.; Tran, J. H.; Van Dingenen, R.; van Donkelaar,
A.; Veerman, J. L.; Vijayakumar, L.; Weintraub, R.; Weissman, M. M.; White, R. A.;
Whiteford, H.; Wiersma, S. T.; Wilkinson, J. D.; Williams, H. C.; Williams, W.; Wilson,
N.; Woolf, A. D.; Yip, P.; Zielinski, J. M.; Lopez, A. D.; Murray, C. J. L.; Ezzati, M., A
comparative risk assessment of burden of disease and injury attributable to 67 risk factors
and risk factor clusters in 21 regions, 1990-2010: a systematic analysis for the Global
Burden of Disease Study 2010. The Lancet 2012, 380, (9859), 2224-2260.
21. Loomis, D.; Grosse, Y.; Lauby-Secretan, B.; El Ghissassi, F.; Bouvard, V.; Benbrahim-
Tallaa, L.; Guha, N.; Baan, R.; Mattock, H.; Straif, K., International Agency for Research
on Cancer Monograph Working Group IARC. Lancet Oncology 2013, 14, (13), 1262-
1263.
22. Hinds, W. C., Aerosol technology: Properties, behaviour and measurement of airborne
particles. John Wiley & Sons, UK, pp. 483: 1999.
23. Briggs, D. J.; de Hoogh, K.; Morris, C.; Gulliver, J., Effects of travel mode on exposures
to particulate air pollution. Environment International 2008, 34, (1), 12-22.
24. Kaur, S.; Nieuwenhuijsen, M. J.; Colvile, R. N., Fine particulate matter and carbon
monoxide exposure concentrations in urban street transport microenvironments. Atmos.
Environ. 2007, 41, (23), 4781-4810.
25. Goel, A.; Kumar, P., Zone of influence for particle number concentrations at signalised
traffic intersections. Atmos. Environ. 2015, 123, Part A, 25-38.
26. Morawska, L.; Ristovski, Z.; Jayaratne, E. R.; Keogh, D. U.; Ling, X., Ambient nano and
ultrafine particles from motor vehicle emissions: Characteristics, ambient processing and
implications on human exposure. Atmos. Environ. 2008, 42, (35), 8113-8138.
27. Moreno, T.; Reche, C.; Rivas, I.; Cruz Minguillón, M.; Martins, V.; Vargas, C.;
Buonanno, G.; Parga, J.; Pandolfi, M.; Brines, M.; Ealo, M.; Sofia Fonseca, A.; Amato,
F.; Sosa, G.; Capdevila, M.; de Miguel, E.; Querol, X.; Gibbons, W., Urban air quality
comparison for bus, tram, subway and pedestrian commutes in Barcelona. Environ. Res.
2015, 142, 495-510.
28. Unal, A.; Frey, H. C.; Rouphail, N. M., Quantification of highway vehicle emissions hot
spots based upon on-board measurements. Journal of the Air & Waste Management
Association 2012, 54, (2), 130-140.
29. de Hartog, J. J.; Boogaard, H.; Nijland, H.; Hoek, G., Do the Health Benefits of Cycling
Outweigh the Risks? Environ. Health Perspect. 2010, 118, (8), 1109-1116.
30. Huang, J.; Deng, F.; Wu, S.; Guo, X., Comparisons of personal exposure to PM2.5 and
CO by different commuting modes in Beijing, China. Sci. Total Environ. 2012, 425, 52-
59.

Citation details: Kumar, P., Rivas, I., Singh, A.P., Ganesh, V.J., Ananya, M., Frey, H.F, 2018.
Dynamics of coarse and fine particles exposure in transport microenvironments. npj Climate and
Atmospheric Science, doi: 10.1038/s41612-018-0023-y
22
31. Cole-Hunter, T.; Morawska, L.; Stewart, I.; Jayaratne, R.; Solomon, C., Inhaled particle
counts on bicycle commute routes of low and high proximity to motorised traffic. Atmos.
Environ. 2012, 61, 197-203.
32. Hankey, S.; Marshall, J. D., On-bicycle exposure to particulate air pollution: Particle
number, black carbon, PM2.5, and particle size. Atmos. Environ. 2015, 122, 65-73.
33. McNabola, A.; Broderick, B. M.; Gill, L. W., A numerical investigation of the impact of
low boundary walls on pedestrian exposure to air pollutants in urban street canyons. Sci.
Total Environ. 2009, 407, (2), 760-769.
34. Adams, H. S.; Nieuwenhuijsen, M. J.; Colvile, R. N.; Older, M. J.; Kendall, M.,
Assessment of road users’ elemental carbon personal exposure levels, London, UK.
Atmos. Environ. 2002, 36, (34), 5335-5342.
35. Tainio, M.; de Nazelle, A. J.; Götschi, T.; Kahlmeier, S.; Rojas-Rueda, D.;
Nieuwenhuijsen, M. J.; de Sá, T. H.; Kelly, P.; Woodcock, J., Can air pollution negate
the health benefits of cycling and walking? Preventive Medicine 2016, 87, 233-236.
36. Joodatnia, P.; Kumar, P.; Robins, A., Fast response sequential measurements and
modelling of nanoparticles inside and outside a car cabin. Atmos. Environ. 2013, 71, 364-
375.
37. Kumar, P.; Goel, A., Concentration dynamics of coarse and fine particulate matter at and
around the signalised traffic intersections. Environmental Science: Processes & Impacts
2016, 18, 1220-1235.
38. Mkoma, S. L.; da Rocha, G. O.; Regis, A. C. D.; Domingos, J. S. S.; Santos, J. V. S.; de
Andrade, S. J.; Carvalho, L. S.; de Andrade, J. B., Major ions in PM2.5 and PM10 released
from buses: The use of diesel/biodiesel fuels under real conditions. Fuel 2014, 115, 109-
117.
39. Chio, C.-P.; Cheng, Y.-H.; Ling, M.-P.; Chen, S.-C.; Liao, C.-M., Quantitative estimation
of excess mortality for drivers and passengers exposed to particulate matters in long-
distance buses. Atmos. Environ. 2012, 51, 260-267.
40. Wang, J.; Zhao, L.; Zhu, D.; Gao, H. O.; Xie, Y.; Li, H.; Xu, X.; Wang, H.,
Characteristics of particulate matter (PM) concentrations influenced by piston wind and
train door opening in the Shanghai subway system. Transportation Research Part D:
Transport and Environment 2016, 47, 77-88.
41. Jaffe, D.; Putz, J.; Hof, G.; Hof, G.; Hee, J.; Lommers-Johnson, D. A.; Gabela, F.; Fry,
J. L.; Ayres, B.; Kelp, M.; Minsk, M., Diesel particulate matter and coal dust from trains
in the Columbia River Gorge, Washington State, USA. Atmospheric Pollution Research
2015, 6, (6), 946-952.
42. Rivas, I.; Kumar, P.; Hagen-Zanker, A., Exposure to air pollutants during commuting in
London: are there inequalities among different socio-economic groups? Environment
International 2017, 101, 143-157.
43. Peters, J.; Van den Bossche, J.; Reggente, M.; Van Poppel, M.; De Baets, B.; Theunis,
J., Cyclist exposure to UFP and BC on urban routes in Antwerp, Belgium. Atmos.
Environ. 2014, 92, 31-43.
44. Schepers, P.; Fishman, E.; Beelen, R.; Heinen, E.; Wijnen, W.; Parkin, J., The mortality
impact of bicycle paths and lanes related to physical activity, air pollution exposure and
road safety. Journal of Transport & Health 2015, 2, (4), 460-473.
45. Tainio, M.; de Nazelle, A. J.; Götschi, T.; Kahlmeier, S.; Rojas-Rueda, D.;
Nieuwenhuijsen, M. J.; de Sá, T. H.; Kelly, P.; Woodcock, J., Can air pollution negate
the health benefits of cycling and walking? Preventive Medicine 2016, 87, (Supplement
C), 233-236.

Citation details: Kumar, P., Rivas, I., Singh, A.P., Ganesh, V.J., Ananya, M., Frey, H.F, 2018.
Dynamics of coarse and fine particles exposure in transport microenvironments. npj Climate and
Atmospheric Science, doi: 10.1038/s41612-018-0023-y
23
46. Li, Z.; Che, W.; Frey, H. C.; Lau, A. K. H.; Lin, C., Characterization of PM2.5 exposure
concentration in transport microenvironments using portable monitors. Environ. Pollut.
2017, 228, 433-442.
47. Che, W. W.; Frey, H. C.; Lau, A. K. H., Sequential measurement of intermodal variability
in public transportation PM2.5 and CO exposure concentrations. Environmental Science
& Technology 2016, 50, (16), 8760-8769.
48. Ramos, M. J.; Vasconcelos, A.; Faria, M., Comparison of Particulate Matter Inhalation
for Users of Different Transport Modes in Lisbon. Transportation Research Procedia
2015, 10, 433-442.
49. Goel, R.; Gani, S.; Guttikunda, S. K.; Wilson, D.; Tiwari, G., On-road PM2.5 pollution
exposure in multiple transport microenvironments in Delhi. Atmos. Environ. 2015, 123,
Part A, 129-138.
50. Li, B.; Lei, X.-n.; Xiu, G.-l.; Gao, C.-y.; Gao, S.; Qian, N.-s., Personal exposure to black
carbon during commuting in peak and off-peak hours in Shanghai. Sci. Total Environ.
2015, 524–525, 237-245.
51. Liu, W.-T.; Ma, C.-M.; Liu, I. J.; Han, B.-C.; Chuang, H.-C.; Chuang, K.-J., Effects of
commuting mode on air pollution exposure and cardiovascular health among young
adults in Taipei, Taiwan. International Journal of Hygiene and Environmental Health
2015, 218, (3), 319-323.
52. Jiao, W.; Frey, C. H., Comparison of fine particulate matter and carbon monoxide
exposure concentrations for selected transportation modes. Transportation Research
Record: Journal of the Transportation Research Board 2014, 2428, 54-62.
53. Quiros, D. C.; Lee, E. S.; Wang, R.; Zhu, Y., Ultrafine particle exposures while walking,
cycling, and driving along an urban residential roadway. Atmos. Environ. 2013, 73, 185-
194.
54. Kingham, S.; Longley, I.; Salmond, J.; Pattinson, W.; Shrestha, K., Variations in
exposure to traffic pollution while travelling by different modes in a low density, less
congested city. Environ. Pollut. 2013, 181, 211-218.
55. Yu, Q.; Lu, Y.; Xiao, S.; Shen, J.; Li, X.; Ma, W.; Chen, L., Commuters' exposure to
PM1 by common travel modes in Shanghai. Atmos. Environ. 2012, 59, 39-46.
56. Kaur, S.; Nieuwenhuijsen, M.; Colvile, R., Personal exposure of street canyon
intersection users to PM2.5, ultrafine particle counts and carbon monoxide in Central
London, UK. Atmos. Environ. 2005, 39, (20), 3629-3641.
57. Gulliver, J.; Briggs, D. J., Personal exposure to particulate air pollution in transport
microenvironments. Atmos. Environ. 2004, 38, (1), 1-8.
58. Chan, L. Y.; Lau, W. L.; Zou, S. C.; Cao, Z. X.; Lai, S. C., Exposure level of carbon
monoxide and respirable suspended particulate in public transportation modes while
commuting in urban area of Guangzhou, China. Atmos. Environ. 2002, 36, (38), 5831-
5840.
59. Adams, H. S.; Nieuwenhuijsen, M. J.; Colvile, R. N.; McMullen, M. A. S.; Khandelwal,
P., Fine particle (PM2.5) personal exposure levels in transport microenvironments,
London, UK. Sci. Total Environ. 2001, 279, (1), 29-44.
60. Gee, I. L.; Raper, D. W., Commuter exposure to respirable particles inside buses and by
bicycle. Sci. Total Environ. 1999, 235, (1–3), 403-405.
61. CiS, Census in Surrey, Data Collection – Census Household Characteristics: Car
availability. 2011.
62. Sun rise and sun set in Guildford. Available at: http://www.sunrise-and-
sunset.com/en/sun/united-kingdom/guildford/2015/april (accessed 30.04.2015) 2015.

Citation details: Kumar, P., Rivas, I., Singh, A.P., Ganesh, V.J., Ananya, M., Frey, H.F, 2018.
Dynamics of coarse and fine particles exposure in transport microenvironments. npj Climate and
Atmospheric Science, doi: 10.1038/s41612-018-0023-y
24
63. Metoffice, UK met office. http://www.metoffice.gov.uk/datapoint (accessed 08.03.16).
2016.
64. Azarmi, F.; Kumar, P., Ambient exposure to coarse and fine particle emissions from
building demolition. Atmos. Environ. 2016, 137, 62-79.
65. Tsuda, A.; Henry, F. S.; Butler, J. P., Particle transport and deposition: basic physics of
particle kinetics. Comprehensive Physiology 2013, 3, (4), 1437-1471.
66. ICRP Publication 66: Human respiratory tract model for radiological protection A Report
of a task group of the International Commission on Radiological Protection 1994, (24(1-
3)), 1-482.
67. Chien, C. H.; Theodore, A.; Wu, C. Y.; Hsu, Y. M.; Birky, B., Upon correlating diameters
measured by optical particle counters and aerodynamic particle sizers. J. Aerosol Sci
2016, 101, 77-85.
68. Sanders, P. G.; Xu, N.; Dalka, T. M.; Maricq, M. M., Airborne brake wear debris: size
distributions, composition, and a comparison of dynamometer and vehicle tests. Environ.
Sci. Technol. 2003, 37, 4060-4069.
69. Vu, T. V.; Ondracek, J.; Zdímal, V.; Schwarz, J.; Delgado-Saborit, J. M.; Harrison, R.
M., Physical properties and lung deposition of particles emitted from five major indoor
sources. Air Qual Atmos Health 2017, 10, (1), 1-14.
70. Hudda, N.; Eckel, S. P.; Knibbs, L. D.; Sioutas, C.; Delfino, R. J.; Fruin, S. A., Linking
in-vehicle ultrafine particle exposures to on-road concentrations. Atmos. Environ. 2012,
59, 578-586.
71. Goel, A.; Kumar, P., Vertical and horizontal variability in airborne nanoparticles and
their exposure around signalised traffic intersections. Environ. Pollut. 2016, 214, 54-69.
72. Kumar, P.; Fennell, P.; Langley, D.; Britter, R., Pseudo-simultaneous measurements for
the vertical variation of coarse, fine and ultra fine particles in an urban street canyon.
Atmos. Environ. 2008, 42, (18), 4304-4319.
73. Kumar, P.; Rivas, I.; Sachdeva, L., Exposure of in-pram babies to airborne particles
during morning drop-in and afternoon pick-up of school children. Environ. Pollut. 2017,
224, 407-420.
74. Joodatnia, P.; Kumar, P.; Robins, A., The behaviour of traffic produced nanoparticles in
a car cabin and resulting exposure rates. Atmos. Environ. 2013, 65, (0), 40-51.
75. Tunno, B. J.; Dalton, R.; Cambal, L.; Holguin, F.; Lioy, P.; Clougherty, J. E., Indoor
source apportionment in urban communities near industrial sites. Atmos. Environ. 2016,
139, 30-36.
76. Franzen, A.; Van Landingham, C.; Greene, T.; Plotzke, K.; Gentry, R., A global human
health risk assessment for Decamethylcyclopentasiloxane (D5). Regul. Toxicol. Pharm.
2016, 74, S25-S43.

Citation details: Kumar, P., Rivas, I., Singh, A.P., Ganesh, V.J., Ananya, M., Frey, H.F, 2018.
Dynamics of coarse and fine particles exposure in transport microenvironments. npj Climate and
Atmospheric Science, doi: 10.1038/s41612-018-0023-y
25
FIGURES
Figure 1. Description of routes followed by the bus and CCW (car, cycle and walk) modes.
The background map is drawn over the image taken from Map data ©2017 Google.
Map Legends
Bus route CCW routesStart-End (CCW)Start-End (Bus)
Route Lengths
Bus route 13.84 km
CBW routes 5.3 km
Common route 1.6 km
North

Citation details: Kumar, P., Rivas, I., Singh, A.P., Ganesh, V.J., Ananya, M., Frey, H.F, 2018.
Dynamics of coarse and fine particles exposure in transport microenvironments. npj Climate and
Atmospheric Science, doi: 10.1038/s41612-018-0023-y
26
Figure 2. Concentrations of different PM fractions during morning (MP), off-peak (OP) and
evening hours (EP) for the studied commuting modes. The circular signs refer to the arithmetic
mean concentrations while the median values are shown by horizontal lines within the bars.
0
30
60
90
120
150
180P
M c
on
cen
trat
ion
(µ
g.m
-3)
PM10 PM2.5-10
0
20
40
60
80
Bu
s
Car
Cy
cle
Wal
k
Bu
s
Car
Cy
cle
Wal
k
Bu
s
Car
Cy
cle
Wal
k
MP OP EP
PM
co
nce
ntr
atio
n (
µg.m
-3) PM2.5
Bu
s
Car
Cy
cle
Wal
k
Bu
s
Car
Cy
cle
Wal
k
Bu
s
Car
Cy
cle
Wal
k
MP OP EP
PM1

Citation details: Kumar, P., Rivas, I., Singh, A.P., Ganesh, V.J., Ananya, M., Frey, H.F, 2018.
Dynamics of coarse and fine particles exposure in transport microenvironments. npj Climate and
Atmospheric Science, doi: 10.1038/s41612-018-0023-y
27
Figure 3. Average concentrations of coarse and fine particles over the three time periods for
commuting modes. The images used are copyright free under the creative common licence
(extracted using the Microsoft PowerPoint). Only positive standard deviation values are added
to maintain the clarity of the figure.
0
20
40
60
80
100
120P
M c
on
ce
ntr
atio
ns (
µg
m-3
)
Coarse particles (PM2.5-10)
Fine particles (PM2.5)
Commuting modes
Bus Car Cycle Walk

Citation details: Kumar, P., Rivas, I., Singh, A.P., Ganesh, V.J., Ananya, M., Frey, H.F, 2018.
Dynamics of coarse and fine particles exposure in transport microenvironments. npj Climate and
Atmospheric Science, doi: 10.1038/s41612-018-0023-y
28
Figure 4. (a) Absolute and (b) fractional contributions of average PM mass concentrations.
0
20
40
60
80
100
MP OP EP MP OP EP MP OP EP MP OP EP
BUS CAR CYCLE WALK
Mea
n P
M m
ass
con
cen
trat
ion
(µ
g .
m-3
)
PM2.5-10 PM1-2.5 PM1 (a)
0%
25%
50%
75%
100%
MP OP EP MP OP EP MP OP EP MP OP EP
BUS CAR CYCLE WALK
Fra
ctio
n o
f P
M c
on
cen
trat
ion
s
(b)
Citation details: Kumar, P., Rivas, I., Singh, A.P., Ganesh, V.J., Ananya, M., Frey, H.F, 2018.
Dynamics of coarse and fine particles exposure in transport microenvironments. npj Climate and
Atmospheric Science, doi: 10.1038/s41612-018-0023-y
29
Figure 5. Normalized (with respect to walk mode) concentrations of different sized PM in
various TMEs assessed in this study. The error bars represent minimum and maximum values
of the average ratios.
MP
OP
EP
MP
OP
EP
MP
OP
EP
Bus
Car
Cycl
e
Conce
ntr
atio
n r
atio
to w
alk PM10 PM2.5-10
0 1 2 3 4
MP
OP
EP
MP
OP
EP
MP
OP
EP
Bus
Car
Cycl
e
Conce
ntr
atio
n r
atio
to w
alk
PM2.5
0 1 2 3 4
PM1

Citation details: Kumar, P., Rivas, I., Singh, A.P., Ganesh, V.J., Ananya, M., Frey, H.F, 2018.
Dynamics of coarse and fine particles exposure in transport microenvironments. npj Climate and
Atmospheric Science, doi: 10.1038/s41612-018-0023-y
30
Figure 6. Estimated RDD for (a) coarse and (b) fine particles for males during sitting (bus and
car), heavy exercise (cycling) and light exercise (walk). The whiskers in the figure represent
5th and 95th percentiles, whereas the box plot represents for 25th, 50th (median) and 75th
percentiles. The arithmetic mean for the data is represented by diamond symbols.
0
5
10
15
MP OP EP MP OP EP MP OP EP MP OP EP
Bus Car Cycle Walk
RD
D f
or
fine
par
ticl
es (
µg.h
-1)
0
30
60
90
120
150
180
210
MP OP EP MP OP EP MP OP EP MP OP EP
Bus Car Cycle Walk
RD
D f
or
coar
se p
arti
cles
(µ
g.h
-1)
0
1
2
3
MP OP EP
Car
(b)
(a)

Citation details: Kumar, P., Rivas, I., Singh, A.P., Ganesh, V.J., Ananya, M., Frey, H.F, 2018.
Dynamics of coarse and fine particles exposure in transport microenvironments. npj Climate and
Atmospheric Science, doi: 10.1038/s41612-018-0023-y
31
Table 1. Summary of relevant past studies assessing various modes of travel.
Study type City (Country) Observed
modes
Pollutants
measured
Reference
Comparison of exposed levels of
air pollutants while commuting in
different transport
microenvironments
London (UK) Car, Bus,
Underground
Ultrafine
particles, BC,
PM1, PM2.5 and
PM10
Rivas et al. 42
Measurements of PM2.5 in various
travel modes
Hong Kong (China) Minibus,
Double-decker
bus and metro
train
PM2.5 Li et al. 46
Measurements of PM2.5 and CO in
different travel modes
Hong Kong (China) Minibus,
Double-decker
bus,
pedestrian,
tram and
metro train
PM2.5, CO Che et al. 47
Levels and deposition dose of fine
and coarse particles at and around
signalised traffic intersections
Guildford (UK) Car PM1, PM2.5,
PM10
Kumar and Goel 37
Comparison of PM inhalation for
users of different transport modes
Lisbon (Portugal) Walking,
train, bus,
mini-bus, tram
and subway
PM10, PM2.5 Ramos et al. 48
On-road pollution exposure in
multiple travel modes
New Delhi (India) Walking,
cycle,
motorised
two-wheeler,
car,
autorickshaw,
bus, and metro
PM2.5 Goel et al. 49
Urban air quality in different
commuting modes
Barcelona (Spain) Bus,
Underground,
Tram, Walk
BC, CO, CO2,
Particles
number
concentration,
metals
Moreno et al. 27
Personal exposure to black carbon
during commuting in peak and off-
peak hours
Shanghai (China) Subway, car,
bus, cycle,
walking
Black Carbon
(BC)
Li et al. 50
Effects of commuting mode on air
pollution exposure and
cardiovascular health among
young adults
Taipei (Taiwan) Subway, gas-
powered bus,
a gasoline-
powered car,
and walking
PM2.5 Liu et al. 51
Comparison of exposed fine
particles and CO in transportation
modes
Raleigh (USA) Walk, Bus,
Car
PM2.5, CO Jiao and Frey 52
Ultrafine particle exposures while
walking, cycling, and driving
along an urban residential roadway
California (USA) Walking,
cycle, car
Ultrafine
particles, PM2.5
Quiros et al. 53
Variations in exposure to traffic
pollution while travelling by
different modes in a low density,
less congested city
Christchurch (New
Zealand)
Bus, car, cycle
off-road and
cycle on-road.
PM10, PM2.5,
PM1, Ultrafine
particles
Kingham et al. 54
A travel mode comparison of
commuters’ exposure to air
pollutants
Barcelona (Spain) Walking, bike,
bus, and car
BC, ultrafine
particles, CO,
CO2, PM2.5
de Nazelle et al. 8
Comparisons of personal exposure
by different commuting modes
Beijing (China) Taxi, bus,
cycle
PM2.5 Huang et al. 30
Citation details: Kumar, P., Rivas, I., Singh, A.P., Ganesh, V.J., Ananya, M., Frey, H.F, 2018.
Dynamics of coarse and fine particles exposure in transport microenvironments. npj Climate and
Atmospheric Science, doi: 10.1038/s41612-018-0023-y
32
Exposure to PM in common travel
modes
Shanghai (China) Bus, walking,
cycle, taxi,
subway
PM1 Yu et al. 55
Air pollution and activity during
transportation
New York (USA) Car, subway,
walk
PM2.5 HEI 1
Effects of travel mode on
exposures to particulate air
pollution
London (UK) Car, walking PM10,PM2.5–10,
PM2.5, PM2.5–10,
and PM1,
ultrafine
particles
Briggs et al. 23
Personal exposure to ultrafine and
fine particles and CO in Central
London
London (UK) Walk, Cycle,
Bus, Car, Taxi
Ultrafine
particles, PM2.5,
CO
Kaur et al. 56
Personal exposure to PM
comparisons in travel modes
Northampton (UK) Car, walking PM10, PM2.5,
PM1
Gulliver and Briggs 57
Exposure level of particulate
matter in public transportation
modes while commuting in urban
areas
Guangzhou (China) Subway, bus,
Taxi
PM10, PM2.5 Chan et al. 58
Fine particles exposure levels in
transport microenvironments
London (UK) Cycle, Bus,
Car,
underground
PM2.5 Adams et al. 59
Commuter exposure to respirable
particles inside buses and by Cycle
Manchester (UK) Bus, cycle PM4 Gee and Raper 60
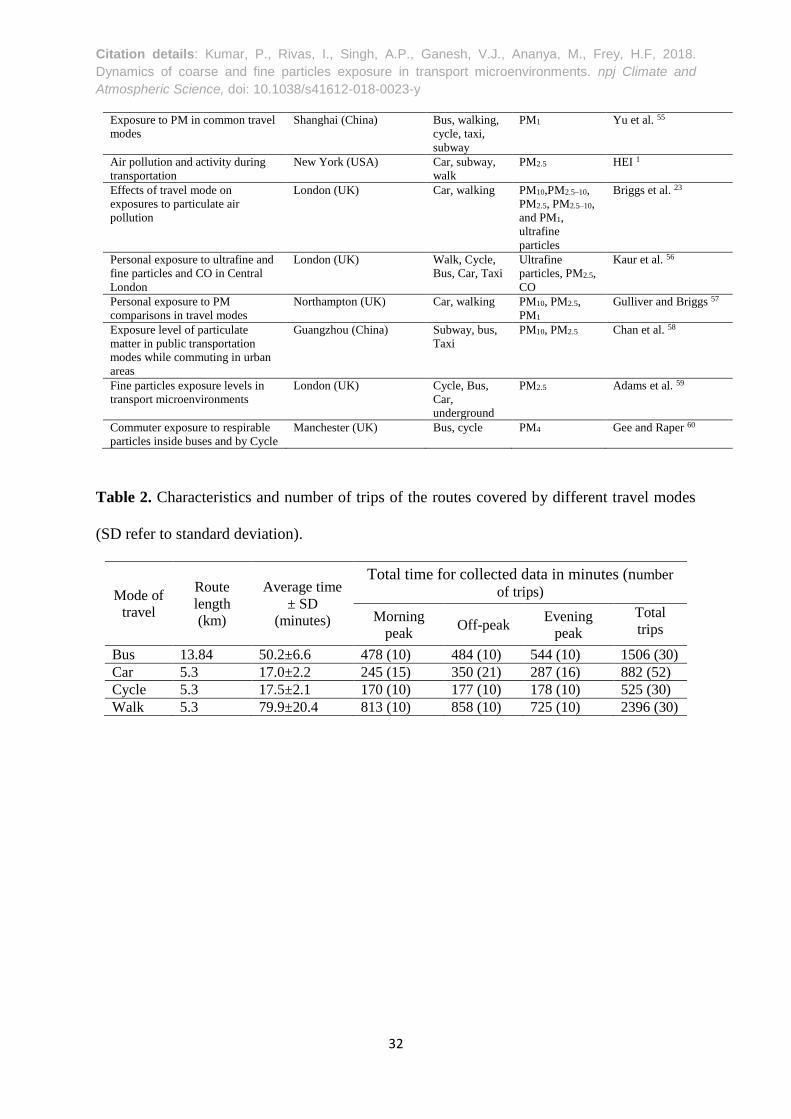
Table 2. Characteristics and number of trips of the routes covered by different travel modes
(SD refer to standard deviation).
Mode of
travel
Route
length
(km)
Average time
± SD
(minutes)
Total time for collected data in minutes (number
of trips)
Morning
peak Off-peak
Evening
peak
Total
trips
Bus 13.84 50.2±6.6 478 (10) 484 (10) 544 (10) 1506 (30)
Car 5.3 17.0±2.2 245 (15) 350 (21) 287 (16) 882 (52)
Cycle 5.3 17.5±2.1 170 (10) 177 (10) 178 (10) 525 (30)
Walk 5.3 79.9±20.4 813 (10) 858 (10) 725 (10) 2396 (30)
Citation details: Kumar, P., Rivas, I., Singh, A.P., Ganesh, V.J., Ananya, M., Frey, H.F, 2018.
Dynamics of coarse and fine particles exposure in transport microenvironments. npj Climate and
Atmospheric Science, doi: 10.1038/s41612-018-0023-y
33
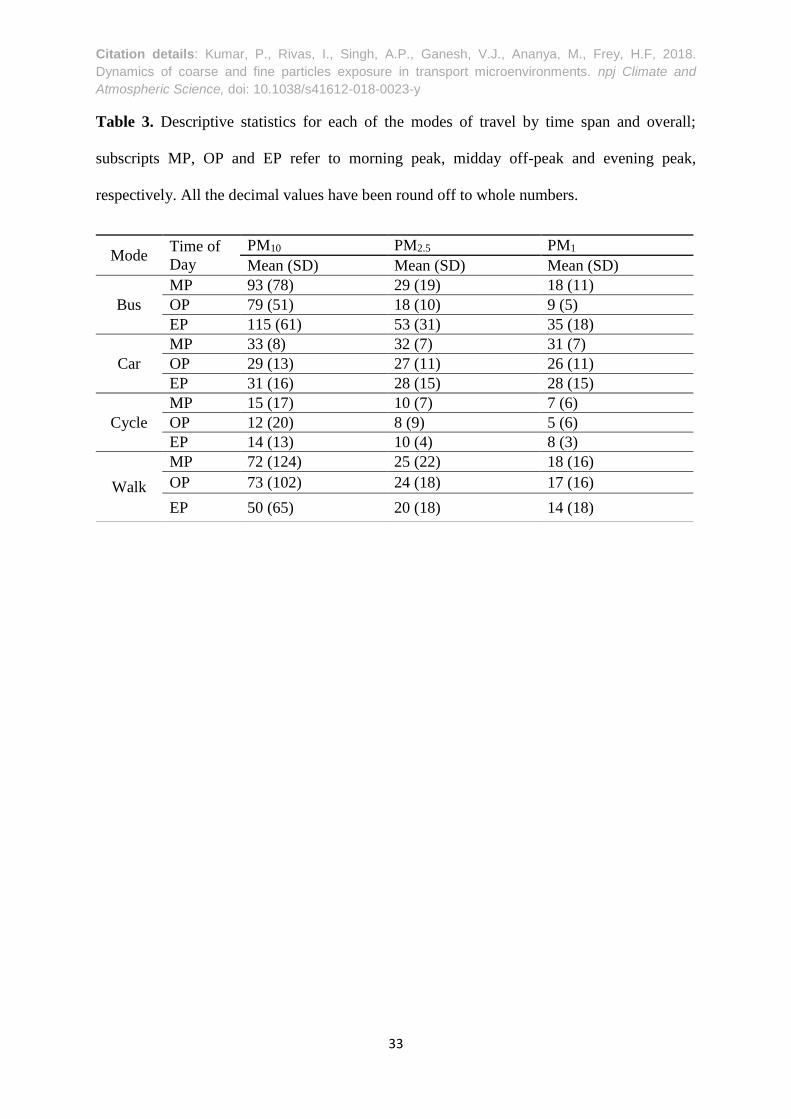
Table 3. Descriptive statistics for each of the modes of travel by time span and overall;
subscripts MP, OP and EP refer to morning peak, midday off-peak and evening peak,
respectively. All the decimal values have been round off to whole numbers.
Mode Time of
Day
PM10 PM2.5 PM1
Mean (SD) Mean (SD) Mean (SD)
Bus
MP 93 (78) 29 (19) 18 (11)
OP 79 (51) 18 (10) 9 (5)
EP 115 (61) 53 (31) 35 (18)
Car
MP 33 (8) 32 (7) 31 (7)
OP 29 (13) 27 (11) 26 (11)
EP 31 (16) 28 (15) 28 (15)
Cycle
MP 15 (17) 10 (7) 7 (6)
OP 12 (20) 8 (9) 5 (6)
EP 14 (13) 10 (4) 8 (3)
Walk
MP 72 (124) 25 (22) 18 (16)
OP 73 (102) 24 (18) 17 (16)
EP 50 (65) 20 (18) 14 (18)