Dynamics of Asymmetric Information and Capital Structurepeople.stern.nyu.edu/nhalov/Halov.pdf ·...
34
Dynamics of Asymmetric Information and Capital Structure Nikolay Halov 1 NYU – Stern School of Business November 2006 Abstract I propose a model of financing decisions in an environment where asymmetric information changes through time. My goal is to determine the optimal sequence of securities as a function of the amount and dynamics of the asymmetric information advantage that insiders of the firm have with respect to outside investors. I identify a novel cost of debt that arises in this dynamic setting. Whereas in a one period model, debt is always preferred to equity because it is less sensitive to the private information managers have, with multiple overlapping investment projects, debt issues today make future security issues more sensitive to the degree of asymmetric information in the issuance period. I use the dispersion of analyst forecasts for different horizons to proxy for current and future asymmetric information and examine the financing of a large panel of US firms. I find that future adverse selection costs affect negatively the debt component of new external financing and positively the cash reserves of the firm. This evidence is consistent with the prediction of my model that companies try to minimize adverse selection costs intertemporally. 1 NYU Stern School of Business, email: [email protected] . I am grateful to Kose John for invaluable guidance and discussions. I also want to thank Heitor Almeida, Yakov Amihud, Menachem Brenner, Florian Heider, Eli Ofek and Daniel Wolfenzon for helpful comments and suggestion. Usual disclaimer applies.
Transcript of Dynamics of Asymmetric Information and Capital Structurepeople.stern.nyu.edu/nhalov/Halov.pdf ·...
Dynamics of Asymmetric Information and Capital Structure
Nikolay Halov1
NYU – Stern School of Business
November 2006
Abstract
I propose a model of financing decisions in an environment where asymmetric information changes through time. My goal is to determine the optimal sequence of securities as a function of the amount and dynamics of the asymmetric information advantage that insiders of the firm have with respect to outside investors. I identify a novel cost of debt that arises in this dynamic setting. Whereas in a one period model,debt is always preferred to equity because it is less sensitive to theprivate information managers have, with multiple overlapping investment projects, debt issues today make future security issues more sensitive to the degree of asymmetric information in the issuance period. I use the dispersion of analyst forecasts for different horizons to proxy for current and future asymmetric information and examine the financing of a large panel of US firms. I find that future adverse selection costs affect negatively the debt component of new external financing and positively the cash reserves of the firm. This evidence is consistent with the prediction of my model that companies try to minimize adverse selection costs intertemporally.
1 NYU Stern School of Business, email: [email protected]. I am grateful to Kose John for invaluable guidance and discussions. I also want to thank Heitor Almeida, Yakov Amihud, Menachem Brenner, Florian Heider, Eli Ofek and Daniel Wolfenzon for helpful comments and suggestion. Usual disclaimer applies.
2
1. Introduction
In this study, I propose a model of financing decisions in an environment with
dynamic asymmetric information. In this setting, the choice of security depends not only
on the current adverse selection cost of the security but also on the future information
environment and future financing needs of the firm. When managers anticipate an
increase in the asymmetric information, even though they have private information at
present, managers may choose to issue equity. The goal is to determine the optimal
sequence of securities as a function of the size and dynamics of the asymmetric
information advantage that insiders of the firm have with respect to outside investors. I
use dispersion of analyst forecast for different horizons, the probability of informed
trading measure and analyst following to find support for my hypothesis. I find that the
dispersion of analyst forecasts for the current year and following year have markedly
different effects on the capital structure decisions of the firm which are consistent with
firms trying to minimize adverse selection cost intertemporally.
Since the seminal research by Myers (1984) and Myers and Majluf (1984) it has
been recognized that when it is impossible or costly for firms to convey the true value of
their assets to outside investors, firms may be forced to forgo projects with positive net
present value. In reaction companies optimally choose to use sources of funds that are
insensitive to the information advantage of insiders. When managers know more about
the mean expected returns, this leads to the classical pecking order of using all internal
funds first and if additional capital is needed to be raised, debt should be issued. Equity

3
should be issued only as a last resort when the leverage is at a very high level at which
the firm has exhausted its debt capacity.
In fact however, companies make a sequence of financing decisions over time. It
is clear that myopically following the pecking order rule is not going to be optimal for a
big proportion of firms. It is natural that insiders, namely the managers running the
company, would do better if they minimize the adverse selection costs of all rounds of
financing by picking an optimal sequence of securities. Although Myers and Majluf
(1984) do not consider the dynamic issues explicitly, one solution that they propose for
the single period problem suggests a remedy for the dynamic problem. If managers do
not have an information advantage at some point before the investment has to be made,
companies should build financial slack to be used later when the valuations of insiders
and outsiders diverge.
For the majority of firms however, it is likely that they will suffer highest adverse
selection costs while they are young and lack established relations with the capital
markets. On the one hand for a typical firm, the information asymmetry may gradually be
reduced through time as more and more investors start producing information about the
firm and as it accumulates price histories of its securities. On the other hand, we often
observe old established firms that still face significant information asymmetries when
raising capital. Possible reasons for why the firm may become less transparent are sharp
increases in prices of inputs, a change of the management team, a change in the corporate
governance, or a change of the focus of the company through investments in projects that
4
are outside of main line of business or by developing new products2. Essentially any
change in the company that breaks patterns and invalidates the past historical experience
of investors dealing with the firm diminishes the capability of outsiders to correctly price
the securities of the firm. In this case, the informational advantage of managers receiving
first-hand signals about the quality of the firm becomes bigger.
I consider a dynamic model of financing choices in a multiperiod setting. In this
environment the choice of securities depends as much on the current level of adverse
selection costs as on the change in adverse selection costs in the future. The main result is
that firms may issue equity if corporate insiders anticipate that their asymmetric
information advantage will increase in the future. This is a reversal of the single period
intuition that firms issue debt in the presence of asymmetric information. The novel effect
is that debt financing is associated with higher future adverse selection costs for the firm
since the riskier securities of the levered firm will be more sensitive to the private
information advantage of insiders. In addition, my model predicts that for big expected
increases in adverse selection costs, firms may optimally raise financial slack and avoid
external financing in the future.
Following the empirical literature, I consider the dispersion of analyst earnings-
per-share forecasts as a proxy for asymmetric information. As Ryan (2001) shows, under
fairly general restrictions on the analysts’ information sets, forecast dispersion will
decline when managers disclose information about future earnings that the analysts do
not have and hence forecast dispersion can be used as a proxy for asymmetric
information. An added advantage of forecast dispersion is that it provides an estimate
2 Krishnaswami and Subramaniam (1999) show evidence that companies take into account expected adverse selection problems and try to mitigate them by spinning off firm divisions before raising more capital.
5
about the amount of information available to outside investors for different periods.
Specifically I use the dispersion of forecasts about earnings for the current fiscal year and
the following fiscal year to measure asymmetric information at present and in the future.
I examine the slope coefficient on a regression of change in long term debt against
financing deficit3. It measures the proportion of long term debt in total new external
financing. I find, as predicted by my model, that the proportion of debt is negatively
related to future adverse selection costs and positively related to adverse selection costs at
present. The result is significant both statistically and economically and it does not appear
to be driven by static trade off considerations or market timing. In particular, I control
carefully for the risk level of the firm using the recent asset volatility of the firm, the
unlevered Z-score and fixed effects for different long term issuer credit ratings and the
effect of future adverse selection costs is robust. I also consider alternative proxies for the
change in asymmetric information based on the number of analyst following the firm and
the probability of informed trading measure (PIN), which can be estimated from the
signed order flow, under the assumption that information events occur only at the
beginning of a sequence of independent trading days. Therefore, the greater the estimated
PIN4, the greater is the intensity of information asymmetry around firm i’s activity in a
fiscal year. Finally, I find that firms with higher expected future asymmetric information
keep higher levels of cash and marketable securities, consistent with the implications of
the model.
3 For discussion of the test and evidence about the performance of the pecking order theory see Shyam –Sunder and Myers (1999) and Frank and Goyal (2003).4 Annual estimates of PIN are kindly made available on the web by S. Hvidkjaer. For more details about the MLE estimation of PIN, see Easley, Hvidkjaer, and O’Hara, (2004).
6
The paper contributes to the body of literature that studies the effect of
information asymmetry on the capital structure of the firm. It gives an alternative
explanation why firms may issue equity even though in a one period setting equity is
associated with higher adverse selection costs. I predict a different effect on the debt
equity choice of adverse selection costs at present versus adverse selection costs in the
future. The current literature predominantly considers the effect of current asymmetric
information on capital structure but the evidence is mixed at best. Shyam-Sunder and
Myers (1999) find that firms predominantly use debt when raising external financing but
Fama and French (2002) challenge this result and Frank and Goyal (2003) find that the
effect is restricted to large mature firms which arguably suffer from less asymmetric
information problems. Lemmon and Zender (2004) consider explicitly the value of
maintaining financial slack. Bharath, Pasquariello and Wu (2005) consider the effect of
several proxies for asymmetric information based on the market microstructure literature.
Dittmar and Thakor (2005) emphasize the effect of disagreement between investors and
the managers of the firm. Korajczyk, Lucas and McDonald, (1992) consider the
information asymmetry between earnings announcements and the effect on the secondary
equity offering announcement effect while Viswanath (1993) studies the choice between
cash and equity under asymmetric information. Chang, Dasgupta and Hillary (2004)
study the effect of analyst following on capital structure, while Autore and Kovacs (2005)
use the dispersion of analyst forecasts and the use of shelf and PIPE offers to study the
hierarchy of financing choices. Finally, D’Mello and Ferris (2000) confirm that
announcement effects of equity issues are negatively related to information asymmetry as
measured by the dispersion of analyst forecasts.

7
The organization of the remainder of the paper is the following. Section 2
describes the model, section 3 discusses the empirical proxy for asymmetric information
at different periods and shows the empirical test and section 4 concludes.
2. Model
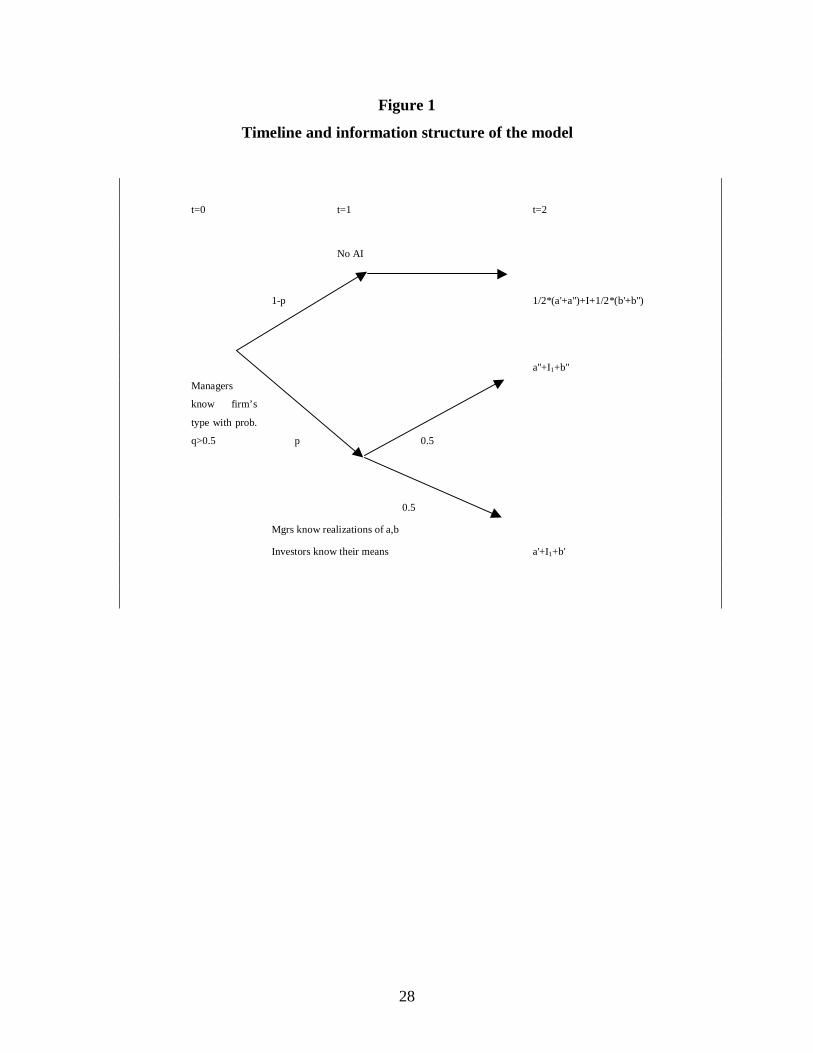
There are 3 dates t = 0, 1, 2 (2 periods) in the model.
The model examines the capital structure decisions of firms that face adverse
selection problems. In particular, managers are better informed about the prospects and
the future payoffs of the firm than the potential outside investors. There are no moral
hazard costs i.e. the managers maximize the value of existing (old) equity. Both managers
(inside equity holders) and outside investors are risk neutral and the capital markets are
under perfect competition where the intertemporal discount rate is 0, that is the expected
returns for outsiders are 0.
The next section sets up the general structure where firms can only choose debt or
equity to finance their project or they can pass up the investment opportunity and the
amount needed for the investment is fixed. In addition, firms are not allowed to build
financial slack by raising more capital than they can invest during the period. Later I will
discuss a setting where this restriction is relaxed.
Project description
There are 2 types of firms, good (G) and bad (B) and it is common knowledge that
the proportion of each type is 50%. There are 2 projects: Project A requires investment of
I0 at t = 0 and pays off at t = 2. The possible payoffs are a” and a’ (a” > a’) depending on
the quality of the firm. Project B requires an investment of I1 at t = 1 and pays off I1 + b”

8
if the firm is of the type G, and I1 + b’ otherwise. Both projects have positive net present
value i.e. 0.5[a” + a’] - I0 > 0 and 0.5[b” + b’] > 0
Information structure
At t = 0 the managers receive a private signal x ∈ {g, b} about the quality of their
firm. Half of the firms receive a good signal g and half of them a bad signal b such that
Prob(G|g)=Prob(B|b)=q
If q=0.5 the managers do not know more than the market i.e. they know that their
firm is of type G or B with equal probability. If q >0.5 the insiders are better informed
than outsiders about the prospects of the firm. If for example q = 0.7 and x = g, the
managers know that their firm has a 70% percent chance to turn out to be of type G.
That is, at t = 0 there is asymmetric information and managers that received a
good signal, managers that received a bad signal and outside investors will all have
different expectations about the value of the firm and the payoffs of the projects and
hence different valuation for the securities of the firm. Note that the quality of the signal
q can be interpreted as the level of information asymmetry. The higher the q, the higher is
the difference in the valuations of insiders and uninformed investors.
With probability 1 - p at t = 1 outsiders learn the t = 0 signal received by the
manager. In other words, with probability 1 - p insiders and investors will have the same
information set. I refer to this node as NoAI state.
With probability p at t = 1 the managers learn the type of the firm for sure, while
the investors again believe each firm to be of type G with probability 0.5. In the sequel
this state is referred to as HighAI state, since managers have a bigger advantage with
respect to information compared to t = 0.
9
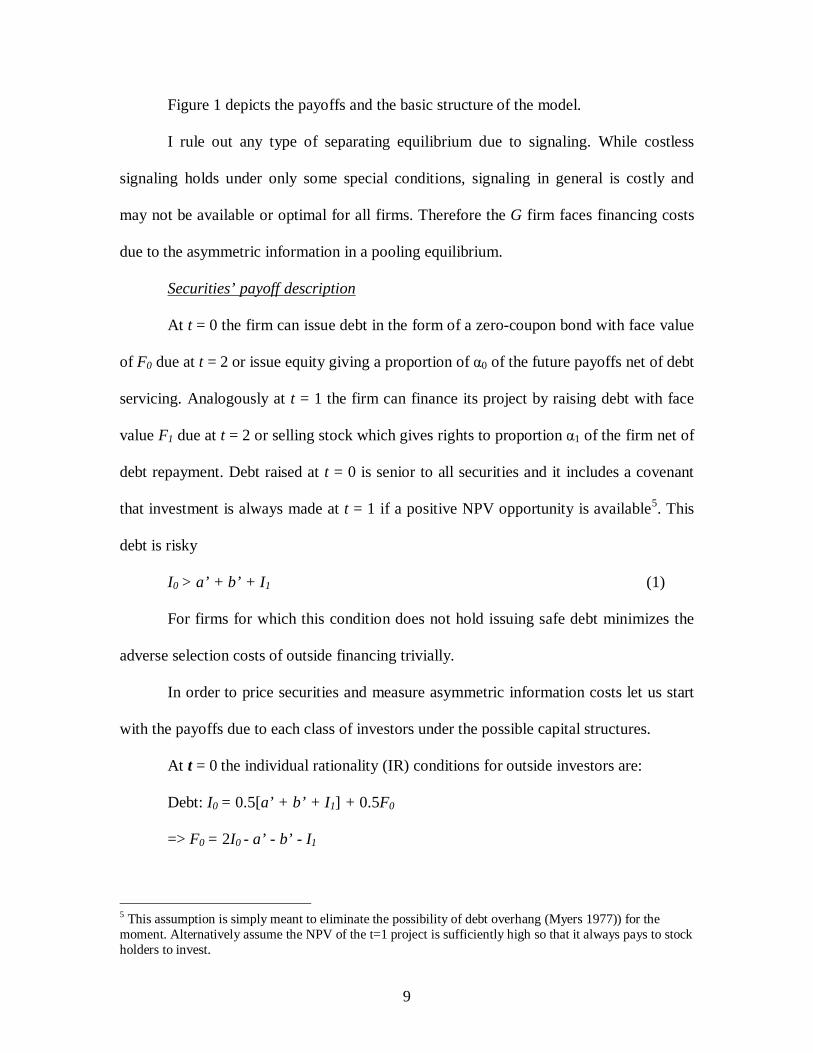
Figure 1 depicts the payoffs and the basic structure of the model.
I rule out any type of separating equilibrium due to signaling. While costless
signaling holds under only some special conditions, signaling in general is costly and
may not be available or optimal for all firms. Therefore the G firm faces financing costs
due to the asymmetric information in a pooling equilibrium.
Securities’ payoff description
At t = 0 the firm can issue debt in the form of a zero-coupon bond with face value
of F0 due at t = 2 or issue equity giving a proportion of α0 of the future payoffs net of debt
servicing. Analogously at t = 1 the firm can finance its project by raising debt with face
value F1 due at t = 2 or selling stock which gives rights to proportion α1 of the firm net of
debt repayment. Debt raised at t = 0 is senior to all securities and it includes a covenant
that investment is always made at t = 1 if a positive NPV opportunity is available5. This
debt is risky
I0 > a’ + b’ + I1 (1)
For firms for which this condition does not hold issuing safe debt minimizes the
adverse selection costs of outside financing trivially.
In order to price securities and measure asymmetric information costs let us start
with the payoffs due to each class of investors under the possible capital structures.
At t = 0 the individual rationality (IR) conditions for outside investors are:
Debt: I0 = 0.5[a’ + b’ + I1] + 0.5F0
=> F0 = 2I0 - a’ - b’ - I1
5 This assumption is simply meant to eliminate the possibility of debt overhang (Myers 1977)) for the moment. Alternatively assume the NPV of the t=1 project is sufficiently high so that it always pays to stock holders to invest.

10
Equity: I0 = α0 [0.5(a” + b” + I1 )+ 0.5(a’ + b’ + I1)]
=> α0 = 1
0
2''""
2
Ibaba
I
++++
I measure the lemons costs (LC) of raising outside financing as the loss of firm of
type G incurred by selling securities at the lower (market) prices that do not take into
account the positive private information of the managers.
The fair debt value according to a manager that received a good signal about her
firm is qF0 + (1 - q)(a’ + b’ + I1) . Therefore the lemons cost of issuing debt LC(d) at
t = 0 are
LC(d) = [2q - 1][I0 - a’ - b’ - I1] > 0
The fair equity value according to a manager that received a good signal about her
firm is α0 [q (a” +b” + I1) + (1 - q)(a’ + b’ + I1)]. Hence the lemons cost of issuing
equity at t = 0 LC(e) are
LC(e) = α0 [q - 0.5][a” + b” - a’ - b’] = (2q - 1)I0
12Ib'a'b”a”
a'-b'-b”a”
+++++
> 0
In this setting the familiar Myers and Majluf (1984) result holds i.e.
LC(e) > LC(d) (see proof in the Appendix)
At t = 1, first note that in the NoAI state that occurs with probability 1 - p,
managers and outside investors will have the same valuations for both the debt and the
equity of the firm and therefore the companies can raise capital without incurring adverse
selection costs.
When insiders and outside investors have different information about the value of
the firm at t = 1 (HighAI state) the lemons costs will depend on the security chosen to
finance the project at t = 0. Let us consider the two cases separately.

11
Case 1 the firm issued equity at t = 0
If the first investment is financed by equity we have the Myers and Majluf (1984)
setting. i.e. at t = 1 managers will always finance the second project with debt. Analogous
to issuing equity initially the individual rationality condition for t = 1 equity investors is
α1[0.5(a” + b” + I1) + 0.5(a’ + b’ + I1)] = I1
The adverse selection costs of issuing equity given that equity was used at t = 0
LC(ee) are
LC(ee) = I1(a” + b” - a’ - b’)/(a” + b” + a’ + b’ + 2I1)
If the necessary investment at t = 1, I1 is such that it can be raised through issuing
safe debt, there are no adverse selection costs. I assume debt is risky.
I1 > I1 + a’ + b’ (2)
If (2) holds then the individual rationality condition for debt holders is
Debt: I1 = 0.5[a’ + b’ + I1] + 0.5F1
=> F1 = I1 - a’ - b’
Given that managers in firms of type G know that debt with such face value is
safe the adverse selection costs of issuing debt at t = 1 LC(ed) are
LC(ed) = - a’ - b’ < LC(ee)
Case 2 the firm issued debt at t = 0
If the firm’s investment at t = 0 is financed by debt, and (1) holds the residual
payoffs that the firm can offer to new investors are positive if firms turn out to be of type
G and 0 for type B firms. Therefore new equity and new (junior) debt will have the same

12
payoffs and the same high adverse selection costs. The IR condition for junior debt
holders is
I1 = 0.5F1 � F1 = 2I1
And the lemons costs for issuing debt at t = 1 after debt was issued at t = 0 LC(dd)
are equal to the lemons costs associated with new equity LC(de)
LC(dd) = LC(de) = F1 - I1 = I1
I have also considered a case where projects have more than 2 discrete possible
outcomes and hence the payoffs structure of debt and equity would not be the same.
While equity becomes more informationally sensitive than debt, the adverse selection
costs associated with both securities are higher compared to the same securities in an all
equity firm which is the necessary condition.
Optimal sequence of securities
Solving backward from t = 1, when the first project was funded with equity it is
optimal to finance project B with debt. When project A was financed with debt both types
of financing incur the same high adverse selection costs. So the possible sequences are
1) t = 0 debt; t = 1 debt/equity or
2) t = 0 equity; t = 1 debt.
Note that introducing information asymmetry provides another rationale for debt
capacity. Debt is a dominating security in this setting since the only friction is that
insiders are better informed about the future value of the firm. Debt is safer than equity
and its value depends less on the private information. However, pushing up the leverage
of the firm may not be optimal even without any dissipative costs associated with

13
bankruptcy and reorganization. Once there is senior debt in the capital structure all
securities become riskier and more sensitive to the private information advantage of
insiders.
A manager maximizing the value of existing equity would minimize the total
expected lemons cost associated with t = 0 debt and t = 0 equity. The sum of adverse
selection costs associated with debt is smaller than the ones associated with equity if and
only if,
LC(d) + LC(dd) = LC(d) + LC(de) < LC(e) + LC(ed) (3)
�
[2q - 1][I0 - a’ - b’ - I1] + pI1 < (2q - 1)I0
12Ib'a'b”a”
a'-b'-b”a”
+++++
+ p( - a’ - b’) (4)
Rearranging
p[I1 - ( - a’ - b’)] < [2q - 1][I0
12Ib'a'b”a”
a'-b'-b”a”
+++++
- (I0 - a’ - b’ - I1)] (5)
This is the main result of the model. The left hand side is positive and represents
the difference in future adverse selection costs associated with debt and equity. The right
hand side is also positive and represents the difference between the adverse selection
costs incurred this period (t = 0) by issuing equity and by issuing debt. Issuing debt at
t = 0 is associated with lower immediate adverse selection cost and higher expected
adverse selection costs next period. This leads to the following results:
Corollary 1: Debt issues are positively related to the amount of asymmetric
information in the current period, as measured by the parameter q.
Corollary 2: Debt issues are negatively related to the amount of expected future
asymmetric information, as measured by the parameter p.

14
Naturally, the firms should try to use debt at the period when the perceived
savings in adverse selection costs are higher. In addition it is less likely for companies to
choose debt when there are big investments coming up in the future, again describing a
result very similar to debt capacity concerns without the typical tradeoff between tax
shields of debt and the bankruptcy costs related to it.
The main difference of this model and static models under asymmetric
information is that it does not restrict managers to myopic decisions i.e. choices of
financing that take into account only current costs due to asymmetric information. In the
setting of this study managers at t = 0 compare incurring lemons costs today for sure and
the possible lemons cost that may be born by the company in a financing round next
period. On the one hand, confirming the intuition of Myers (1984) and Myers and Majluf
(1984), the value of the debt is less sensitive to asymmetric information advantage of
insiders so it minimizes current lemons costs. On the other hand issuing debt today would
make all securities next period riskier and more sensitive to private information. In the
simplest case with 2 possible payoff states in fact debt has the same payoff structure and
extreme lemons costs as equity.
Allow firms to build slack at t = 0
Another possible solution for firms that would expect high future adverse
selection costs is to build up sufficient slack at t = 0 so additional raising of external
capital is not needed. The following section allows companies to raise I0 + I1 at t = 0 and
shows that building financial slack does not trivially solve the financing policy choice
problem.

15
First note that, since equity values are more sensitive to private information, and
in the absence of bankruptcy costs, building slack through issuing debt strictly dominates
building slack through an equity issue. Consider a zero coupon bond that has present
value of I0 + I1 and a face value of Fs. If (1) holds this debt will be risky and the
individual rationality condition is
0.5Fs + 0.5(a’ + b’ + I1) = I0 + I1
The lemons costs incurred by a firm that received a good signal associated with
building slack LC(s) are
LC(s) = (2q - 1)(I0 - a’ - b’)
Note that as expected these costs are higher than the ones associated with raising
I0 only (LC(d)). Also, by definition the strategy of raising slack will not incur any adverse
selection costs at t = 1.
Now consider the choice between raising slack and raising only I0 at t = 0 through
debt. Managers will choose the ‘slack’ strategy if and only if
LC(s) < LC(d) + LC(dd) � (6)
(2q - 1)(I0 - a’ - b’) < [2q - 1][I0 - a’ - b’ - I1] + pI1 �
2q – 1 < p (7)
This result is intuitive. Since slack is a policy through which the firm minimizes
future adverse selection costs, this strategy is preferable to raising capital twice through
debt at t = 0 and at t = 1 when the asymmetric information next period is relatively high
compared to the current asymmetric information.
Next, consider the choice between building slack and issuing equity at t = 0.
Managers would prefer to keep financial slack if
16
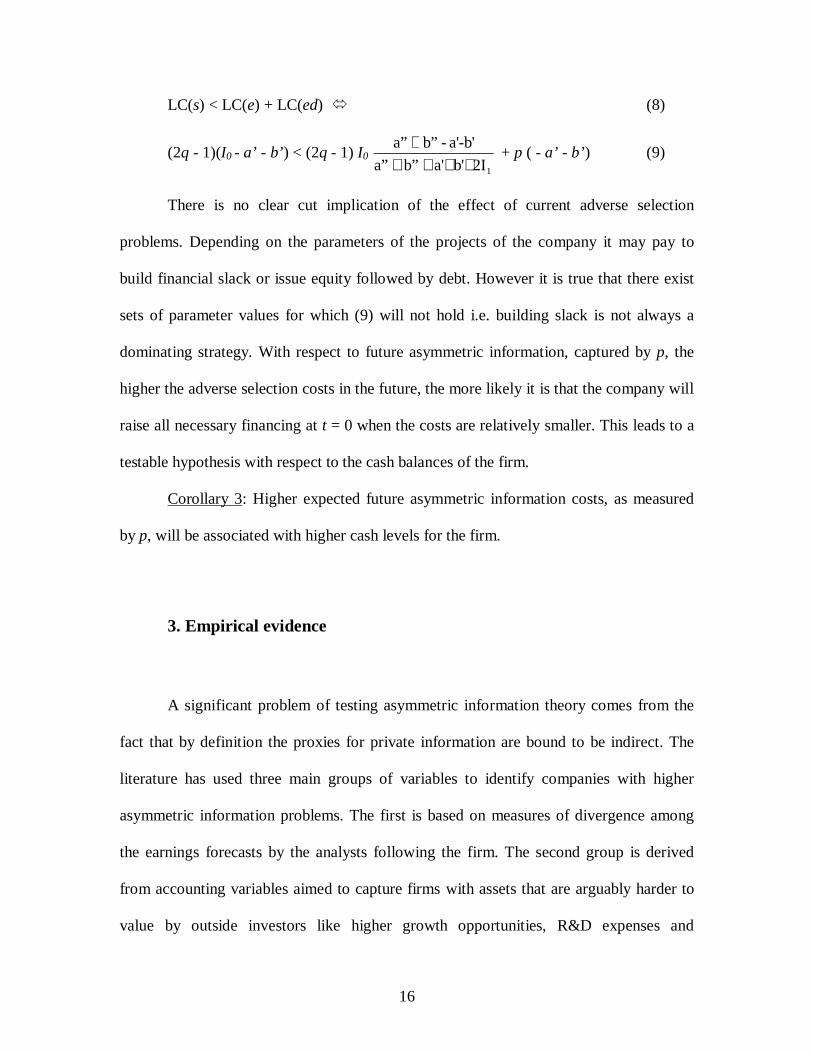
LC(s) < LC(e) + LC(ed) � (8)
(2q - 1)(I0 - a’ - b’) < (2q - 1) I0
12Ib'a'b”a”
a'-b'-b”a”
+++++
+ p ( - a’ - b’) (9)
There is no clear cut implication of the effect of current adverse selection
problems. Depending on the parameters of the projects of the company it may pay to
build financial slack or issue equity followed by debt. However it is true that there exist
sets of parameter values for which (9) will not hold i.e. building slack is not always a
dominating strategy. With respect to future asymmetric information, captured by p, the
higher the adverse selection costs in the future, the more likely it is that the company will
raise all necessary financing at t = 0 when the costs are relatively smaller. This leads to a
testable hypothesis with respect to the cash balances of the firm.
Corollary 3: Higher expected future asymmetric information costs, as measured
by p, will be associated with higher cash levels for the firm.
3. Empirical evidence
A significant problem of testing asymmetric information theory comes from the
fact that by definition the proxies for private information are bound to be indirect. The
literature has used three main groups of variables to identify companies with higher
asymmetric information problems. The first is based on measures of divergence among
the earnings forecasts by the analysts following the firm. The second group is derived
from accounting variables aimed to capture firms with assets that are arguably harder to
value by outside investors like higher growth opportunities, R&D expenses and

17
advertising expenses. Finally, following the intuition of microstructure models like Kyle
(1985) and Easley and O’Hara (1987), measures have been developed to estimate the
component of bid ask spread quoted by a market maker that is due to offset the losses of
the specialists from trading with agents with superior information.6 These measures are
proven to be useful in various cases, but there are other effects that affect the financing
choice of the company. The most well known examples being the trade-off between tax
shields and bankruptcy costs associated with debt and the market timing7.
To proxy for adverse selection costs at the current and future periods, I propose a
measure based on analyst forecasts. Analysts provide on a monthly basis forecasts for the
earnings per share for each of the following 4 quarters as well as up to five fiscal years
ahead. I select forecasts made only during the month immediately preceding the
beginning of a fiscal year that predict earnings for the coming fiscal year or for the fiscal
year that would start a year in the future. I measure the amount of asymmetric
information as the dispersion of analyst forecasts scaled by the mean forecast value.
My main data source is the I/B/E/S database, a product of Thomson Financial.
Accounting variables come from Compustat. It is important that for each firm/year there
are more than 3 forecasts available in IBES both for the coming 12 month period as well
as for the period from month 13 to 24 ahead. I use the dispersion for the near term as
proxy for asymmetric information this period and the dispersion for the following fiscal
year as a proxy for expected future adverse selection costs. Because of data availability,
my sample period is from 1986 to 2005. It includes 40112 firm/year observations of
6 Look at Clark and Shastri (2000) for a comprehensive empirical comparison of different asymmetric information proxies7 Look at Baker and Wurgler (2002) and Fama and French (2002) among others for more detailed discussion and empirical evidence for these hypotheses.

18
which 5234 also have forecasts for fiscal year 2. As an illustration of the relative amount
of asymmetric information, I assign a 2-digit rank to each firm. The first digit regards
dispersion for fiscal year 1, the second digit the dispersion for fiscal year 2. I calculate the
median dispersion for both horizons for my sample every year and assign a value of 1 if
the dispersion of a firm is below the median, 2 if the dispersion is above the median and 3
if there are no forecasts for that horizon. For example a firm/year with a rank of 13 has
dispersion for the next period that is below the median for that year and does not have
forecasts for fiscal year 2. Table 1 and provides descriptive statistics for the sample.
First observe that about 13% percent of the sample has forecasts for both
horizons. Second, there is significant time variation in the relative level of adverse
selection cost proxy. If the relative amount of asymmetric information does not change
through time one would expect that firms that had low asymmetric information this
period will also have lower than most of the firms’ dispersion over the next fiscal year.
Two caveats arise regarding this proxy of asymmetric information. First it can be
argued that when analysts are particularly unable to provide an informative forecast they
would tend to publish fictitious estimates that are clustered. It is straight forward however
to look at the relation between the forecast dispersion and the difference between the
mean earning forecast and the realized earnings. Clarke and Shastri (2000) for example
find large positive correlation between the forecast error and the forecast dispersion
which is indicative that the above consideration is unlikely to be problematic for the
analysis.
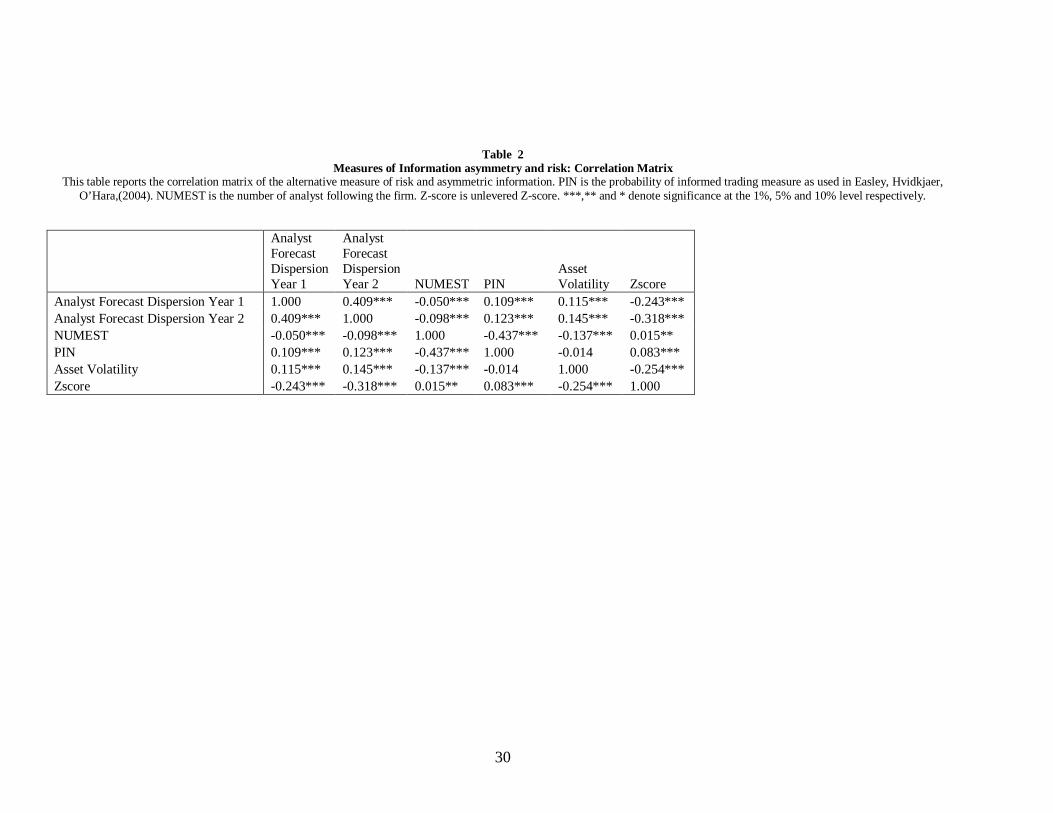
Second it may be plausible that higher dispersion simply means higher
(symmetric) uncertainty about future cash flows. Table 2 presents the correlation matrix

19
for the measures of asymmetric information and risk that are used in the analysis. It is
unclear however why uncertainty over 2 different horizons would have an opposite effect
of debt issuance. If analyst forecast standard deviation is associated with higher
uncertainty or risk, the prediction of the trade-off theory would be that this proxy would
decrease the share of debt in new issues. The reason is that riskier firms would suffer
higher expected bankruptcy costs as well which would have a negative effect on
borrowing. The prediction of this paper regarding current disagreement among analysts is
exactly the opposite. If current forecast dispersion is high, the outside investors will be
subject to a lemons problem and therefore companies would prefer to issue debt which is
less sensitive to private information security. The effect of future adverse selection costs
however should be unequivocal.
My approach is to look at the marginal financing decisions of firms (net debt
issued and net equity issued) following the line of analysis of Shyam-Sunder and Myers
(1999) and Frank and Goyal (2003). The base regression is of net debt issued on
financing deficit, which is also equal to the total amount of external financing. A higher
coefficient on the financing deficit (closer to 1) means that the firm predominantly issues
debt to fill its needs. The model predicts that the propensity to use debt depends on the
amount of asymmetric information today and tomorrow. Therefore I include interaction
terms of financing deficit with forecast dispersion over fiscal year 1 and also with the
dispersion over fiscal year 2. The hypothesis is that the dispersion today will be
positively related and dispersion next period negatively related to net debt issued. The
model predicts that controlling for current adverse selection costs, future asymmetric
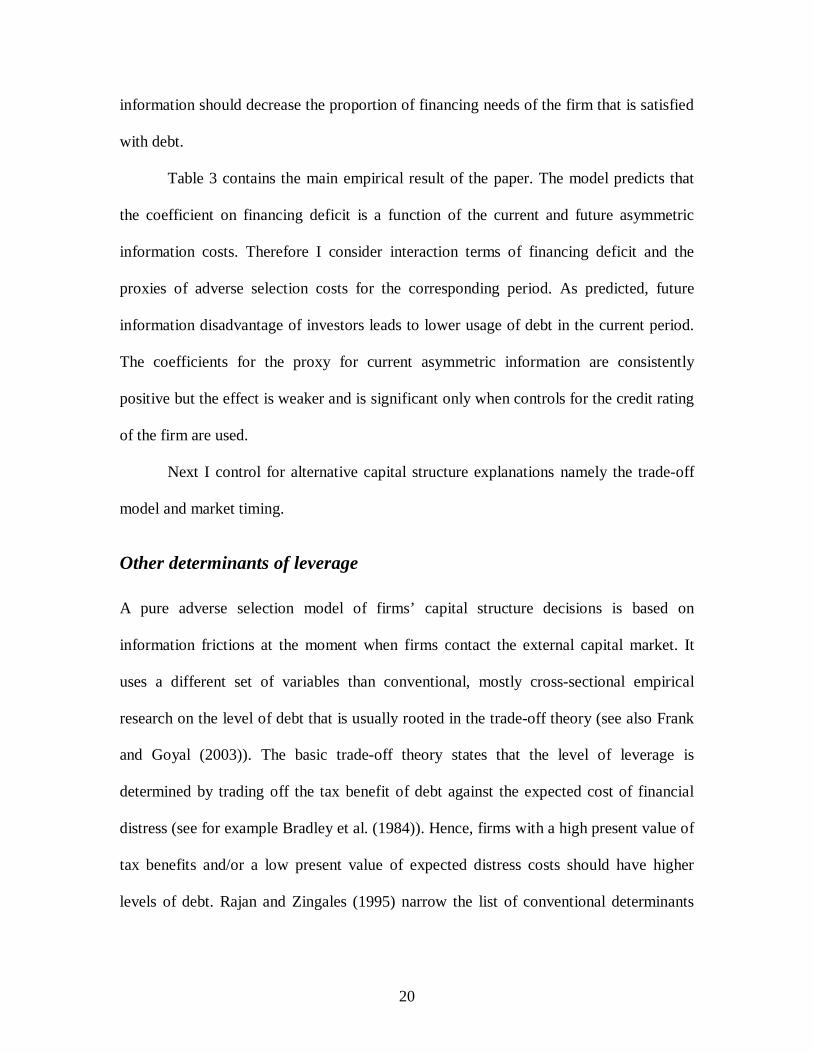
20
information should decrease the proportion of financing needs of the firm that is satisfied
with debt.
Table 3 contains the main empirical result of the paper. The model predicts that
the coefficient on financing deficit is a function of the current and future asymmetric
information costs. Therefore I consider interaction terms of financing deficit and the
proxies of adverse selection costs for the corresponding period. As predicted, future
information disadvantage of investors leads to lower usage of debt in the current period.
The coefficients for the proxy for current asymmetric information are consistently
positive but the effect is weaker and is significant only when controls for the credit rating
of the firm are used.
Next I control for alternative capital structure explanations namely the trade-off
model and market timing.
Other determinants of leverage
A pure adverse selection model of firms’ capital structure decisions is based on
information frictions at the moment when firms contact the external capital market. It
uses a different set of variables than conventional, mostly cross-sectional empirical
research on the level of debt that is usually rooted in the trade-off theory (see also Frank
and Goyal (2003)). The basic trade-off theory states that the level of leverage is
determined by trading off the tax benefit of debt against the expected cost of financial
distress (see for example Bradley et al. (1984)). Hence, firms with a high present value of
tax benefits and/or a low present value of expected distress costs should have higher
levels of debt. Rajan and Zingales (1995) narrow the list of conventional determinants

21
down to four main variables: profits, size, tangibility of assets and the market-to-book
ratio.
More tangible assets support debt because it means that firms can collateralize the debt
which reduces bankruptcy costs. The market-to-book ratio is usually seen as a proxy for
growth opportunities that should be negatively related to leverage. The argument is that
leverage exposes firms to the “debt overhang” problem (Myers 1977) and that the future
value of the firm is lost in bankruptcy. A recent alternative explanation for a negative
relationship is market timing. Firms with a high market-to-book ratio are overvalued and
hence issue equity to take advantage of it (Baker and Wurgler (2002)). Sales are usually
positively associated with leverage. There is no clear theoretical foundation but one
normally argues that larger firms have a better reputation or are less likely to go bankrupt
so they can borrow more.
Profits show up regularly as a negative determinant of leverage. Traditionally this has
been seen as a challenge for conventional trade-off models of leverage. They predict that
more profitable firms should issue more debt since more profitable firms have a smaller
risk of bankruptcy and have more taxable income to shield (see Titman and Wessels
(1988) and Fama and French (2002)).8
Next let us examine the financing decisions of firms and see how they depend on
the 2 asymmetric information proxies. Again we would expect that current and future
adverse selection costs would have markedly different effect on the financing decisions
of the firm. Market timing and trade off explanations as well as careful controls for the
effect of financial slack is needed.
8 Recent dynamic trade-off theories can predict a negative relationship between profitability and leverage (for example Strebulaev (2004) and Hennessy and Whited (2004)).
22
The last column in Table 3 reports the results from regressing change in long term
debt on the conventional capital structure variables and the asymmetric information
proxies controlling for the long term credit rating of the firm.
Finally, Corollary 3 derives a testable hypothesis with respect to the cash/financial
slack levels of the firm. When raising external financing in the future is costlier due to
adverse selection costs, firms should hold bigger cash reserves.
The literature on cash management of the firm identifies profitability, investment
opportunity set, as measured by the market-to-book ratio and size, as measured by the
natural log of sales, as some of the most important determinants of cash levels. Other
potentially important factors are the hedging needs of the firm (see Acharya, Almeida and
Campello (2005) for discussion and empirical evidence). Table 4 reports results from
regression of cash levels on conventional determinants of financial slack and future
analyst forecast dispersion. The effect of future adverse selection costs is positive and
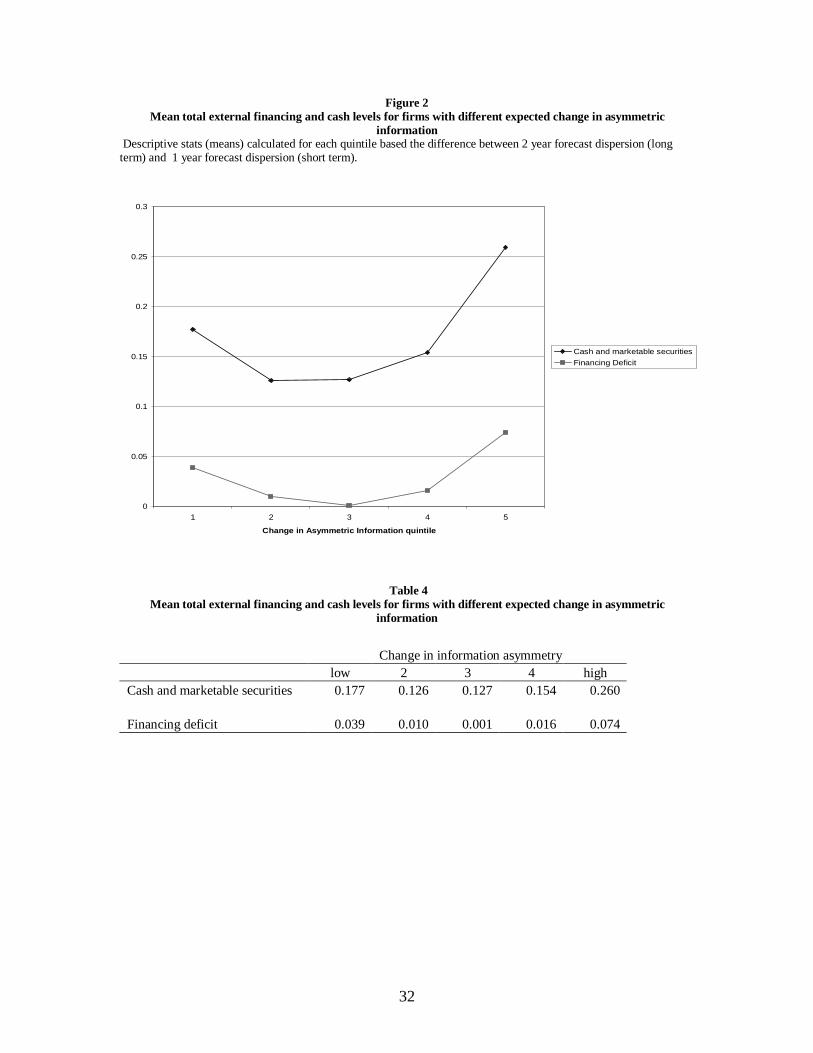
significant. Figure 2 provides some non parametric evidence that cash balances of firms
that are likely to suffer significant adverse selection costs in the future maintain larger
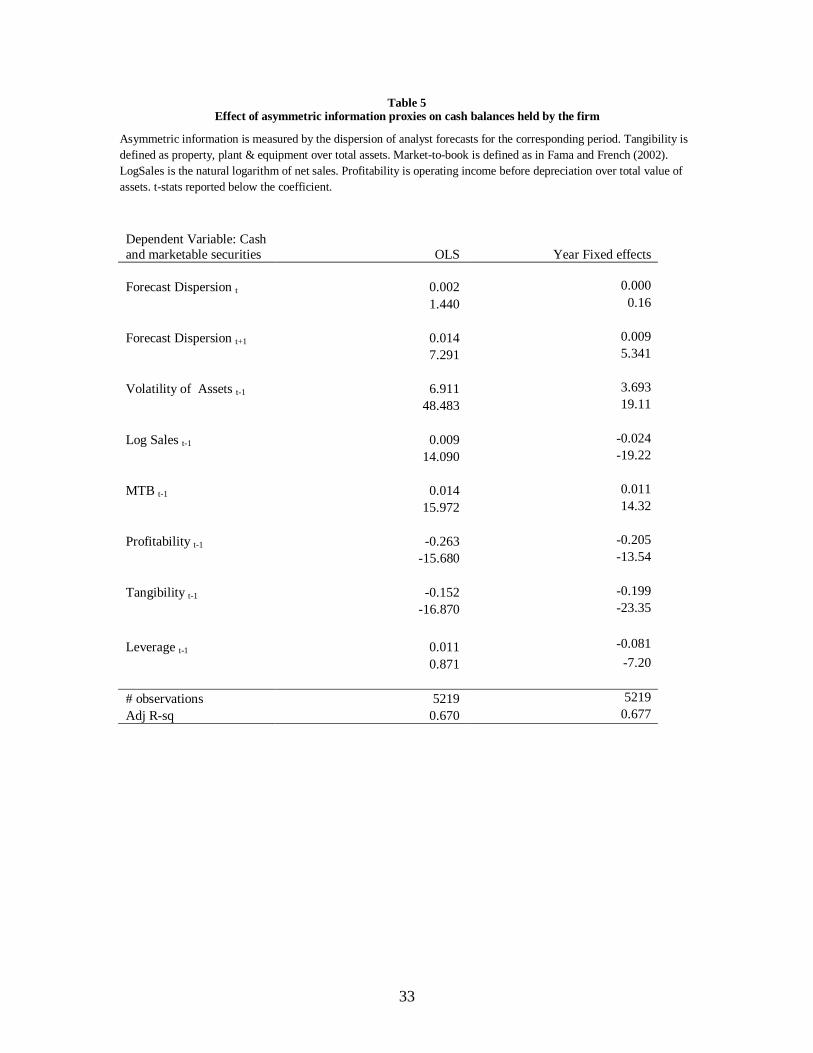
balances of cash and marketable securities. Table 5 reports regression results of cash and
marketable securities on the conventional variable and proxies for asymmetric
information. The effect of future asymmetric information on cash is positive which is
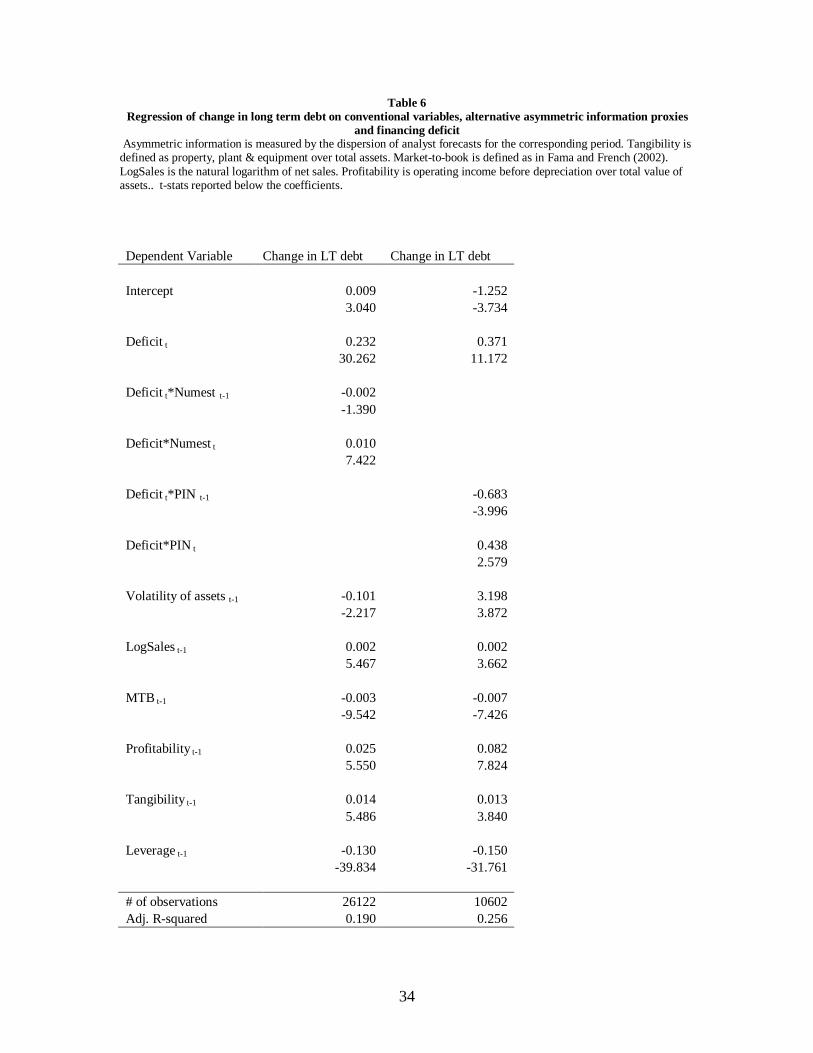
consistent with the prediction of the model. Finally Table 6 reports results from the
baseline regression of change of long term debt on alternative proxies for asymmetric
information. In the first column I use the current number of analysts following the firm as
a proxy for the information asymmetry after 1 year and the number of analysts following
the firm 12 month before the beginning of the fiscal year as proxy for private information
23
today. As predicted by the model the higher the analyst coverage (the smaller the
expected information asymmetry in the future) the higher the proportion of long term
debt in total new external financing. This result does no change qualitatively if I use the
number of analyst covering the firm at present and number of analysts covering one year
into the future.
Finally, I use the probability of informed trading measure (PIN) in the current
fiscal year and the next fiscal year but the results do not support the prediction of the
model. One possible explanation is that PIN during the next fiscal year is an ex-post
measure which may not capture the ex-ante estimate of asymmetric information expected
in the future. Moreover, more research is needed to ascertain to what extent measures of
information asymmetry in the secondary markets (such as PIN) are a reasonable measure
of the private information advantage that managers with respect to outside providers of
capital in the primary markets.
4. Conclusion
In conclusion, I present a multiperiod model with overlapping investments in
which the amount of adverse selection cost of external financing varies through time. The
model suggests that the optimal sequence of securities is chosen to minimize the adverse
selection cost incurred in all rounds of financing. Debt issuance is positively related to
asymmetric information at the current period and negatively related to future asymmetric
information and future investments needed. In a setting with no taxes or bankruptcy costs
I get several results that are typically associated with the debt capacity of the firm. I use
the dispersion of analyst forecasts over different horizons to proxy for different levels of
adverse selection costs at present and in future periods.

24
Appendix
LC(d) < LC(e) � (A1)
[2q - 1][I0 - a’ - b’ - I1] < (2q - 1) I0 (a” + b” - a’ - b’) / (a” + b” + a’ + b’ + 2I1)
Multiplying through by (a” + b” + a’ + b’ + 2I1) / (2q - 1) and simplifying the
expression
(A1) � I0 - a’ - b’ - I1 < a” + b” - I0 + I1
� 0 < (a” + a’ - 2I0) + (b” + b’) + 2I1 (A2)
The terms in the brackets are positive since both investment projects are assumed to be
with positive net present value. Therefore (A1) holds.
25
References
Acharya, V., H. Almeida and M. Campello, 2005, Is cash negative debt: A hedging
perspective on corporate financial policies, Working Paper.
Autore, D. and T. Kovacs, 2005, The pecking order theory and time-varying adverse
selection costs, Working paper.
Baker, M. and J. Wurgler, 2002, Market timing and capital structure, Journal of Finance
57, 1-32.
Bradley, M. G. A. Jarrell and E. H. Kim, 1984, On the existence of an optimal capital
structure: theory and evidence, Journal of Finance, 39, 857-877.
Bharath, S. , P. Pasquariello and G. Wu, 2005, Does Asymmetric information Drive
Capital Structure Decisions? University of Michigan working paper.
Chang, X., S. Dasgupta and G. Hillary, 2004, Analyst coverage and capital structure
decisions, Working paper.
Clarke, J. and K. Shastri, 2000, On information asymmetry metrics, Working paper.
Dittmar, Amy K. and A. V. Thakor, 2005, Why do firms issue equity, Journal of
Finance, Forthcoming.
D’Mello, R. and S. Ferris, 2000 The Information Effects of Analyst Activity at the
Announcement of New Equity Issues, Financial Management, 78-95.
Easley, D., Hvidkjaer, S., O’Hara, M. (2004). Factoring Information into Returns.
Working Paper, R.H. Smith School of Business, University of Maryland.
Easley, D., O’Hara, M. (1987). Price, Trade Size, and Information in Securities Markets.
Journal of Financial Economics, 19, pp. 69-90.
Fama, Eugene F. and K. French, 2002, Testing tradeoff and pecking order predictions
about dividends and debt, The Review of Financial Studies 15, 1-33.
Frank, M.Z. and V.K. Goyal, 2003. Testing pecking order theory of capital structure.
Journal of Financial Economics, 67, 217-248.
Gilson, Stuart C., P. M. Healy, C. F. Noe and K. Palepu, 1998, Information effects of
spin-offs, equity carve outs and targeted stock offerings, Working paper.
26
Halov N. and F. Heider, 2004, Capital structure, risk and asymmetric information,
Working paper.
Harris, M. and A. Raviv, 1991, The theory of capital structure, Journal of Finance 46,
297 – 355.
Hennessy, C.A. and T.M. Whited, 2004. Debt dynamics, Unpublished working paper,
University of California at Berkeley and University of Wisconsin, Madison.
Korajczyk R., D. Lucas and R. McDonald, 1992, Equity issues with time-varying
asymmetric information, The Journal of Financial and Quantitative Analysis 27,
397-417.
Korajczyk R., D. Lucas and R. McDonald R, 1991, The effect of information releases on
the pricing and timing of equity issues, The Review of Financial Studies 4, 685-
708.
Krishnaswamy, S and V. Subramaniam, 1999, Information asymmetry, valuation and the
corporate spin-off decision, Journal of Financial Economics 53, 73-112.
Kyle, P. (1985). Continuous Auctions and Insider Trading. Econometrica, 53, pp. 1315-
1336.
Lemmon, M. and Zender,J., (2004). Debt Capacity and Tests of Capital Structure
Theories. University of Colorado Working Paper.
Myers, S. C., 1977, Determinants of corporate borrowing, Journal of Financial
Economics 5, 147-175.
Myers, S., 1984, The capital structure puzzle, Journal of Finance 39, 575-592.
Myers, S. and N. Majluf, 1984, Corporate financing decisions when firms have
information that investors do not have, Journal of Financial Economics 13, 187-
221.
Rajan, R.G. and L. Zingales, 1995. What do we know about capital structure? Some
evidence from international data. Journal of Finance, 50, 1421-1460.
Reisz, A and K. John, 2002, Temporal resolution of uncertainty, the investment policy of
levered firms and corporate debt yields, Working paper.
27
Ross, S., 1989, Information and volatility: The no-arbitrage martingale approach to
timing and resolution irrelevance. The Journal of Finance 44, 1-17.
Ryan, H. Testing signaling models with forecast data, Louisiana State University
Working Paper.
Shyam-Sunder, L. and S. Myers, 1999, Testing static tradeoff against pecking order
models of capital structure, Journal of Financial Economics 51, 219 – 244.
Stein J., 2003, Agency, information and corporate investment. In Handbook of the
Economics of Finance, edited by G. Constantinides, Milton Harris and Rene
Stulz, Elsevier, 111-165.
Strebulaev, I.A., 2004. Do tests of capital structure theory mean what they say?,
Unpublished working paper, London Business School.
Sunder, J., 2002, Information spillovers and capital structure, Working paper.
Titman, S. and R. Wessels, 1988, The determinants of capital structure choice, Journal of
Finance 43, 1-19.
Viswanath, P. V., 1993, Strategic considerations, the pecking order hypothesis, and
market reactions to equity financing, Journal of Financial and Quantitative
Analysis 28, 213-234.
28
Figure 1
Timeline and information structure of the model
t=0 t=1 t=2
No AI
1-p 1/2*(a'+a'')+I+1/2*(b'+b'')
a''+I1+b''
Managers
know firm’s
type with prob.
q>0.5 p 0.5
0.5
Mgrs know realizations of a,b
Investors know their means a'+I1+b'
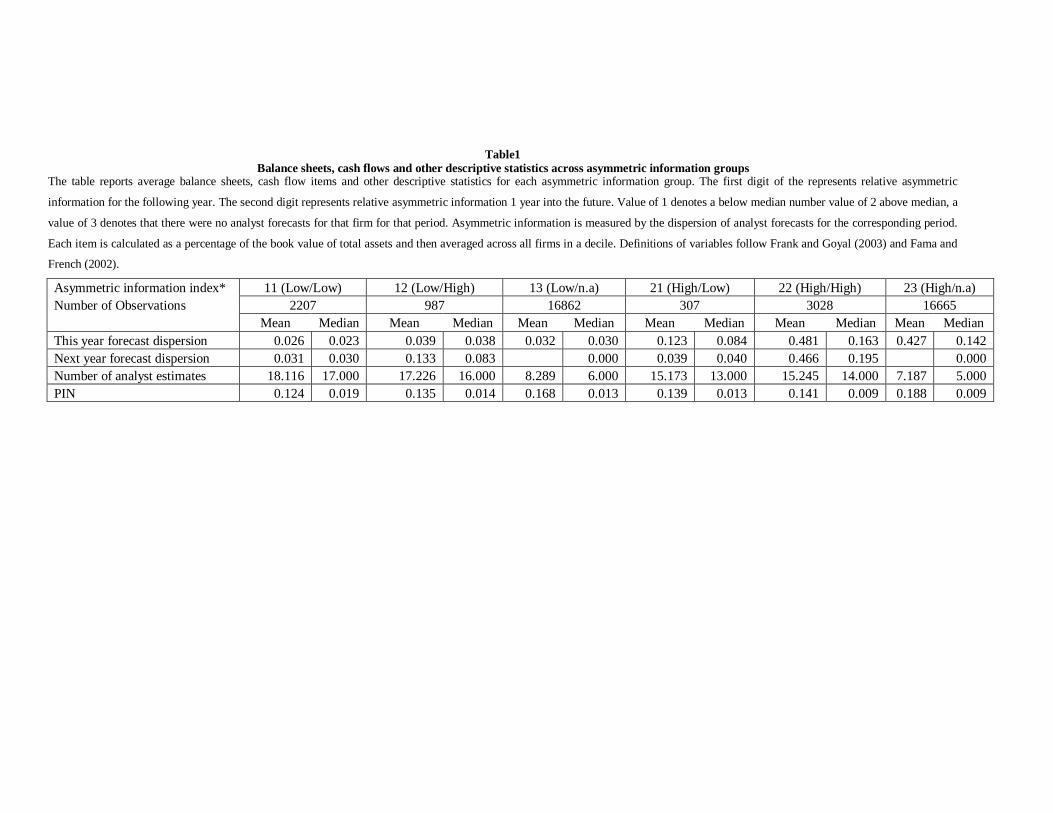
Table1Balance sheets, cash flows and other descriptive statistics across asymmetric information groups
The table reports average balance sheets, cash flow items and other descriptive statistics for each asymmetric information group. The first digit of the represents relative asymmetric
information for the following year. The second digit represents relative asymmetric information 1 year into the future. Value of 1 denotes a below median number value of 2 above median, a
value of 3 denotes that there were no analyst forecasts for that firm for that period. Asymmetric information is measured by the dispersion of analyst forecasts for the corresponding period.
Each item is calculated as a percentage of the book value of total assets and then averaged across all firms in a decile. Definitions of variables follow Frank and Goyal (2003) and Fama and
French (2002).
Asymmetric information index* 11 (Low/Low) 12 (Low/High) 13 (Low/n.a) 21 (High/Low) 22 (High/High) 23 (High/n.a)Number of Observations 2207 987 16862 307 3028 16665
Mean Median Mean Median Mean Median Mean Median Mean Median Mean MedianThis year forecast dispersion 0.026 0.023 0.039 0.038 0.032 0.030 0.123 0.084 0.481 0.163 0.427 0.142Next year forecast dispersion 0.031 0.030 0.133 0.083 0.000 0.039 0.040 0.466 0.195 0.000Number of analyst estimates 18.116 17.000 17.226 16.000 8.289 6.000 15.173 13.000 15.245 14.000 7.187 5.000PIN 0.124 0.019 0.135 0.014 0.168 0.013 0.139 0.013 0.141 0.009 0.188 0.009
30
Table 2Measures of Information asymmetry and risk: Correlation Matrix
This table reports the correlation matrix of the alternative measure of risk and asymmetric information. PIN is the probability of informed trading measure as used in Easley, Hvidkjaer, O’Hara,(2004). NUMEST is the number of analyst following the firm. Z-score is unlevered Z-score. ***,** and * denote significance at the 1%, 5% and 10% level respectively.
Analyst Forecast Dispersion Year 1
Analyst Forecast Dispersion Year 2 NUMEST PIN
Asset Volatility Zscore
Analyst Forecast Dispersion Year 1 1.000 0.409*** -0.050*** 0.109*** 0.115*** -0.243***Analyst Forecast Dispersion Year 2 0.409*** 1.000 -0.098*** 0.123*** 0.145*** -0.318***NUMEST -0.050*** -0.098*** 1.000 -0.437*** -0.137*** 0.015**PIN 0.109*** 0.123*** -0.437*** 1.000 -0.014 0.083***Asset Volatility 0.115*** 0.145*** -0.137*** -0.014 1.000 -0.254***Zscore -0.243*** -0.318*** 0.015** 0.083*** -0.254*** 1.000
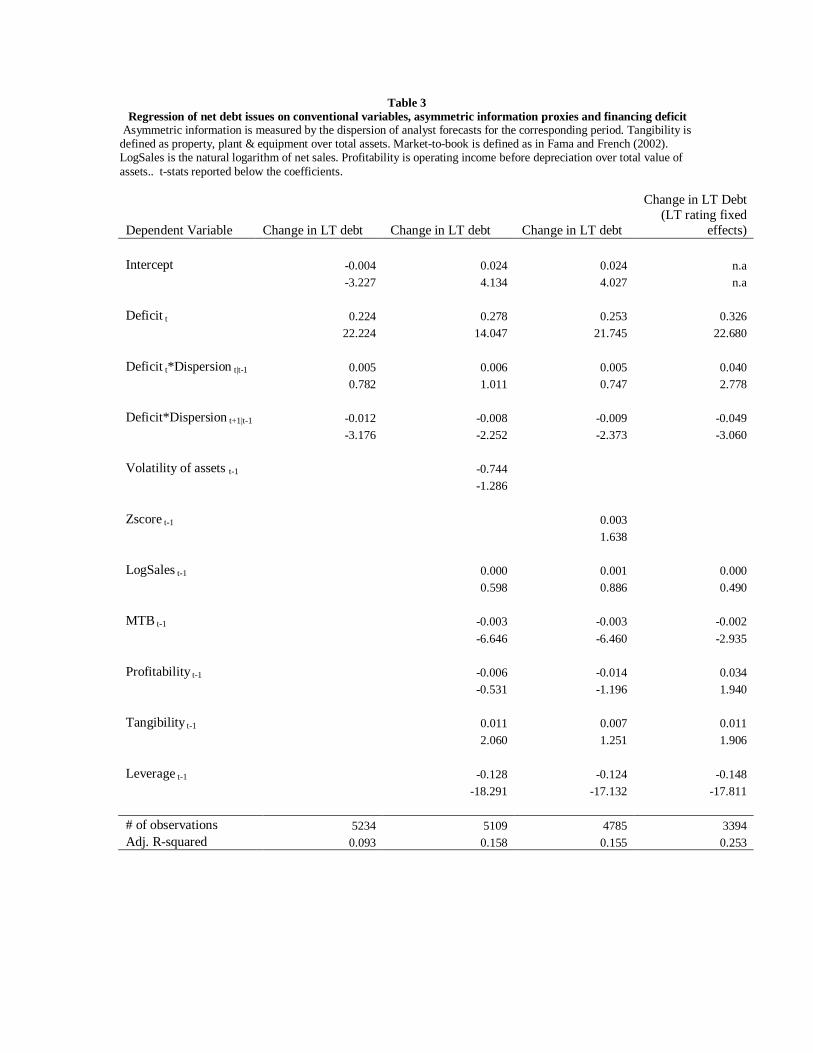
Table 3Regression of net debt issues on conventional variables, asymmetric information proxies and financing deficit
Asymmetric information is measured by the dispersion of analyst forecasts for the corresponding period. Tangibility is defined as property, plant & equipment over total assets. Market-to-book is defined as in Fama and French (2002). LogSales is the natural logarithm of net sales. Profitability is operating income before depreciation over total value of assets.. t-stats reported below the coefficients.
Dependent Variable Change in LT debt Change in LT debt Change in LT debt
Change in LT Debt (LT rating fixed
effects)
Intercept -0.004 0.024 0.024 n.a-3.227 4.134 4.027 n.a
Deficit t 0.224 0.278 0.253 0.32622.224 14.047 21.745 22.680
Deficit t*Dispersion t|t-1 0.005 0.006 0.005 0.0400.782 1.011 0.747 2.778
Deficit*Dispersion t+1|t-1 -0.012 -0.008 -0.009 -0.049-3.176 -2.252 -2.373 -3.060
Volatility of assets t-1 -0.744-1.286
Zscore t-1 0.0031.638
LogSales t-1 0.000 0.001 0.0000.598 0.886 0.490
MTB t-1 -0.003 -0.003 -0.002
-6.646 -6.460 -2.935
Profitability t-1 -0.006 -0.014 0.034-0.531 -1.196 1.940
Tangibility t-1 0.011 0.007 0.0112.060 1.251 1.906
Leverage t-1 -0.128 -0.124 -0.148-18.291 -17.132 -17.811
# of observations 5234 5109 4785 3394Adj. R-squared 0.093 0.158 0.155 0.253
32
Figure 2Mean total external financing and cash levels for firms with different expected change in asymmetric
information Descriptive stats (means) calculated for each quintile based the difference between 2 year forecast dispersion (long term) and 1 year forecast dispersion (short term).
0
0.05
0.1
0.15
0.2
0.25
0.3
1 2 3 4 5
Change in Asymmetric Information quintile
Cash and marketable securities
Financing Deficit
Table 4Mean total external financing and cash levels for firms with different expected change in asymmetric
information
Change in information asymmetrylow 2 3 4 high
Cash and marketable securities 0.177 0.126 0.127 0.154 0.260
Financing deficit 0.039 0.010 0.001 0.016 0.074
33
Table 5Effect of asymmetric information proxies on cash balances held by the firm
Asymmetric information is measured by the dispersion of analyst forecasts for the corresponding period. Tangibility is defined as property, plant & equipment over total assets. Market-to-book is defined as in Fama and French (2002). LogSales is the natural logarithm of net sales. Profitability is operating income before depreciation over total value of assets. t-stats reported below the coefficient.
Dependent Variable: Cash and marketable securities OLS Year Fixed effects
Forecast Dispersion t 0.002 0.000
1.440 0.16
Forecast Dispersion t+1 0.014 0.0097.291 5.341
Volatility of Assets t-1 6.911 3.69348.483 19.11
Log Sales t-1 0.009 -0.02414.090 -19.22
MTB t-1 0.014 0.01115.972 14.32
Profitability t-1 -0.263 -0.205-15.680 -13.54
Tangibility t-1 -0.152 -0.199-16.870 -23.35
Leverage t-1 0.011 -0.081
0.871 -7.20
# observations 5219 5219Adj R-sq 0.670 0.677
34
Table 6Regression of change in long term debt on conventional variables, alternative asymmetric information proxies
and financing deficit Asymmetric information is measured by the dispersion of analyst forecasts for the corresponding period. Tangibility is defined as property, plant & equipment over total assets. Market-to-book is defined as in Fama and French (2002). LogSales is the natural logarithm of net sales. Profitability is operating income before depreciation over total value of assets.. t-stats reported below the coefficients.
Dependent Variable Change in LT debt Change in LT debt
Intercept 0.009 -1.2523.040 -3.734
Deficit t 0.232 0.37130.262 11.172
Deficit t*Numest t-1 -0.002-1.390
Deficit*Numest t 0.0107.422
Deficit t*PIN t-1 -0.683-3.996
Deficit*PIN t 0.4382.579
Volatility of assets t-1 -0.101 3.198-2.217 3.872
LogSales t-1 0.002 0.0025.467 3.662
MTB t-1 -0.003 -0.007-9.542 -7.426
Profitability t-1 0.025 0.0825.550 7.824
Tangibility t-1 0.014 0.0135.486 3.840
Leverage t-1 -0.130 -0.150-39.834 -31.761
# of observations 26122 10602Adj. R-squared 0.190 0.256