Dynamics model of the flow management of construction ...
23
Dynamics model of the flow management of construction projects: study of case Sandra Cano and Oscar Rubiano
Transcript of Dynamics model of the flow management of construction ...

Dynamics model of the flow management of
construction projects: study of caseSandra Cano and Oscar Rubiano

Introduction
This research reviews the issues associated with the obstruction of the workflow in the management of infrastructure construction projects in a public university in Colombia.
2

Case study
The case study is about the production process of construction projects planned for a year in a public university• The university plans investment in infrastructure for each fiscal year according to
a strategic plan.
• Financing for these projects is from the collection of a specific tax of Regional Government (RG) order, and it's transferred monthly to the university.
• The contracting of the construction is carried out when the financial resource has been transferred, and it has been confirmed the construction project has the highest level of constructability possible.
• After contracting, the construction of the project is carried out.
• Construction production process originate relations and flows into functional areas in the organization
4

Case study: Problem map
7
Planned Change in Cost
VCP = CF / CPI
Evaluation of Policies in the
Management of Construction
Projects
Defining Parameters Scenarios
System Performance
Indicators
Total Time IP Projects
TE = TR / TP
Efficiency Implementation
EP = PE / PI
Finished Projects on Annuity
PP = TRA / PI
Maturation of Construction Projects
Administrative Processes
Availability of Investment
Resources in IP

System Dynamics
• The fundamental objective of Systems Dynamics is to understand the structural causes that cause the behavior of the system.
• Understanding the structural causes implies increasing knowledge about each element of the system's role, and seeing how different actions, carried out on parts of the system, accentuate or attenuate the behavioral trends implicit in it.
• System Dynamics finds its main applications in these complex and poorly defined environments, where human decisions are usually guided by logic intervene.
8

Lean principles and the mapping of the value streamThe five lean principles described by Jones and Womack (2002) in the improvement of the efficiency in value flows, they are:
1. To specify the value of the client from the point of view,
2. To identify the flow of value, including the activities that add value or do not add value for the client,
3. Allow that the project flows quickly without problems and through all the sub-processes,
4. To synchronize sub-processes capacity and demand, so that the work is realized in agreement with the scheme of pull production,
5. Reach perfection through continuous value flow improvement.
10

Lean principles and the mapping of the value stream
“To identify the flow of value, including the activities that add value or do not add value for the client,”
11

Value Stream Mapping
• It is a graphical tool that integrates material and information flows used for the standardized icons in a graph, showing a “Mapping Big Picture” of the value flow.
• Jones and Womack (2002) define the VSM as the process of the map the flow of materials and information.
• This map is used to present the current processed state and after a map of the future state is proposed.
12

Mapping with SIPOC Z
15

Currrentstate map
17
Bank projects IP
4
Review Designs
15 days
5 Profesionals
Maturation
45 days
8 Tecnical and profesional
Contract and legalization
60 days
4 Coordination
Construction
120 days
5 Profesionals
Construction Rededigns
60 days
5 Profesionals
works delivery
15 days
5 Profesionals
correction works
30 days
3 Profesionals
Customer Delivery
5 days
Customers
QC designs
Institutional Planning
Management Construction
General Bank Projects
15 days 45 days
35 days
65 days
10 days
120 days
30 days
30 days
45 days
30 days
15 days
15 days
5 days
30 days
5 days 30 days
TCT 505 days / 5 days/week = 101 weeeks
TCT = 355 days / 5 days/week = 71 weeks
Fisical Planning
Administrative Coordination
Contracting Dicisión
Legal División
Fnancial División
General Secretary
President
Directive Board
5
Maturation
30 days
Controlls (Interventoria)
Maintenance Area
5 days
5 days

Causal diagram
19
Proyectos
Maduros para
Ejecutar.Proyectos del Plan
Maduros
Tasa de Proyectos
Maduros en el Plan
Proyectos del Plan
Madurados.
Recaudo
Disponible
Recudo de Estampilla
para Infraestructura
Tasa de
Recaudo
Recaudo total
Tiempo de
Maduración
Periodo de
Autorización
Periodo de
Autorización.
Proyectos Maduros
Autorizados
Recaudo Autorizado
para Ejecutar
Total Proyectos
Maduros
Tasa de Proyectos No
Maduros del Plan
AutorizaciónAsignación del
Recaudo
Proyectos Listos
para Contratar
Tiempo Medio de
Ejecución de Obra
Tiempo Medio deContratación yLegalización
Contratación y
Legalización
Proyectos en
Espera de
Ejecución
Proyectos en
ejecución
Proyectos
Terminados
Plan de Inversiones
<Plan de
Inversiones>
Discrepancia enProyectos Pendientes por
ejecutar
Proyectos
Conformes para
Contratar
Proyectos En
Ejecución que
deben ser
Ajustados
Tasa de Proyectos enEjecución que Requieren ser
Ajustados
Tasa de Proyectos sin
Requerimientos de Ajustes
Proyecto Ajustado
en Ejecución
Tiempo Medio de
Ajuste de
MaduraciónTiempo Medio
Ejecución de Ajustes
Proyectos
Ajustados
Total Proyectos
Contratados
Proyectos con
Adición
AprobadaAprobación de
Adición
Tiempo de Aprobación
de Adición
Efectividad
del
Recaudo Total de Recaudo
FaltanteRecaudo No
Ingresado
<Plan de
Inversiones>
<Efectividad del
Recaudo>
<Plan de
Inversiones>
<Efectividad del
Recaudo>
Descuento por
Oferta
Autorización
Financiera
<Time>
Autorización
Semanal
Autorización
Semanal 2

Forrester diagram
21
Mature Projects
for AutorizationMature Projects
Rate Mature
Projects
Projects in
Maturation
Money Available
Collection Tax
Collection Rate
Total Money
Maturity Time
Authorization
Time.
Authorization
Period
Autorization Mature
Projects
Money for
Autorization
Total Mature Projects
Rate of immature
Projects
Authorization of Use
of Money
Projects to Contract
Average Time for
Construction
Average Time inContract andLegalization
Contract and
Legalization
Projects in
Waiting for
ConstructionProjects
under
Construction
Completed
Projects
Investment Plan
<Investment Plan>
Projects Pending
by Hiring
Projects Ready to
Contract
Projects underConstruction in Maturity
process
Rate of Construction
Projects to Adjust
Rate of Construction
Projects Without
Adjust
Adjusted
Construction
Projects
Average Time in
Matury Average Time
Maturation
Correct
Projects
Total Projects
Contracted
Total Executed:
Initial Project +
AdditionsTotal finished
with additions
average cost
overrun
Projects
Approved
AddingApproval ofAdditional
Money
Time for Approvalof Additional
MoneyEffectiveness of
CollectionTotal Collection
not AchievedCollection not
Achieved
Projects that are not
buildProjects
without
Money
<Effectiveness of
Collection>
<Money for
Autorization>
<Total Mature
Projects>
<Autorization
Mature Projects>
Waiting Money Next
Year
Projects are
postponed
Waiting Money
Posponed
Rate Postponed
Rate for Projects in
waiting
<Investment Plan>
<Effectiveness of
Collection>
<Investment Plan>
<Effectiveness of
Collection>
Savings in Offer
Completion time All
Projects Investment Plan
TRaccount timeTE
Final Financial
Approval
<Total Money>
<Savings in Offer>
accumulated savings
construction project
balances
balance adjustment
balance
adjustment 2
balance
adjustment 3
<Contract and
Legalization>
<Projects under
Construction>
<Adjusted
Construction Projects>
Overruns Added
Overruns
<Projects under
Construction>
<Total finished with
additions>
<Adjusted
Construction Projects>
Funding to external
sources
Difference between
saving and cost overrun
<Completed
Projects>
Plan Time TP
EP
PP
<Time>
<Investment
Plan>
VCP
<Effectiveness of
Collection> <Investment
Plan>
VCC
<Savings in
Offer>
Weekly
Authorization
Weekly
Autorization 2
Weekly
Autorization 3
Reality Check: Nocollection no Construction
Projects
<Total Money> <Completed
Projects>
<Effectiveness of
Collection>

Current state
23
101 Weeks

The simulated improve contains
As you can see in the next table
Factor A: Approval of Investment earlier. The transfer of the collected resources faster.
Factor C: Improve Administrative Processes
24

Behavioral of indicators from analysis scenarios
25
SCENARIO FACTOR 1/TE PP/0.9120 1/VCPGlobalIndex
LocalImprov
Current Current 0.52 0.12 0.98 0.530 Reference
1 A 0.89 0.78 0.98 0.937 82.5%
2 B 0.54 0.17 1.04 0.610 15.1%
3 C 0.57 0.42 0.98 0.659 24.3%
4 A,B 0.95 0.83 1.04 0.996 87.9%
5 A,C 1.00 1.00 0.98 1.047 97.5%
6 B,C 0.57 0.42 0.98 0.659 24.3%
7 A,B,C 1.04 1.00 1.04 1.084 104.5%

Future state
27
52 Weeks
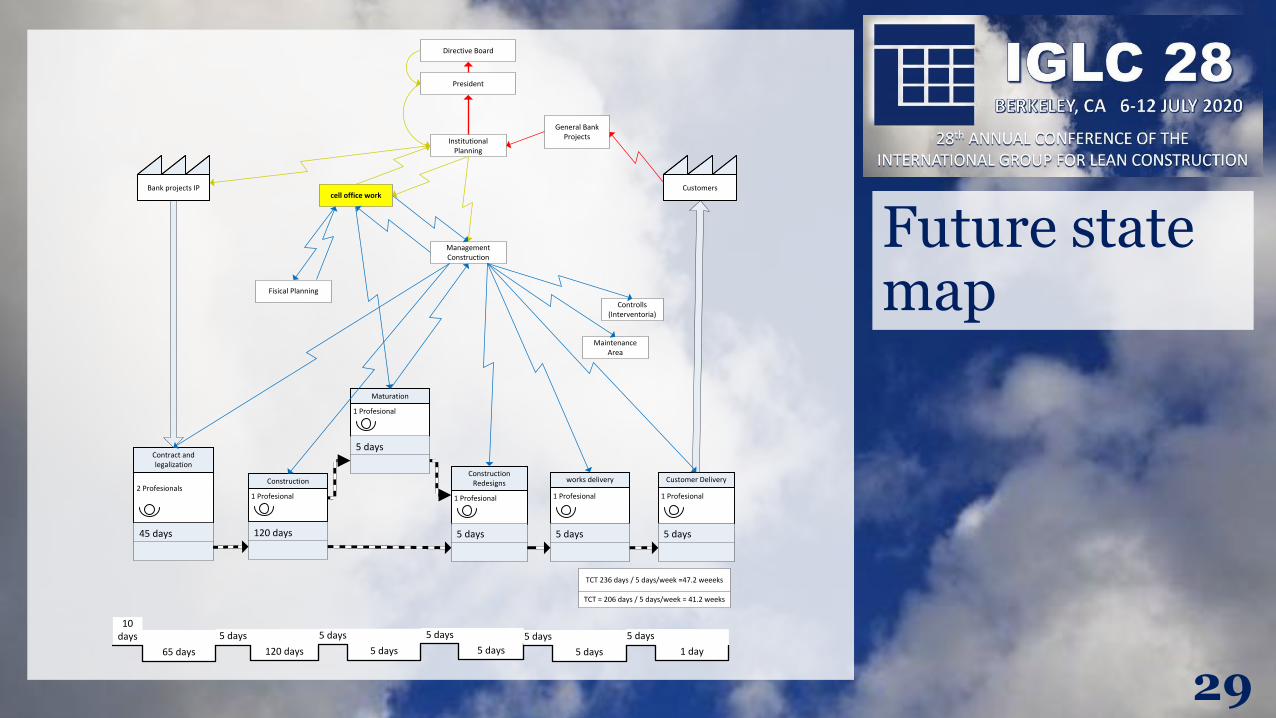
Future state map
29
Bank projects IP
2 Profesionals
Contract and legalization
45 days
1 Profesional
Construction
120 days
1 Profesional
Construction Redesigns
5 days
1 Profesional
works delivery
5 days
1 Profesional
Customer Delivery
5 days
Customers
Institutional Planning
Management Construction
General Bank Projects
65 days
10 days
120 days
5 days
5 days
5 days
5 days
5 days
5 days
5 days
1 day
5 days
TCT 236 days / 5 days/week =47.2 weeeks
TCT = 206 days / 5 days/week = 41.2 weeks
Fisical Planning
cell office work
President
Directive Board
1 Profesional
Maturation
5 days
Controlls (Interventoria)
Maintenance Area

Conclusions
The application of Lean tools, for this case, contributes to achieving the economical use of personnel involved in the management process, such as an increase in value-added for customers.
30

Conclusions
It validates that the symptoms of problems seen in a value flow should be analyzed with a systematic approach to understanding the root of the problems and their consequences, as well as the effectiveness of improvement actions.
31

Conclusions
Lean Thinking has been developed by the manufacturers years with good results, especially when a business culture is consolidated around this thought in institutions like the study, parallel to the intervention of the factors you should build this culture removal waste as a common mission to help streamline the flow in this and other business processes.
32

Conclusions
Mapping the value stream is essential to identify underlying structures in the value flow, in addition to activities that add no value, to propose formulating structural measures to expedite the flow of the mainstream, and projects to can fulfill planned targets.
33

And that’s all for now I hope you have enjoyed this presentation as I did. If you want to contact me, my email is
34

35