Dynamics in Aquaculture - IntraFish...
28
Intrafish Summit 2016 , Jeroen Leffelaar Managing Director Large Corporates Food & Agri NYC 2016 Dynamics in Aquaculture
Transcript of Dynamics in Aquaculture - IntraFish...
Intrafish Summit 2016 ,
Jeroen Leffelaar
Managing Director Large Corporates Food & Agri
NYC 2016
Dynamics in Aquaculture
2
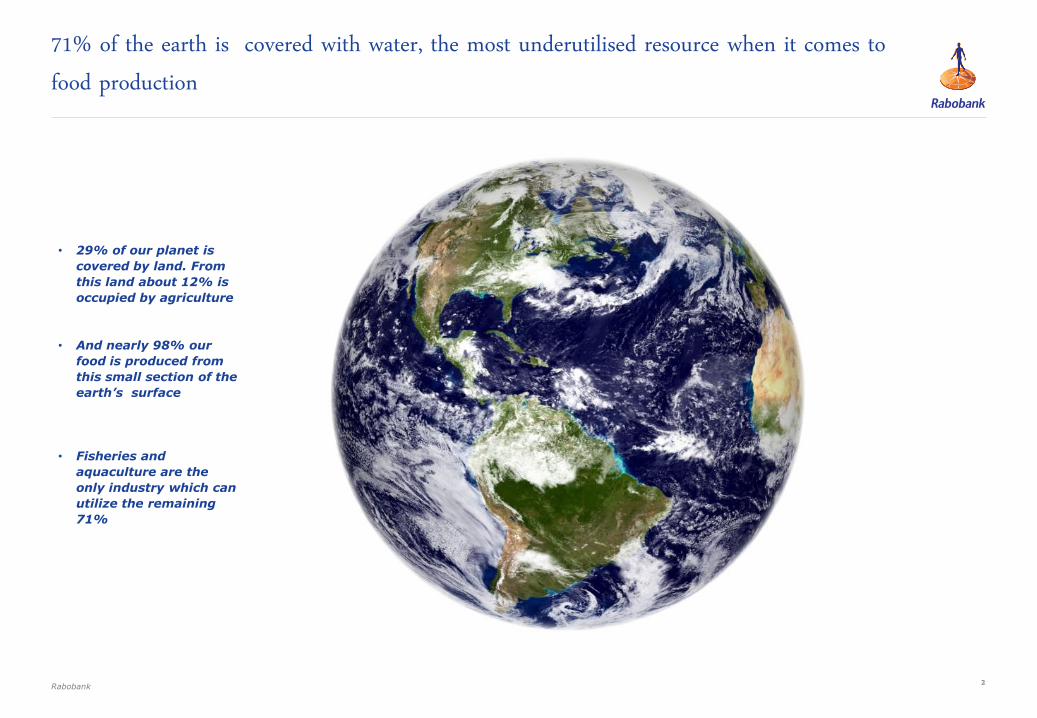
• 29% of our planet is
covered by land. From
this land about 12% is
occupied by agriculture
• And nearly 98% our
food is produced from
this small section of the
earth’s surface
• Fisheries and
aquaculture are the
only industry which can
utilize the remaining
71%
71% of the earth is covered with water, the most underutilised resource when it comes to food production
Rabobank
Demand – Seafood has the most unsatisfied demand function of any protein I
4
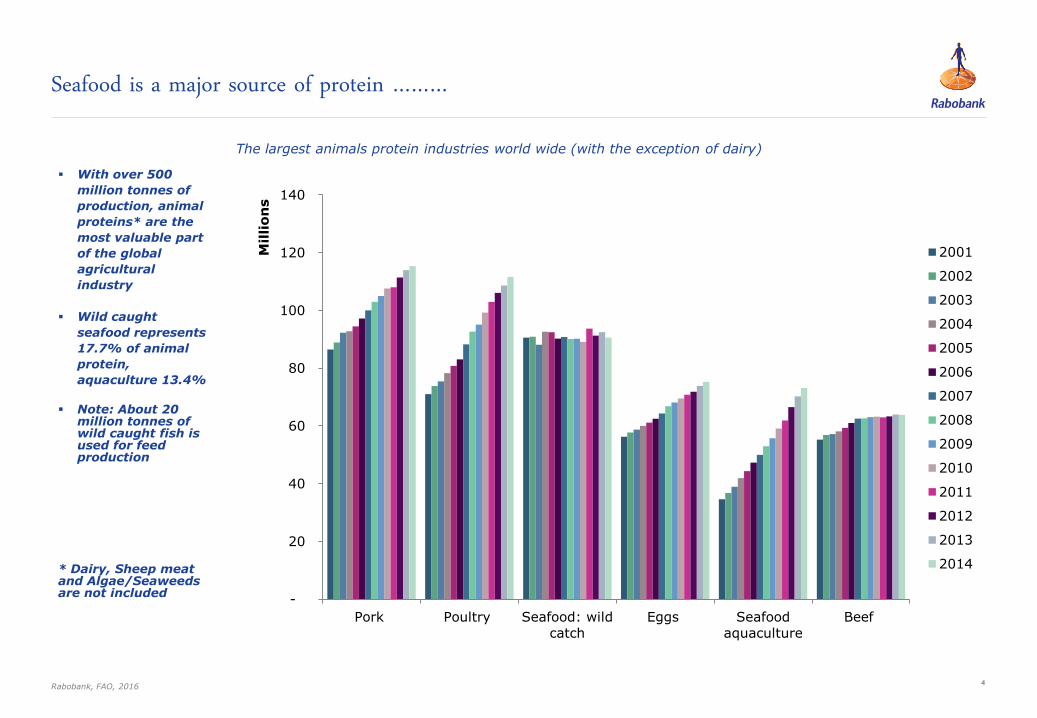
With over 500
million tonnes of
production, animal
proteins* are the
most valuable part
of the global
agricultural
industry
Wild caught
seafood represents
17.7% of animal
protein,
aquaculture 13.4%
Note: About 20 million tonnes of wild caught fish is used for feed production
* Dairy, Sheep meat and Algae/Seaweeds are not included
Seafood is a major source of protein ………
The largest animals protein industries world wide (with the exception of dairy)
Rabobank, FAO, 2016
-
20
40
60
80
100
120
140
Pork Poultry Seafood: wild
catch
Eggs Seafood
aquaculture
Beef
Millio
ns
2001
2002
2003
2004
2005
2006
2007
2008
2009
2010
2011
2012
2013
2014
5
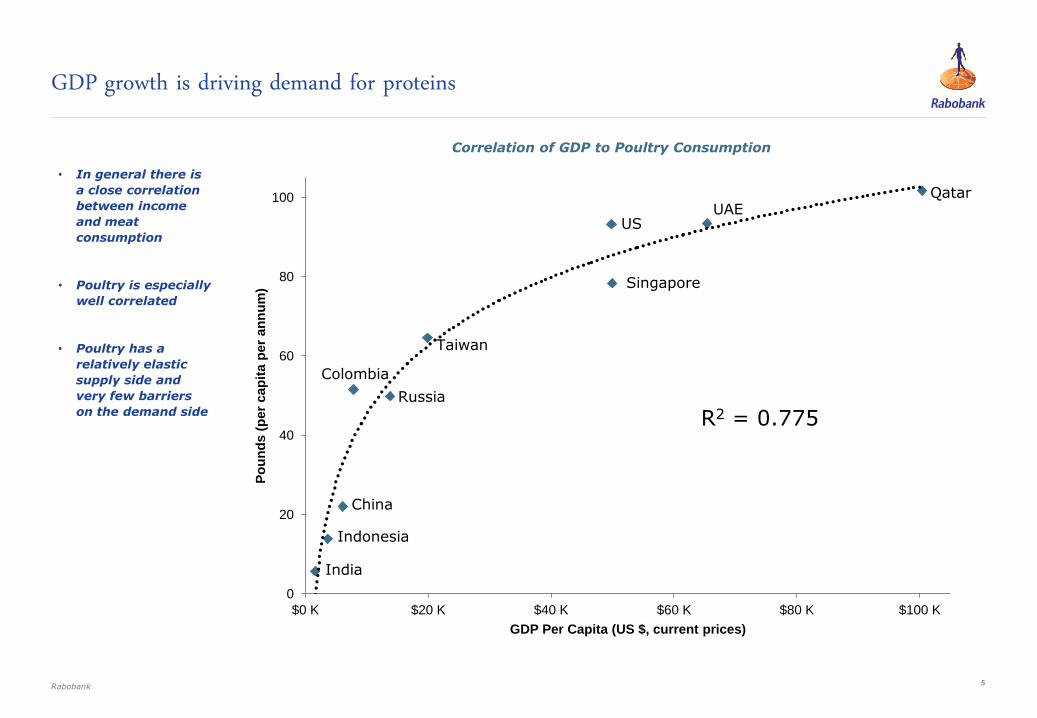
• In general there is
a close correlation
between income
and meat
consumption
• Poultry is especially
well correlated
• Poultry has a
relatively elastic
supply side and
very few barriers
on the demand side
GDP growth is driving demand for proteins
Correlation of GDP to Poultry Consumption
Rabobank
0
20
40
60
80
100
$0 K $20 K $40 K $60 K $80 K $100 K
Po
un
ds (
per
cap
ita p
er
an
nu
m)
GDP Per Capita (US $, current prices)
China
Indonesia
India
Taiwan
Russia
Colombia
Singapore
US UAE
Qatar
R2 = 0.775
6 6
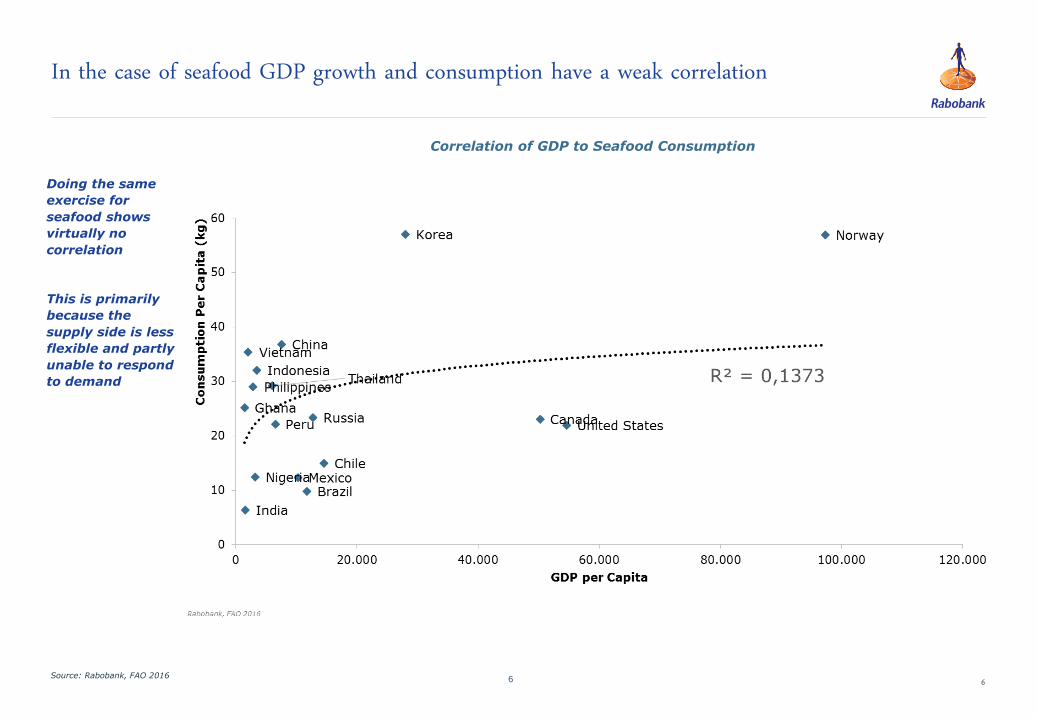
Doing the same
exercise for
seafood shows
virtually no
correlation
This is primarily
because the
supply side is less
flexible and partly
unable to respond
to demand
Source: Rabobank, FAO 2016
In the case of seafood GDP growth and consumption have a weak correlation
Correlation of GDP to Seafood Consumption
7
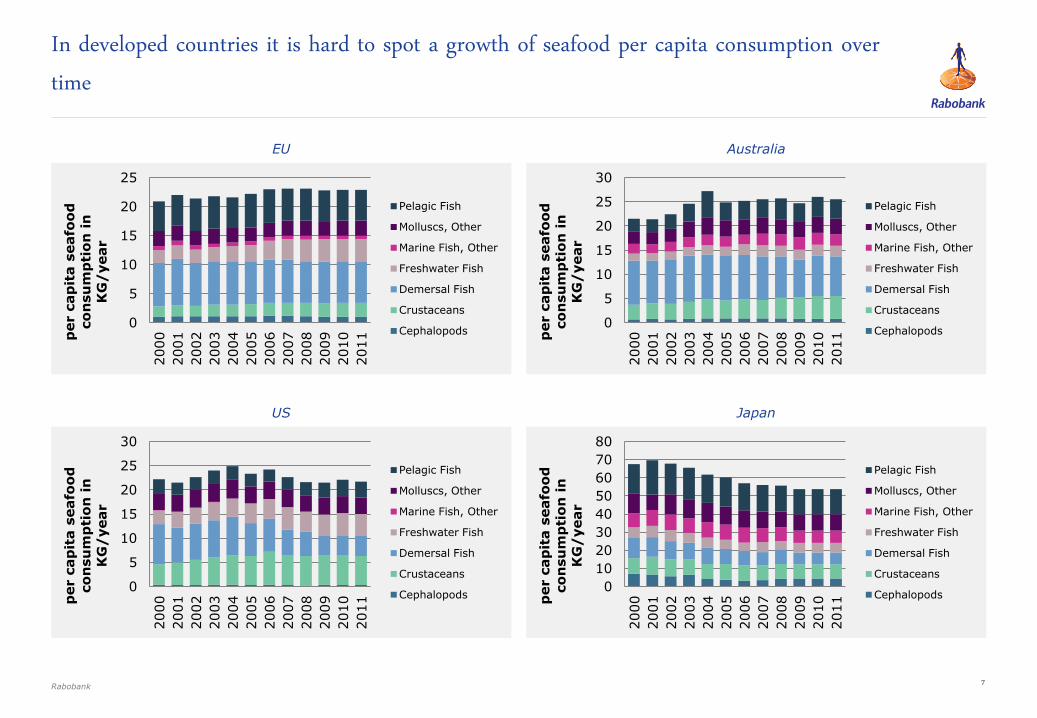
In developed countries it is hard to spot a growth of seafood per capita consumption over time
Australia
Japan
EU
US
Rabobank
0
10
20
30
40
50
60
70
80
2000
2001
2002
2003
2004
2005
2006
2007
2008
2009
2010
2011
per c
ap
ita s
eafo
od
co
nsu
mp
tio
n i
n
KG
/year
Pelagic Fish
Molluscs, Other
Marine Fish, Other
Freshwater Fish
Demersal Fish
Crustaceans
Cephalopods 0
5
10
15
20
25
30
2000
2001
2002
2003
2004
2005
2006
2007
2008
2009
2010
2011
per c
ap
ita s
eafo
od
co
nsu
mp
tio
n i
n
KG
/year
Pelagic Fish
Molluscs, Other
Marine Fish, Other
Freshwater Fish
Demersal Fish
Crustaceans
Cephalopods
0
5
10
15
20
25
2000
2001
2002
2003
2004
2005
2006
2007
2008
2009
2010
2011
per c
ap
ita s
eafo
od
co
nsu
mp
tio
n i
n
KG
/year
Pelagic Fish
Molluscs, Other
Marine Fish, Other
Freshwater Fish
Demersal Fish
Crustaceans
Cephalopods 0
5
10
15
20
25
30
2000
2001
2002
2003
2004
2005
2006
2007
2008
2009
2010
2011
per c
ap
ita s
eafo
od
co
nsu
mp
tio
n i
n
KG
/year
Pelagic Fish
Molluscs, Other
Marine Fish, Other
Freshwater Fish
Demersal Fish
Crustaceans
Cephalopods

8
China has a very high income elasticity of demand and supply elasticity (high share of aquaculture)
China Statistical Yearbook 2011 National Bureau of Statistics of China, Industry reports, 2014
Relative seafood and animal protein expenditure per income group Urbanization & disposable income growth China
Rabobank research
0%
10%
20%
30%
40%
50%
60%
0
5,000
10,000
15,000
20,000
25,000
30,000
Urbanization rate of China (rsa)
Annual disposal income of urban households
Annual net income of rural households
4%
5%
6%
7%
8%
12%
14%
16%
18%
20%
22%
24%
Lowest Low Lower Middle
Middle Upper Middle
High Highest
Seafo
od
exp
en
dit
ure s
hare
Meat
exp
en
dit
ure s
hare
Meat, Poultry and Processed Products (LHS)
Aquatic Products (RHS)
9
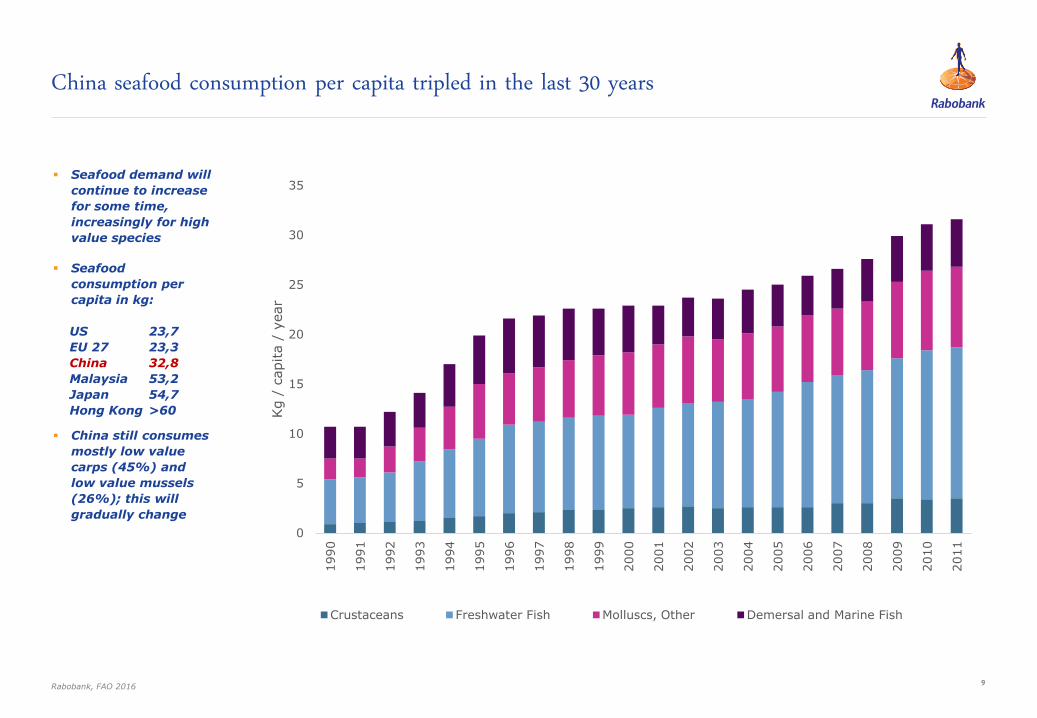
Seafood demand will
continue to increase
for some time,
increasingly for high
value species
Seafood
consumption per
capita in kg:
US 23,7
EU 27 23,3
China 32,8
Malaysia 53,2
Japan 54,7
Hong Kong >60
China still consumes
mostly low value
carps (45%) and
low value mussels
(26%); this will
gradually change
China seafood consumption per capita tripled in the last 30 years
Rabobank, FAO 2016
0
5
10
15
20
25
30
35
1990
1991
1992
1993
1994
1995
1996
1997
1998
1999
2000
2001
2002
2003
2004
2005
2006
2007
2008
2009
2010
2011
Kg /
capita /
year
Crustaceans Freshwater Fish Molluscs, Other Demersal and Marine Fish
10
-
2
4
6
8
10
12
2000
2001
2002
2003
2004
2005
2006
2007
2008
2009
2010
2011
2012
2013
2014
Millions M
T
wild catch aquaculture
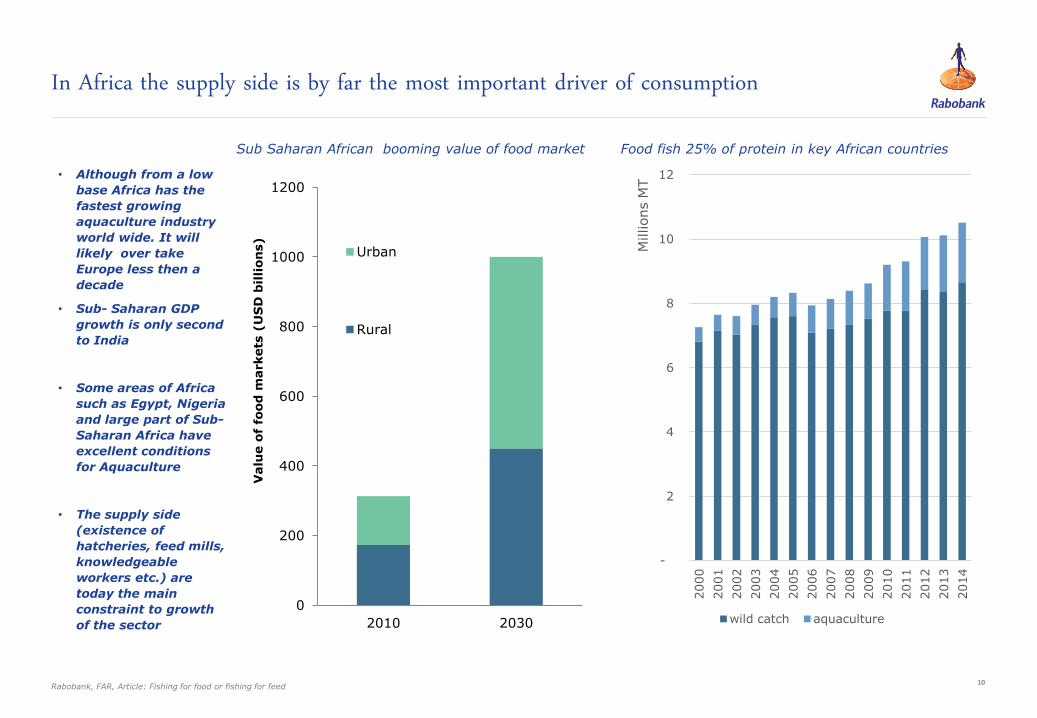
• Although from a low
base Africa has the
fastest growing
aquaculture industry
world wide. It will
likely over take
Europe less then a
decade
• Sub- Saharan GDP
growth is only second
to India
• Some areas of Africa
such as Egypt, Nigeria
and large part of Sub-
Saharan Africa have
excellent conditions
for Aquaculture
• The supply side
(existence of
hatcheries, feed mills,
knowledgeable
workers etc.) are
today the main
constraint to growth
of the sector
In Africa the supply side is by far the most important driver of consumption
Sub Saharan African booming value of food market Food fish 25% of protein in key African countries
Rabobank, FAR, Article: Fishing for food or fishing for feed
0
200
400
600
800
1000
1200
2010 2030
Valu
e o
f fo
od
markets
(U
SD
bil
lion
s)
Urban
Rural

11
• Based on historical
link of income and
seafood consumption
and future income
growth expectations it
is easy to see why
Asia is key to future
growth
• Asia and China
dominates fish
consumption and
growth world wide
• Europe has near zero
volume growth
• Growth of aquaculture
could eventually
increase seafood
consumption growth
in developed markets
OECD outlook: fish consumption and growth dominated by Asia and China
OECD outlook on the Fish consumption per region world wide (in MT)
OECD 2015
0
10000
20000
30000
40000
50000
60000
70000
80000
NORTH
AMERICA
EUROPE AFRICA LATIN
AMERICA AND CARIBBEAN
China Asia ex China
2006
2007
2008
2009
2010
2011
2012
2013
2014
2015
2016
2017
2018
2019
2020
2021
2022
2023
Supply – All cards on Aquaculture II
13
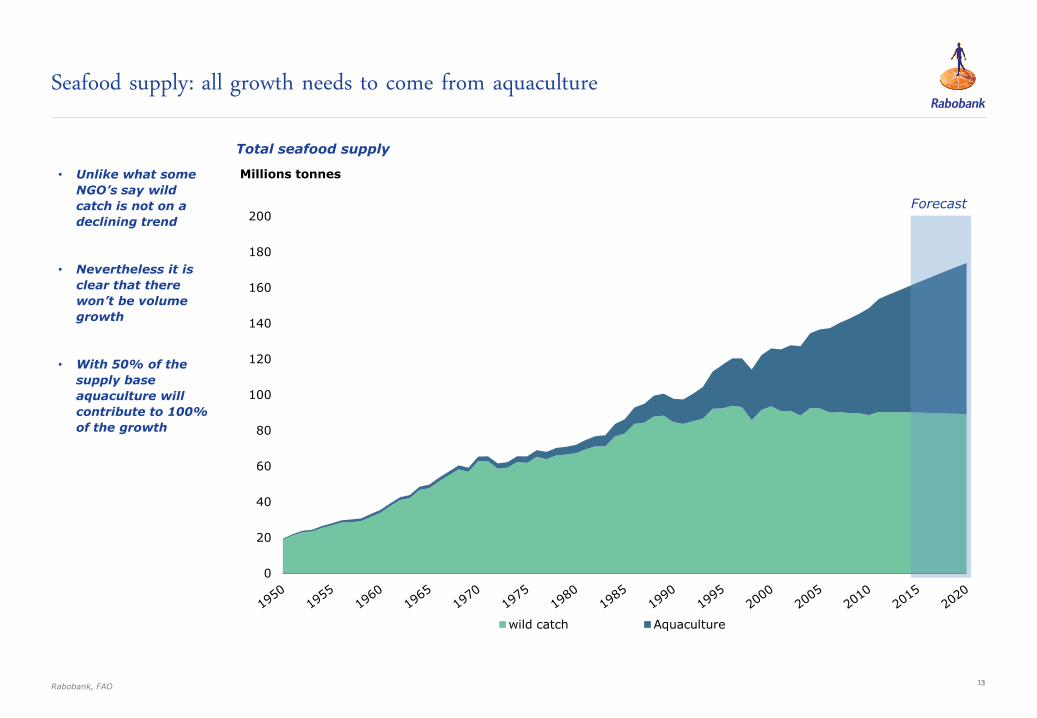
• Unlike what some
NGO’s say wild
catch is not on a
declining trend
• Nevertheless it is
clear that there
won’t be volume
growth
• With 50% of the
supply base
aquaculture will
contribute to 100%
of the growth
Seafood supply: all growth needs to come from aquaculture
Total seafood supply
Rabobank, FAO
0
20
40
60
80
100
120
140
160
180
200
Millions tonnes
wild catch Aquaculture
Forecast
14
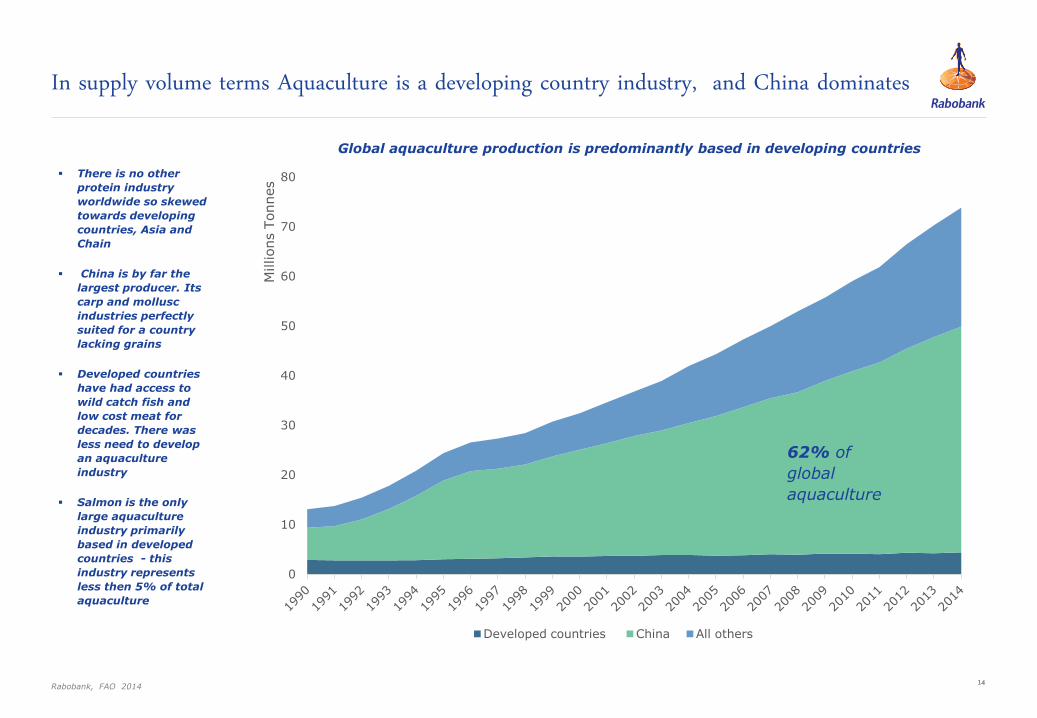
There is no other
protein industry
worldwide so skewed
towards developing
countries, Asia and
Chain
China is by far the
largest producer. Its
carp and mollusc
industries perfectly
suited for a country
lacking grains
Developed countries
have had access to
wild catch fish and
low cost meat for
decades. There was
less need to develop
an aquaculture
industry
Salmon is the only
large aquaculture
industry primarily
based in developed
countries - this
industry represents
less then 5% of total
aquaculture
In supply volume terms Aquaculture is a developing country industry, and China dominates
Global aquaculture production is predominantly based in developing countries
Rabobank, FAO 2014
0
10
20
30
40
50
60
70
80
Millions T
onnes
Developed countries China All others
62% of
global
aquaculture

15
• Nearly all Carp and
Mollusk farming is
based on extensive
faming technology
• In terms of inputs
and technology this
can be compared to
pasture farming on
land
• Intensive farming -
such as salmon,
shrimp, tilapia in
terms of land use
and exposure to the
environment
compare to FREE
RANGE Chicken of
Pork production
• As LAND is the key
input for extensive
farming, Intensive
aquaculture will the
future of the
industry
Moreover 2/3rd of aquaculture is based on extensive farming (loosely comparable to pasture farming on land)
Rabobank, FAO FIGIS
-
10,000,000
20,000,000
30,000,000
40,000,000
50,000,000
60,000,000
70,000,000
80,000,000
Molluscs Carps, barbels and other cyprinids Other fresh water
Crustaceans Salmons, trouts, smelts All other diadromous
Marine fishes
Extensive farming technology
Intensive farming
Global aquaculture production (excluding aquatic plants) 1990 – 2014 per key species group
16
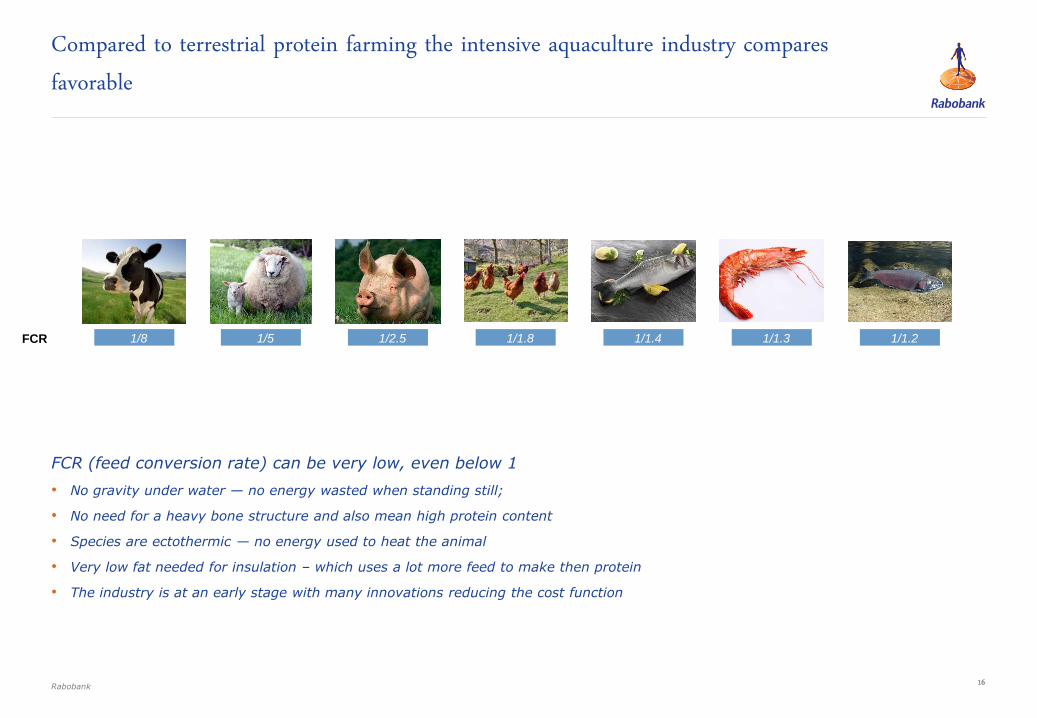
Compared to terrestrial protein farming the intensive aquaculture industry compares favorable
Rabobank
FCR (feed conversion rate) can be very low, even below 1
• No gravity under water — no energy wasted when standing still;
• No need for a heavy bone structure and also mean high protein content
• Species are ectothermic — no energy used to heat the animal
• Very low fat needed for insulation – which uses a lot more feed to make then protein
• The industry is at an early stage with many innovations reducing the cost function
1/8
1/5
1/2.5
1/1.8
1/1.4
1/1.2
1/1.3
FCR
Constraints in aquaculture: Biology versus Demand III
18
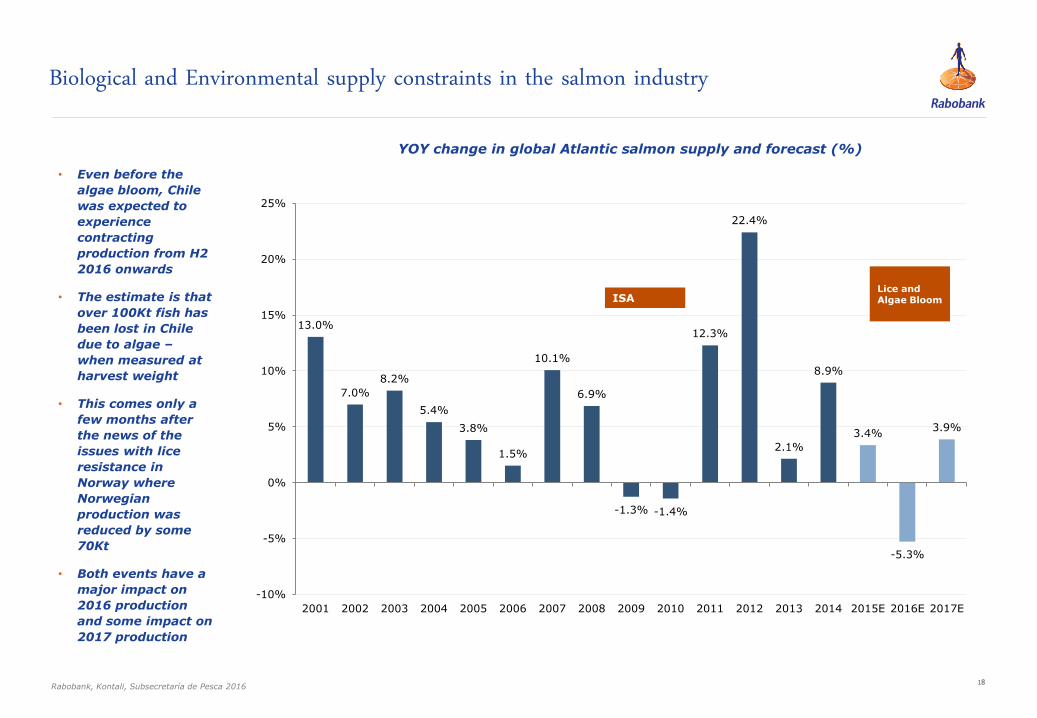
• Even before the
algae bloom, Chile
was expected to
experience
contracting
production from H2
2016 onwards
• The estimate is that
over 100Kt fish has
been lost in Chile
due to algae –
when measured at
harvest weight
• This comes only a
few months after
the news of the
issues with lice
resistance in
Norway where
Norwegian
production was
reduced by some
70Kt
• Both events have a
major impact on
2016 production
and some impact on
2017 production
Biological and Environmental supply constraints in the salmon industry
YOY change in global Atlantic salmon supply and forecast (%)
Rabobank, Kontali, Subsecretaría de Pesca 2016
13.0%
7.0%
8.2%
5.4%
3.8%
1.5%
10.1%
6.9%
-1.3% -1.4%
12.3%
22.4%
2.1%
8.9%
3.4%
-5.3%
3.9%
-10%
-5%
0%
5%
10%
15%
20%
25%
2001 2002 2003 2004 2005 2006 2007 2008 2009 2010 2011 2012 2013 2014 2015E 2016E 2017E
ISA Lice and Algae Bloom
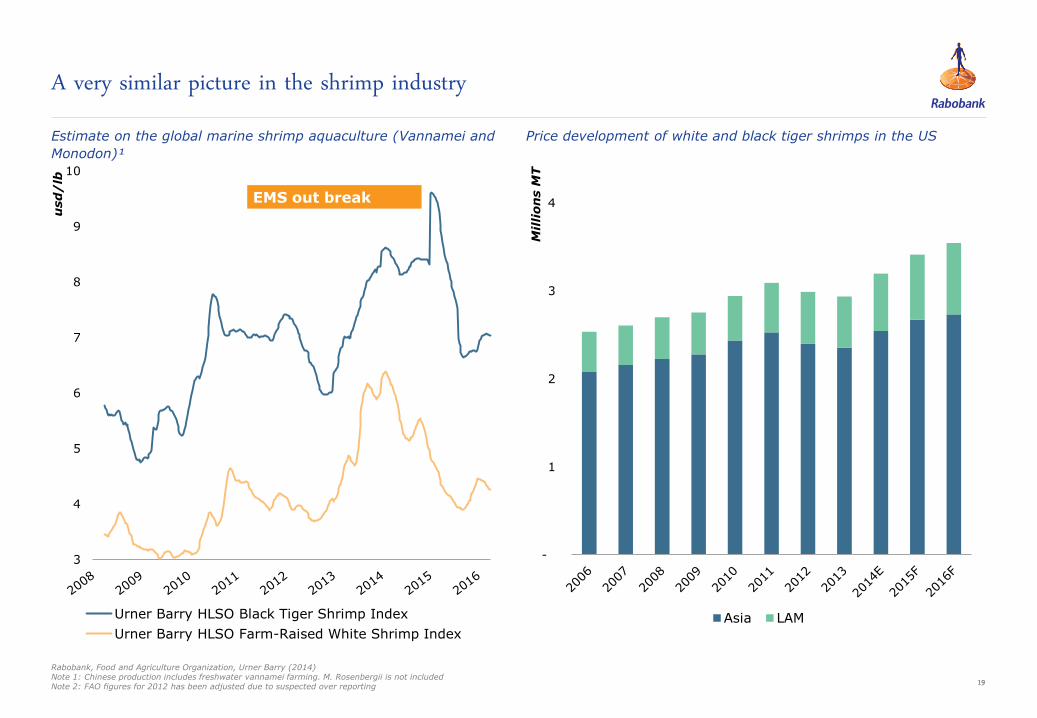
19
-
1
2
3
4
Mil
lion
s M
T
Asia LAM
3
4
5
6
7
8
9
10
usd
/lb
Urner Barry HLSO Black Tiger Shrimp Index
Urner Barry HLSO Farm-Raised White Shrimp Index
A very similar picture in the shrimp industry Price development of white and black tiger shrimps in the US Estimate on the global marine shrimp aquaculture (Vannamei and
Monodon)¹
Rabobank, Food and Agriculture Organization, Urner Barry (2014) Note 1: Chinese production includes freshwater vannamei farming. M. Rosenbergii is not included Note 2: FAO figures for 2012 has been adjusted due to suspected over reporting
EMS out break

20
1.5
1.7
1.9
2.1
2.3
2.5
2.7
2008 2009 2010 2011 2012 2013 2014 2015 2016
Tilapia Pangasius
-
1
2
3
4
5
6
7
8
9
10
1990
1991
1992
1993
1994
1995
1996
1997
1998
1999
2000
2001
2002
2003
2004
2005
2006
2007
2008
2009
2010
2011
2012
2013
Mil
lio
ns
Tilapias Panga Catfish
In the case of Tilapia and Pangasius market development is the bottle neck
Rabobank, Food and Agriculture Organization, Urner Barry (2014) Note 1: Chinese production includes freshwater vannamei farming. M. Rosenbergii is not included Note 2: FAO figures for 2012 has been adjusted due to suspected over reporting
Aquaculture of selected fresh water species
Price development of Tilapia and Pangasius in the US
21
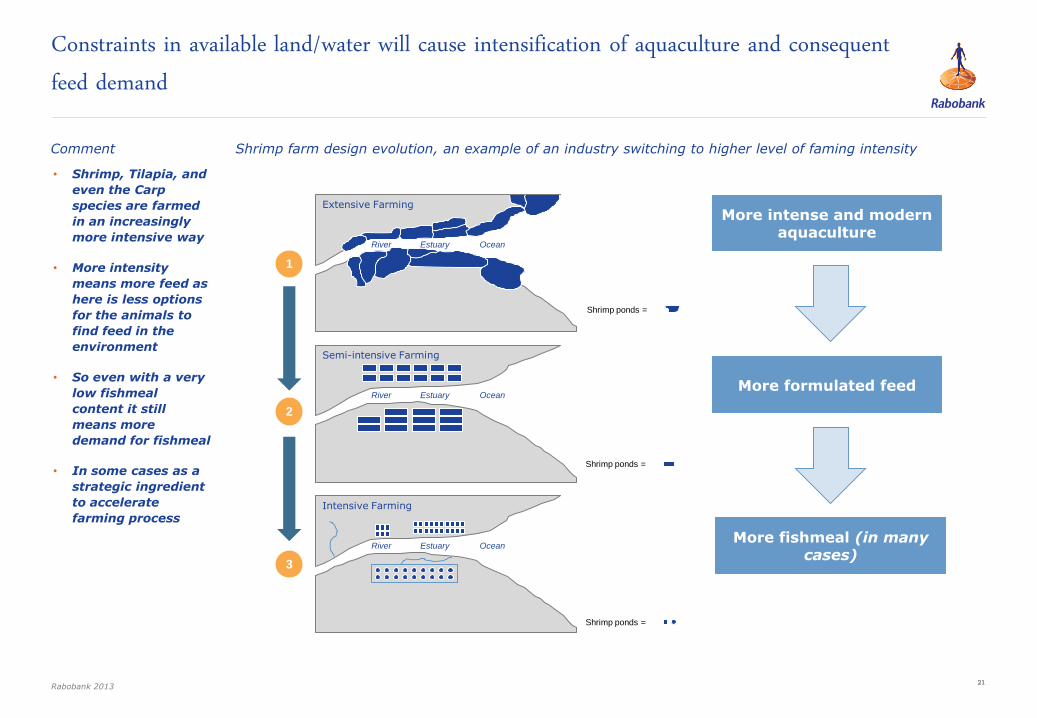
• Shrimp, Tilapia, and
even the Carp
species are farmed
in an increasingly
more intensive way
• More intensity
means more feed as
here is less options
for the animals to
find feed in the
environment
• So even with a very
low fishmeal
content it still
means more
demand for fishmeal
• In some cases as a
strategic ingredient
to accelerate
farming process
Constraints in available land/water will cause intensification of aquaculture and consequent feed demand
Shrimp farm design evolution, an example of an industry switching to higher level of faming intensity
Rabobank 2013
Intensive Farming
River Estuary Ocean
Shrimp ponds =
Semi-intensive Farming
River Estuary Ocean
Shrimp ponds =
Extensive Farming
River Estuary Ocean
Shrimp ponds =
2
1
3
More intense and modern aquaculture
More formulated feed
More fishmeal (in many cases)
Comment
22
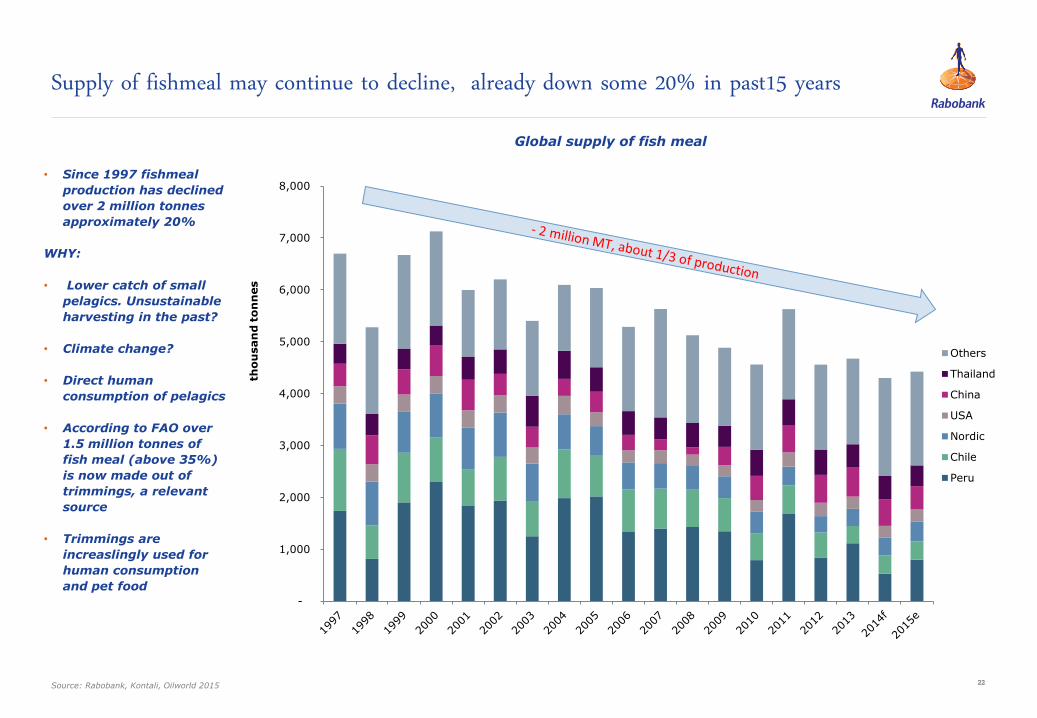
Global supply of fish meal
Supply of fishmeal may continue to decline, already down some 20% in past15 years
• Since 1997 fishmeal
production has declined
over 2 million tonnes
approximately 20%
WHY:
• Lower catch of small
pelagics. Unsustainable
harvesting in the past?
• Climate change?
• Direct human
consumption of pelagics
• According to FAO over
1.5 million tonnes of
fish meal (above 35%)
is now made out of
trimmings, a relevant
source
• Trimmings are
increaslingly used for
human consumption
and pet food
Source: Rabobank, Kontali, Oilworld 2015
-
1,000
2,000
3,000
4,000
5,000
6,000
7,000
8,000
tho
usan
d t
on
nes
Others
Thailand
China
USA
Nordic
Chile
Peru
23
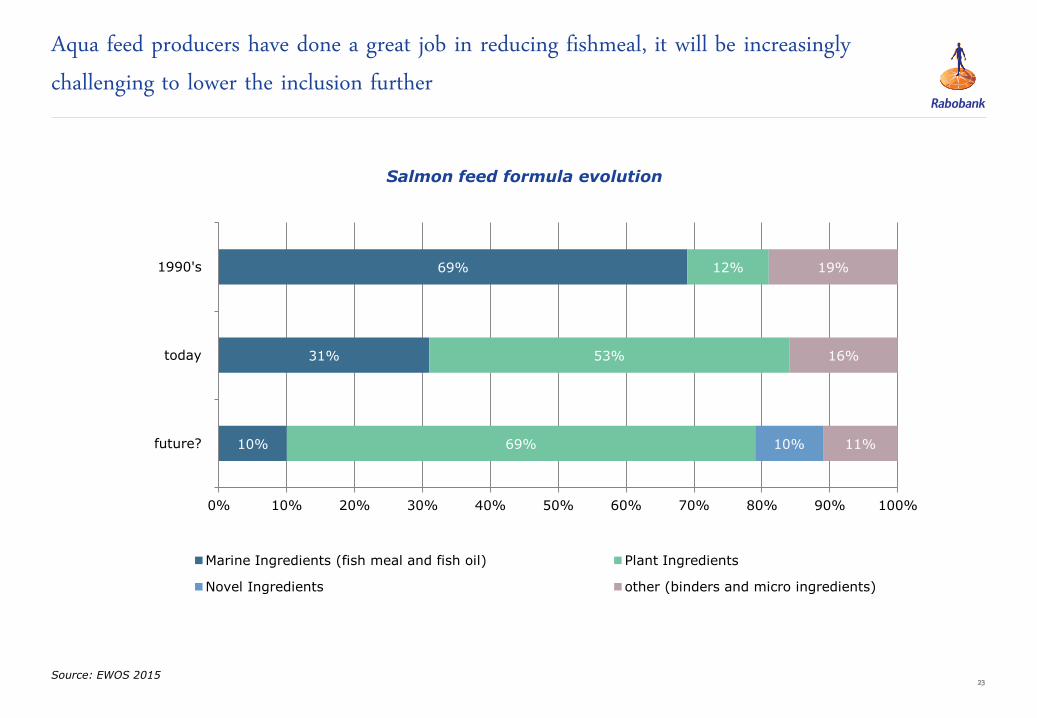
Aqua feed producers have done a great job in reducing fishmeal, it will be increasingly challenging to lower the inclusion further
Salmon feed formula evolution
Source: EWOS 2015
10%
31%
69%
69%
53%
12%
10% 11%
16%
19%
0% 10% 20% 30% 40% 50% 60% 70% 80% 90% 100%
future?
today
1990's
Marine Ingredients (fish meal and fish oil) Plant Ingredients
Novel Ingredients other (binders and micro ingredients)
24
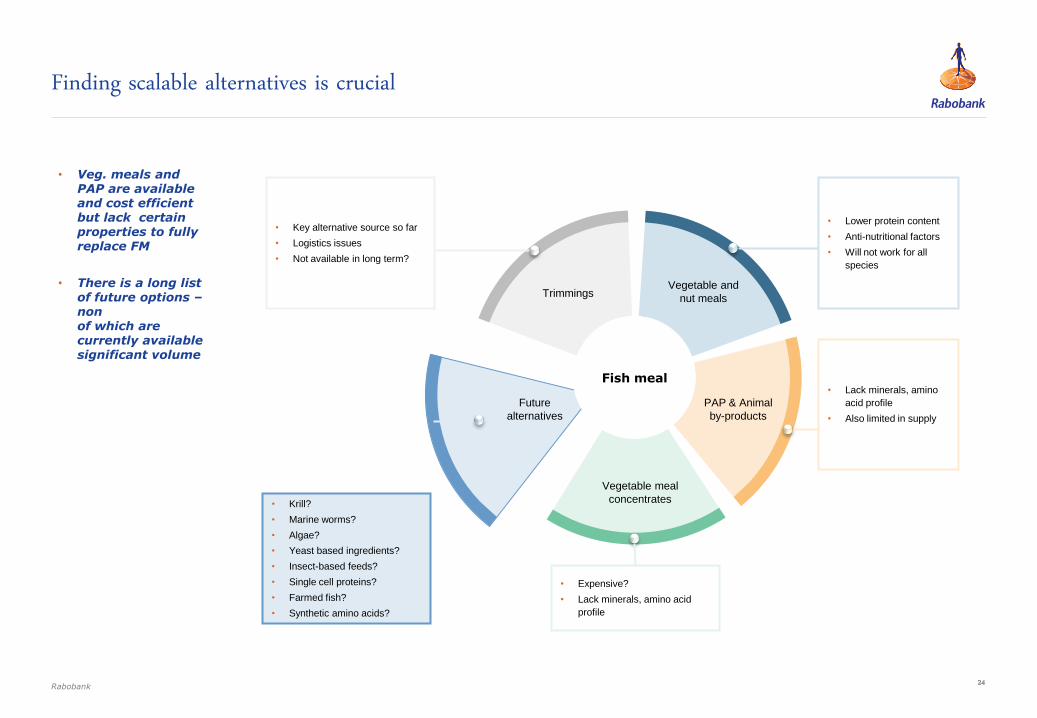
• Veg. meals and PAP are available and cost efficient but lack certain properties to fully replace FM
• There is a long list of future options – non of which are currently available significant volume
Finding scalable alternatives is crucial
Rabobank
Fish meal
Vegetable and
nut meals
PAP & Animal
by-products
Vegetable meal
concentrates
Future
alternatives
Trimmings
• Krill?
• Marine worms?
• Algae?
• Yeast based ingredients?
• Insect-based feeds?
• Single cell proteins?
• Farmed fish?
• Synthetic amino acids?
• Key alternative source so far
• Logistics issues
• Not available in long term?
• Expensive?
• Lack minerals, amino acid
profile
• Lack minerals, amino
acid profile
• Also limited in supply
• Lower protein content
• Anti-nutritional factors
• Will not work for all
species

Our view: growth in aquaculture will be enabled by unrivalled innovation IV

26
Seafood has a more complex demand function then the other proteins and is highly influenced by local availability
27
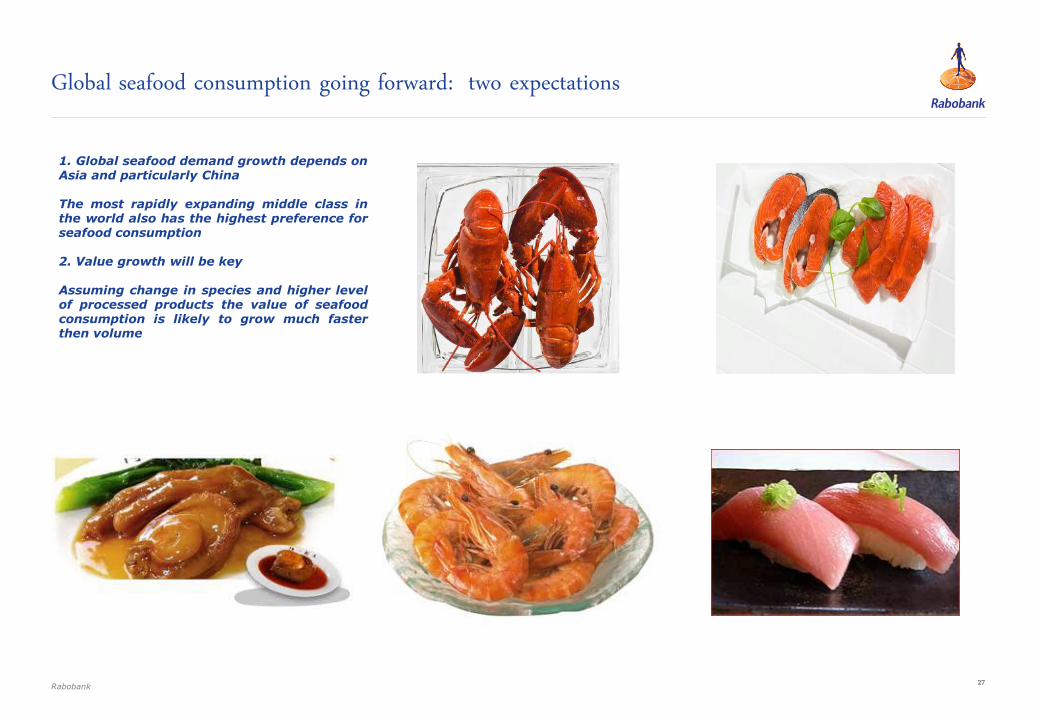
1. Global seafood demand growth depends on Asia and particularly China The most rapidly expanding middle class in the world also has the highest preference for seafood consumption 2. Value growth will be key Assuming change in species and higher level of processed products the value of seafood consumption is likely to grow much faster then volume
Global seafood consumption going forward: two expectations
Rabobank
28
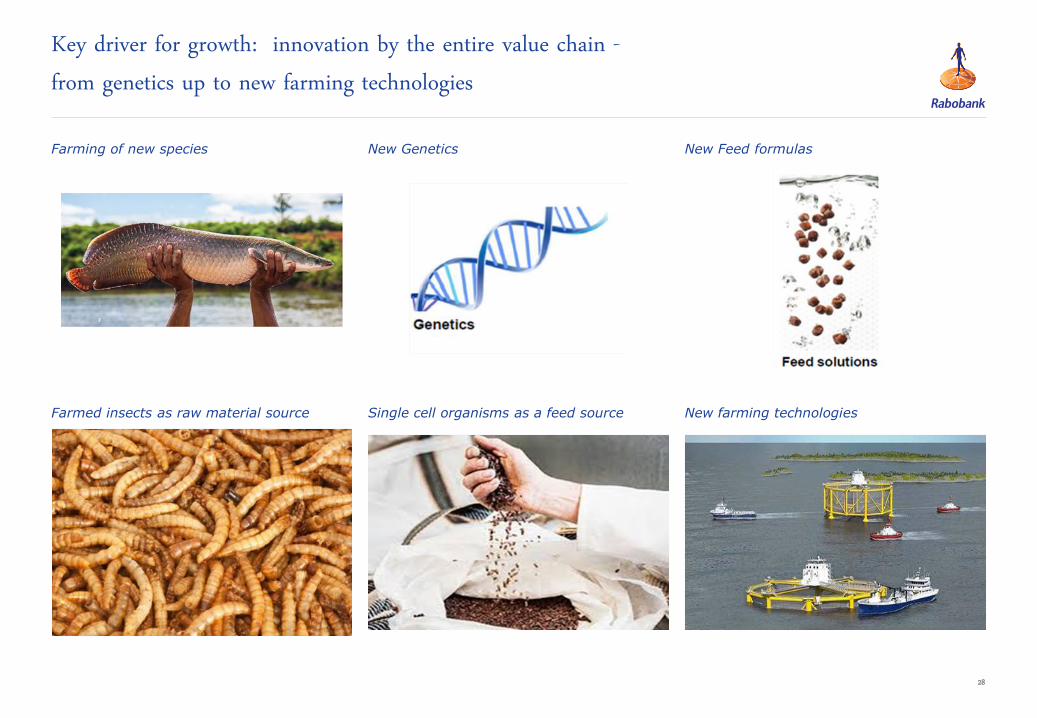
Key driver for growth: innovation by the entire value chain - from genetics up to new farming technologies
Farming of new species New Feed formulas New Genetics
Farmed insects as raw material source New farming technologies Single cell organisms as a feed source