Dynamically Tuning String Instrument · Pitch Changing Interactions between Musicians and ... Crazy...
45
Dynamically Tuning String Instrument A Major Qualifying Project Submitted to the Faculty of Worcester Polytechnic Institute in partial fulfillment of the requirements for the Degree in Bachelor of Science in Robotics Engineering Ethan Prihar Date: 01/08/17 Project Advisor: __________________________________ Professor Scott Barton, Advisor This report represents work of WPI undergraduate students submitted to the faculty as evidence of a degree requirement. WPI routinely publishes these reports on its web site without editorial or peer review. For more information about the projects program at WPI, see http://www.wpi.edu/Academics/Projects.
Transcript of Dynamically Tuning String Instrument · Pitch Changing Interactions between Musicians and ... Crazy...

Dynamically Tuning String Instrument
A Major Qualifying Project
Submitted to the Faculty of
Worcester Polytechnic Institute
in partial fulfillment of the requirements for the
Degree in Bachelor of Science
in
Robotics Engineering
Ethan Prihar
Date: 01/08/17
Project Advisor:
__________________________________
Professor Scott Barton, Advisor
This report represents work of WPI undergraduate students submitted to the faculty as evidence of a
degree requirement. WPI routinely publishes these reports on its web site without editorial or peer
review. For more information about the projects program at WPI, see
http://www.wpi.edu/Academics/Projects.

1
Abstract Cyther V3 looks to improve Cyther V2, a mechatronic string instrument equipped with ten
strings and a set of solenoids to actuate the strings. The goal of this project was to create a next
generation Cyther equipped with a system that can autonomously tune each string during a
performance, expanding on the types of musical expressions Cyther V2 was capable of. The tuning
system senses string tension, estimates pitch, adjusts the tension, and corrects for errors in estimation
using optical pickups. The frequency analysis accuracy and speed, and the tuning accuracy and speed of
the new autonomous tuning system was analyzed for a single string to determine the quality of the new
autonomous tuning system. Although the tuning is not precise enough for error to go undetected by
human perception, this tuning system should provide a platform on which to build more interactive
compositions and new kinds of musical gestures.

2
Acknowledgements Thank you to Professor Barton for designing and building Cyther V2, realizing the potential of an
autonomous tuning system, letting me try to make it, and advising me through the entire MQP process. I
recommend Professor Barton to anybody who wants to do an MQP.
Thank you to WPI’s Washburn Labs, Music Perception Robotics Lab, and Robotics Lab for
providing the equipment, assistance, and in some cases materials needed to complete this project.
Thank you to Grace O’Connor, Stephen Harnais, Marianne Kanellias, and Nikhil Deshpande for
helping me build this MQP and for providing emotional support in the lab.
Thank you to Joe St. Germain for guiding me and countless other RBE majors through the
robotics courses while also continuously making improvements to the robotics curriculum and just
generally being a really nice and caring person.

3
Table of Contents Abstract ......................................................................................................................................................... 1 Acknowledgements ....................................................................................................................................... 2 Table of Figures ............................................................................................................................................. 3 Table of Tables .............................................................................................................................................. 4 Table of Equations ........................................................................................................................................ 4 Introduction .................................................................................................................................................. 5 Background ................................................................................................................................................... 5
Pitch Changing Interactions between Musicians and String Instruments ................................................ 5 Combination of Instruments and Machines ............................................................................................. 6
Pitch Changing Devices: Prior Work ...................................................................................................... 6 Autonomous Tuning Systems: Prior Work ............................................................................................ 9
Interactions between Musicians and Machines ..................................................................................... 13 Limitations of Prior Work ........................................................................................................................ 15
Design Specifications and Requirements .................................................................................................... 15 Hardware ................................................................................................................................................ 15 Tuning System ......................................................................................................................................... 16
Design .......................................................................................................................................................... 16 Structural Design ..................................................................................................................................... 16 String Selection ....................................................................................................................................... 17 Tuning System Actuation ........................................................................................................................ 17 Tension Sensing ...................................................................................................................................... 18 Frequency Sensing .................................................................................................................................. 19 Relating Potentiometer Value to String Frequency ................................................................................ 22 Software Interface .................................................................................................................................. 24 Circuit Board Design ................................................................................................................................ 24
Potentiometer Board .......................................................................................................................... 25 Pickup Board ....................................................................................................................................... 25 Motor Board ........................................................................................................................................ 25
Results ......................................................................................................................................................... 25 Hardware ................................................................................................................................................ 25 Tuning System ......................................................................................................................................... 26
Recommendations for Future Work ........................................................................................................... 29 Improvements to the Instrument ........................................................................................................... 29 Additions to the Instrument ................................................................................................................... 30
Conclusion ................................................................................................................................................... 30 Bibliography ................................................................................................................................................ 31 Appendix A: One String Tuning Code .......................................................................................................... 33 Appendix B: Circuit Board Schematics ........................................................................................................ 40
Potentiometer Board .............................................................................................................................. 40 Pickup Board ........................................................................................................................................... 41 Motor Board............................................................................................................................................ 42
Appendix C: Parts List ................................................................................................................................. 43
Table of Figures Figure 1: Combination of Two Harmonic Waveforms into One Waveform ................................................. 6
Figure 2: GuitarBot Motorized Sliding Bridge CAD Model[4] ....................................................................... 7

4
Figure 3: Crazy J's Guitar Player Solenoid Actuated Pitch Changing Mechanism[7] .................................... 7
Figure 4: Shibuya Labs Prototype for Pitch Changing in a Violin Playing Robot[8]....................................... 8
Figure 5: Violobot, Created by Canada Council for the Arts[8] .................................................................... 8
Figure 6: Pitch Changing Device in the Robofiddler[8] ................................................................................. 9
Figure 7: Tronical Tuning System on a Guitar[12]....................................................................................... 10
Figure 8: Gibson Robot Guitar Vibration Sensing Bridge (Left) and Autonomous Tuning Tail Piece (Right)
.................................................................................................................................................................... 11
Figure 9: US Patent 4,584,923, Tensioning Strings Via Motorized Screws in Guitar Body[14]................... 12
Figure 10: IR Sensor Uses Measured Angle of Light Path to Determine Range[18] ................................... 14
Figure 11: Force Sensing Strain Gauge Diagram[19]................................................................................... 14
Figure 12: Electronic Sitar Headset with an Accelerometer for Triggering Performance Events[21] ........ 15
Figure 13: Cyther V3 Complete Instrument CAD Model ............................................................................. 16
Figure 14: Cyther V3 Bridge Made from a Shaft and Radial Bearings ........................................................ 17
Figure 15: Motor and Worm Drive used to Change the Tension of the Strings for Autonomous Tuning .. 18
Figure 16: Tension Sensor used for Pitch Estimation ................................................................................. 19
Figure 17: Optical Pickup used on Cyther V3 .............................................................................................. 20
Figure 18: The Voltage across a Photoresistor in the Pickup as the String Below it vibrates ..................... 20
Figure 19: Flowchart for Frequency Measuring and Averaging .................................................................. 21
Figure 20: Simple Representation of Step One of the Curve Adjusting Function ....................................... 22
Figure 21: Simple Representation of Step Two of the Curve Adjusting Function....................................... 23
Figure 22: Simple Representation of Step Three of the Curve Adjusting Function .................................... 23
Figure 23: Noise from the String and Motor at Varying Distances ............................................................. 26
Figure 24: Graph of Pickup Value over Time When the String is plucked .................................................. 27
Table of Tables Table 1: Pros and Cons of Various Pitch Changing Devices[4], [7], [8] ......................................................... 9 Table 2: Pros and Cons of Various Autonomous Tuning Systems............................................................... 13 Table 3: Strings Chosen for Cyther V3 and the Frequency and MIDI Range of Each String ....................... 17 Table 4: Serial Commands for Cyther V3 Control ....................................................................................... 24 Table 5: Motor Current at Different Times during Tuning .......................................................................... 25 Table 6: Delay in Frequency Measurement at Various Frequencies .......................................................... 27 Table 7: Comparing the Frequency from a Waveform Generator to the Measurement of that Frequency by the Frequency Analysis Software on the Arduino .................................................................................. 28 Table 8: Comparing the Frequency of the String Determined by an FFT to the Measurement of the Frequency by the Frequency Analysis Software on the Arduino ................................................................ 28 Table 9: Tuning System Test Data ............................................................................................................... 29
Table of Equations Equation 1: Maximum Tension a String can be wound to by the Tuning System ...................................... 18 Equation 2: The Relationship between Frequency and Period[23] ............................................................ 21 Equation 3: The Relationship Between String Tension, Unit Weight, Length, and Frequency [1] ............. 22 Equation 4: The PFRC with constants A and B ............................................................................................ 22
5
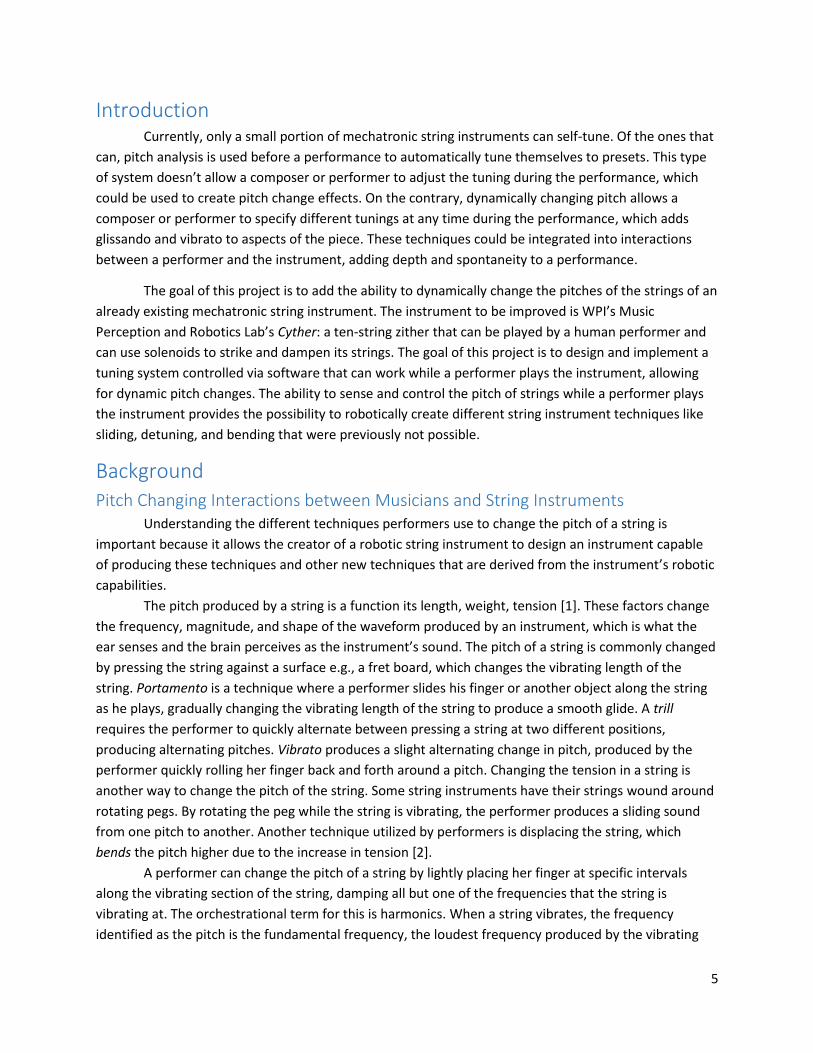
Introduction Currently, only a small portion of mechatronic string instruments can self-tune. Of the ones that
can, pitch analysis is used before a performance to automatically tune themselves to presets. This type
of system doesn’t allow a composer or performer to adjust the tuning during the performance, which
could be used to create pitch change effects. On the contrary, dynamically changing pitch allows a
composer or performer to specify different tunings at any time during the performance, which adds
glissando and vibrato to aspects of the piece. These techniques could be integrated into interactions
between a performer and the instrument, adding depth and spontaneity to a performance.
The goal of this project is to add the ability to dynamically change the pitches of the strings of an
already existing mechatronic string instrument. The instrument to be improved is WPI’s Music
Perception and Robotics Lab’s Cyther: a ten-string zither that can be played by a human performer and
can use solenoids to strike and dampen its strings. The goal of this project is to design and implement a
tuning system controlled via software that can work while a performer plays the instrument, allowing
for dynamic pitch changes. The ability to sense and control the pitch of strings while a performer plays
the instrument provides the possibility to robotically create different string instrument techniques like
sliding, detuning, and bending that were previously not possible.
Background Pitch Changing Interactions between Musicians and String Instruments Understanding the different techniques performers use to change the pitch of a string is
important because it allows the creator of a robotic string instrument to design an instrument capable
of producing these techniques and other new techniques that are derived from the instrument’s robotic
capabilities.
The pitch produced by a string is a function its length, weight, tension [1]. These factors change
the frequency, magnitude, and shape of the waveform produced by an instrument, which is what the
ear senses and the brain perceives as the instrument’s sound. The pitch of a string is commonly changed
by pressing the string against a surface e.g., a fret board, which changes the vibrating length of the
string. Portamento is a technique where a performer slides his finger or another object along the string
as he plays, gradually changing the vibrating length of the string to produce a smooth glide. A trill
requires the performer to quickly alternate between pressing a string at two different positions,
producing alternating pitches. Vibrato produces a slight alternating change in pitch, produced by the
performer quickly rolling her finger back and forth around a pitch. Changing the tension in a string is
another way to change the pitch of the string. Some string instruments have their strings wound around
rotating pegs. By rotating the peg while the string is vibrating, the performer produces a sliding sound
from one pitch to another. Another technique utilized by performers is displacing the string, which
bends the pitch higher due to the increase in tension [2].
A performer can change the pitch of a string by lightly placing her finger at specific intervals
along the vibrating section of the string, damping all but one of the frequencies that the string is
vibrating at. The orchestrational term for this is harmonics. When a string vibrates, the frequency
identified as the pitch is the fundamental frequency, the loudest frequency produced by the vibrating

6
string, but the string is also vibrating at other frequencies. Figure 1 is a graph showing how different
frequencies combine to form the waveform of the string.
Figure 1: Combination of Two Harmonic Waveforms into One Waveform
When a performer’s finger is placed on the string at the node of a non-fundamental partial’s
waveform, the fundamental frequency can be dampened, but the partial with zero amplitude will not be
dampened. This creates a lighter, softer sound at a different pitch than the freely vibrating string [3]. For
example, in Figure 1 the horizontal axis can be thought of as a string. Waves “x” and “y” are the
waveforms that make up wave “z”, which represents the vibration of the string. If a performer places his
finger at the node of wave “y”, wave “x” will be dampened and not heard, but wave “y”, which has an
amplitude of zero at the position the finger is placed, will still be heard.
Combination of Instruments and Machines One of the appeals of a robotic string instrument is the ability to control an acoustic instrument
with the speed and precision of a computer. A motor that spins a wheel of guitar picks is capable of
playing a string much faster than a performer [4], and computer clocks are capable of keeping time
much more precisely than a person. Mechatronic string instruments use a variety of actuators to alter
the sound of a string and use software to control the actuation [5].
Pitch Changing Devices: Prior Work
Some mechatronic string instruments can change the pitch of their strings autonomously. One
way to do this is to change the length of the vibrating sections of their strings by moving a motor-driven
bridge to different positions along the string [6].
Guitar Bot
GuitarBot is an example of a mechatronic instrument that uses a sliding bridge technique. As
shown in Figure 2, a motor spins a belt that is attached to a bridge which slides along the string,
changing the pitch [4]. The benefit of this design is that it’s possible to create bending and sliding effects
using the motion of the bridge, but the downside is that the amount of time to change from one pitch to
another increases the further away the pitches are from each other, so large, fast changes in pitch might
not be possible. Also, without a damper this instrument produces constant portamenti.

7
Figure 2: GuitarBot Motorized Sliding Bridge CAD Model[4]
Crazy J’s Guitar Player
Another way to mechanically change a string’s pitch is to position solenoids above every fret on
a fret board. The solenoids can push down on the string at the fret, which changes the length of the
string, causing the pitch of the string to change. Crazy J’s Guitar Player, shown in Figure 3, uses this
technique and places an array of “fingers” all activated by solenoids along the frets of a guitar. The
fingers press on the frets and change the pitch of the strings as a guitar player would [7]. The benefit of
this design is that reaching any pitch will be equally fast because each pitch has a dedicated solenoid.
This allows for large pitch intervals to be played just as fast as small intervals. Also, by using solenoids to
press the strings, a varying amount of force can be used to create harmonic effects. The downside of this
design is that no bending or sliding effects can be created, which limits the expressive capabilities of this
instrument. Also, using a solenoid for every pitch is expensive.
Figure 3: Crazy J's Guitar Player Solenoid Actuated Pitch Changing Mechanism[7]
Shibuya Labs Violin Playing Robot
A combination of sliding actuators along the strings and pressing the strings with solenoids has
been used by Shibuya Labs in their violin playing robot. They developed a system for pressing on violin
strings, shown in Figure 4, which slides four solenoids, one for each string of the violin, along the length
of the violin fingerboard. This technique is the most similar to how a performer naturally adjusts the
pitch by moving their hand along the finger board [8]. A benefit of this system is that it is capable of
performing pitch bends and slides by pressing a solenoid onto a string and then sliding along the string,
allowing for more expressive techniques. Using solenoids to press down on the strings allows the
instrument to play the harmonics of the strings, like a performer would. By mimicking how a person

8
plays the violin, the Shibuya Labs violin playing robot must move its “hand” to change pitch, which might
not allow for the instrument to play complex pieces with many large pitch changes that are too difficult
for a person to play.
Figure 4: Shibuya Labs Prototype for Pitch Changing in a Violin Playing Robot[8]
The Violobot
The Violobot created by the Canada Council for the Arts, shown in Figure 5, is another example
of pitch changing using a sliding finger. This mechatronic string instrument uses four different sliding
actuators, each with their own finger pressing on a string. A benefit of this system is that it allows for
pitches to slide in opposite directions, which the Shibuya Labs Violin can’t do because, every actuator
slides together [8]. This allows for the Violobot to play songs that a person could not play. On the other
hand, using only one actuator per string means that like the other instruments with sliding actuators, a
large change in pitch will take more time than if there were actuators for every note.
Figure 5: Violobot, Created by Canada Council for the Arts[8]

9
The Robofiddler
Another mechatronic violin with pitch changing capabilities is the Robofiddler. This mechatronic
string instrument, shown in Figure 6, has a series of bars that press down on the fingerboard with
varying force. A stepper motor winds up a string, which is attached above the bar. As the string is wound
up, the bar is lowered, when the string is unwound, the bar is raised up by a spring. The main benefit of
this system is that it can create different kinds of pitch changes using harmonics because it can press
down upon the strings with a variable force [8]. The downside of this system is that it cannot create
pitch bends or slides because none of the actuators move along the string.
Figure 6: Pitch Changing Device in the Robofiddler[8]
Pitch Changing Devices: Pro-Con Table
Table 1 shows the various pros and cons of each pitch changing device:
Bend &
Slide Effects
Simultaneous Pitch Changes
in Opposite Directions
Immediate
Pitch Transition
Press with
Varying Force
GuitarBot Yes Yes No No
Crazy J’s Guitar
Player
No Yes Yes Yes
SL Violin Playing
Robot
Yes No No Yes
Violobot Yes Yes No No
Robofiddler No No Yes Yes
Table 1: Pros and Cons of Various Pitch Changing Devices[4], [7], [8]
Autonomous Tuning Systems: Prior Work
The mechatronic string instruments mentioned above use various actuators to change the pitch
of their strings, but they don’t sense the pitches of the strings [4], [7], [8]. Autonomous-tuning string
instruments are capable of tuning themselves to specified pitches by sensing the current pitch of the
strings and adjusting until the desired pitch is reached [9]–[11]. The value of autonomous tuning is in the
ability for an instrument to sense and record its string’s pitches, which allows the instrument to keep
itself in tune with no input from the performer as well as change it’s tuning during a performance.

10
Tronical Tuning System
The Tronical tuning system automatically tunes the strings of a typical guitar (see Figure 7). The
system, which consists of a computer, six motorized tuning machines, and six buttons, is mounted
underneath the head of the guitar. When the user is ready to begin tuning the guitar, the system
instructs them to play certain strings via LEDs. As the user plays the strings they are told to play, the
processor senses and analyses the harmonic vibrations in the body of the guitar, which are used to
determine the frequency of the string. The system then rotates small motors attached to the tuning
machines of the guitar to adjust the tension of the strings until they are at the correct frequency. The
user can decide whether to tune every string at once, or individual strings via button commands [9].
Figure 7: Tronical Tuning System on a Guitar[12]
Gibson Robot Guitar
Unlike the Tronical tuning system, which is mounted externally to a guitar, the Gibson Robot
Guitar has autonomous tuning capabilities built in to the body of the instrument. The autonomous
tuning system is controlled by a push pull knob on the body of the guitar. The knob allows the user to
select from six configurable tuning modes. The knob also has LED’s to signify when a string is out of
tune, being tuned, or in tune during the entire tuning process. The Gibson Robot Guitar has a bridge on
the body of the guitar (see the left part of Figure 8) that can measure the vibration of each string. The
movement data from the bridge is analyzed by a processor in the body of the guitar to determine the
frequency of each string. The frequency information is sent to a processor in the head of the guitar
shown on the right of Figure 8. The processor in the head of the guitar is connected to small servo
motors which are connected to the tuning machines at the head of the guitar. The processor determines
how much to spin the servo motors to achieve the desired pitch [10].

11
Figure 8: Gibson Robot Guitar Vibration Sensing Bridge (Left) and Autonomous Tuning Tail Piece (Right)
AxCent Guitars
AxCent guitars offer an advantage over other autonomous tuning systems. AxCent guitars are
similar to Gibson Robot Guitars because they have autonomous tuning capability built into the guitar,
but AxCent guitars have a method of tuning during a performance and without needing to play the
strings. The user interfaces with this autonomous tuning system through twelve buttons and an LED
screen. The buttons are used to set tuning presets and control when the guitar changes its tuning mode.
The LED screen displays information about the state of the autonomous tuning system and what the
current tuning mode is. During construction the AxCent guitar is calibrated by collecting information on
the string’s pitches at different positions. The calibration process allows for the strings to be moved to
positions regardless of whether or not they are being played, and without the need to measure their
frequencies [11]. Although the details of the calibration process are publically unavailable, a patent
owned by Transperformance Inc., the corporation that owns AxCent guitars, describes a method of
tuning where each string has a transducer that converts its motion into an electrical signal. The signal is
then processed from the time domain to the frequency domain, where the pitch of the string can be
evaluated. This pitch can then be related to the position of the motor in the tuning actuator. To tune the
strings, the body of the guitar houses a mechanism that can slide the strings back and forth as needed
[13]. A patent referenced by Transperformance Inc. details a way of tuning from the body of a guitar
where each string is attached to a device that is mounted around a screw shown in Figure 9 [14]. When
a string is tightened, if there is friction at points where the string contacts the guitar, then the tension in
string will not be uniform, and the calibrated position of the string will not correspond to the desired
pitch. To address this issue the AxCent guitar uses bridges made from rollers that roll with the string as
it’s tightened or loosened, preventing friction caused by the string sliding over the bridge. The string is
pulled or pushed by the rotation of a motor with a screw for a shaft. This method can provide accurate
tuning at variable speed [11].

12
Figure 9: US Patent 4,584,923, Tensioning Strings Via Motorized Screws in Guitar Body[14]
Don Gilmore’s Self Tuning Piano
Don Gilmore has created a system for autonomously tuning a piano that’s installed at the
factory and only makes small adjustments to the pitch when necessary to keep the piano in tune. The
system doesn’t have a user interface as it is always active, and doesn’t require the user to select pitches
for the keys. The system senses the pitch by shining an LED at each string with a photoresistor placed
behind the string. The photoresistor outputs a voltage that corresponds to how much light from the LED
gets past the string. As the string vibrates, the voltage from the photoresistor changes slightly. This slight
change is amplified and using a Fourier transform, the signal is transformed to a set of frequencies,
which is analyzed to identify the fundamental frequency of the string. To adjust the pitch of the strings,
a small current is sent through the string. This current slightly heats up the string which causes it to
slightly expand and loosen. This changes the pitch very slightly, but very accurately. This system can tune
a piano string with an accuracy of +/- .001 cents [15].
Tuning with Tension
Most of the above methods analyze string vibration to measure pitch. Another option is to sense
the tension and use it to estimate the string’s pitch. WPI’s Music Perception and Robotics Lab
prototyped a method to do this by attaching a strain sensor to a beam. One end of the beam was
mounted to a solid body and the other end to the string. At the other end of the string was a tuning
machine controlled by a motor. As the tension in the string changed the beam would bend more or less,
the change in bend of the beam would change the strain on the strain sensor. This change in strain
caused the resistance of the sensor to change, which was mapped to the pitch of the string. This system
was able to tune a string with an accuracy of +/- 8 cents. The advantage of a system that can
autonomously tune a string by sensing the tension is that the strings don’t need to be excited to be
tuned. The strings can be tuned at any time, and the autonomous tuning system can remain a closed

13
loop system at all times, meaning the system is always sensing the pitch of the string. The limitation of
this system is that if any parameters of the string are changed, such as the length or the material, than
then system will no longer accurately predict the pitch of the string and the estimation function will
need to be changed [16].
Autonomous Tuning Systems: Pro-Con Table
Table 2 shows the various pros and cons of each pitch changing device:
User
Interface
Frequency
Detection
Frequency
Estimation using
Non-Frequency
Measurements
Tuning
Before
Performance
Sensing
During
Performance
User Can
Define Goal
Pitches
Reduces Friction
Between Strings
and Bridge
Tronical Yes Yes No Yes No Yes No
Gibson
Robot
Guitar
Yes Yes No Yes No Yes Yes
AxCent
Guitars
Yes Yes Yes Yes No Yes Yes
Self
Tuning
Piano
No Yes No Yes Yes No No
Tension No No Yes Yes Yes Yes Yes
Table 2: Pros and Cons of Various Autonomous Tuning Systems
Interactions between Musicians and Machines In addition to being able to sense and change the pitch of its strings, a robotic string instrument
should have a way for a performer to interact with the autonomous tuning system. The instrument
needs to respond to the performer in a way that allows for dynamic pitch changes without limiting the
performer’s expressive capabilities. Understanding the different ways that an individual can provide
information to a machine will help design a system that allows a musician to utilize the autonomous
pitch changing capabilities of the robot.
Mapping a gradual change in the resistance of a circuit to a parameter that needs to be
controlled is a common way to interface with a machine. A simple example of this is the use of a dial
connected to a potentiometer to control the gain of an amplifier. Potentiometers are continuous
variable resistors that can be placed in a number of housings such as dials, levers, and foot pedals.
Potentiometers are used in electronic synthesizers to map a performer’s input to pitch bends and the
amplitude of different oscillators in the synthesizer [17].
Proximity sensors are another way that the parameters of autonomous tuning mechanisms
could be mapped to the actions of a performer. These sensors send out short bursts of sound or light,
then record the amount of time it takes for the burst to be reflected back to the sensor or the angle of
reflection. Figure 10 shows the path that the infrared light from an IR distance sensor takes to measure
its distance away from an object.

14
Figure 10: IR Sensor Uses Measured Angle of Light Path to Determine Range[18]
This information is used to calculate the distance that an object is from the sensor. With
proximity sensors mounted on the instrument towards the performer, it is possible to map the
performer’s location relative to the instrument to the parameters of the autonomous tuning system. A
Theremin is an example of an instrument that uses the performer’s distance from it to control different
parameters. When playing a Theremin, one hand’s distance from an antenna controls the pitch, while
the other hand’s distance from a different antenna controls the volume [18].
Force sensors mounted to surfaces that an individual grips or steps on can be used to control
the parameters of a performance. A force sensor is a small fine wire mesh. When a force is applied to
the mesh, its resistance changes. This change in resistance can be mapped to the force applied to the
sensor [16]. Figure 11 is an image of a force sensor, called a strain gauge. The grid is the mesh of wires
that changes resistance as it bends.
Figure 11: Force Sensing Strain Gauge Diagram[19]
Accelerometers and Gyroscopes are sensors that can measure linear and angular acceleration.
These devices can be mounted to a performer or object and provide data about the performer or
object’s location. Detected movements can then be mapped to different aspects of the performance
[20]. For example, the Electronic Sitar Controller created by Ajay Kapur uses an accelerometer inside of a
headset, shown in Figure 12 to allow a performer to trigger different parts of the performance via head
movements [21].

15
Figure 12: Electronic Sitar Headset with an Accelerometer for Triggering Performance Events[21]
Limitations of Prior Work Mechatronic string instruments with pitch changing capabilities do so by changing the vibrating
length of their strings. Whether they do this by pressing the string into a fret board or by sliding a rod
along the length of the string, changing the vibrating section of the string’s length limits the playability
of the instrument by a performer. Most of these mechatronic instruments are played entirely
autonomously. For an instrument that is meant to be played by a person and a machine simultaneously,
constantly changing the vibrating length of the string is limiting to the human performer.
Of the prior autonomous tuning systems, none of them are designed to work constantly
throughout a performance. Most use only frequency analysis to tune strings before a performance and
the only way to tune during a performance is via dead reckoning. These limitations prevent the sliding
pitches from being used as a part of the piece. A system that could tune at all times can use bending and
sliding pitches through the piece to expand the expressive capabilities of the instrument.
Design Specifications and Requirements The robotic string instrument created during this project should be able to sense and control the
pitch of its strings, and produce portamenti, sliding, and pitch bending effects at all times during a
performance. Current autonomous tuning systems rely on frequency analysis and can only determine
the pitch of a vibrating string. Therefore they cannot function at all times during a performance, which
limits the interactivity of the instrument. In order to sense and control the pitch at all times during a
performance, a new method of autonomous tuning must be designed.
Hardware The entire instrument must be able to fit within a 36” x 12” x 4” carrying case to keep it stable
during transportation. The sensors for determining pitch and actuators for changing pitch must be less
than $30.00 per string because of budget constraints. Any custom circuitry required to control the
instrument should be designed and built on a PCB board. A microprocessor must be selected capable of
controlling the entire system. A power supply capable of simultaneously sensing and tuning every string
on the instrument must be identified.
The ten strings should be selected so that each string’s range is from the pitch the string makes
at seven pounds of tension to the pitch the string makes at fifteen pounds of tension. Each string’s
highest pitch should be the middle pitch of the next highest string. This overlapping range allows for
closer harmonies during performances.

16
Tuning System The tuning system created for this instrument must be able to sense the pitch of each string in a
way that allows the instrument to create various pitch changing techniques like portamento and vibrato
at all times during a performance. The actuators of this tuning system should be able to adjust the pitch
of any string by a semitone in 100 ms or less. This 100 ms value was chosen because it is generally the
smallest rhythmic interval found in human musical performance [22]. The tuning system should be able
to tune to a desired pitch with an accuracy of +/- 3.6 Hz because that is the common just noticeable
difference [23].
The tuning system must be able to process the signals from the sensors to determine the pitch
of the strings. The software should have a form of closed loop control to keep every string at a desired
pitch. The software should adjust the pitch estimation function over time to compensate for small
changes to the instrument that alter the strings’ pitches. The software must be able to interpret signals
from a computer and from a controller used by the performer that determine the timing, magnitude,
direction, and speed of the dynamic pitch changes.
Design Structural Design
Figure 13: Cyther V3 Complete Instrument CAD Model
The structural design of Cyther V3, shown in Figure 13, is based on the need for the instrument
to be modular and portable. The instrument’s length, width, and height are such that it fits snugly inside
the 36” x 12” x 4” carrying case so that it is not damaged during transportation. The aluminum T-slotted
aluminum channel provides a sturdy frame which two separate sheets of acrylic are mounted to. The
two acrylic sheets each span half the length of the instrument and can be replaced independently of
each other. All the pitch detection and estimation hardware is mounted to one acrylic sheet, and all the
pitch changing hardware is mounted to the other sheet. If at any point a quick fix needs to be applied,
one of the acrylic sheets can be replaced with an identical acrylic sheet with duplicate hardware
mounted to it. The replacement hardware can easily be plugged into the circuit boards because the
wiring uses connectors. This modular design addresses potential unforeseen damage to the instrument.
In addition to being modular and portable, Cyther V3 is designed to allow the strings to move as
freely as possible during a performance. Friction between the strings and the bridge can create non-
uniform tension throughout the individual strings [24] and add inefficiency to the tuning system

17
resulting in slower, less precise pitch changes. To reduce the friction between the strings and bridge, the
bridge, shown in Figure 14, is made from radial bearings mounted around a shaft.
Figure 14: Cyther V3 Bridge Made from a Shaft and Radial Bearings
The bearings rotate around the shaft as the string is adjusted, which allows for the tension
throughout the string to be constant.
String Selection Table 3 shows the ten strings selected for the instrument. The strings were chosen from the
D’Addario string catalog [1]. Each string was selected so that its highest pitch was the next highest
string’s middle pitch. Each strings range is from the pitch it makes at 7 lbs. of tension to the pitch it
makes at 15 lbs. of tension.
String
#
D'Addario
Item #
Frequency at
7 lbs. (Hz)
Frequency at
15 lbs. (Hz)
MIDI Note at
7 lbs.
MIDI Note at
15 lbs.
Range
1 NW048 49.16522824 71.97052473 31.05848066 37.6556947 G2 - D3
2 NW039 59.84292063 87.60106591 34.46098763 41.05820167 A#2 - F3
3 NW032 71.90465087 105.2576311 37.63984164 44.23705568 D3 - G#3
4 PL024 88.5397845 129.6089732 41.24273092 47.83994496 F3 - C4
5 PL020 106.2484075 155.531743 44.39925233 50.99646637 G#3 - D#4
6 PL017 124.9988343 182.9795572 47.2129334 53.81014744 B3 - F#4
7 PL014 151.7815167 222.1853898 50.57391111 57.17112515 D#4 - A4
8 PL0115 184.7693741 270.4746685 53.97866548 60.57587952 F#4 - C#5
9 PL0095 223.6955788 327.4567976 57.28839863 63.88561267 A4 - E5
10 PL008 265.5985394 388.7964509 60.26092427 66.85813831 C5 - G5
Table 3: Strings Chosen for Cyther V3 and the Frequency and MIDI Range of Each String
Tuning System Actuation The pitches of Cyther V3’s strings are changed by controlling the tension in each string. The
motor driven tuning machine, shown in Figure 15, changes the tension in a string by winding the string
around a guitar tuning key modified to be mounted to, and spun by, a motor controlled by an Arduino.
The tuning machine contains a worm drive with a ratio of 16:1. This increases the torque used to wind
the string and prevents the tension in the string from applying any forces to the motor, which prevents
the motor from having to constantly be powered, stabilizing the frequency of the string and increasing
the lifespan of the instrument.

18
Figure 15: Motor and Worm Drive used to Change the Tension of the Strings for Autonomous Tuning
The strings selected for the instrument can safely handle 17 lbs. of tension. The motors used to
wind the tuning keys should have a stall torque equal to four times the maximum tension to stay at
optimal power levels. The Pololu 100:1 Micro Metal Gearmotor was chosen for its size and 30 oz. in. stall
torque. These values can be used in Equation 1 to determine the maximum tension that the tuning
system can create in a string. The tuning system used by Cyther V3 can theoretically create a maximum
of 120 lbs. of tension in a string. This value is much greater than the tension required for producing the
desired pitches but this extra torque helps offset friction, gear train inefficiencies, and unpredictable
misalignment of parts due to manufacturing inconsistencies, which reduce the amount of force the
motor can transfer to the string. This ensures that the motor won’t damage itself while trying to tune
any of the strings.
𝑀𝑎𝑥𝑖𝑚𝑢𝑚 𝑆𝑡𝑟𝑖𝑛𝑔 𝑇𝑒𝑛𝑠𝑖𝑜𝑛 = 𝑀𝑜𝑡𝑜𝑟 𝑆𝑡𝑎𝑙𝑙 𝑇𝑜𝑟𝑞𝑢𝑒 × 𝑊𝑜𝑟𝑚 𝐺𝑒𝑎𝑟 𝑅𝑎𝑡𝑖𝑜
𝐷𝑖𝑠𝑡𝑎𝑛𝑐𝑒 𝑓𝑟𝑜𝑚 𝑆𝑡𝑟𝑖𝑛𝑔 𝑡𝑜 𝐴𝑥𝑖𝑠 𝑜𝑓 𝑅𝑜𝑡𝑎𝑡𝑖𝑜𝑛
Equation 1: Maximum Tension a String can be wound to by the Tuning System
Tension Sensing Unlike other robotic string instruments, Cyther V3 can estimate the pitch of a string without
needing to sense its frequency. The frequency of a vibrating string is a factor of its length, weight, and
the tension [1]. When the length and weight are known constants, the frequency can be determined by
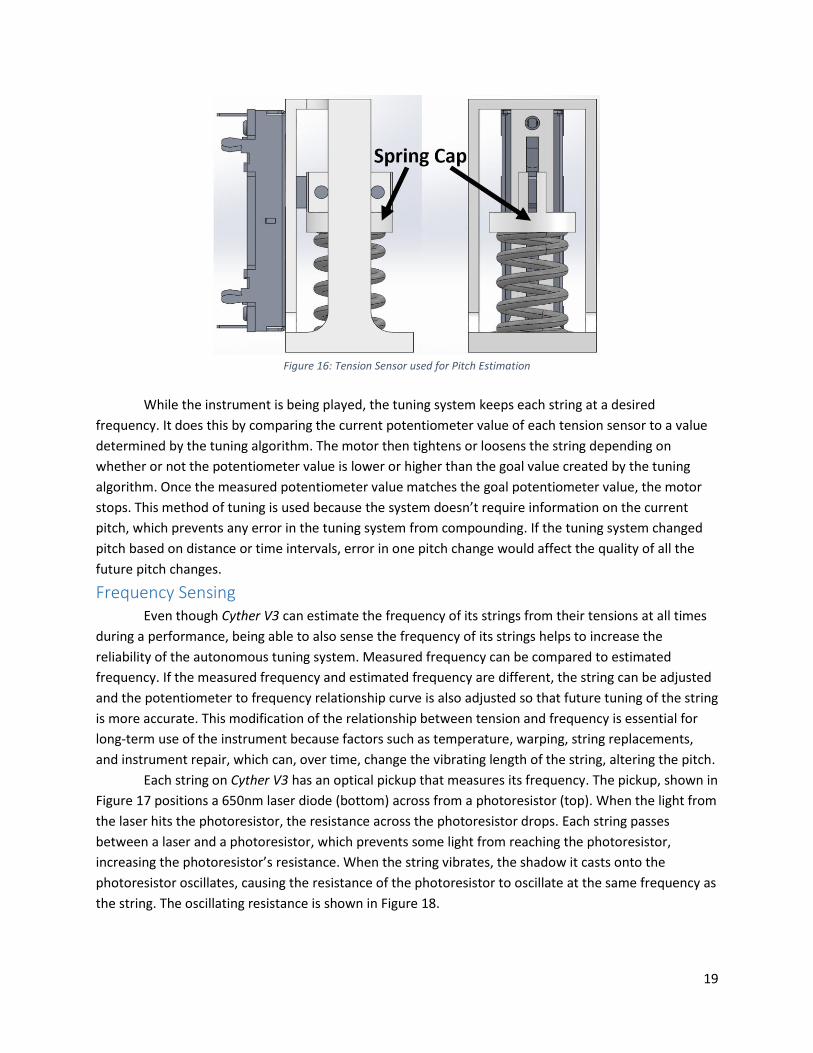
only sensing the tension in the string. The tension sensor shown in Figure 16 measures tension through
a potentiometer coupled to a spring. The ball end of the string is pressed against the spring cap. The rest
of the string runs through a small hole in the cap, through the middle of the spring and out the bottom
of the tension sensor, where another hole in the tension sensor leads the string to the bridge on the top
of the instrument. As the string is tightened or loosened, the amount of force applied by the ball end of
the string to the spring cap changes, which changes the amount the spring is compressed. As the spring
compresses, the attached wiper on the potentiometer moves. The voltage across the potentiometer can
be measured and used by the tuning algorithm to keep each string in tune. The structure of the tension
sensor does not contact the wiper of the potentiometer or the side of the spring in order to create as
little contact as possible between moving parts. If the cap makes contact with any stationary parts then
it might stick and will not accurately reflect the force on the spring. This leads to error in the pitch
estimation curve.
19
Figure 16: Tension Sensor used for Pitch Estimation
While the instrument is being played, the tuning system keeps each string at a desired
frequency. It does this by comparing the current potentiometer value of each tension sensor to a value
determined by the tuning algorithm. The motor then tightens or loosens the string depending on
whether or not the potentiometer value is lower or higher than the goal value created by the tuning
algorithm. Once the measured potentiometer value matches the goal potentiometer value, the motor
stops. This method of tuning is used because the system doesn’t require information on the current
pitch, which prevents any error in the tuning system from compounding. If the tuning system changed
pitch based on distance or time intervals, error in one pitch change would affect the quality of all the
future pitch changes.
Frequency Sensing Even though Cyther V3 can estimate the frequency of its strings from their tensions at all times
during a performance, being able to also sense the frequency of its strings helps to increase the
reliability of the autonomous tuning system. Measured frequency can be compared to estimated
frequency. If the measured frequency and estimated frequency are different, the string can be adjusted
and the potentiometer to frequency relationship curve is also adjusted so that future tuning of the string
is more accurate. This modification of the relationship between tension and frequency is essential for
long-term use of the instrument because factors such as temperature, warping, string replacements,
and instrument repair, which can, over time, change the vibrating length of the string, altering the pitch.
Each string on Cyther V3 has an optical pickup that measures its frequency. The pickup, shown in
Figure 17 positions a 650nm laser diode (bottom) across from a photoresistor (top). When the light from
the laser hits the photoresistor, the resistance across the photoresistor drops. Each string passes
between a laser and a photoresistor, which prevents some light from reaching the photoresistor,
increasing the photoresistor’s resistance. When the string vibrates, the shadow it casts onto the
photoresistor oscillates, causing the resistance of the photoresistor to oscillate at the same frequency as
the string. The oscillating resistance is shown in Figure 18.

20
Figure 17: Optical Pickup used on Cyther V3
Figure 18: The Voltage across a Photoresistor in the Pickup as the String Below it vibrates
In order to ensure that the frequency measurements are accurate, the Arduino uses a series of
checks and averages, shown in Figure 19.

21
Figure 19: Flowchart for Frequency Measuring and Averaging
The Arduino polls the optical pickups every main loop iteration checking for a vibration. When a
rising edge is sensed, the Arduino starts a timer that runs until the next rising edge is sensed. At this
point the timer has measured the period of the wave. Using Equation 2, the frequency is calculated, and
then the Arduino determines whether or not that frequency is within the bounds of what the string is
capable of playing. If not, the frequency is ignored and the process is repeated. If the frequency is within
the range of possible frequencies the string can play, it’s added to an array of the previous ten
frequency measurements. When this array is full, the Arduino checks if all the values are within a range
of each other to account for errors in the frequency measurement due to the complex nature of the
string’s vibration. If not, the Arduino waits for another frequency measurement, then replaces the
oldest measurement in the array with the new one and checks for consistency again. Once the ten most
recent frequency measurements are within reasonable error of each other, all the values in the array are
averaged and the average frequency is passed to a function that updates the curve relating
potentiometer value to string frequency.
𝑓𝑟𝑒𝑞𝑢𝑒𝑛𝑐𝑦 = 1
𝑝𝑒𝑟𝑖𝑜𝑑
Equation 2: The Relationship between Frequency and Period[25]

22
Relating Potentiometer Value to String Frequency In order to tune the strings to desired pitches, each string must have a potentiometer to
frequency relationship curve (PFRC). This equation can be determined by combining Equation 3 and
Hooke’s Law, which states that there is a linear relationship between the length of a spring and the force
applied to it [26]. The unit weight and length of each string will remain constant, and the
potentiometers used in the tension sensors change value linearly with respect to distance traveled. This
information can be used to simplify the PFRC. Equation 4 shows the general form of the PFRC, a linear
relationship between the potentiometer value and the square of the frequency measurement.
𝑆𝑡𝑟𝑖𝑛𝑔 𝑇𝑒𝑛𝑠𝑖𝑜𝑛 = 𝑈𝑛𝑖𝑡 𝑊𝑒𝑖𝑔ℎ𝑡 × (2 × 𝐿𝑒𝑛𝑔𝑡ℎ × 𝐹𝑟𝑒𝑞𝑢𝑒𝑛𝑐𝑦)2 Equation 3: The Relationship Between String Tension, Unit Weight, Length, and Frequency [1]
𝑃𝑜𝑡𝑒𝑛𝑡𝑖𝑜𝑚𝑒𝑡𝑒𝑟 𝑉𝑎𝑙𝑢𝑒 = 𝐴 × 𝐹𝑟𝑒𝑞𝑢𝑒𝑛𝑐𝑦2 + 𝐵 Equation 4: The PFRC with constants A and B
The constants of the PFRC are determined experimentally, once for each string, by measuring
the frequency and potentiometer value at three different frequencies that span the range of the string.
Linear regression is used to find a best fit curve, then A and B are set to the constants of the best fit
curve.
The Arduino must be able to adjust the PFRC as more data is collected and as the instrument
changes over time. To adjust the PFRC, a curve-adjusting algorithm (CAA) is used. Whenever the
frequency of a string is measured, the CAA updates the PFRC. The CAA begins by creating a set of points
along the current PFRC that are evenly distributed within the playable range of the single string. For
example, if the curve adjusting function creates a set of five points, the experimentally determined
constants are A = 0.002667 and B = -6.667, and the playable range of the single string is from a
frequency of 100 to a frequency of 200, Figure 20 shows the set of five points that would be created.
Figure 20: Simple Representation of Step One of the Curve Adjusting Function
20
30
40
50
60
70
80
90
100
10000 15000 20000 25000 30000 35000 40000
Po
ten
tio
met
er V
alu
e
Frequency Squared

23
Immediately after the set of points has been created, the CAA adds another point to the set.
This new point is created by squaring the frequency measurement given to the CAA and measuring the
value of the potentiometer in the tension sensor. This added point is responsible for the CAA’s change
to the PFRC. Continuing from the example above, if the frequency measurement provided to the CAA
was 170, and the potentiometer value of the tension sensor was 55, then the new set would be the set
shown in Figure 21, where the blue dot represents the new data point.
Figure 21: Simple Representation of Step Two of the Curve Adjusting Function
The final step of the CAA is to use linear regression to create a new best fit curve from the entire
set of points, and then replace the PFRC constants with the constants from the new best fit curve. This
new line, shown in Figure 22 will be the line from which the set of points is created the next time the
CAA is called. Changing the number of points created in step one of the CAA will change how
aggressively the PFRC will accommodate new data. With fewer points the PFRC will quickly move
towards new data, and with more points the PFRC will make much smaller adjustments toward new
data.
Figure 22: Simple Representation of Step Three of the Curve Adjusting Function
20
30
40
50
60
70
80
90
100
10000 15000 20000 25000 30000 35000 40000
Po
ten
tio
met
er V
alu
e
Frequency Squared
20
30
40
50
60
70
80
90
100
10000 15000 20000 25000 30000 35000 40000
Po
ten
tio
met
er V
alu
e
Frequency Squared

24
Software Interface The pitch of the strings and the activation of the tuning system are controlled with serial
commands to the Arduino. This allows a composer or performer to give both predetermined and
impromptu commands to the instrument. Table 4 shows available input commands.
Command Syntax Inputs Example
Frequency Analysis
Toggle
F - F
String Tuning Toggle T - T
Set Frequency ![int],[float]! An Integer that represents the string
to tune. A floating point number
that represents the goal frequency.
!3,234.32!
Set Constant “A” A[float]A A floating point number that
represents the value of A.
A0.0012A
Set Constant “B” B[float]B A floating point number that
represents the value of B.
B214.15B
End Performance S - S
Table 4: Serial Commands for Cyther V3 Control
The frequency analysis toggle command controls whether or not the Arduino is polling the
pickups for a frequency. If this is off, there will be no adjustments to the PFRC. This command can be
used to prevent the CAA from making dramatic and inaccurate changes to the PFRC when the performer
is changing the vibrating length of a string by hand. The string tuning toggle command controls whether
or not Cyther V3 is adjusting the tension in each string. If this is off, none of the strings will change pitch.
This command can be used to stop the motors from making small back and forth adjustments when the
tension sensor senses small changes in tension when the string is being plucked. The set frequency
command can be used to adjust the desired string to the desired frequency. This can be used during
performances to create bending and sliding effects, as well as change the tuning of the instrument. The
set A and set B commands can be used to change the constants of the PFRC. The ability to set the
constants of the PFRC is useful when replacing strings or when the instrument has been played for so
long that the original constants that were determined experimentally are no longer accurate. Even
though the CAA will change the PFRC while the instrument is played, being able to manually adjust the
constants can help accurately tune from the beginning of the performance. The end performance
command will stop Cyther V3 from being capable of tuning or sensing until it has been reset and display
the current constants of the PFRC. This should be used at the end of a performance or when
disassembling Cyther V3 to prevent accidents.
Circuit Board Design Cyther V3 has ten identical one string tuning systems that each require a connection to a 6V
power supply and eleven connections to the Arduino. In order to use a common power supply, and to
lessen the number of connections running from the instrument to the Arduino, three circuit boards
were designed. All the circuit board schematics can be found in Appendix B: Circuit Board Schematics.

25
Potentiometer Board
A circuit board was designed for the potentiometers on Cyther V3. This board allows every
potentiometer to use the same 5V supply from the Arduino and for the Arduino to read each
potentiometer from the same analog pin. The circuit board wires all the potentiometers in parallel with
a 5V supply and connects each of their outputs to a 16:1 analog demultiplexer. The Arduino uses four
digital pins to determine which potentiometer value is being read and one common analog input for all
the potentiometers. The ability to only use one analog input for all the potentiometers was necessary
because the Arduino didn’t have enough analog inputs for each potentiometer and each pickup to get
its own pin.
Pickup Board
A circuit board was designed for the pickups on Cyther V3. This board contains a voltage divider
for each photoresistor, which allows the Arduino to measure the change in resistance across the
photoresistor as the string vibrates. The board also allows every laser diode and voltage divider to use
the same 5V supply from the Arduino. A resistor of equal value to the photoresistor with no shadow cast
on it from a string was used in each voltage divider so that when a shadow was cast onto the
photoresistor from the string, the largest possible change in voltage would be measured. This increases
the resolution of the pickups, which makes it easier to determine when the wave is at a rising edge. Each
pickup has its own analog input on the Arduino so that the Arduino can easily and quickly change which
string’s frequency is being measured.
Motor Board
A circuit board was designed for the motors that tune the strings. The circuit board allowed each
motor to be powered from the same 6V 10A power supply, while having their speed and direction
controlled by the Arduino. Five dual H-bridge chips allow each motor to be controlled by the Arduino
with three pins while receiving power from the 6V 10A supply. Two of the pins determine the direction
the motor spins, the other pin enables the motor to spin. By using PWM output pins on the Arduino for
the enable pin on the H-bridge, the motors can spin at variable speeds. The circuit board is powered by a
6V 10A supply, which is enough for each motor to spin simultaneously and to power the H-bridges. A 5V
regulator is used on the board to step down the 6V signal from the power supply in order to power the
H-bridge chips with 5V.
Results Hardware The motors that were used in the Cyther V3 were designed to have extra torque to make up for
manufacturing inconsistencies and so they could operate at lower power and therefore last longer.
While tuning from minimum to maximum string tension, the motors were able to tune the strings to
their maximum tension without stalling. The motors used more current when tuning the strings up than
when tuning them down. Table 5 shows the current the motors used at different times compared to
stall current.
Stall Current Stop Current Tune Up Current Tune Down Current
843 mA 9 mA 384 mA 253 mA
Table 5: Motor Current at Different Times during Tuning

26
While Cyther V3 was being played, the motors created acoustic noise that interfered with the
ability to hear the string. Figure 23 shows how the noise level of the motor compares to the noise of the
string when the motor is holding the string steady and when the motor is tuning the string and spinning.
Once the listener is more than two feet away from the instrument, the spinning motor drowns out the
sound from the string. This isn’t a significant problem because the strings are meant to be amplified with
an electromagnetic pickup.
Figure 23: Noise from the String and Motor at Varying Distances
During the manufacturing process, errors and lack of project time prohibited completion of the
PCB’s. As a result, a breadboard was used to test the system on one string. The breadboard used the
same equipment that the circuit boards were designed to use and was wired in the same way. The
circuits worked as expected: the signals from the potentiometer and pickup were processed by the
tuning software without any pre-filtering of the signal and the Motor circuit allowed the Arduino to
control the motor while getting power from the 6V power supply.
Unexpectedly, the laser diodes used in the pickups weren’t equally bright. As a result, each
photoresistor had a different resistance when the laser was shining on it. This problem was solved by
measuring each photoresistor’s resistance when the laser was on and picking a resistor equal to the
measured resistance (instead of using one resistor value for every pickup).
Tuning System The frequency analysis capabilities of the instrument were tested by observing the pickup’s
waveform and comparing the frequency measured by Cyther V3 to a series of known frequencies. A
graph of the signal from the optical pickup over time as the string is plucked, shown in Figure 24, was
used to analyze the quality of the pickup. The graph shows that there is a period of around 1.5 seconds
where the amplitude of the string’s oscillation is inconsistent before settling into a decaying oscillation.
45
50
55
60
65
70
0 0.5 1 1.5 2 2.5 3 3.5 4 4.5
No
ise
(dB
A)
Distance (ft.)
Motor Noise: Tuning Motor Noise: Holding String Noise: Moderate Pluck

27
Figure 24: Graph of Pickup Value over Time When the String is plucked
When the Arduino senses the pluck, there is a delay before it determines the frequency of the
string. Table 6 shows the amount of time it took the Arduino to determine the frequency of the string at
different frequencies. The average amount of time when determining the frequency of a string that was
plucked was 183.8 ms. There were some cases when the string was plucked very hard that it took the
software around a second to determine the frequency. By using solenoids to pluck the strings the
impulses will be more uniform and predictable, which will help shorten the amount of time it takes to
analyze the frequency.
Frequency (Hz) Frequency Measurement Delay (ms)
167.51 239
187.63 118
198.43 112
212.77 349
221.74 101
Table 6: Delay in Frequency Measurement at Various Frequencies
The accuracy of the frequency analysis was measured, first by using a waveform generator to
send a signal directly into the Arduino, replacing the pickup signal. By eliminating the pickup, this
experiment was used to test the quality of just the software responsible for the frequency analysis.
Table 7 shows the frequency determined by Cyther V3’s software when a sine wave with a magnitude of
4V and offset of 2.5V was measured at various frequencies. Based on this data the Arduino can measure
the frequency of a wave with an error of < 0.0037% which is well within the error that the human ear
can perceive.
Frequency From
Waveform Generator (Hz)
Frequency Determined
by Arduino (Hz)
Error (Hz) % Error
90 90.27 0.27 0.003
130 129.89 -0.11 0.000846154
170 171.31 1.31 0.007705882
210 210.14 0.14 0.000666667
250 250 0 0

28
290 289.22 -0.78 0.002689655
330 331.25 1.25 0.003787879
370 370.88 0.88 0.002378378
410 410.26 0.26 0.000634146
Table 7: Comparing the Frequency from a Waveform Generator to the Measurement of that Frequency by the Frequency
Analysis Software on the Arduino
Once it was determined that the software was capable of accurate measurements, another
experiment comparing FFT analysis of an audio recording of a string to Cyther V3’s software’s analysis of
the pickup signal was performed. This experiment was used to determine how reliably Cyther V3 can
measure the frequency of a string during a performance. Table 8 shows the measured frequency of the
string as determined by an FFT compared to the frequency measured by the Arduino. There is a
maximum error of .017%, which is higher than the previous test. A probable reason for the higher error
is that the vibration of the string is not a perfect sine wave and it’s more difficult to measure the rising
edges of a complex waveform. These results are promising because the frequency was never off by
more than 3.6 Hz, which is the smallest change that the average human ear can perceive [23].
Frequency From
FFT Software (Hz)
Frequency Determined
by Arduino (Hz)
Error (Hz) % Error
172 169.21 -2.79 0.01622093
182 178.9 -3.1 0.017032967
194 193.44 -0.56 0.002886598
202 202.45 0.45 0.002227723
211 210.11 -0.89 0.004218009
224 220.77 -3.23 0.014419643
Table 8: Comparing the Frequency of the String Determined by an FFT to the Measurement of the Frequency by the Frequency
Analysis Software on the Arduino
To test the capabilities of the tuning system a series of pitch changes were analyzed to
determine the speed and accuracy of the tuning mechanism. Table 9 shows these tests.
Music
Interval
Frequency
Change
(Hz)
Goal
Frequency
(Hz)
Measured Goal
Frequency (Hz)
Measured Goal
Frequency
Error (Hz)
Measured Goal
Frequency %
Error
Tuning
Speed (ms /
semitone)
E3 - F3 9.8 174.61 174.53 -0.08 0 247
F3 - E3 -9.8 164.81 161.82 -2.99 -0.018 247
E3 - F#3 21.19 185 191.22 6.22 0.034 196
F#3 - E3 -20.19 164.81 153.63 -11.18 -0.068 151.5
E3 - G#3 42.84 207.65 207.06 -0.59 -0.003 147
G#3 - E3 -42.84 164.81 164.48 -0.33 -0.002 112.5
A3 - G#3 -12.35 207.65 205.36 -2.29 -0.011 191
G#3 - A3 12.35 220 221.74 1.74 0.008 248
A3 - G3 -24 196 202.45 6.45 0.033 143
29
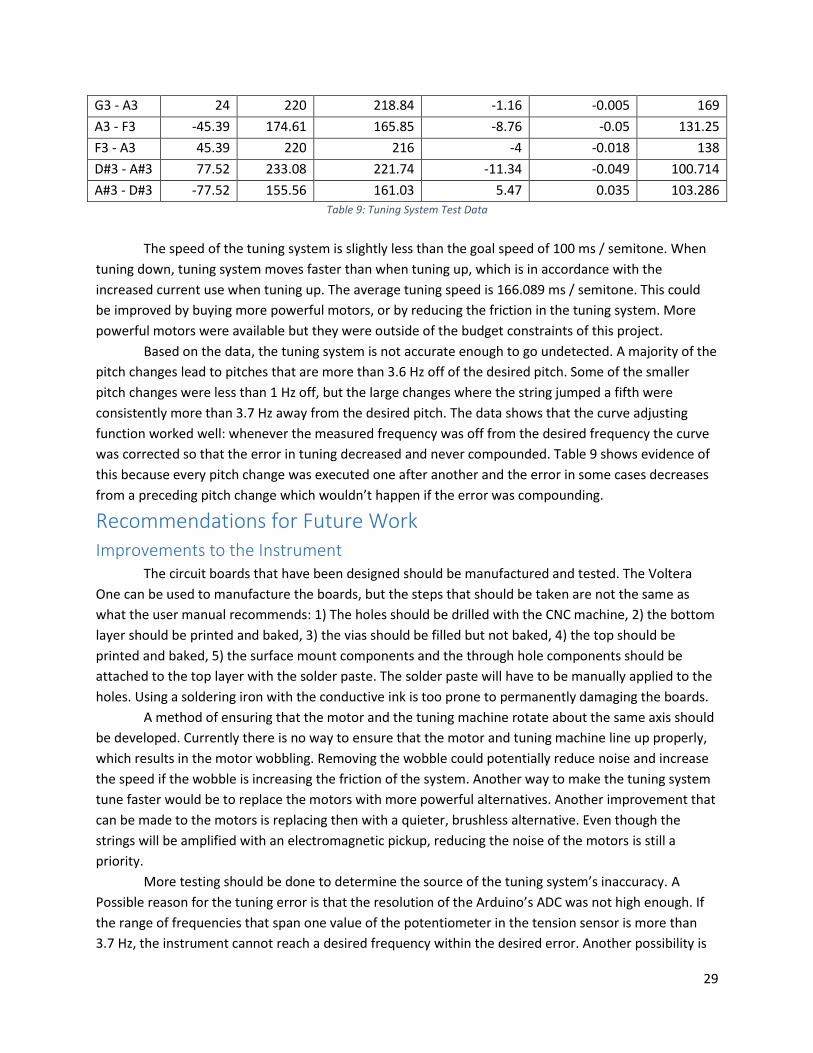
G3 - A3 24 220 218.84 -1.16 -0.005 169
A3 - F3 -45.39 174.61 165.85 -8.76 -0.05 131.25
F3 - A3 45.39 220 216 -4 -0.018 138
D#3 - A#3 77.52 233.08 221.74 -11.34 -0.049 100.714
A#3 - D#3 -77.52 155.56 161.03 5.47 0.035 103.286
Table 9: Tuning System Test Data
The speed of the tuning system is slightly less than the goal speed of 100 ms / semitone. When
tuning down, tuning system moves faster than when tuning up, which is in accordance with the
increased current use when tuning up. The average tuning speed is 166.089 ms / semitone. This could
be improved by buying more powerful motors, or by reducing the friction in the tuning system. More
powerful motors were available but they were outside of the budget constraints of this project.
Based on the data, the tuning system is not accurate enough to go undetected. A majority of the
pitch changes lead to pitches that are more than 3.6 Hz off of the desired pitch. Some of the smaller
pitch changes were less than 1 Hz off, but the large changes where the string jumped a fifth were
consistently more than 3.7 Hz away from the desired pitch. The data shows that the curve adjusting
function worked well: whenever the measured frequency was off from the desired frequency the curve
was corrected so that the error in tuning decreased and never compounded. Table 9 shows evidence of
this because every pitch change was executed one after another and the error in some cases decreases
from a preceding pitch change which wouldn’t happen if the error was compounding.
Recommendations for Future Work Improvements to the Instrument The circuit boards that have been designed should be manufactured and tested. The Voltera
One can be used to manufacture the boards, but the steps that should be taken are not the same as
what the user manual recommends: 1) The holes should be drilled with the CNC machine, 2) the bottom
layer should be printed and baked, 3) the vias should be filled but not baked, 4) the top should be
printed and baked, 5) the surface mount components and the through hole components should be
attached to the top layer with the solder paste. The solder paste will have to be manually applied to the
holes. Using a soldering iron with the conductive ink is too prone to permanently damaging the boards.
A method of ensuring that the motor and the tuning machine rotate about the same axis should
be developed. Currently there is no way to ensure that the motor and tuning machine line up properly,
which results in the motor wobbling. Removing the wobble could potentially reduce noise and increase
the speed if the wobble is increasing the friction of the system. Another way to make the tuning system
tune faster would be to replace the motors with more powerful alternatives. Another improvement that
can be made to the motors is replacing then with a quieter, brushless alternative. Even though the
strings will be amplified with an electromagnetic pickup, reducing the noise of the motors is still a
priority.
More testing should be done to determine the source of the tuning system’s inaccuracy. A
Possible reason for the tuning error is that the resolution of the Arduino’s ADC was not high enough. If
the range of frequencies that span one value of the potentiometer in the tension sensor is more than
3.7 Hz, the instrument cannot reach a desired frequency within the desired error. Another possibility is

30
that the PFRC is nonlinear, and by using a linear relationship to determine the desired potentiometer
value, the desired potentiometer value does not correspond to the desired frequency. More
experimentation should be done to determine the cause of the tuning inaccuracies.
If the source of the error is the potentiometer resolution then a smaller potentiometer, or
higher resolution ADC should be used. If the source of the inaccuracy is the nonlinearity of the best fit
curve, then a different kind of curve should be generated. Another way to attempt to fix the tuning
system is to add a section to the best fit curve code which associates a weight with each new frequency
measurement that corresponds to how accurate that measurement is. With this information, more
accurate frequency measurements can have more of an effect on the best fit curve, while outliers won’t
ruin an accurate curve.
Additions to the Instrument There are two main additions that Cyther V3 is designed to accommodate. The first of these
additions is a high-level user interface. This interface should allow a performer or composer to specify a
series of tuning speeds, directions, and intervals that trigger at specific times in sync with the solenoids.
The user interface should allow a composer to load an entire piece of music to be played by Cyther V3.
The serial commands that Cyther V3 uses now can be used by the interface to achieve the composer’s or
performer’s desired effects.
The second recommended addition is the creation of a physical tool that can be used by a
performer to dynamically change the pitch of the strings during a performance without needing to know
the desired pitch changes ahead of time. One way this could be achieved is to create a mallet with an
accelerometer inside it and a button on its handle. When the performer presses the button, the
movement of the mallet could control the most recently played string’s pitch.
Conclusion The goal of this project was to create a dynamic and interactive tuning system. Although this
project has come a long way, there is still a lot of work that needs to be done to complete Cyther V3.
The tuning system is currently capable of tuning to specific frequencies by relating the frequency of the
string to the value of a potentiometer in a tension sensor. The instrument can then change the tension
in the string until the desired potentiometer value is reached. When a string is played, the instrument
can sense the vibration in the string using an optical pickup and measure the frequency of the string.
Using the frequency measurement, the curve that relates the frequency of the string to the tension
sensor’s potentiometer value can be updated to prevent the error in the tuning system from
compounding. The tuning system can be controlled via serial commands to tune to specific frequencies
and update the best fit curve.
Cyther V3 will be a robotic string instrument with unique capabilities. The ability to tune at all
times during a performance will give robotic string instruments new expressive potential. The
suspenseful sound of an orchestra slowly descending pitch, the wholesome resolution of bending a pitch
into perfect harmony, and the power of the blues on a slide guitar were previously unable to be
performed by a robotic string instrument. Cyther V3 will be capable of these types of expressions and
more. Furthermore, the ability for a performer to induce these changes, while algorithmic
harmonization software plays along, will advance the depth and variety of human and machine
instrument interaction.

31
Bibliography [1] “String Tension Guide.” J. D’Addario & Company, Inc.
[2] “String Instrument Extended Techniques.” Denton ISD.
[3] M. Read, “How do harmonics work?,” Music: Practice & Theory Stack Exchange. [Online].
Available: http://music.stackexchange.com/questions/3849/how-do-harmonics-work. [Accessed:
15-Sep-2016].
[4] E. Singer, K. Larke, and D. Bianciardi, “LEMUR GuitarBot: MIDI robotic string instrument,” in
Proceedings of the 2003 conference on New interfaces for musical expression, 2003, pp. 188–191.
[5] G.-W. Raes, “<PlayerPiano> I & II.” [Online]. Available:
http://www.logosfoundation.org/instrum_gwr/playerpiano.html. [Accessed: 05-Sep-2016].
[6] A. Kapur, “A history of robotic musical instruments,” in Proceedings of the International Computer
Music Conference, 2005, pp. 21–28.
[7] “Crazy J’s Guitar Player.” [Online]. Available:
http://ume.gatech.edu/mechatronics_lab/Projects/Fall00/group3/contents.htm. [Accessed: 22-
Sep-2016].
[8] Y. Cheng, C. Hooi, and F. Wörnle, “Level IV Project.”
[9] “How it works- Tronical revolutionary tuning system unique in the world.” [Online]. Available:
http://www.tronical.com/works/. [Accessed: 12-Sep-2016].
[10] J. Borland, “Gibson’s Self-Tuning Guitar,” MIT Technology Review. [Online]. Available:
https://www.technologyreview.com/s/408771/gibsons-self-tuning-guitar/. [Accessed: 01-Sep-
2016].
[11] “AXCENT TUNING SYSTEMS | Self Tuning, Alternate tuning, Automatic tuning system,.” [Online].
Available: http://axcenttuning.com/index.html. [Accessed: 01-Sep-2016].
[12] Tronical Tune, TronicalTune Custom Tuning Tutorial. .
[13] N. C. Skinn and S. J. Freeland, Automatic musical instrument tuning system. Google Patents, 1990.
[14] G. B. Minnick, Self tuning tail piece for string instruments. Google Patents, 1986.
[15] P. Ridden, “A closer look at Don Gilmore’s self-tuning piano system,” New Atlas, 12-Feb-2012.
[Online]. Available: http://newatlas.com/gilmore-self-tuning-piano-system/21425/. [Accessed: 31-
Aug-2016].
[16] E. Prihar and S. Barton, “Autonomous Tuning Mechanism for String Instruments,” 2015.
[17] C. Cooper, “How does a potentiometer work?,” Brighthub Engineering. [Online]. Available:
http://www.brighthubengineering.com/commercial-electrical-applications/47625-potentiometers-
explored-construction-and-working-principles/. [Accessed: 11-Sep-2016].
[18] Eric, “Infrared vs. Ultrasonic - What You Should Know,” Society of Robots. [Online]. Available:
http://www.societyofrobots.com/member_tutorials/book/export/html/71. [Accessed: 11-Sep-
2016].
[19] “Product Information.” [Online]. Available: http://www.showa-
sokki.co.jp/english/products_e/Strain_Gage_e/strain_gage_config_e.html. [Accessed: 16-Sep-
2016].

32
[20] starlino, “A Guide To using IMU (Accelerometer and Gyroscope Devices) in Embedded
Applications.,” Starlino Electronics. [Online]. Available: http://www.starlino.com/imu_guide.html.
[Accessed: 11-Sep-2016].
[21] A. Kapur, A. J. Lazier, P. Davidson, R. S. Wilson, and P. R. Cook, “The electronic sitar controller,” in
Proceedings of the 2004 conference on New interfaces for musical expression, 2004, pp. 7–12.
[22] J. London, “Three things linguists need to know about rhythm and time in music,” 2012.
[23] H. F. Olson, Music, Physics and Engineering. Dover Publications, 1967.
[24] T. Rossing, The Science of String Instruments. Springer Science & Business Media, 2010.
[25] “Frequency and Period of a Wave.” [Online]. Available:
http://www.physicsclassroom.com/class/waves/Lesson-2/Frequency-and-Period-of-a-Wave.
[Accessed: 10-Jan-2017].
[26] “What is Hooke’s Law,” Khan Academy. [Online]. Available:
https://www.khanacademy.org/science/physics/work-and-energy/hookes-law/a/what-is-hookes-
law. [Accessed: 08-Jan-2017].

33
Appendix A: One String Tuning Code #include <TimerOne.h>
// Variables for Pickup
#define pickPin A0 // pin pickup 1 signal is read from
// Variables for Potentiometers
#define potPin A10 // pin potentiometer is read from
// Variables for Motors
#define motora1 22 // pin to control direction of motor 1
#define motora2 23 // pin to control direction of motor 1
#define motorctrl 2 // pin to control speed of motor 1
float goalFreq = 155.56; // the lowest pitch on the 12 tone scale the string can play
// Variables for Frequency Analysis
#define sampleRate 5000 // Hz
#define threshold 400 // count up when voltage divider with photoresistor output is
above this value
#define minFreq 128.27879 // Hz at 5 lbs of tension for string PL014, string 4
#define maxFreq 236.53441 // Hz at 17 lbs of tension for string PL014, string 4
#define countOffset 0 // waveCount offset for accurate frequency determination
#define sampleSize 10 // how many frequency measurements we take and average
#define allowedError 5 // the error between frequency measurements that is ok
int freqState = 0; // what point we are in the frequency analysis process
float lastFreq = 0; // the last frequency measurement, used for determing if we should
call curveAdjust
float sampleSet[sampleSize]; // an array of frequency measurements which is averaged
to determine the actual frequency
unsigned long lastCount = 0;
unsigned long count = 0;
int lastValue = 0;
int value = 0;
int waveCount = 0;
// Variables for Curve Adjusting
#define sampleNum 4 // the number of points to take from the current best fit curve
before adding the new point in
#define lowestFreq 151.78152 // the lowest frequency we want to play
#define highestFreq 222.18539 // the highest frequency we want to play
float bestFitCurveA = 0.001052; // PotVal = A * freq^2 + B
float bestFitCurveB = 228.548812; // These values were determined experimentaly
// Serial command variables
int freqEnable = 0;
int tuneEnable = 0;
int newGoal = 0;
void sample()
{
count++;
}
void setup()

34
{
Serial.begin(115200); // use the serial port
Timer1.initialize(1000000 / sampleRate); // set up the timer
Timer1.attachInterrupt(sample); // an interrupt occurs
pinMode(pickPin, INPUT); // set up the pins
pinMode(potPin, INPUT);
pinMode(motora1, OUTPUT);
pinMode(motora2, OUTPUT);
pinMode(motorctrl, OUTPUT);
digitalWrite(motora1, LOW);
digitalWrite(motora2, LOW);
digitalWrite(motorctrl, LOW);
}
void loop()
{
if(tuneEnable)
{
changePitch();
}
if(freqEnable)
{
getFrequency();
}
}
void serialEvent() // Reads serial input for commands of the type "![string#]
[frequency]"
{
char inChar;
String dataString = "";
if(Serial.available() > 0)
{
delay(1);
inChar = Serial.read(); // get the new byte
if(inChar == 'F') // turn off or on frequency analysis
{
freqEnable = freqEnable ^ 1;
if(freqEnable)
{
lastFreq = 0;
}
Serial.print("Frequency Anaysis Status: ");
Serial.println(freqEnable);
}
else if(inChar == 'T') // turn off or on tuning
{
tuneEnable = tuneEnable ^ 1;
digitalWrite(motora1, LOW);
digitalWrite(motora2, LOW);
digitalWrite(motorctrl, LOW);
Serial.print("String Tuning Status: ");
Serial.println(tuneEnable);
}
else if(inChar == '!') // giving a string command

35
{
while(Serial.available() > 0)
{
inChar = Serial.read();
if(inChar == '!')
{
goalFreq = dataString.toFloat();
Serial.print("Start Time: ");
Serial.println(millis());
newGoal = 1;
dataString = "";
Serial.print("The new frequency is ");
Serial.println(goalFreq);
}
else
{
dataString += inChar;
}
}
}
else if(inChar == 'A') // giving a string command
{
while(Serial.available() > 0)
{
inChar = Serial.read();
if(inChar == 'A')
{
bestFitCurveA = dataString.toFloat();
Serial.print("The new slope is ");
Serial.println(bestFitCurveA,4);
}
else
{
dataString += inChar;
}
}
}
else if(inChar == 'B') // giving a string command
{
while(Serial.available() > 0)
{
inChar = Serial.read();
if(inChar == 'B')
{
bestFitCurveB = dataString.toFloat();
Serial.print("The new intercept is ");
Serial.println(bestFitCurveB,4);
}
else
{
dataString += inChar;
}
}
}
else if(inChar == 'S') // giving a string command

36
{
freqEnable = 0;
tuneEnable = 0;
digitalWrite(motora1, LOW);
digitalWrite(motora2, LOW);
digitalWrite(motorctrl, LOW);
Serial.print("A = ");
Serial.print(bestFitCurveA,4);
Serial.print(" B = ");
Serial.println(bestFitCurveB,4);
delay(2000);
exit(0);
}
}
}
void changePitch() // takes a string and the frequency you want the string to be, then
moves every string to the position it should be
{
int potVal = analogRead(potPin);
int goalVal = bestFitCurveA * goalFreq * goalFreq + bestFitCurveB;
if(goalVal == 0 || goalVal == potVal) // we should stop the motor
{
//Serial.println("Stop");
digitalWrite(motora1, LOW);
digitalWrite(motora2, LOW);
digitalWrite(motorctrl, LOW);
if(newGoal)
{
Serial.print("Stop Time: ");
Serial.println(millis());
newGoal = 0;
}
}
else if(goalVal > potVal) // we need to tune up
{
//Serial.println("Tune up");
digitalWrite(motora1, HIGH);
digitalWrite(motora2, LOW);
digitalWrite(motorctrl, HIGH);
}
else if(goalVal < potVal) // we need to tune down
{
//Serial.println("Tune down");
digitalWrite(motora1, LOW);
digitalWrite(motora2, HIGH);
digitalWrite(motorctrl, HIGH);
}
}
void getFrequency() // has to look at the string and try to measure its frequency,
compare it to the desired, and change the equasions
{
switch(freqState)

37
{
case 0:
if(analogRead(pickPin) >= threshold)
{
waveCount = 0; // this is how many times count has incrimented in between
peaks
lastCount = count; // this is the value of count when the loop ran last
for(int i=0; i++; i<sampleSize)
{
sampleSet[i] = 0;
}
freqState = 1;
}
break;
case 1:
if(count != lastCount)
{
//Serial.println("We have counted up by ");
//Serial.println(count - lastCount);
waveCount += count - lastCount;
lastCount = count;
lastValue = value;
value = analogRead(pickPin);
//Serial.println("waveCount is equal to ");
//Serial.println(waveCount);
}
if(lastValue < threshold && value >= threshold) // if we sense a rising edge
{
float checkFreq = 2 * (float)sampleRate / (float)(waveCount + countOffset);
//Serial.println(checkFreq);
waveCount = 0;
if((checkFreq > (minFreq - allowedError)) && (checkFreq < (maxFreq +
allowedError))) // make sure the frequency we measured is possible
{
//Serial.println("use it");
for(int i=0; i<sampleSize-1; i++)
{
sampleSet[i] = sampleSet[i+1];
}
sampleSet[sampleSize - 1] = checkFreq;
int goodData = 1;
for(int i=0; i<sampleSize-1; i++)
{
for(int j=i+1; j<sampleSize; j++)
{
if((sampleSet[i] > sampleSet[j] + allowedError) || (sampleSet[i] <
sampleSet[j] - allowedError))
{
goodData = 0;
}
}
}
if(goodData)
{
float frequency = 0;

38
for(int i=0; i<sampleSize; i++)
{
frequency += (sampleSet[i] / sampleSize);
}
if((frequency > (lastFreq + allowedError)) || (frequency < (lastFreq -
allowedError)))
{
Serial.println(frequency);
lastFreq = frequency;
adjustCurve(frequency, analogRead(potPin));
freqState = 0;
}
}
}
}
break;
}
}
void adjustCurve(float frequency, float potVal)
{
Serial.print("Old constants: ");
Serial.print("A = ");
Serial.print(bestFitCurveA,6);
Serial.print(" B = ");
Serial.println(bestFitCurveB,6);
// Creates two arrays of + 1 length and fills it with sampleNum evenly distributed
points along the best fit curve of the given string
float f[sampleNum];
float x[sampleNum + 1];
float y[sampleNum + 1];
for(int i=0; i<sampleNum; i++)
{
f[i] = lowestFreq + (highestFreq - lowestFreq) * i / (sampleNum - 1);
x[i] = f[i] * f[i];
y[i] = bestFitCurveA * x[i] + bestFitCurveB;
}
// This adds the most recent data point to the arrays
x[sampleNum] = frequency * frequency;
y[sampleNum] = potVal;
// Now we create a new best fit curve from the evenly distributed samples and the
newest point
float xbar = 0;
float ybar = 0;
float xybar = 0;
float x2bar = 0;
float n = sampleNum + 1.0;
for(int i=0; i<sampleNum + 1; i++)
{
xbar += x[i] / n;
ybar += y[i] / n;
xybar += x[i] / n * y[i];
x2bar += x[i] / n * x[i];
}
// Then we update the Values

39
bestFitCurveA = (xybar - xbar * ybar) / (x2bar - xbar * xbar);
bestFitCurveB = ybar - bestFitCurveA * xbar;
Serial.print("New constants: ");
Serial.print("A = ");
Serial.print(bestFitCurveA,6);
Serial.print(" B = ");
Serial.println(bestFitCurveB,6);
}

40
Appendix B: Circuit Board Schematics Potentiometer Board

41
Pickup Board

42
Motor Board

43
Appendix C: Parts List Part Quantity Link to Purchase
80/20 Framing (72") 2 https://www.amazon.com/dp/B001F0K4KA
80/20 Framing L Mounting Bracket
10 http://www.mcmaster.com/#47065t236/=14gidh2
Acrilic Sheet 1 https://www.amazon.com/dp/B006U1JN0Q/ref=biss_dp_t_asn
Brushed Motor 10 https://www.pololu.com/product/3065
Encoder (2) 5 https://www.pololu.com/product/3081
Motor Mount (2) 5 https://www.pololu.com/product/1599
Spring 10 http://www.centuryspring.com/compression-spring-71421.html
Potentiometer 10 http://www.mouser.com/ProductDetail/ALPS/RS08U111Z001/?qs=sGAEpiMZZMtC25l1F4XBUwVi5%252bD8WO2jauozwkhrepU%3d
Tuning Machines (6) 2 https://www.amazon.com/dp/B00EB11OHC
Tuning Machine - Motor Shaft Adapter
10 https://www.amazon.com/dp/B00OK6DQ60
Shaft 3 https://www.amazon.com/dp/B0045DUX5A
Shaft Mount 6 https://www.adafruit.com/product/1182
Ball Bearings (10) 3 https://www.amazon.com/dp/B002BBICBK
Arduino mega 1 https://store-usa.arduino.cc/products/arduino-mega-2560-rev3?utm_source=redirects&utm_medium=store.arduino.cc&utm_campaign=303_Redirects
Multiplexer 1 https://www.sparkfun.com/products/9056
H-Bridge Chip 5 http://www.mouser.com/ProductDetail/Texas-Instruments/SN754410NE/?qs=sGAEpiMZZMtYFXwiBRPs07TIpCamzEu5
Size 0 Machine Screw 1"
40 https://www.mcmaster.com/
Size 0 Machine Screw 1/2"
10 https://www.mcmaster.com/
Size 0 Nut 50 https://www.mcmaster.com/
Size 0 Washer 50 https://www.mcmaster.com/
Size 0 Lock Washer 50 https://www.mcmaster.com/
Size 8 Machine Screw 1"
6 https://www.mcmaster.com/
Size 8 Nut 6 https://www.mcmaster.com/
Size 8 Washer 6 https://www.mcmaster.com/
Size 8 Lock Washer 6 https://www.mcmaster.com/
Size 8 Rubber Washer
12 https://www.mcmaster.com/

44
M2 Machine Screw 3/4"
40 https://www.mcmaster.com/
M2 Nut 40 https://www.mcmaster.com/
M2 Washer 40 https://www.mcmaster.com/
M2 Lock Washer 40 https://www.mcmaster.com/
M2 Rubber Washer 80 https://www.mcmaster.com/
M3 Machine Screw 3/4"
20 https://www.mcmaster.com/
M3 Machine Screw 1.5"
30 https://www.mcmaster.com/
M3 Nut 50 https://www.mcmaster.com/
M3 Washer 50 https://www.mcmaster.com/
M3 Lock Washer 50 https://www.mcmaster.com/
M3 Rubber Washer 100 https://www.mcmaster.com/
laser diode (10) 1 https://www.amazon.com/dp/B01EL7QZCE
photoresistor (20) 1 https://www.amazon.com/dp/B00AQVYWA2