Dynamical properties of Ultraluminous Infrared Galaxies II ...veilleux/pubs/dasyra_b.pdf ·...
33
Dynamical properties of Ultraluminous Infrared Galaxies II: Tracing the evolution of the stellar kinematics during the Ultraluminous phase(s) of local mergers K. M. Dasyra 1 , L. J. Tacconi 1 , R. I. Davies 1 , T. Naab 2 , R. Genzel 1 , D. Lutz 1 , E. Sturm 1 , A. J. Baker 3,4 , S. Veilleux 4 , D. B. Sanders 5 , A. Burkert 2 ABSTRACT We present results from our Very Large Telescope large program to study the dynamical evolution of local Ultraluminous Infrared Galaxies (ULIRGs) and QSOs. Expanding previous studies by Genzel et al. (2001) and Tacconi et al. (2002), our data now consist of high resolution, long-slit H - and K -band spec- tra of 54 ULIRGs. This paper mainly presents the kinematics of sources that have coalesced into a single nucleus. The stellar kinematics, extracted from the CO rovibrational bandheads in our spectra, indicate that ULIRG remnants are dynamically heated systems with a mean dispersion of 157 km s -1 . The com- bination of kinematic, structural, and photometric properties of the remnants indicate that they mostly originate from major encounters (in agreement with Dasyra et al. 2006) and that they result in the formation of dispersion-supported systems (elliptical galaxies of the order ∼10 10 -10 11 M ). Placing ULIRGs on the fundamental plane of early-type galaxies indicates that the end products of ultra- luminous mergers are typically less massive and extended than giant ellipticals (in good agreement with Genzel et al. 2001 and Tacconi et al. 2002). Convert- ing the host dispersion into black hole mass with the aid of the M BH - σ relation yields black hole mass estimates of the order 10 7 - 10 8 M and high accretion rates (of Eddington efficiencies often > 0.5). Subject headings: galaxies: formation — galaxies: kinematics and dynamics — infrared: galaxies — ISM: kinematics and dynamics — 1 Max-Planck-Institut f¨ ur extraterrestrische Physik, Postfach 1312, 85741, Garching, Germany 2 Universit¨atssternwarte, Scheinerstr. 1, 81679, M¨ unchen, Germany 3 Jansky Fellow, National Radio Astronomy Observatory 4 Department of Astronomy, University of Maryland, College Park, MD 20742, USA 5 Institute for Astronomy, University of Hawaii, 2680 Woodlawn Drive, Honolulu, HI 96822, USA
Transcript of Dynamical properties of Ultraluminous Infrared Galaxies II ...veilleux/pubs/dasyra_b.pdf ·...

Dynamical properties of Ultraluminous Infrared Galaxies II:
Tracing the evolution of the stellar kinematics during the
Ultraluminous phase(s) of local mergers
K. M. Dasyra1, L. J. Tacconi1, R. I. Davies1, T. Naab2, R. Genzel1, D. Lutz1, E. Sturm1,
A. J. Baker3,4, S. Veilleux4, D. B. Sanders5, A. Burkert2
ABSTRACT
We present results from our Very Large Telescope large program to study
the dynamical evolution of local Ultraluminous Infrared Galaxies (ULIRGs) and
QSOs. Expanding previous studies by Genzel et al. (2001) and Tacconi et al.
(2002), our data now consist of high resolution, long-slit H- and K-band spec-
tra of 54 ULIRGs. This paper mainly presents the kinematics of sources that
have coalesced into a single nucleus. The stellar kinematics, extracted from the
CO rovibrational bandheads in our spectra, indicate that ULIRG remnants are
dynamically heated systems with a mean dispersion of 157 km s−1. The com-
bination of kinematic, structural, and photometric properties of the remnants
indicate that they mostly originate from major encounters (in agreement with
Dasyra et al. 2006) and that they result in the formation of dispersion-supported
systems (elliptical galaxies of the order ∼1010-1011M). Placing ULIRGs on the
fundamental plane of early-type galaxies indicates that the end products of ultra-
luminous mergers are typically less massive and extended than giant ellipticals
(in good agreement with Genzel et al. 2001 and Tacconi et al. 2002). Convert-
ing the host dispersion into black hole mass with the aid of the MBH − σ relation
yields black hole mass estimates of the order 107- 108 M and high accretion
rates (of Eddington efficiencies often > 0.5).
Subject headings: galaxies: formation — galaxies: kinematics and dynamics —
infrared: galaxies — ISM: kinematics and dynamics —
1Max-Planck-Institut fur extraterrestrische Physik, Postfach 1312, 85741, Garching, Germany
2Universitatssternwarte, Scheinerstr. 1, 81679, Munchen, Germany
3Jansky Fellow, National Radio Astronomy Observatory
4Department of Astronomy, University of Maryland, College Park, MD 20742, USA
5Institute for Astronomy, University of Hawaii, 2680 Woodlawn Drive, Honolulu, HI 96822, USA

– 2 –
1. Introduction
Galaxy mergers, the frequency of which increases with redshift (Kauffmann & White
1993; Le Fevre et al. 2000), are considered a key mechanism in driving galaxy evolution.
In the local Universe, the best laboratories for studying violent merging events (believed
to be the probable analogs of high-redshift mergers) are the ultraluminous infrared galaxies
(ULIRGs). ULIRGs have a high luminosity output in the infrared (IR), which is greater
than 1012L and comparable to the bolometric luminosities of QSOs.
A plethora of studies indicates that ULIRGs transform gas-rich disks into ellipticals (Es)
through merger-induced dissipative collapse (Kormendy & Sanders 1992; Mihos & Hernquist
1996). The large molecular gas concentrations in the central kpc regions of ULIRGs (e.g.
Downes & Solomon 1998; Bryant & Scoville 1999) have densities comparable to stellar
densities in ellipticals. Kim et al. (2002) and Veilleux et al. (2002) have analyzed the
structural parameters of a sample of 118 ULIRGs that have 60 µm flux greater than 1 Jy
(hereafter the 1 Jy sample). They find that most (73%) are well-fit by an elliptical-like r1/4
light profile. Similar findings on the near-IR light distributions of ULIRGs were reported by
Scoville et al. (2000). Genzel et al. (2001) and Tacconi et al. (2002) have made high-
resolution near-infrared (NIR) spectroscopic measurements of the stellar dynamics of small
samples consisting mostly of fully-merged ULIRGs. They conclude that ULIRGs resemble
intermediate mass ellipticals/lenticulars with moderate rotation, in their velocity dispersion
distribution, their location in the fundamental plane (FP; e.g., Djorgovski & Davis 1987;
Dressler et al. 1987) and their distribution of the rotational/dispersion velocity ratio.
Together, these results suggest that ULIRGs form moderate mass ellipticals (of stellar mass
∼1011 M).
One way to investigate the physical details and the evolution of ULIRGs is to determine
the kinematic and structural properties of the merging (or interacting) galaxies in different
merger phases. We therefore conducted a European Southern Observatory (ESO) large
program1 that traces the host dynamics of a large sample of ULIRGs (spanning wide ranges
of merger phase and infrared luminosity) through NIR spectroscopy. Our study extends the
previous work by Genzel et al. (2001) and Tacconi et al. (2002) by including a wider
range of ULIRG merger phase and luminosity. In Dasyra et al. (2006, hereafter Paper I) we
analyzed those ULIRGs that are in a merger phase later than the first encounter but prior to
nuclear coalescence, and hence, show more than one nucleus in the NIR acquisition images.
In this paper we present results from those ULIRGs that have coalesced and show a single
nucleus in our images, the so-called remnants. We compare the stellar kinematic properties
1171.B-0442 (PI Tacconi)

– 3 –
of binary ULIRGs and ULIRG remnants to study the evolution of ultraluminous mergers.
Some of the ULIRGs presented in this study may in fact be binary sources very close
to coalescence that have small projected nuclear separations; such sources cannot always be
resolved (or kinematically disentangled) due to instrumental angular resolution constraints.
At redshifts typical for the sources in our sample, the angular resolution achieved implies that
any unresolved systems will have nuclear separations smaller than 1 kpc. Merger simulations
(e.g. Mihos 2000) have shown that by the time the individual nuclei are separated by .1 kpc, the stellar kinematics have almost reached their relaxation values. Therefore, the
dynamical properties of all the sources we classify as remnants are representative of those at
dynamical equilibrium.
This paper is arranged as follows. We briefly summarize the observations and present
our data in § 2. After studying how the kinematic properties of the merging galaxies evolve
with time in § 3, we investigate potential ultraluminous merger end products in § 5. We
then focus on the black hole properties of ULIRGs: an analysis of the evolution of the MBH-
σ relation during the merger in § 6 is followed by a discussion of the nuclear activity implied
by our data in § 7. Finally a summary is presented in § 8.
2. Observations and data
We have obtained near-infrared, long-slit spectroscopic data using the ISAAC spec-
trometer (Moorwood et al. 1998) mounted on the Antu telescope unit of the Very Large
Telescope (VLT). Together with the sources presented in Genzel et al. (2001) and Tacconi
et al. (2002), we now have high resolution NIR spectra of 54 ULIRGs and 12 QSOs. In
this paper, we complete the presentation of the ULIRGs in our program by studying the
kinematics of mergers in an ultraluminous post-coalescence phase (ULIRG remnants). The
stellar kinematics of the QSOs will be presented in a forthcoming paper (Dasyra et al. 2006,
in preparation).
We present new data for 17 of the 30 sources listed in Table 1. According to the
NICMOS imaging of Scoville et al. (2000), Mrk 273 and IRAS 15250+3609 have a projected
nuclear separation of 0.7 kpc and need to be treated as remnants. The same applies for the
resolved binary Arp 220 with a projected nuclear separation of 0.3 kpc (Genzel et al. 2001).
The resolved binary NGC 6240 has a nuclear separation of 1.4 kpc, which exceeds (but is
very close to) the threshold of 1 kpc that we set to define our remnants. Since the stellar
kinematics of its two components are very similar (identical within the error bars: Tecza et
al. 2000;Genzel et al. 2001), a strict classification of this source is not straightforward.

– 4 –
Furthermore, the observed stellar kinematics are believed to be affected by localized motions
of self-gravitating internuclear gas or even projection effects (Tecza et al. 2000;Genzel et al.
2001). For these reasons, we opt to exclude NGC 6240 from any statistical analyses in this
paper.
According to the recent NICMOS imaging of Veilleux et al. (2006), a second (fainter)
source is present north-east of IRAS 00456-2904, at a projected nuclear separation of 20.7
kpc. Whether this is a second nucleus at the same redshift is not spectroscopically confirmed.
The imaging analysis of Veilleux et al. (2006) shows that the (bright) south-west nucleus is
a late-type galaxy while the north-east source is of ambiguous type. These findings indicate
that IRAS 00456-2904 is probably in an early-interaction phase and should be classified as
a binary system.
Taking the above into account we find that of the 54 ULIRGs observed, 30 are merger
remnants, 23 are (binary) progenitors, and 1 (IRAS 00199-7426: Duc et al. 1997; Paper I)
may be a multiple-interaction system.
A detailed description of the criteria for the sample selection, the wavelength range of
the observations, and the instrument mode used is given in Paper I. The pixel scale was
0.146′′per pixel. The total exposure times, and the slit position angles for each ULIRG
remnant are presented in Table 1. If the position angle of the major axis of rotation could
not be identified (e.g. from the elongation of the stellar disk), the slits were typically placed
at 0 and 90. The redshift range of the sources in the present sample is 0.042 < z < 0.268
(see Table 1). No sources are observed for the redshift sub-range 0.163 < z < 0.199, since
the CO bandheads are then shifted into wavebands of high atmospheric absorption.
As in Paper I, we derive the structural parameters of the sources that do not have high-
resolution NIR imaging (e.g. Hubble Space Telescope NICMOS) data by fitting ellipses to
our H-band acquisition images (with the aid of the SExtractor package; Bertin & Arnouts
1996). The half-light radius Reff , the ellipticity, and the angle φα between the major axis
of rotation and the position angle of the first slit are presented in Table 2 for each source.
To convert all angular distances into linear sizes we use a H0=70 km s−1 Mpc−1, Ωm=0.3,
Ωtotal=1 cosmology.
The extraction of the stellar central velocity dispersion σ and rotational velocity Vrot
from the spectra follows the method presented in Paper I. It is performed using the Fourier
quotient technique (Bender 1990); this method provides the intrinsic line-of-sight (LOS)
velocity profile along any given aperture. To this we fit a Gaussian to determine the average
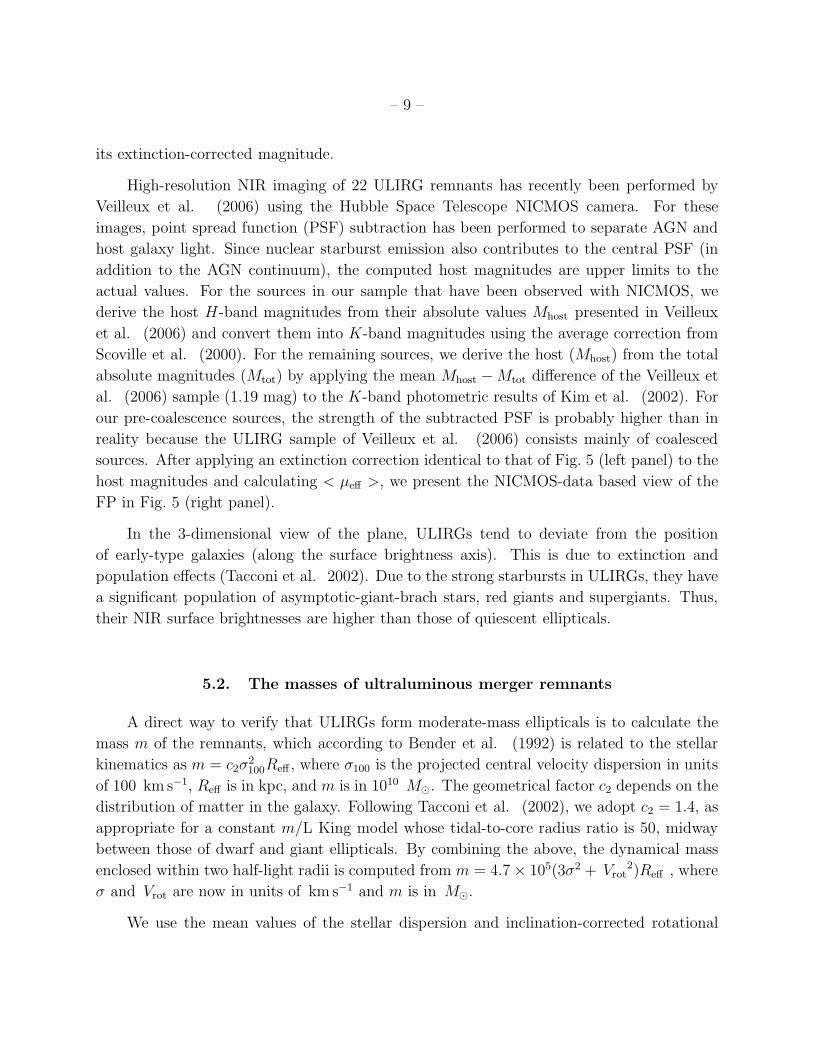
LOS radial velocity and velocity dispersion. The central aperture spectrum of each source
(combined over the two slits and shifted to restframe) is displayed in Fig. 1. The stellar

– 5 –
template, an M0III giant (HD 25472), is overplotted with a dashed line after being convolved
with the Gaussian that best simulates the LOS broadening function.
The stellar kinematic results (central velocity dispersion and rotational velocity) can be
found in Table 3. From the LOS rotational velocity, Vrot(LOS) measured along each slit, we
calculate the observed rotational velocity Vrot(obs) by correcting for the angular deviation of
the slit from the major axis of rotation (as Vrot(obs) = Vrot[LOS]/cos[φα]), and by averaging
the result over the slits. The value of the observed rotational velocity is given in Table 3 and
is related to the actual rotational velocity Vrot as Vrot(obs) = Vrotsin(i). To correct for the
inclination i of the stellar disks, we used the mean value of sini (0.5) observed for disk-like
galaxies on the sky. The conversion of ellipticity into i for the remnants is very uncertain
since their stellar disks are dynamically hot (due to the advanced phase of the merger).
3. Evolution of the galaxy kinematics
The mean stellar velocity dispersion of the remnants of ultraluminous mergers presented
in Table 3, including Arp 220, is 157 km s−1, with a dispersion of ±40 km s−1. The velocity
dispersion of ULIRGs in a merger phase prior to coalescence is 143 (± 21) km s−1, when
IRAS 00456−2904(SW) is added to the sources of Paper I.
The pre- and post- coalescence dispersion distributions are shown in Fig. 2. While the
difference in the mean of the two distributions is small, the remnant velocity dispersion
distribution has a larger variance and a tail at the high-σ end, the statistical significance of
which needs to be quantified.
To investigate whether the two distributions are independent, we created a Monte Carlo
code, beginning with the assumption that the two distributions are drawn from the same
parent population. We used 106 points to simulate a Gaussian parent distribution that fits
the combined pre- and post- coalescence ULIRG dispersion measurements. From the par-
ent distribution, we selected random points to generate two (artificial progenitor/remnant)
subsamples, each having a number of elements equal to that of the corresponding real pop-
ulation. We then calculated the difference in the mean of the two generated samples and
the difference in the variance between each real population and the (corresponding) gen-
erated sample. We repeated this procedure for 10000 iterations and found that the prob-
ability of the difference in the mean of the two generated samples to be equal or greater
than the measured one (14 km s−1) is 0.051. The probability p that the variances of
both generated samples (σ2gen,1 and σ2
gen,2 respectively) are greater than those measured (or
p[σgen,1 > 21 km s−1] ∗ p[σgen,2 > 40 km s−1]) is 0.011. In other words, while the probability

– 6 –
that the means of the observed distributions are independent is marginally significant, 94.9%
(meaning that the means are 2 Gaussian sigma apart), the probability that their variances
are independent is significantly high, 98.9%.
This result favors the hypothesis that the apparent kinematic evolution is real rather
than an artifact of limited-number statistics. From the definition of a normal distribution’s
standard error, we estimate that we would still need twice as many measurements to reach
a 3 Gaussian sigma difference in the means and more safely quantify the evolution in the
ULIRG velocity dispersion before and after nuclear coalescence.
The mean value of the rotational velocity is 56 km s−1 for the ULIRG remnants, increas-
ing to 112 km s−1 when inclination effects are accounted for. The observed stellar rotational
velocity of each individual source and its ratio over the dispersion is presented in Table 3. In
Paper I we found that the progenitors have a Vrot/ σ ratio of 0.42, which increases to 0.77
when correcting for inclination effects from the ellipticity of each individual progenitor. The
mean Vrot(obs)/σ ratio for the sample presented in this study is lower, 0.33, increasing to
Vrot/σ=0.66 when we apply a mean inclination correction to the rotational velocity. In this
calculation we have not attempted to correct the central velocity dispersion for inclination
effects.
The evolution of the velocity dispersion measured in ULIRGs is only a lower limit to the
total dynamical heating that the interacting galaxies undergo during the merger. One of the
reasons is that the ULIRG phase traces the merger periods during which strong starbursts
occur; namely, beyond first encounter and close to nuclear coalescence (Mihos & Hernquist
1996; Mihos 1999; Springel et al. 2005; Veilleux et al. 2002). The starburst timescales
are short (.108 yrs; e.g. Canalizo & Stockton 2001) compared to that of the baryonic
matter merging process (which lasts a few 109 yrs; e.g. Hernquist 1993). The fact that
dynamical heating in the merging galaxies can be traced, even for these short timescales, is
very significant.
Furthermore, even for the ultraluminous IR phases of a merger, any increase in σ that
may possibly be observed is underestimated due to population effects. The host kinematics
extracted from the NIR bandheads are often representative of those of young stellar popu-
lations i.e. giants and supergiants. These populations could still be linked to the gas from
which they formed (which is believed to settle into a disk early compared to the stars in
the progenitor disks: Mihos & Hernquist 1996), and have less perturbed orbits than the
old stars. Therefore, host dispersions extracted from the CO bandheads may be systemat-
ically lower than those of the merging bulges. The low Vrot/σ ratio that we measure for
our ULIRGs is a good indication that even the young stellar populations are significantly
heated, and therefore, systematics originating from population effects are unlikely to have a

– 7 –
major effect on our conclusions.
It is possible that the sources used in this study and in Paper I originate from mergers
of galaxies of somewhat different mass contents: the ULIRGs that are prior to nuclear
coalescence may be more gas-rich (and possibly more massive) than the remnants in order
to have an ultraluminous phase of comparable IR output at earlier merger phases (Mihos
& Hernquist 1996). In that case, the observed dynamical heating may be less than what
we would measure if we were able to observe a specific galaxy pair from the beginning until
the end of the merging process. The molecular gas mass measurements obtained by Gao &
Solomon (1999) in local Luminous Infrared Galaxies (LIRGs; sources of 1011L < LIR <
1012L) and ULIRGs indicate that a correlation between nuclear separation and gas fraction
is observed in LIRGs but not in ULIRGs. To properly investigate this possibility, an extended
study of the molecular gas content of 1-Jy ULIRGs is now being performed (PI Tacconi).
4. Origin of the ULIRG remnants
We infer the initial conditions of the mergers that lead to ultraluminous IR activity by
comparing the kinematic properties of ULIRG remnants with those predicted by simulations
in the literature. According to various authors (e.g. Bendo & Barnes 2000; Naab &
Burkert 2003) the remnant Vrot(obs)/σ ratio is an indicator of the mass ratio of the merging
galaxies. In the gas-free, N-body simulations of binary mergers performed by Naab & Burkert
(2003) for several mass ratios and orientations, the major mergers produced slowly rotating
remnants. Those authors suggested that the Vrot(obs)/σ ratio is ∼ 0.2 for 1:1 and ∼ 0.4
for 2:1 merger remnants, while it reaches higher values (0.8) when the remnants originate
from minor (4:1) mergers. Our remnants agree best with a 1:1 and 2:1 merger origin, also
agreeing with the directly measured progenitor mass ratios of Paper I and confirming that
ULIRGs are representative of the most violent local mergers.
Naab & Burkert (2003) and Burkert & Naab (2005) have also shown a connection
between the Vrot(obs)/σ ratio and the remnant ellipticity at the effective radius for several
progenitor mass ratios. We overplot our results with those of Naab & Burkert (2003) in
Fig. 3; our ULIRGs are given in stars, while the squares and the open diamonds correspond
to boxy and disky isophotal-profile ellipticals (data provided to Naab & Burkert 2003 by R.
Bender). Each panel corresponds to mergers of different progenitor mass ratios (denoted at
the upper-left corner of each panel). Naab & Burkert (2003) show in bold, solid, and dotted
contours the 90%,70%, and 50% probability of finding a merger remnant of each category
in the enclosed region. These simulations did not include gas; the addition of gas would
result in an increase of the remnant Vrot(obs)/σ ratio (since the gas that is not consumed

– 8 –
during the merger will settle in a disk) and, therefore, to a shift of the probability contours
to higher values on both axes (Burkert & Naab 2005). The position of our ULIRG remnants
in this diagram gives further support to the argument that ULIRGs are produced mainly by
mergers of galaxies of comparable masses (see Paper I).
5. End products of ultraluminous mergers
5.1. ULIRGs and the fundamental plane of early-type galaxies
The Vrot/σ ratio of the ULIRG remnants indicates that mergers of ultraluminous infrared
output lead to dispersion-supported systems with a non-negligible rotational component (also
see Genzel et al. 2001). To investigate what type of ellipticals ultraluminous IR mergers
form, Genzel et al. (2001) and Tacconi et al. (2002) placed their sample of ULIRGs on
the fundamental plane of early-type galaxies (Djorgovski & Davis 1987). They concluded
that the remnants resemble moderate mass ellipticals (of stellar mass a few 1011 M). Our
new data significantly increase the number of objects in the range of ULIRG luminosity to
be compared with early-type galaxies.
The Reff - σ projection of the plane that we construct from our data is shown in Fig. 4.
Whenever possible, the K-band effective radius was used (Tacconi et al. 2002). Otherwise,
we converted H- into K- band effective radii using an average correction derived from the
Reff values of Scoville et al. (2000) (for flux within 3 kpc). Data for early-type galaxies
are taken from Bender et al. (1992), Faber et al. (1997), and Pahre (1999). Giant boxy
ellipticals (squares) are located on the upper-right corner of the FP projection, while disky,
moderate-mass ellipticals (circles) are at the center. ULIRGs, shown in triangles, agree very
well with the location of the latter on the plane. Local LIRGs are mainly found at the
lower-left corner of the FP projection (data from Shier & Fischer 1998 and James et al.
1999).
In Fig. 5 we show the 3-dimensional view of the fundamental plane, taking into account
the central surface brightness of the sources. In the left panel, we use the K-band magnitudes
from Kim et al. (2002); where total magnitudes (integrated up to the truncation radius) are
not available, we use the magnitudes derived from the 4 kpc aperture photometry instead.
We correct the magnitudes for extinction effects by subtracting 1.28 mag at 2.2 µm. We infer
this (equivalent screen) correction from the study of Scoville et al. (2000) by converting
the average 1.6 - 2.2 µm magnitude difference of their sample (0.84 for 2 kpc aperture
photometry) into color excess. We then compute the mean surface brightness within the
effective radius < µeff > of each source by adding 2.5log(2πR2eff) mags (where Reff is in ′′) to
– 9 –
its extinction-corrected magnitude.
High-resolution NIR imaging of 22 ULIRG remnants has recently been performed by
Veilleux et al. (2006) using the Hubble Space Telescope NICMOS camera. For these
images, point spread function (PSF) subtraction has been performed to separate AGN and
host galaxy light. Since nuclear starburst emission also contributes to the central PSF (in
addition to the AGN continuum), the computed host magnitudes are upper limits to the
actual values. For the sources in our sample that have been observed with NICMOS, we
derive the host H-band magnitudes from their absolute values Mhost presented in Veilleux
et al. (2006) and convert them into K-band magnitudes using the average correction from
Scoville et al. (2000). For the remaining sources, we derive the host (Mhost) from the total
absolute magnitudes (Mtot) by applying the mean Mhost −Mtot difference of the Veilleux et
al. (2006) sample (1.19 mag) to the K-band photometric results of Kim et al. (2002). For
our pre-coalescence sources, the strength of the subtracted PSF is probably higher than in
reality because the ULIRG sample of Veilleux et al. (2006) consists mainly of coalesced
sources. After applying an extinction correction identical to that of Fig. 5 (left panel) to the
host magnitudes and calculating < µeff >, we present the NICMOS-data based view of the
FP in Fig. 5 (right panel).
In the 3-dimensional view of the plane, ULIRGs tend to deviate from the position
of early-type galaxies (along the surface brightness axis). This is due to extinction and
population effects (Tacconi et al. 2002). Due to the strong starbursts in ULIRGs, they have
a significant population of asymptotic-giant-brach stars, red giants and supergiants. Thus,
their NIR surface brightnesses are higher than those of quiescent ellipticals.
5.2. The masses of ultraluminous merger remnants
A direct way to verify that ULIRGs form moderate-mass ellipticals is to calculate the
mass m of the remnants, which according to Bender et al. (1992) is related to the stellar
kinematics as m = c2σ2100Reff , where σ100 is the projected central velocity dispersion in units
of 100 km s−1, Reff is in kpc, and m is in 1010 M. The geometrical factor c2 depends on the
distribution of matter in the galaxy. Following Tacconi et al. (2002), we adopt c2 = 1.4, as
appropriate for a constant m/L King model whose tidal-to-core radius ratio is 50, midway
between those of dwarf and giant ellipticals. By combining the above, the dynamical mass
enclosed within two half-light radii is computed from m = 4.7× 10⁵(3σ2 + Vrot2)Reff , where
σ and Vrot are now in units of km s−1 and m is in M.
We use the mean values of the stellar dispersion and inclination-corrected rotational

– 10 –
velocity from § 3. Whenever Vrot is not available, we use the mean inclination-corrected
Vrot/σ ratio to infer it. We find that the mean dynamical mass of the remnants is 8.86×10¹⁰
M (in good adreement with Tacconi et al. 2002), suggesting that ultraluminous activity
mainly originates from mergers of sub-m∗ galaxies, for m∗ = 1.4 × 10¹¹ M (Genzel et al.
2001 and references therein). For different values of m∗ (e.g that of Bell et al. 2003 adapted
to our cosmology, 8.3 × 10¹⁰ M) the sub-m∗ characterization of ULIRGs may change to
∼ m∗. Still, in the local Universe, the galaxies that when merging can be observed as
ULIRGs do not need to be as massive as e.g. the Milky Way.
This conclusion does not contradict the result of Veilleux et al. (2006) that the H-band
host magnitude M(H) of the ULIRGs they studied is, on average, greater than 1.5M∗(H),
for M∗(H) = −23.7. Because of the strong starbursts ULIRGs undergo, their luminosity-to-
mass ratio does not remain constant throughout the merger process (see also Tacconi et al.
2002; Rupke et al. 2002; 2005a; 2005b).
ULIRG masses derived from Hα emission-line dispersions are also sub-m∗ (Colina et al.
2005). Tracing the ionized gas by the [FeII] emission lines that appear in our spectra, we find
that while the mean dispersion of the gas is similar to that of the stars, in individual cases
gas and stellar dispersions may significantly deviate due to gas outflows. Gas kinematics in
these ULIRGs will be presented in a forthcoming paper (Tacconi et al. 2006, in preparation).
5.3. Can ULIRGs form giant Es?
Our main conclusion is that ULIRGs form elliptical galaxies of significantly lower mass
than that of giant ellipticals (of typical stellar mass& 5×10¹¹ M). It is therefore reasonable
to investigate whether local ULIRGs could also form few giant ellipticals or whether the size
of the current sample is not large enough to permit a definite answer.
For this assessment, we used the mass function of local Es to estimate what fraction f
of the sources with mass > 1010M (mass threshold similar to that of ULIRGs) corresponds
to giant ellipticals (of stellar mass > 5× 10¹¹M). Given that the fraction may significantly
vary according to the adopted mass function, we used the best fit to the K-band mass
function from various authors in the literature. Giant ellipticals comprise 18.7% of local Es
with mass > 1010M for the mass function of Bell et al. (2003), found for Es in the Sloan
Digital Sky (SDSS) and the Two Micron All Sky (2MASS) surveys for a diet2 Salpeter initial
mass function (IMF). The fraction f is 20.1% for the 2MASS K-band luminosity function
2of stellar mass reduced by 30%

– 11 –
of local Es (Kochanek et al. 2001) which we convert to mass function using m/L = 1.32
M/L (Cole et al. 2001). This K-band m/L ratio is computed for both early- and late-
type galaxies in the 2MASS and 2dF Galaxy Redshift Surveys, assuming a Salpeter IMF.
An estimate of the m/L ratio for local ellipticals only can be derived from the work of
Cappellari et al. (2005a) using the mean I-band m/L value and I-K color correction of
the SAURON project sources. Combining the 2MASS K-band luminosity function with this
early-type-galaxy m/L value (0.75 M/L) yields f=10.9%. Although f is between 10%
and 20%, we do not observe any source of m > 5 × 10¹¹ M in our sample of 30 ULIRG
remnants; this fact indicates that the formation of few giant ellipticals cannot be considered
typical for local ultraluminous mergers, though it cannot be excluded by our statistics.
In Fig. 6, we compare the number density of ULIRG remnants and ellipticals as a
function of their stellar dispersion (in the range between 50 and 300 km s−1). The source
number density per stellar dispersion, n(σ), is shown as a histogram for ULIRGs and as a solid
line for SDSS ellipticals. For the ellipticals, n(σ) is computed from the velocity dispersion
function of Sheth et al. (2003). The n(σ) distribution of local ULIRGs is calculated
by multiplying the % fraction of ULIRG remnants per σ bin with the (converted to our
cosmology) volume density of ULIRGs (2.5× 10⁻⁷ Mpc−3) from Sanders et al. (2003). To
facilitate the comparison between the two n(σ) distributions, we apply a normalization factor
of 7× 10³ to the ULIRG histogram so that its mean has the same number density as that of
the SDSS ellipticals. Physically, this normalization factor is related to the ratio between the
time over which ellipticals have been formed and the lifetime of a single ultraluminous burst.
Its value is only a rough estimate since it depends on the completeness of the 1 Jy and the
SDSS (sub-)samples and the fact that ultraluminous mergers are not the only mechanism to
produce elliptical galaxies.
A Gaussian fit to the elliptical-galaxy n(σ) distribution leads to a mean dispersion
identical to that of ULIRGs, 157 (±54) km s−1. In other words, the descendants of ULIRGs
will resemble the ellipticals that are most common in the local Universe. Local ULIRGs
seem to form at highest rates sources of characteristic σ between 130 and 160 km s−1.
At high and low dispersions, the ratio between n(σ) and n(< σ >) seems to be lower
for ULIRGs than for ellipticals. The deviations between the two distributions at the low-
dispersion end may be due to the fact that mergers of gas-rich galaxies below a certain mass
threshold do not possess enough gas to undergo a ULIRG phase. For the high-dispersion end,
we cannot formally rule out the possibility that some ULIRGs may have been missed either
due to sample incompleteness or to possible shorter (than the average) burst timescales of
the most massive sources. However, a more possible scenario can be derived from the work of
Thomas et al. (2005); namely that the more massive galaxies are, the faster and the earlier

– 12 –
their stellar population have formed. Another plausible explanation is that at low redshifts
other types of mergers (e.g. elliptical-spiral or elliptical-elliptical ones) may significantly
account for the formation of giant Es (Khochfar & Burkert 2003).
5.4. Wavelength dependence of the stellar velocity dispersion measurement
Systematic differences between the measured and the actual values of the host dispersion
can arise when extracting σ from different wavelengths, i.e. from the Ca II triplet in the
optical (e.g. Rothberg & Joseph 2005) and the CO bandheads in the NIR. When using
CO, the systematics originate from population effects (see § 3), while in the case of the Ca
triplet, the systematics are mainly related to the presence of dust. Due to scattering of light
from dust particles, photons originating from high-velocity stars in the center of the galaxy
will be scattered into random lines of sight. This will particularly bias the LOS velocity
distribution at large radii where host dispersion is lower than that in the center (Baes &
Dejonghe 2002). The effects of dust in the observed stellar kinematics will further increase
with increasing dust mass and extent (Baes & Dejonghe 2002). Since ULIRGs are highly
obscured systems, dispersions extracted from the Ca triplet may be systematically higher
than those of the stars in the central spheroid.
Silge & Gebhardt (2003) have attempted to quantify the (possible) discrepancy between
dispersion estimates derived from the NIR and the optical regimes for local quiescent galaxies.
While they found no significant difference for elliptical galaxies, the systematics were non-
negligible in S0 lenticulars, with the largest difference in σ (∼30-40%) found in the most
massive sources of their sample. Typical Vrot/σ ratios for S0 lenticulars are greater than
those of ULIRGs, & 1.5 (e.g., Pizzela et al. 2005; Cappellari et al. 2005b) indicating
that deviations of the order 30-40% between the CO and Ca dispersion measurement are
probably high for ULIRGs.
To investigate how using the Ca II triplet for the measurement of σ might affect the
results of this paper, we increase our sample’s average dispersion by 40% (the maximum
reported deviation between the NIR and the optical results in Silge & Gebhardt 2003). This
increase corresponds to 60 km s−1 or a shift of 0.15 in logarithmic space, bringing merger
remnants closer to (but not within) the FP region populated by giant ellipticals. When
applying this maximum correction of 60 km s−1 to the dispersion of the binary ULIRGs,
we find that the masses of the progenitors would still be close to m∗ (1.66×10¹¹ M, on
average).
Rothberg & Joseph (2005), who measured σ from Ca triplet optical spectroscopy for
– 13 –
13 LIRG and 3 ULIRG remnants, found that the hypothesis that luminous/ultraluminous
mergers and giant ellipticals are drawn from the same parent population can be rejected at
confidence levels of 0.1. This is, again, an indication that ULIRGs may be able to form few
giant ellipticals.
6. A picture of the MBH-σ relation time evolution
The size of a black hole seems to be closely linked to the depth of the potential well
in which it forms and grows (Ferrarese & Merritt 2000). This is reflected i.e. in the local
MBH − σ relation, the correlation between MBH and the stellar dispersion in the bulge of the
host galaxy (Ferrarese & Merritt 2000; Gebhardt et al. 2000). Since the MBH − σ relation
is found for (virialized) bulge systems, it should be valid at the end of the merger process,
when the bulge stellar kinematics have reached their final dynamical state and AGN winds
and supernovae feedback have expelled the gas away from the nucleus, preventing further
BH growth, terminating the starburst phase, and making the system resemble an elliptical
galaxy. The merger remnants in the simulations of Di Matteo et al. (2005) and Springel
et al. (2005) are able to reproduce the MBH − σ relation by subjecting a portion of their
interstellar gas to accretion and feedback.
For ULIRGs however, the conversion of the host velocity dispersion into MBH carries
the uncertainty of applying the MBH − σ relation to systems out of dynamical equilibrium.
It is not yet known if, or to what extent, the MBH − σ relation is valid between the first
encounter and shortly (. 108 yrs) after the final coalescence, when most of the ultraluminous
infrared activity occurs.
To investigate whether merging disk galaxies fall on the MBH − σ relation during some
interaction phases, we ran gas-rich merger simulations (details to be presented in Naab et
al. 2006, in preparation) that have already been discussed briefly in Paper I. To include the
effects of a dissipative component we replaced 10% of the stellar mass in the initial disks
with isothermal gas at a temperature of approximately 10000K. The initial scale length of
the gas disk was equal to that of the stellar disk, h. Each galaxy had a stellar bulge with
1/3 of the disk mass and was embedded in a pseudo-isothermal halo to guarantee a flat
rotation curve at large radii. All galaxies approached each other on nearly parabolic orbits
with a pericenter distance of two disk scale lengths. The evolution of the stars and the
gas was computed with the N-body smoothed-particle-hydrodynamics code VINE using an
isothermal equation of state for the gas. For this study we analyzed mergers with 16 different
initial disk orientations (geometries 1-16 of Naab & Burkert 2003) and mass ratios 1:1 and
3:1.

– 14 –
We analyzed snapshots in the orbital plane approximately every half-mass rotation
period of the more massive disk to follow the time evolution of the (projected) central
stellar velocity dispersion and the gas accretion history onto the center of the system. At
each snapshot, we calculated MBH from the velocity dispersion assuming that the MBH − σrelation is always valid. As in Paper I, we used the Tremaine et al. (2002) formula MBH =
1.35× 10⁸[σ/200]4.02M, where σ is in units of km s−1, to calculate the black hole masses.
To quantify the gas accretion, we computed the total gas mass Mgas that has ever reached a
radius of 0.1h (i.e. twice the resolution element of the simulations) around the mass center
of the system. By calculating the ratio between the quantities MBH and Mgas we derive the
accretion efficiency ε that is needed to maintain the black hole mass on the Tremaine et al.
(2002) formula at any time. We define accretion efficiency ε as the fraction of the gas that
accretes onto the black hole from the gas accumulated into the nuclear region.
In Fig. 7 we show the evolution of the accretion efficiency (needed to keep the black
hole on the MBH − σ relation) as a function of time (left column) and nuclear separation
(right column). The efficiency is averaged over the 16 initial geometries for 1:1 and 3:1
mergers (upper and lower panels). The diagonally shaded area indicates the spread due to
the varying initial disk geometries.
According to the left panels of Fig. 7, before nuclear coalescence, the estimated black
hole mass and the gas accumulated at the center of the simulation already scale linearly. In
other words, if we assume that the MBH − σ relation is valid at any time during the merger,
then the accretion efficiency remains constant shortly after the first encounter (shown in
vertical dashes) until relaxation. Vice-versa, if we assume that the MBH − σ relation is only
valid at relaxation and that ε stays constant during the merger, then the black hole mass can
be computed from the MBH − σ relation until close to first encounter (backwards in time).
Assuming that the MBH − σ relation is valid at relaxation is reasonable since the remnants
are young elliptical galaxies.
In the right panels of Fig. 7, the “folding” of the efficiency ε at large nuclear separations
is due to the fact that the galaxies move towards apogalacticon before they fall back together.
Clearly, at these merger phases, the use of the MBH − σ relation can be misleading. For
a constant ε, the MBH − σ relation begins to be valid beyond 5 disk scale lengths, which
corresponds to a nuclear separation∼7 kpc for our ULIRGs (see Paper I). If the assumption of
a constant ε holds, the black hole estimates for ∼ 2/3 of the binary sources may be considered
realistic (but still lower limits on their actual values). For the ULIRG remnants, computing
BH masses from stellar dispersions seems also plausible. This is further supported by the fact
that the kinematics of the latter are expected to have almost settled to their relaxation values
(Mihos 2000). We acknowledge, however, that the efficiency ε may drastically vary during

– 15 –
accretion events; therefore all black hole estimates calculated from the MBH − σ relation are
carrying this uncertainty.
7. Discussion on the black hole mass evolution
We calculate the individual black hole masses of the sources in our sample using the
Tremaine et al. (2002) formula and tabulate the results in Table 3. Since our sources are
still in an ultraluminous IR emission phase, gas and dust are still present in the nuclear
region and will continue accreting onto the black hole. However, beyond coalescence, the
timescales for further gas accretion onto the black hole are probably shorter than those of
the pre-coalescence stabursts (e.g. Springel et al. 2005). Therefore, the black hole masses
of the fully relaxed systems will be somewhat larger than those presented in Table 3. Simple
gas content (typical gas mass of ULIRGs is 5 × 10⁹ M; Downes & Solomon 1998) and
accretion efficiency (0.01, see § 6) arguments indicate that the additional increase of the
remnant BH masses will not exceed 108 M by the time the ultraluminous activity ends.
In this order-of-magnitude calculation we have ignored the fact that only part of the gas
reaches (or remains in) the center of the merging system, further reducing the upper limit
on the black hole mass.
We calculate the BH mass each source would have, if it were accreting at the Eddington
rate (LEdd/L = 3.8×10⁴MEdd/M). To calculate the Eddington BH mass MEdd, we assign
to the Eddington luminosity LEdd half of the luminosity emitted in the IR (Genzel et al.
1998; Sanders & Mirabel 1996), given that some ULIRGs are largely starburst- while others
are AGN- powered. The Eddington efficiency ηEdd, the ratio of the Eddington over the
dynamical black hole mass, is given in Table 3. The mean Eddington efficiency of the
merged-ULIRG sample is 0.93, with a wide spread of values. While statistically appropriate,
the assumption that 50% of the IR luminosity originates from the AGN may make some
sources appear as if accreting at super-Eddington rates (see Table 3). If we assign ηEdd=1
for these sources and recalculate the average efficiency, we find it to be 0.51.
The inferred accretion rates may be higher than in reality if an overestimated fraction
of the IR emission is assigned to the AGN. This could occur, if for example, the starburst is
still the dominant source of the IR luminosity after the merging nuclei coalesce. The relative
strengths of the starburst (LSB) and the AGN (LAGN) luminosity at each merger phase are
uncertain. However, the MIR ISO spectroscopic study of local ULIRGs by Genzel et al.
(1998) and Rigopoulou et al. (1999) indicates that most ULIRGs are starburst dominated
systems, implying that probably less than 50% of the IR luminosity should be assigned
to the AGN. Furthermore, simulations predict that strong starburst episodes precede high

– 16 –
accretion-rate phases (see Mihos & Hernquist 1996, Springel et al. 2005, Di Matteo et
al. 2005). Observations (Veilleux et al. 2002) indicate that the strength of nuclear
(continuum) emission increases with decreasing nuclear separation. Therefore, the Eddington
efficiencies of the progenitors presented in Paper I may be systematically overestimated
compared to those of the remnants. Future papers presenting SPITZER MIR spectroscopy
of local ULIRGs will indicate the appropriate luminosity fraction that needs to be assigned
to the AGN for ULIRGs before and after nuclear separation.
8. Conclusions
We have acquired spectroscopic H-band, long-slit, data of 54 ULIRGs at a variety of
merger phases to trace the evolution of their host dynamical properties. We find that:
1. Indications of an increase of the stellar random motions exist as the merger ad-
vances. The mean stellar σ, as measured from the CO rovibrational bandheads, equals
143 km s−1 for the binary sources (of mean nuclear separation 8.0 kpc, including I-
RAS 00456-2904) and 157 km s−1 for the remnants. This difference in the means of
the pre- and post- coalescence distributions is marginally significant and requires more
data to be accurately constrained. Furthermore, any increase of the stellar disper-
sion observed in ULIRGs corresponds to only a part of the dynamical heating that
occurs during the merger, since the merger timescales are longer than those of the
ultraluminous starburst.
2. The dynamical and structural properties of the remnants indicate that they originate
from mergers mainly of 1:1 and 2:1 progenitor mass ratios. This confirms what we
found in Paper I by directly measuring the masses of the individual progenitors of
binary ULIRGs.
3. Ultraluminous mergers will mainly lead to the formation of moderate mass ellipticals
(of stellar mass ∼1011M). Depending on the definition of m∗, ULIRGs are between
sub- and ∼ m∗. ULIRGs are located in a region of the fundamental plane of early-type
galaxies different from that of local giant Es, possibly indicating a different formation
history for the latter. Local mass and dispersion functions support this argument;
however, the current statistics cannot exclude the formation of few giant Es from
ULIRGs.
4. We have performed simulations to investigate whether a black hole mass-host dispersion
relation may be used to calculate the black hole masses of our ULIRGs. We find that

– 17 –
already before nuclear coalescence, the mass of the gas that falls into the center of the
merging system scales linearly with the black hole mass predicted by the MBH − σrelation. However, this is only true if the efficiency of gas accretion onto the BH from
its surroundings remains constant with time.
5. The black hole masses of the merged ULIRGs are of the order 107-108M and their
accretion rates are high (Eddington efficiencies often > 0.5). If the AGN luminosity
output of a ULIRG nucleus increases with time, our accretion rates in pre-coalescence
ULIRGs may be overestimated relative to post-coalescence ULIRGs.
We are grateful to N. Scoville for providing us H-band NICMOS imaging data for two of
our sources and D. C. Kim for frequently giving us prior-to-publication NICMOS photometric
results for several sources. We would like to thank the ESO VLT staff for their support both
in the service and visitor mode data acquisition. A. J. Baker acknowledges support from the
National Radio Astronomy Observatory, which is operated by Associated Universities, Inc.,
under cooperative agreement with the National Science Foundation.

– 18 –
REFERENCES
Baes, M. & Dejonghe, H. 2002, MNRAS, 335, 441
Bell, E. F., McIntosh, D. H., Katz, N., Weinberg, M. D. 2003, ApJS, 149, 289
Bender, R. 1990, A&A, 229, 441
Bender, R., Burstein, D., & Faber, S. M. 1992, ApJ, 399, 462
Bendo, G. J., & Barnes, J. E. 2000, MNRAS, 316, 315
Bertin, E., & Arnouts, S. 1996, A&AS, 117, 393
Binney J., & Tremaine S. 1987, Galactic Dynamics, Princeton Univ. Press.
Bryant, P. M., & Scoville, N. Z. 1999, AJ, 117, 2632
Burkert, A. & Naab, T. 2005, MNRAS, 363, 597
Canalizo, G., & Stockton, A. 2001, ApJ, 555, 719
Cappellari, M., et al. 2005, in press, astro-ph/0505042
Cappellari, M., et al. 2005, in press, astro-ph/0509470
Cole, S., et al. 2001, MNRAS, 326, 255
Colina, L., Arribas, S., Monreal-Ibero, A. 2005, ApJ, 621, 725
Dasyra, K. M., Tacconi, L. J., Davies, R.I., Lutz, D., Genzel, R., Burkert, A., Veilleux, S.
& Sanders, D. 2005, ApJ, in press (astro-ph/0510670)
Di Matteo, T., Springel, V., & Hernquist, L. 2005, Nature, 433, 604
Djorgovski, S., & Davis, M. 1987, ApJ, 313, 59
Duc P.-A., Mirabel, I.F., & Maza, J. 1997, A&AS, 124, 533
Downes, D., & Solomon, P.M. 1998, ApJ, 507, 615
Dressler, A., Lynden-Bell, D., Burstein, D., Davies, R. L., Faber, S. M., Terlevich, R., &
Wegner, G. 1987, ApJ, 313, 42
Dunlop, J. S, McLure, R. J., Kukula, M. J., Baum, S. A., O’Dea, C. P., & Hughes, D. H.
2003, MNRAS, 340, 1095

– 19 –
Faber, S. M., et al. 1997, AJ, 114, 1771
Ferrarese, L., & Merritt, D. 2000, ApJ, 539, L9
Gao, Y., & Solomon, P. M. 1999, ApJ, 512, L99
Gebhardt, K. et al. 2000, ApJ, 543, L5
Genzel, R., Lutz, D., Sturm, E., Egami, E., Kunze, D., Moorwood, A. F. M., Rigopoulou,
D., Spoon, H. W. W., Sternberg, A., Tacconi-Garman, L. E., Tacconi, L., & Thatte,
N. 1998, ApJ, 498, 579
Genzel, R., Tacconi, L. J., Rigopoulou, D., Lutz, D., & Tecza, M. 2001, ApJ, 563, 527
Hernquist, L. 1993, ApJ, 409, 548
James, P., Bate, C., Wells, M., Wright, G., & Doyon, R. 1999, MNRAS, 309, 585
Kauffmann, G.; White, S. D. M. 1993, MNRAS, 261, 921
Khochfar, S., Burkert, A. 2003ApJ, 597L, 117
Kim, D.-C., Veilleux, S., & Sanders, D. B. 2002, ApJS, 143, 277
Kochanek, C. S., et al. 2001, ApJ, 560, 566
Kormendy, J., Sanders, D. B. 1992, ApJ, 390L, 53
Le Fevre, O., et al. 2000, MNRAS, 311, 565
Lutz, D., Veilleux, S., & Genzel, R. 1999, ApJ, 517L, 13
Mihos, J. C., & Hernquist, L. 1996, ApJ, 464, 641
Mihos, J. C. 1999, Ap&SS, 266, 195
Mihos, J. C. 2000, ASPC, 197, 275
Moorwood, A. F. M., et al. 1998, Messenger, 94, 7
Naab, T., & Burkert, A. 2003, ApJ, 597, 893
Pahre, M. A. 1999, ApJS, 124, 127
Pizzella, A., Corsini, E. M., Dalla Bonta, E., Sarzi, M., Coccato, L., Bertola, F. 2005, ApJ,
631, 785

– 20 –
Rigopoulou, D., Spoon, H. W. W., Genzel, R., Lutz, D., Moorwood, A. F. M., & Tran, Q.
D. 1999, AJ, 118, 2625
Rothberg, B., & Joseph, R. D. 2005, astro-ph/0510019
Rupke, D. S., Veilleux, S., & Sanders, D. B. 2002, ApJ, 570, 588
Rupke, D. S., Veilleux, S., & Sanders, D. B. 2005, ApJS, 160, 115
Rupke, D. S., Veilleux, S., & Sanders, D. B. 2005, ApJ, 632, 751
Sanders, D. B., & Mirabel, I. F. 1996, ARA&A,34,749
Sanders, D. B., Mazzarella, J. M., Kim, D.-C., Surace, J. A., Soifer, B. T. 2003 AJ, 126,
1607
Schmidt, M. & Green, R. 1983, ApJ, 269, 352
Scoville, N. Z., Evans, A. S., Thompson, R., Rieke, M., Hines, D. C., Low, F. J., Dinshaw,
N., Surace, J. A., & Armus, L. 2000 AJ, 119, 991
Sheth, R. K., et al. (2003), ApJ, 594, 225
Shier, L. M., & Fischer, J. 1998, ApJ, 497,163
Silge, J., & Gebhardt, K. 2003, AJ, 125, 2809
Springel, V., Di Matteo, T., & Hernquist, L. 2005, MNRAS, 361, 776
Tacconi, L. J., Genzel, R., Lutz, D., Rigopoulou, D., Baker, A. J., Iserlohe, C., & Tecza, M.
2002, ApJ, 580, 73
Tecza, M., Genzel, R., Tacconi, L. J., Anders, S., Tacconi-Garman, L. E., & Thatte, N.
2000, ApJ, 537, 178
Thomas, D., Maraston, C., Bender, R., de Oliveira, C. M. 2005, ApJ, 621, 673
Tremaine, S., Gebhardt, K., Bender, R., Bower, G., Dressler, A., Faber, S. M., Filippenko,
A. V., Green, R., Grillmair, C., Ho, L. C., Kormendy, J., Lauer, T. R., Maggorian,
J., Pinkney, J., & Richstone, D. 2002 ApJ, 574, 740
Veilleux, S., Kim, D.-C., & Sanders, D. B. 2002, ApJS, 143, 315
Veilleux, S., et al. 2006, ApJ, submitted
This preprint was prepared with the AAS LATEX macros v5.2.

– 21 –
Table 1. List of ULIRG remnants
Galaxy RA Dec z log(LIR/L) slit P.A. tintegration
(IRAS) (2000) (2000) () (mins)
00091−0738 00:11:43.3 −07:22:08 0.118 12.19 17,106 60,6000262+4251 a 00:28:54.0 +43:08:18 0.0927 12.02 45,0 20,6000397−1312 00:42:15.5 −12:56:04 0.262 12.90 -1,89 120,12000456−2904 a,b 00:48:06.8 −28:48:19 0.110 12.12 30 4001004−2237 01:02:49.9 −22:21:57 0.118 12.24 -1,89 60,6001388−4618 a 01:40:55.9 −46:02:53 0.090 12.03 0,90 40,40
01572+0009 (Mrk 1014) a 01:59:50.2 +00:23:41 0.163 12.53 20, -70 80, 6002021−2103 02:04:27.3 −20:49:41 0.116 12.01 53,142 60,6004103−2838 04:12:19.5 −28:30:24 0.117 12.55 89 6004313−1649 04:33:37.1 −16:43:32 0.268 12.55 -1,89 120,12005189−2524 05:21:01 −25:21:46 0.043 12.09 -1,89 200,16009039+0503 09:06:34.2 +04:51:25 0.125 12.07 -1,89 60,6009111−1007 09:13:38.8 −10:19:20 0.054 11.95 34,124 120,6011223−1244 11:24:50 −13:01:13 0.199 12.59 -1,89 80,80
12540+5708 (Mrk 231) a 12:56:14.2 −56:52:25 0.042 12.50 10,-30,-80 40,40,4013428+5608 (Mrk 273) a 13:44:42.1 −55:53:13 0.037 12.13 15,95 40,40
14070+0525 14:09:31.3 +05:11:31 0.264 12.76 -1,89 120,12014378−3651 a 14:40:58.9 −37:04:33 0.068 12.24 -45 8015130−1958 15:15:55.2 −20:09:17 0.109 12.09 -171,-81 80,11015250+3609 a 15:26:59.4 −35:58:38 0.055 11.99 45, -45 40,4015462−0450 15:48:56.8 −04:59:34 0.100 12.16 179,-91 180,16017208−0014 a 17:23:21.9 −00:17:00 0.0428 12.33 90,120 30, 3020087−0308 a 20:11:23.2 −02:59:54 0.106 12.40 -45,45 40,4020414−1651 20:44:18.2 −16:40:16 0.087 12.26 54,144 100,8020551−4250 a 20:58:26.9 −42:39:06 0.0428 11.98 -45,45 60,6021219−1757 21:24:41.6 −17:44:46 0.112 12.06 -1,89 50,4021504−0628 21:53:05.5 −06:14:50 0.078 11.92 -39,59 60,6023230−6926 23:26:03.6 −69:10:19 0.106 12.17 -1,89 60,6023365+3604 a 23:39:01.3 +36:21:10 0.0645 12.09 45, -30 15, 4023578−5307 a 00:00:23.6 −52:50:28 0.125 12.10 107,14 60, 40

– 22 –
Note. — The coordinates, the redshift, the bolometric luminosity, as well as the position anglesand respective integration time for our sources are presented in this Table.
aSources presented in Genzel et al. (2001) and Tacconi et al. (2002).
bAccording to the imaging analysis of Kim et al. (2002) and Veilleux et al. (2006) this sourceprobably is a binary system at projected nuclear separation of 20.7 kpc. The redshift of the NEnucleus is not spectroscopically confirmed but its ambiguous morphology indicates an interaction.The data presented in this paper are for the more luminous (late-type-host) SW nucleus.

– 23 –
Table 2. ULIRG structural parameters
Galaxy Reff(H band) ellipticity φα(IRAS) (kpc) ()
00091−0738 a 2.47(±0.21) 0.220 1500262+4251 b · · · · · · · · ·00397−1312 c 2.04 (±0.76) 0.35 -2500456−2901 a 2.09 (±0.15) 0.067 -8801004−2237 c 0.40 (±0.07) 0.02 2601388−4618 a 1.62 (±0.03) 0.074 5501572+0009 a 1.31 (±0.10) 0.140 8102021−2103 c 5.38 (±3.95) 0.34 104103−2838 c 1.61 (±0.12) 0.19 -8004313−1649 c 4.04 (±0.89) 0.26 8605189−2524 c 0.57 (±0.08) 0.06 7709039+0503 c 1.62 (±0.90) 0.15 -1809111−1007 a 2.18 (±0.36) 0.397 -2611223−1244 a 3.83 (±0.38) 0.101 7012540+5708 c 1.40 (±0.21) 0.08 -1113428+5608 d 1.03 (±1.03) 0.498 -7714070+0525 c 3.62 (±0.53) 0.17 -1914378−3651 a 0.36 (±0.02) 0.031 2015130−1958 c 1.62 (±0.27) 0.23 -8815250+3609 d 1.10 (±0.09) 0.207 -7215462−0450 c 5.57 (±1.38) 0.048 6217208−0014 a 1.69 (±0.08) 0.196 5420087−0308 a 1.87 (±0.22) 0.324 -8620414−1651 c 1.37 (±0.47) 0.67 320551−4250 a 1.32 (±0.25) 0.113 8421219−1757 c 4.19 (±3.29) 0.14 -5021504−0628 a 1.95 (±0.26) 0.164 1223230−6926 a 2.03 (±0.25) 0.177 4123365+3604 b · · · · · · · · ·23578−5307 a 3.96 (±1.36) 0.447 -80

– 24 –
aThe ULIRG structural parameters derivedfrom the H-band acquisition images.
bFor the sources observed using NIRSPEC andthe slit monitoring camera, the structural param-eters are not extracted; the slit projection drawnon the acquisition image does not allow for photo-metric analysis.
cData taken from H-band NICMOS imaging byVeilleux et al. (2006, submitted). Effective radiiare converted to our cosmology.
dParameters extracted from NICMOS imagingdata (at 1.6 µm), kindly provided to us by NickScoville (see Scoville et al. 2000).

– 25 –
Table 3. Stellar velocities and resulting black hole masses
Source σ Vrot(obs) a Vrot(obs)/σ MBHb MBH(Edd.) c ηEdd
d
(IRAS) (km s−1) (km s−1) (M) (M)
00091−0738 131 (± 39) · · · · · · 2.46× 10⁷ 2.04× 10⁷ 0.8300262+4251 e 170 (± 15) · · · · · · 7.02× 10⁷ 1.32× 10⁷ 0.1900397−1312 106 (± 26) 49 (± 17) 0.46 1.05× 10⁷ 1.05× 10⁸ 9.9400456−2901 162 (± 25) 45 (± 10) 0.28 5.79× 10⁷ 1.73× 10⁷ 0.3001004−2237 132 (± 29) 22 (± 13) 0.17 2.54× 10⁷ 2.29× 10⁷ 0.9001388−4618 144 (± 10) 130 (± 15) 0.90 3.60× 10⁷ 1.32× 10⁷ 0.3701572+0009 200 (± 60) · · · · · · 1.35× 10⁸ 4.46× 10⁷ 0.3302021−2103 143 (± 21) 42 (± 10) 0.29 3.50× 10⁷ 1.35× 10⁷ 0.3804103−2838 129 (± 40) 4 (± 5) 0.03 2.32× 10⁷ 1.86× 10⁷ 0.8004313−1649 157 (± 21) 31 (± 27) 0.20 5.10× 10⁷ 4.67× 10⁷ 0.9205189−2524 137 (± 16) 70 (± 14) 0.51 2.95× 10⁷ 1.62× 10⁷ 0.5509039+0503 183 (± 38) · · · · · · 9.45× 10⁷ 1.55× 10⁷ 0.1609111−1007 112 (± 18) 68 (± 16) 0.61 1.31× 10⁷ 9.53× 10⁶ 0.7311223−1244 149 (± 27) · · · · · · 4.13× 10⁷ 5.12× 10⁷ 1.2412540+5708 120 (± 10) 25 (±10) 0.21 1.73× 10⁷ 4.16× 10⁷ 2.4013428+5608 285 (± 30) 110 (±20) 0.39 5.61× 10⁸ 1.66× 10⁷ 0.0314070+0525 139 (± 21) 54 (± 19) 0.39 3.13× 10⁷ 7.57× 10⁷ 2.4214378−3651 153 (± 10) 15 (±10) 0.10 4.60× 10⁷ 1.66× 10⁷ 0.3615130−1958 177 (± 39) 33 (± 21) 0.19 8.26× 10⁷ 1.62× 10⁷ 0.2015250+3609 150 (± 10) 60 (±15) 0.40 4.25× 10⁷ 1.32× 10⁷ 0.3115462−0450 169 (± 38) · · · · · · 6.86× 10⁷ 1.90× 10⁷ 0.2817208−0014 229 (± 15) 110 (± 20) 0.48 2.33× 10⁸ 2.63× 10⁷ 0.1120087−0308 219 (± 14) 50 (± 15) 0.23 1.94× 10⁸ 3.31× 10⁷ 0.1720414−1651 187 (± 32) 96 (± 38) 0.51 1.03× 10⁸ 1.82× 10⁷ 0.1820551−4250 140 (± 15) 40 (± 10) 0.29 3.22× 10⁷ 1.32× 10⁷ 0.4121219−1757 121 (± 11) · · · · · · 1.79× 10⁷ 1.51× 10⁷ 0.8421504−0628 90 (± 31) 9 (± 28) 0.10 5.45× 10⁶ 8.30× 10⁶ 1.5223230−6926 143 (± 14) 23 (± 13) 0.16 3.50× 10⁷ 1.44× 10⁷ 0.4123365+3604 e 145 (± 15) · · · · · · 3.71× 10⁷ 1.62× 10⁷ 0.4423578−5307 190 (± 70) · · · · · · 1.10× 10⁸ 1.66× 10⁷ 0.15
Note. — The stellar central velocity dispersion, rotational velocity, and the Vrot/σ ratio arederived from the spectra of Fig. 1 with the aid of the parameters of Table 2. The dynamicaland Eddington black hole mass of each ULIRG and the ratio of the two are also presentedhere.

– 26 –
aThe observed rotational velocity value presented in this column is corrected for angulardeviations from the major axis of rotation but not for inclination effects.
bDynamical black hole masses estimated from their relation to the bulge dispersion(Tremaine et al. 2002).
cEddington black hole mass, calculated by attributing 50% of LIR to the AGN.
dRatio of Eddington over dynamical black hole mass.
eThe rotational velocity measured by Genzel et al. (2001) for these sources is an upperlimit.

– 27 –
Fig. 1.— The H-band spectra of the ULIRG remnants from this study. The stellar template,
convolved with Gaussians that represent the LOS broadening function of the sources, is
overplotted as a solid line. All spectra are shifted to rest frame.
– 28 –
Fig. 1 continued.

– 29 –
Fig. 2.— The distributions of stellar dispersions in ULIRGs before and after nuclear coales-
cence.

– 30 –
Fig. 3.— Ratio of observed rotational over dispersion velocity versus ellipticity for merger
remnants (from Naab & Burkert 2003). Each panel corresponds to mergers of different
progenitor mass ratios (cases from 1:1 to 4:1 are studied). The bold line, solid line, and
dotted contours indicate the position of the diagram where mergers of each category are
expected to be found at 90%,70%, and 50% probability levels respectively. The squares
and open diamonds correspond to boxy and disky ellipticals. The dashed line shows the
theoretical values for an oblate isotropic rotator. ULIRG remnants are shown as stars.

– 31 –
Fig. 4.— The Reff -σ projection of the K-band early-type galaxies fundamental plane. The
ULIRGs are plotted as triangles. The data for the giant boxy and moderate-mass disky
Es (squares and circles respectively) are taken from Bender et al. (1992) and Faber et al.
(1997). More (cluster) Es (open circles) are from Pahre (1999) and LIRGs (diamonds) from
Shier & Fischer (1998) and James et al. (1999).
Fig. 5.— The 3-dimensional view of the (K-band) fundamental plane of early-type galaxies.
The symbols used are identical to those in Fig. 4. In the left panel we use the magnitudes
of Kim et al. (2002), while in the right panel those of Veilleux et al. (2006), where the
nuclear PSF has been removed. Extinction corrections have been applied in both cases.

– 32 –
Fig. 6.— The number density of sources as a function of their stellar velocity dispersion
is plotted in this figure. The solid line corresponds to the number density per σ of SDSS
ellipticals, computed from their dispersion function (Sheth et al. 2003). The number
density per σ of ULIRG remnants, plotted as a histogram, is calculated by multiplying the
% fraction of our remnants that resides in each σ bin with the local volume density of
ULIRGs from Sanders et al. (2003). To facilitate the comparison, the ULIRG histogram
is further normalized so that its mean has the same number density as that of the elliptical
n(σ) distribution.

– 33 –
Fig. 7.— Evolution, during a disk-galaxy merger, of the average black-hole mass inferred
from the central (line-of-sight) stellar velocity dispersion of the simulated galaxies. The
black hole mass is in units of the average total accreted gas mass onto the center of the
simulations. In the left column, the evolution is given as a function of time. Time is plotted
in units of the half-mass rotation period, T1/2, of the more massive progenitor disk. Open
squares represent disks that are still separated, filled dots indicate fully merged systems. The
spread originating from the initial disk orientations is indicated by the diagonally shaded
area. The vertically shaded area indicates the first data point after the first encounter. In the
right column, the evolution is plotted as a function of nuclear separation of the interacting
galaxies. The nuclear separation unit is the disk scale length h of the more massive disk.
Only data points after the first encounter have been plotted. In both columns, 1:1 mergers
are shown in the upper and 3:1 mergers in the lower panel.