
Dynamic tests of SRIM fluid viscous dampersdb.nzsee.org.nz/2017/O3B.6_Feng.pdf · F CV (1) where F...
7
Dynamic tests of SRIM fluid viscous dampers 2017 NZSEE Conference D. FENG & Y. SASAKI Fujita Corp., Tokyo, Japan. N. YAMAZAKI & M. ISHIYAMA Nippon Chuzo Co., Ltd., Kawasaki, Japan W. ZHU Shanghai Research Institute of Materials, Shanghai, China. ABSTRACT: Fluid viscous dampers having rich energy dissipation capacity have been widely used in building and bridge structures. SRIM fluid viscous dampers have been used in over hundred projects worldwide. For the Japanese market demand of velocity exponent coefficient with the range of 0.1 to 0.3, we conducted fundamental property tests at first using the same damper model according Japanese regulations. Then we conducted temperature dependent tests and cycle fatigue tests under earthquake and wind loads respectively. We also conducted over-design large velocity tests and long duration fatigue tests based on real earthquake record. The dampers worked well as design in all tests. The low velocity test was conducted to make sure the resistance is small enough at extremely low velocity. 1 INTRODUCTION In the 2011 earthquake off the Pacific coast of Tohoku (Mw=9.0) occurred on 11 March 2011 in Japan, the earthquake lasted about longer than five minutes. In the 2016 Kumamoto earthquake, there occurred two earthquakes having JMA Intensity 7 at one day interval. Viscous dampers have to keep good performance and continuously function well to make sure the structures safe. Shanghai Research Institute of Materials (SRIM) has manufactured viscous dampers for about 20 years (Qian, F., et al., 2012). SRIM fluid viscous dampers have been used in over hundred projects in China, Japan, Taiwan and South Korea etc. world widely. Fluid viscous dampers having velocity exponent coefficient of 0.1(Yamazaki, N., et al., 2014) to 0.3(Sasaki, Y., et al., 2007) are most popular and can be achieved by the proper blend of silicone fluid. We conducted fundamental property tests at first using the same damper model. Then we conducted temperature dependent tests and cycle fatigue tests under earthquake and wind loads respectively. We confirmed the long-time duration performance of the damper by inputting response displacement due to strong motions recorded at K-NET Sendai station. We also conducted over-design large velocity tests up to 1.5m/s and extremely low velocity test such as 0.004m/s. 2 TEST METHOD 2.1 Outline of the viscous damper An illustration of the viscous damper is shown in Figure 1. The damper is usually attached to the structure by clevises at two ends. When the piston head moves in the silicone fluid, the damping force will occur between two ends. The damping force is designed being proportional to velocity exponent shown in Equation 1. The maximum damping force can be achieved easily by adjusting the space between the cylinder and the piston head, width of the piston head. The exponent coefficient can be achieved by blend of silicone fluid. The most popular exponent coefficients are from 0.1 to 0.3. The demand to fluid viscous dampers increased more and more since they had good performance during the earthquakes. They have been widely used in new or retrofitting building and bridge structures.
Transcript of Dynamic tests of SRIM fluid viscous dampersdb.nzsee.org.nz/2017/O3B.6_Feng.pdf · F CV (1) where F...
Dynamic tests of SRIM fluid viscous dampers
2017 NZSEE Conference
D. FENG & Y. SASAKI
Fujita Corp., Tokyo, Japan.
N. YAMAZAKI & M. ISHIYAMA
Nippon Chuzo Co., Ltd., Kawasaki, Japan
W. ZHU
Shanghai Research Institute of Materials, Shanghai, China.
ABSTRACT: Fluid viscous dampers having rich energy dissipation capacity have been
widely used in building and bridge structures. SRIM fluid viscous dampers have been
used in over hundred projects worldwide. For the Japanese market demand of velocity
exponent coefficient with the range of 0.1 to 0.3, we conducted fundamental property
tests at first using the same damper model according Japanese regulations. Then we
conducted temperature dependent tests and cycle fatigue tests under earthquake and wind
loads respectively. We also conducted over-design large velocity tests and long duration
fatigue tests based on real earthquake record. The dampers worked well as design in all
tests. The low velocity test was conducted to make sure the resistance is small enough at
extremely low velocity.
1 INTRODUCTION
In the 2011 earthquake off the Pacific coast of Tohoku (Mw=9.0) occurred on 11 March 2011 in
Japan, the earthquake lasted about longer than five minutes. In the 2016 Kumamoto earthquake, there
occurred two earthquakes having JMA Intensity 7 at one day interval. Viscous dampers have to keep
good performance and continuously function well to make sure the structures safe.
Shanghai Research Institute of Materials (SRIM) has manufactured viscous dampers for about 20
years (Qian, F., et al., 2012). SRIM fluid viscous dampers have been used in over hundred projects in
China, Japan, Taiwan and South Korea etc. world widely. Fluid viscous dampers having velocity
exponent coefficient of 0.1(Yamazaki, N., et al., 2014) to 0.3(Sasaki, Y., et al., 2007) are most popular
and can be achieved by the proper blend of silicone fluid.
We conducted fundamental property tests at first using the same damper model. Then we conducted
temperature dependent tests and cycle fatigue tests under earthquake and wind loads respectively. We
confirmed the long-time duration performance of the damper by inputting response displacement due
to strong motions recorded at K-NET Sendai station. We also conducted over-design large velocity
tests up to 1.5m/s and extremely low velocity test such as 0.004m/s.
2 TEST METHOD
2.1 Outline of the viscous damper
An illustration of the viscous damper is shown in Figure 1. The damper is usually attached to the
structure by clevises at two ends. When the piston head moves in the silicone fluid, the damping force
will occur between two ends. The damping force is designed being proportional to velocity exponent
shown in Equation 1. The maximum damping force can be achieved easily by adjusting the space
between the cylinder and the piston head, width of the piston head. The exponent coefficient can be
achieved by blend of silicone fluid. The most popular exponent coefficients are from 0.1 to 0.3. The
demand to fluid viscous dampers increased more and more since they had good performance during
the earthquakes. They have been widely used in new or retrofitting building and bridge structures.

2
Figure 1. An illustration of the SRIM viscous damper.
CVF (1)
where F = damping force; C = damping coefficient; V = velocity; and = exponent coefficient
2.2 Test specimens and test schedules
We conducted various dynamic tests to confirm the performance of the viscous dampers. Dampers
having the nominal maximum damping force from 500kN to 2000kN with strokes from±100 to ±600.
The exponent coefficients from 0.1 to 0.3 are most popularly used. Due to the limitation of the paper,
the typical test specimens are shown in Table 1. The exponent velocity coefficients were designed as
0.3 and 0.1. Test schedules for VD type dampers are shown in Table 2. The dampers’ maximum
velocity values are designed from 0.05m/s to 1.0m/s by the combination of amplitude and frequency
of the excitation. Due to the test machine’s limitation, the test amplitude was usually smaller than the
designed stroke. Static tests were conducted to check the limit of the stroke. A sine wave excitation
having four (VD) or ten (NESD) cycles was used in the dynamic test. The third cycle data was used to
evaluate the performance of the damper. The velocity value was obtained from the differential of the
relative displacement between two ends. The maximum damping force and the maximum velocity
were evaluated at both compression and stretch direction.
Table 1. Test specimens.
Specimen
Design
Formulation
Stroke
(mm)
Nominal
maximum
velocity
(m/s)
Nominal
maximum
damping force
(kN)
VD-500 450 V0.3
±500/±600 1.0 500
VD-1000 900 V0.3
±500/±600 1.0 1000
VD-1600 900 V0.3
±600 1.0 1600
NESD-500 536 V0.1
±250 1.0 500
NESD-2000 2144 V0.1
±250 1.0 2000
Table 2. The maximum velocity V of test schedules for VD type dampers.
V (m/s)
A (mm)
Frequency f (Hz)
0.2 0.5 1.0 1.4
40 0.050 0.126 0.251 -
80 0.101 0.251 0.503 -
120 0.151 0.377 0.754 1.056
Piston rod Piston head
③Diameter of pin
④Length
①D
iam
ete
r
Silicone oil ②Clevis

3
3 TEST RESULTS
3.1 Fundamental properties
The fundamental properties of VD-500, VD-1000 and VD-1600 type dampers are shown in Figure 2.
At the left side, the test results are shown comparing design values with the dot lines showing 15%
dispersion from Equation (1). All test results were within ±15% of the design values. There used four
VD-500, three VD-1000 and one VD-1600 specimens, which had stroke of ±500mm or ±600mm. In
the figures, the open mark means ±500mm stroke type, while the solid mark means ±600 type. The
tests agreed very well with the design values. At the right side, the hysteresis loops, relationship
between damping force and displacement at the amplitudes of 40, 80 and 120mm as shown in Table 2,
are shown with the stiffness used in a Maxwell model, where all specimens’ stroke is ±600mm. The
stiffness takes a fixed value at different displacement or velocity for one type specimen.
(a) VD-500 (four specimens)
(b) VD-1000 (three specimens)
(c) VD-1600 (one specimen)
Figure 2. Fundamental properties of VD-500, VD-1000 and VD-1600 type dampers. The open
mark means ±500mm stroke type. The solid mark means ±600 type.

4
Figure 3. Test results at the maximum velocity values of 0.25m/s and 0.75m/s comparing with
analysis models: dashpot and Maxwell model for VD-1000±600mm type specimen.
In Figure 3, the test results at the maximum velocity values of 0.25m/s and 0.75m/s are compared with
analysis models: dashpot and Maxwell model for VD-1000±600mm type specimen. The test results
agreed well with the Maxwell model at both cases. At the dashpot model comparison, though they did
not agree well at the small displacement, it is practically useful at the large displacement.
Figure 4. Fundamental and large velocity properties of NESD-500 type damper.
Figure 5. Fundamental properties of NESD-2000 type damper.
The fundamental properties of NESD-500 and NESD-2000 type dampers are shown in Figure 4 and
Figure 5, respectively. The dampers’ maximum velocity values are designed from 0.06m/s to 1.5m/s to
confirm both the fundamental properties and over-design large velocity properties. All test results
were within ±10% of the design values. At the left side, the test results are shown comparing design
values. The tests agreed very well with the design values even at velocity values of 1.26m/s and
1.51m/s extremely larger than the designed velocity 1.0m/s. At the right side, the hysteresis loops,
relationship between damping force and displacement at the velocity of 1.51m/s, showed very stable.
We demonstrated that SRIM has the capacity to manufacture from 0.1 to 0.3 velocity exponent
viscous dampers. The dampers have stable properties even at over-design large velocity values.

5
3.2 Temperature dependent property
The silicone fluid is usually considered to have temperature dependent property. But in the SRIM
viscous damper, the silicone fluid is confined by the steel cylinder and subjected to a pre-pressure.
Thus, the viscous damper has little temperature dependent property.
We used a VD-500±500mm specimen shown in Figure 2 to conduct temperature dependent property
test. The temperature was designed at seven steps: -20,0,20,30,40,60,80℃. A sine wave excitation
which had f=0.5Hz, A=80mm (V=0.251m/s) was used at all test cases. The test results were evaluated
by the change of equivalent damping coefficient. The change was very little, showed in Figure 6 as
between -2.1% to 8.7%. The damping force increased slightly with the increasing of temperature.
Figure 6. Relationship between the change of equivalent damping coefficient and temperature.
3.3 Fatigue Test
We used the same VD-500±500mm specimen with the temperature test to conduct two type fatigue
tests: earthquake and wind loads. The test schedule is shown in Table 3. Total accumulated movement
in earthquake and wind loads was 24m and 72m, respectively. The test results are shown in Figure 7.
In the earthquake load fatigue test, the temperature at the specimen’s surface increased from 33 to
50°C , and the damping force changed less than 5%. In the wind load fatigue test, the temperature at
the specimen’s surface increased from 31 to 78°C, and the damping force changed about 8%. The
characteristics of the SRIM viscous damper changes little at both fatigue tests.
Table 3. Schedules of earthquake and wind loads fatigue test.
Load type Frequency
(Hz)
Amplitude
(mm)
Cycle
numbers
Accumulated
movement (m)
Earthquake 0.25 80 75 24
Wind 0.25 10 1800 72
Figure 7. Test results of earthquake and wind loads fatigue test.

6
3.4 Earthquake motion test
In the 2011 earthquake off the Pacific coast of Tohoku (Mw=9.0) occurred on 11 March 2011 in
Japan, the earthquake lasted about longer than five minutes. In the 2016 Kumamoto earthquake, there
occurred two earthquakes having JMA Intensity 7 at one day interval. Viscous dampers have to keep
good performance and continuously function well to make sure the structures safe.
The response of a typical bridge, having a natural period of one second, was calculated based on the
strong ground motion at Sendai station (NS direction) recorded in the earthquake. Since the stroke of
NESD-500 is 250mm, the response displacement was normalized to be used as the excitation. In
Figure 8, the response of the specimen NESD-500 is shown. The response displacement was almost
same with the input excitation. Then, velocity values were obtained from the differential of the relative
displacement. Although there was some dispersion in the small velocity range, the damping force-
velocity relationship agreed well with the design value. Total accumulated movement in this test was
up to 9.7m. The accumulated input energy was very high which was converted to heat eventually.
Although the temperature at the specimen’s surface increased from 22 to 162°C, the damping force-
displacement relationship showed very stable.
Figure 8. The response of the NESD-500 specimen.
3.5 Low velocity test
When the viscous damper is used in a bridge structure, the girder will expand or shrink very slowly
due to the thermal environment. The test is to evaluate the axial resistance of the damper. If the girder
is supposed having length of 300m, the movement will be ±18mm at the temperature change of 10°C.
The low velocity test schedule is shown in Table 4. The most slow test frequency was set to
0.00004Hz due to the limitation of the test machine.
Table 4. The low velocity test schedules for NESD-500 type damper.
Amplitude
A (mm)
Frequency f
(Hz)
Maximum
velocity (mm/s)
20
0.00004 0.005
0.0008 0.1
0.01 1.3
0.05 6.3
7
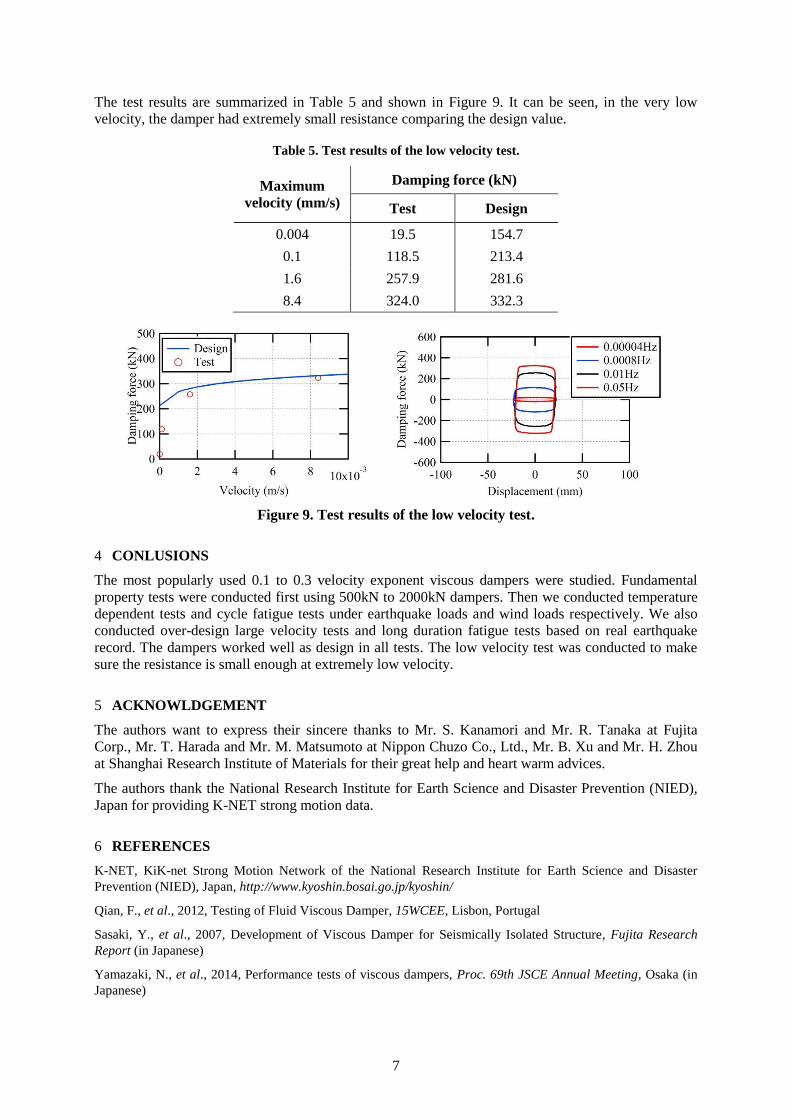
The test results are summarized in Table 5 and shown in Figure 9. It can be seen, in the very low
velocity, the damper had extremely small resistance comparing the design value.
Table 5. Test results of the low velocity test.
Maximum
velocity (mm/s)
Damping force (kN)
Test Design
0.004 19.5 154.7
0.1 118.5 213.4
1.6 257.9 281.6
8.4 324.0 332.3
Figure 9. Test results of the low velocity test.
4 CONLUSIONS
The most popularly used 0.1 to 0.3 velocity exponent viscous dampers were studied. Fundamental
property tests were conducted first using 500kN to 2000kN dampers. Then we conducted temperature
dependent tests and cycle fatigue tests under earthquake loads and wind loads respectively. We also
conducted over-design large velocity tests and long duration fatigue tests based on real earthquake
record. The dampers worked well as design in all tests. The low velocity test was conducted to make
sure the resistance is small enough at extremely low velocity.
5 ACKNOWLDGEMENT
The authors want to express their sincere thanks to Mr. S. Kanamori and Mr. R. Tanaka at Fujita
Corp., Mr. T. Harada and Mr. M. Matsumoto at Nippon Chuzo Co., Ltd., Mr. B. Xu and Mr. H. Zhou
at Shanghai Research Institute of Materials for their great help and heart warm advices.
The authors thank the National Research Institute for Earth Science and Disaster Prevention (NIED),
Japan for providing K-NET strong motion data.
6 REFERENCES
K-NET, KiK-net Strong Motion Network of the National Research Institute for Earth Science and Disaster
Prevention (NIED), Japan, http://www.kyoshin.bosai.go.jp/kyoshin/
Qian, F., et al., 2012, Testing of Fluid Viscous Damper, 15WCEE, Lisbon, Portugal
Sasaki, Y., et al., 2007, Development of Viscous Damper for Seismically Isolated Structure, Fujita Research
Report (in Japanese)
Yamazaki, N., et al., 2014, Performance tests of viscous dampers, Proc. 69th JSCE Annual Meeting, Osaka (in
Japanese)


![tripoxyMINERAL - Triag International · Logarithmic Decrement (damping) 0,035 0,004 0,0004 Coefficient of linear expansion [1/K] ca. 12x106 ca. 10x106 ca. 23x106 Tensile strength](https://static.fdocuments.in/doc/165x107/5fc1c5b6e14383042a0edf8a/tripoxymineral-triag-international-logarithmic-decrement-damping-0035-0004.jpg)