Dynamic Stability of Flared and Tumblehome Hull Forms...
14
1 Dynamic Stability of Flared and Tumblehome Hull Forms in Waves Christopher Bassler , Seakeeping Division, Naval Surface Warfare Center, Carderock Division Andrew Peters, QinetiQ Bradley Campbell, Seakeeping Division, Naval Surface Warfare Center, Carderock Division William Belknap, Seakeeping Division, Naval Surface Warfare Center, Carderock Division Leigh McCue, Aerospace and Ocean Engineering, Virginia Tech ABSTRACT A numerical seakeeping code was used to examine the influence of wave conditions, ship initial conditions, and ship operating parameters on dynamic stability events in regular and irregular waves, and assess variations in ultimate stability for changes in the center of gravity (KG) for two hull forms, flared and tumblehome. The results of this investigation aid in better understanding the influence of increased KG over the life-cycle of the ship, the ramifications of error in KG measurements, the required safety factor or error band in operator guidance, and the sensitivity of these variations to hull form geometry. KEYWORDS dynamic stability; capsize; broach; surfride; tumblehome; KG INTRODUCTION The increased desire for utilization of unconventional hull form designs necessitates improved understanding of the stability characteristics of these novel ship types. An essential component to ensuring the safety of these new ship types is a complete understanding of how stability performance for these vessels differs from conventional hulls. All vessels experience an increase in weight over the life-cycle of the ship, and often times this additional weight is placed on upper deck locations aboard a ship, leading to an increase in the height of the ship’s center of gravity (KG). Understanding the sensitivity of this increase in KG for conventional and unconventional hull forms is necessary to accurately assess the safety of a ship. In this study, a numerical seakeeping code, FREDYN 9.8, was used to examine the influence of wave conditions, ship initial conditions, and ship operating parameters on vessel capsize in regular and irregular waves, and determine the sensitivity of capsize to changes in the KG for two topside configurations. The investigation consisted of two parts, in regular and random seas, which were used to examine dynamic stability events and the interrelationship of KG and hull form geometry with various headings, speeds, and initial conditions.
Transcript of Dynamic Stability of Flared and Tumblehome Hull Forms...

1
Dynamic Stability of Flared and Tumblehome Hull Forms in Waves
Christopher Bassler, Seakeeping Division, Naval Surface Warfare Center, Carderock Division
Andrew Peters, QinetiQ
Bradley Campbell, Seakeeping Division, Naval Surface Warfare Center, Carderock Division
William Belknap, Seakeeping Division, Naval Surface Warfare Center, Carderock Division
Leigh McCue, Aerospace and Ocean Engineering, Virginia Tech
ABSTRACT
A numerical seakeeping code was used to examine the influence of wave conditions, ship initial conditions, and ship operating parameters on dynamic stability events in regular and irregular waves, and assess variations in ultimate stability for changes in the center of gravity (KG) for two hull forms, flared and tumblehome. The results of this investigation aid in better understanding the influence of increased KG over the life-cycle of the ship, the ramifications of error in KG measurements, the required safety factor or error band in operator guidance, and the sensitivity of these variations to hull form geometry.
KEYWORDS
dynamic stability; capsize; broach; surfride; tumblehome; KG
INTRODUCTION
The increased desire for utilization of unconventional hull form designs necessitates improved understanding of the stability characteristics of these novel ship types. An essential component to ensuring the safety of these new ship types is a complete understanding of how stability performance for these vessels differs from conventional hulls. All vessels experience an increase in weight over the life-cycle of the ship, and often times this additional weight is placed on upper deck locations aboard a ship, leading to an increase in the height of the ship’s center of gravity (KG). Understanding the sensitivity of this increase in KG for conventional and
unconventional hull forms is necessary to accurately assess the safety of a ship. In this study, a numerical seakeeping code, FREDYN 9.8, was used to examine the influence of wave conditions, ship initial conditions, and ship operating parameters on vessel capsize in regular and irregular waves, and determine the sensitivity of capsize to changes in the KG for two topside configurations. The investigation consisted of two parts, in regular and random seas, which were used to examine dynamic stability events and the interrelationship of KG and hull form geometry with various headings, speeds, and initial conditions.

MODEL GEOMETRY
The Office of Naval Research (ONR) Topside Series hull forms were designed for the purpose of providing a publicly available hull form which could be used to examine resulting differences from varying topside geometry, particularly for conventional and novel topside designs. The hulls feature a common naval combatant-type hull form below the design waterline. The above-waterline geometry consists of three topside configurations: wall-side (ONRWS), flared (ONRFL), and tumblehome (ONRTH). For this investigation the ONRFL and ONRTH hulls (Figures 1 and 2) were used to examine the impact of topside geometry on the risk of dynamic instability of a vessel in regular and random seas.
Fig. 1: ONR Topside Series Hull Forms- ONRFL (top) and ONRTH.
Fig. 2: Section View of ONRFL (left) and ONRTH.
Table 1: Ship Principle Dimensions for ONR Topside Series Hull Forms
Length 154 m
Beam 18.8 m
Draft 5.5 m
Displacement 8790 tonnes
LCB (aft of FP) 79.6 m
KM 9.74 m
NUMERICAL SIMULATIONS
Simulations of the ONRFL and ONRTH in regular and random seas were performed using FREDYN 9.8. FREDYN is a blended method maneuvering and seakeeping code (linear hydrodynamic forces, body-exact Froude-Krylov and hydrostatic forces) developed by the Cooperative Research Navies (McTaggart and de Kat). Computations were performed on Linux clusters at both NSWCCD and QinetiQ. Capsize and other dynamic stability events including broaching, mild-broaching, and surfriding, were investigated at incremental KG values (Table 2) in both regular and random seas. Radii of gyration were equal between both geometries and held constant across all KG values. Table 2: ONRFL and ONRTH Numerical Loading
Conditions
Hull Form* KG (m)
ONRTH 6.25
ONRTH 6.5
ONRTH 6.75
ONRTH 7
ONRFL, ONRTH 7.25
ONRFL, ONRTH 7.75
ONRFL, ONRTH 8
ONRFL, ONRTH 8.25
ONRFL, ONRTH 8.5
ONRFL, ONRTH 8.75
ONRFL 9
ONRFL, ONRTH 9.25
ONRFL, ONRTH 9.5
ONRFL 9.6
* Italicized values indicate additional values included for the random seas study
2

3
Regular Seas
A systematic investigation of capsize was performed for varied ship roll/roll velocity initial conditions, at incremental KG values (Table 2), in stern-quartering seas. The study was conducted for a ship with constant forward speed in regular waves of varying steepness and for a constant wavelength to ship length ratio (Table 3). Simulations were performed for both the ONRFL and ONRTH hull forms. Table 3: Regular Seas Input Parameters
Parameter Value Increment
Initial Roll -88 to 88 deg
1 deg
Initial Roll Velocity -50 to 50 deg/s
1 deg/s
Heading 45 deg Constant
Speed (Fn) 0.3 Constant
Wavelength/Ship Length Ratio (λ/L)
1.25 Constant
Wave Height (m) 0, 6, 9, 12 to 20
3m, 1m
Wave Period (s) 11.104 Constant
Random Seas
A capsize sensitivity study was conducted for both the ONRFL and ONRTH with varied KGs (Table 2), speeds, and headings, in random seas. Twenty-five random wave seed 1800 second simulations were performed at each KG, in 15 degree heading increments for 7 speeds (Table 4) in each of the specified sea state 8 conditions (Table 5), resulting in 4200 total runs for each ship. Table 4: Random Seas Input Parameters
Parameter Value Increment
Speeds 0 to 30 knots
5 knots
Heading 0 to 180 deg 15 deg
The ships were tested in sea state 8 conditions using a Bretschneider spectrum with 90 wave components. Three spectrum combinations were used, representing a most- probable sea state 8 condition (3), an intermediate case (2), and worst-case wave steepness conditions (1). Table 5: Wave Conditions
Sea State 8 Condition
Significant Wave Height (m)
Modal Period (s)
1 9.0 10.4
2 11.5 15.0
3 11.5 16.4
Occurrences where dynamic stability event criteria (NSWCCD Seakeeping Department, 2003) were exceeded (Table 5), including capsize, broaching, mild-broaching, and surfriding, were recorded as a function of speed and heading. Table 5: Definitions of Dynamic Stability Event Criteria
Event Criteria
Capsize Roll angle > 89 deg
Broach Yaw angle > 30 deg
Yaw Rate > 3 deg/s
Mild-Broach Yaw angle > 15 deg
Surfride Vg > 1.10* calm-water speed
Pitch rate > 0.1 deg/s
Yaw rate < 0.1 deg/s
RESULTS
Regular Seas
Integrity values, defined as the ratio of safe area, runs where capsize did not occur, to total area, the total number of runs, were utilized to examine changes in stability with increasing wave height for varying KG values. Integrity curves for KG values corresponding to realistic

4
vessel loading conditions are shown in Figures 2 and 3. The values shown were normalized to the integrity value of the ONRFL for KG=7.25 m in 0 m waves, corresponding to 1, enabling comparisons to be made between the two figures. As utilized in this study, safe basins are plots of capsize based on a ship’s initial conditions, initial roll angle vs initial roll velocity, in a given seaway. The white region indicates areas of safety, where the vessel did not capsize for the given initial conditions, and the dark region indicates areas of safety risk, where capsize did occur for the specified initial conditions. In Figure 4, the ONRTH at the KG= 7.75m value, significant safe basin erosion occurred between the 12m wave height to 20 m wave height. For the ONRTH, the erosion of the safe basins occurred more rapidly for increasing KG values, as would be expected with a more unstable ship. The reduction of the integrity values, and corresponding degradation of the safe basins for regular waves of increasing heights, varied significantly for the ONRFL and ONRTH vessels. Random Seas
The variation of the total number of capsizes for the 4200 total runs is shown over a range of KG values for all headings and speeds for both the ONRFL and ONRTH in three sea state 8 conditions (Figure 5). For corresponding wave conditions, a significant difference can be observed between the flared and tumblehome hull forms, at similar KG values. For the worst-case sea state 8 conditions, the number of capsizes for a given KG value is much greater for the tumblehome topside when compared to the flare topside geometry. From this plot, it can be observed that the tumblehome topside requires about a 1m-1.5 m increase in KG (thus GM) to achieve a number of capsizes similar to the flared hull topside hull form. The capsize risk increased for both topside configurations for worsening sea state 8 conditions. The capsize risk for the tumblehome geometry had a greater increase
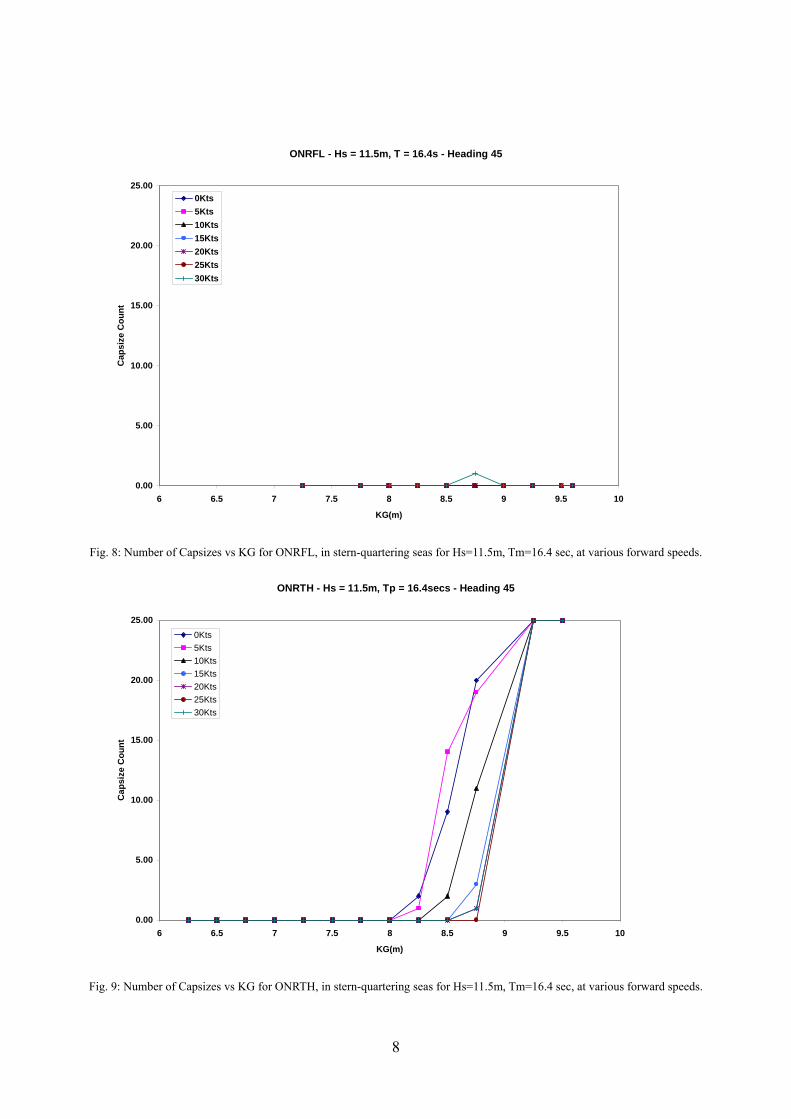
than the flared topside geometry over a smaller range of incremental KG values. Comparison plots of twenty-five simulations of the ONRFL and ONRTH in the most probable sea state 8 conditions are shown for number of capsizes for varying KG values over a range of forward speeds for four headings: following, stern-quartering, beam and head seas (Figures 6-13). As shown, the number of capsizes for the most-probable sea state 8 conditions increased drastically for the tumblehome topside for following, stern-quartering, beam and head seas. As expected, the capsize risk increased for both topside geometries with worsening sea state 8 conditions and with increasing forward speed. However the capsize risk for the tumblehome geometry had a greater increase for small increases in KG than the flared topside geometry. Polar plots for capsize, broaching, mild-broach, and surfriding are shown for the 8.25m KG value in the most probable sea state 8 conditions (Figures 14 and 15). A sharp increase in the number of capsizes for the tumblehome hull form occurred after the 8.25m KG value. The tumblehome topside travelling at moderate to high speeds in stern-quartering to near beam seas was observed to be the worst-case scenario for capsize from the polar plots. Similar risk susceptibilities for both the ONRFL and ONRTH were observed for broaching and mild-broaching. Broaching and mild-broach risk occurrence was observed to be worst at low speed, less than 5 knots, in bow-quartering and head seas, as well as stern-quartering seas. Mild-broach occurrence increased with increasing speed, and was observed up to 20 knots for both the ONRFL and ONRTH. Surfriding occurrences were observed to be worst for following and near-following seas with continued risk at high speeds near a stern-quartering heading. Surfriding risk was slightly decreased for the tumblehome topside compared to the flared topside at the slower speeds and near stern-quartering seas.

0
0.2
0.4
0.6
0.8
1
1.2
0.00 0.02 0.04 0.06 0.08 0.10 0.12
h/λ
Inte
grity
Val
ue
Numerical Integrity Curve- KG =7.25mNumerical Integrity Curve- KG=7.75mNumerical Integrity Curve- KG=8mNumerical Integrity Curve- KG=8.25m
Fig. 2: Integrity Curves for ONRFL for various KGs at Fn=0.30, in stern quartering seas, λ/L=1.25
0
0.2
0.4
0.6
0.8
1
1.2
0.00 0.02 0.04 0.06 0.08 0.10 0.12
h/λ
Inte
grity
Val
ue
Numerical Integrity Curve- KG =7.25mNumerical Integrity Curve- KG=7.75mNumerical Integrity Curve- KG=8mNumerical Integrity Curve- KG=8.25m
Fig. 3: Integrity Curves for ONRTH for various KGs at Fn=0.30, in stern quartering seas, λ/L=1.25
5
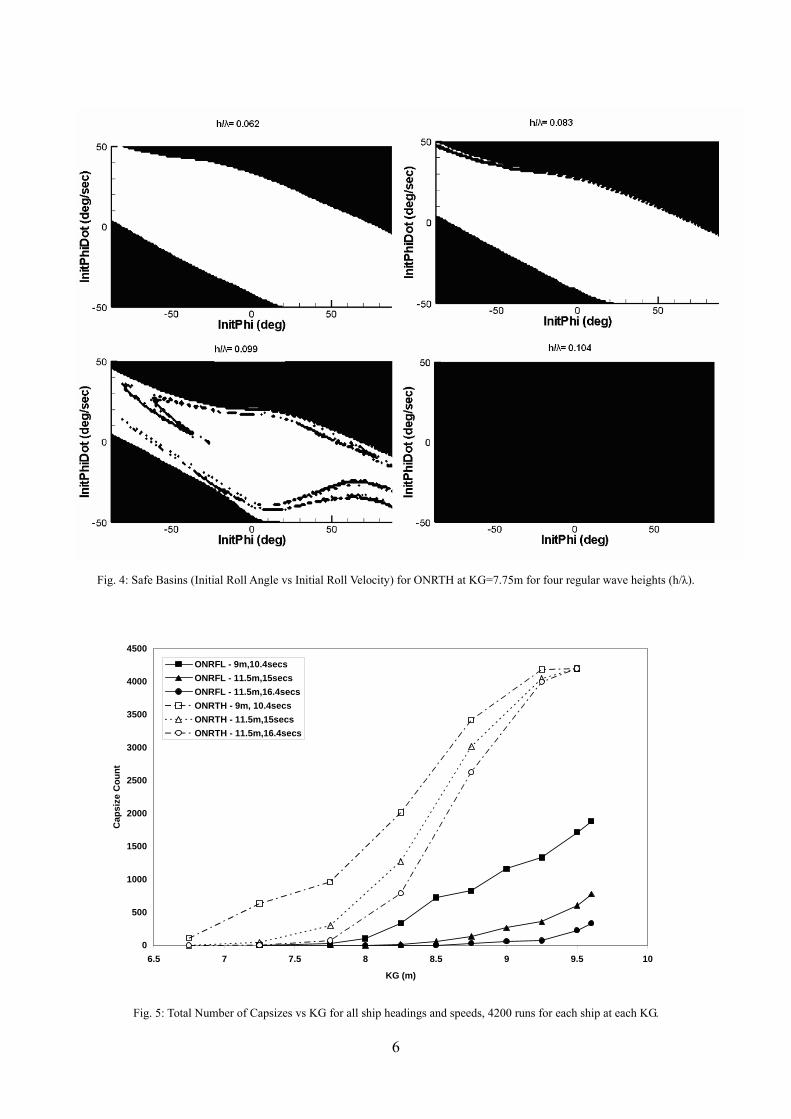
Fig. 4: Safe Basins (Initial Roll Angle vs Initial Roll Velocity) for ONRTH at KG=7.75m for four regular wave heights (h/λ).
0
500
1000
1500
2000
2500
3000
3500
4000
4500
6.5 7 7.5 8 8.5 9 9.5 10
KG (m)
Cap
size
Cou
nt
ONRFL - 9m,10.4secsONRFL - 11.5m,15secsONRFL - 11.5m,16.4secsONRTH - 9m, 10.4secsONRTH - 11.5m,15secsONRTH - 11.5m,16.4secs
Fig. 5: Total Number of Capsizes vs KG for all ship headings and speeds, 4200 runs for each ship at each KG.
6

ONRFL - Hs = 11.5m, T = 16.4s - Heading 0
0.00
5.00
10.00
15.00
20.00
25.00
6 6.5 7 7.5 8 8.5 9 9.5 10
KG(m)
Cap
size
Cou
nt
0Kts5Kts10Kts15Kts20Kts25Kts30Kts
Fig. 6: Number of Capsizes vs KG for ONRFL, in following seas for Hs=11.5m, Tm=16.4 sec, at various forward speeds.
ONRTH - Hs = 11.5m, Tp = 16.4secs - Heading 0
0.00
5.00
10.00
15.00
20.00
25.00
6 6.5 7 7.5 8 8.5 9 9.5 10
KG(m)
Cap
size
Cou
nt
0Kts5Kts10Kts15Kts20Kts25Kts30Kts
Fig. 7: Number of Capsizes vs KG for ONRTH, in following seas for Hs=11.5m, Tm=16.4 sec, at various forward speeds.
7
ONRFL - Hs = 11.5m, T = 16.4s - Heading 45
0.00
5.00
10.00
15.00
20.00
25.00
6 6.5 7 7.5 8 8.5 9 9.5 10
KG(m)
Cap
size
Cou
nt
0Kts5Kts10Kts15Kts20Kts25Kts30Kts
Fig. 8: Number of Capsizes vs KG for ONRFL, in stern-quartering seas for Hs=11.5m, Tm=16.4 sec, at various forward speeds.
ONRTH - Hs = 11.5m, Tp = 16.4secs - Heading 45
0.00
5.00
10.00
15.00
20.00
25.00
6 6.5 7 7.5 8 8.5 9 9.5 10
KG(m)
Cap
size
Cou
nt
0Kts5Kts10Kts15Kts20Kts25Kts30Kts
Fig. 9: Number of Capsizes vs KG for ONRTH, in stern-quartering seas for Hs=11.5m, Tm=16.4 sec, at various forward speeds.
8

ONRFL - Hs = 11.5m, T = 16.4s - Heading 90
0.00
5.00
10.00
15.00
20.00
25.00
6 6.5 7 7.5 8 8.5 9 9.5 10
KG(m)
Cap
size
Cou
nt
0Kts5Kts10Kts15Kts20Kts25Kts30Kts
Fig. 10: Number of Capsizes vs KG for ONRFL, for 25 realizations for 1800s, in beam seas for Hs=11.5m, Tm=16.4 sec, at various
forward speeds.
ONRTH - Hs = 11.5m, Tp = 16.4secs - Heading 90
0.00
5.00
10.00
15.00
20.00
25.00
6 6.5 7 7.5 8 8.5 9 9.5 10
KG(m)
Cap
size
Cou
nt
0Kts5Kts10Kts15Kts20Kts25Kts30Kts
Fig. 11: Number of Capsizes vs KG for ONRTH, in beam seas for Hs=11.5m, Tm=16.4 sec, at various forward speeds.
9

ONRFL - Hs = 11.5m, T = 16.4s - Heading 180
0.00
5.00
10.00
15.00
20.00
25.00
6 6.5 7 7.5 8 8.5 9 9.5 10
KG(m)
Cap
size
Cou
nt
0Kts5Kts10Kts15Kts20Kts25Kts30Kts
Fig. 12: Number of Capsizes vs KG for ONRFL, in head seas for Hs=11.5m, Tm=16.4 sec, at various forward speeds.
ONRTH - Hs = 11.5m, Tp = 16.4secs - Heading 180
0.00
5.00
10.00
15.00
20.00
25.00
6 6.5 7 7.5 8 8.5 9 9.5 10
KG(m)
Cap
size
Cou
nt
0Kts5Kts10Kts15Kts20Kts25Kts30Kts
Fig. 13: Number of Capsizes vs KG for ONRTH, in head seas for Hs=11.5m, Tm=16.4 sec, at various forward speeds.
10

Fig. 14: Polar Plot of Capsize (top left), Broaches (top right), Mild-Broaches (bottom right), and Surfrides (bottom left) for ONRFL
at KG=8.25 m, Hs=11.5m, Tm=16.4 sec
11
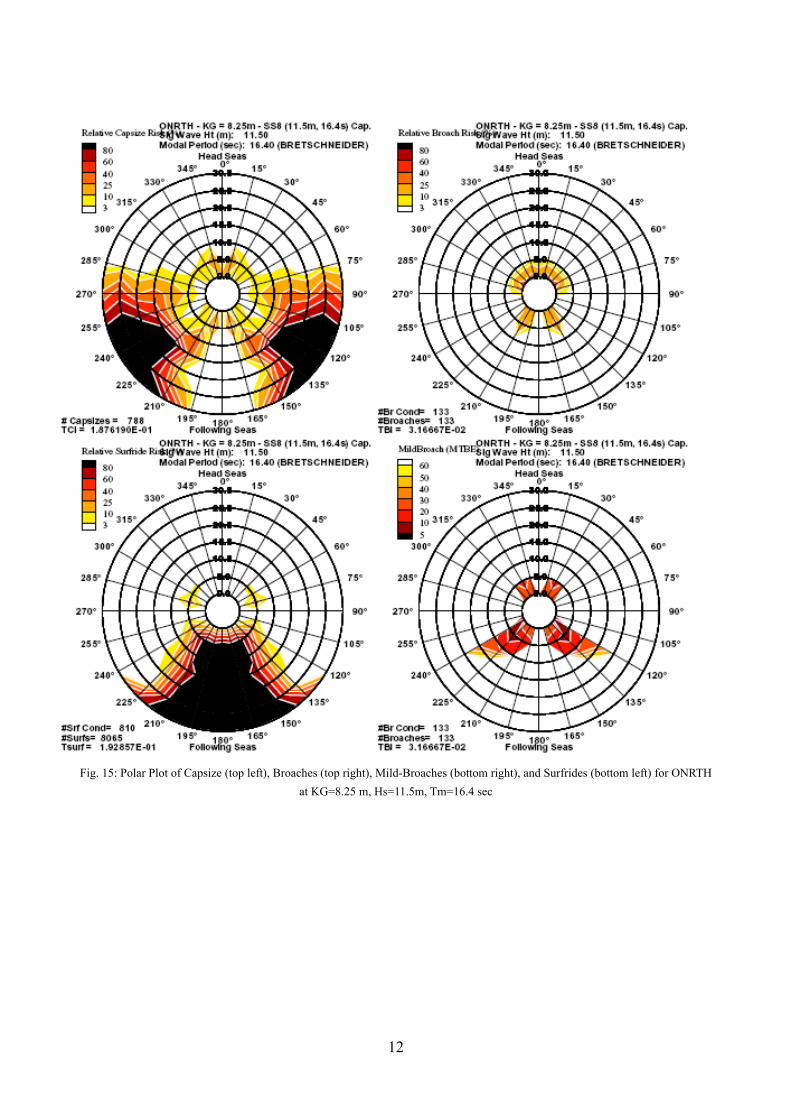
Fig. 15: Polar Plot of Capsize (top left), Broaches (top right), Mild-Broaches (bottom right), and Surfrides (bottom left) for ONRTH
at KG=8.25 m, Hs=11.5m, Tm=16.4 sec
12
13
CONCLUSIONS
A numerical study was conducted using FREDYN 9.8 to examine dynamic stability risk in regular and random seas for varied topside geometries, flared and tumblehome. From the regular seas investigation, drastic differences in capsize occurrence were observed for the ONRFL and ONRTH hull forms. Integrity curves and safe basins were used to assess the increase in capsize risk with increasing wave heights for varied KG values. Increasing wave heights, up to values of 1/10 wave steepness, lead to drastic reductions in the stability of the tumblehome topside hull form. For realistic loading conditions, even in steep waves, with large initial heel angles and roll rates, the flared topside had very few instance of capsize. From the random seas investigation, a significant difference was observed for the capsize rate of the flared and tumblehome topside geometries. To achieve a similar, reduced number capsizes the GM of the tumblehome topside must be increased by 1-1.5m. Although decreasing the capsize risk for the tumblehome topside, this increase in GM would lead to a much stiffer ship and other safety considerations, such as accelerations on the crew members could be problematic. As shown, the number of capsizes for the most-probable sea state 8 conditions increase drastically for the tumblehome topside for all headings. As expected, the capsize risk increased for both topside geometries with worsening sea state 8 conditions. However the capsize risk for the tumblehome geometry had a greater increase for small increases in KG than the flared topside geometry. A sharp increase in the number of capsizes for the tumblehome hull form occurred after the 8.25m KG value. The tumblehome topside travelling at moderate to high speeds in stern-quartering to beam seas was observed to be the worst-case scenario for capsize from the polar plots. Similar risk susceptibilities were observed for broaching and mild-broaching. Surfriding occurrences were observed to be
slightly decreased for the tumblehome hull form. The results of this investigation provide a better understanding of the influence of increased KG over the life-cycle of the ship, the ramifications of error in KG measurements, the required safety factor or error band in operator guidance, and the sensitivity of these variations to hull form geometry. The results can be used for a preliminary assessment of the difference in dynamic stability, for a range of wave conditions, between varied topside geometry configurations. However, to accurately quantify the dynamic stability risk for different topside configurations, and establish the boundaries for these regions of vessel safety or risk with a high degree of confidence, additional experiments for the conditions outlined in this investigation should be conducted to validate the FREDYN results.
ACKNOWLEDMENTS
The authors would also like to express their appreciation for the support of the Hydromechanics Department of the Naval Surface Warfare Center, Carderock Division (NSWCCD).
REFERENCES
“Dynamic Stability Assessment Tools and Methodologies for New Monohull Displacement Surface Combatant Ships,” Rev. 2. NSWCCD Seakeeping Department, 13 August, 2003.
McCue, L.S., Belknap, W., and Campbell, B., "Reconciling experimental and numerical data: techniques of nonlinear seakeeping code validation," Marine Systems and Ocean Technology, 2 (1-2), 2006, pp. 55-62. Originally presented at the 8th International Ship Stability Workshop, Istanbul, Turkey, October, 2005.
McTaggart, K., and de Kat, J.O. “Capsize Risk of intact frigates in irregular seas,” SNAME Transactions, 108, 2000, pp. 147-177.
Soliman, M.S., and Thompson, J.M.T., “Transient and steady state analysis of capsize phenomena,” Applied Ocean Research, 13 (2), 1991, pp. 82-92.

14
Lee, Y.W., McCue, L.S., Obar, M., and Troesch, A., “Experimental and numerical investigation into the effects of initial conditions on a three degree of freedom capsize model,” Journal of Ship Research, 50 (1), 2006, pp. 63-84.
Spyrou, K.J., & Thompson, J.M.T. “The nonlinear dynamics of ship motions: a field overview and some recent developments,” Philosophical Transactions of the Royal Society of London: Mathematical, Physical, and Engineering Sciences, 358 (1771), 2000, pp. 1735-1760.
Thompson, J.M.T., “Designing against capsize in beam seas: recent advances and new insights,” App.l Mech. Rev., 50 (5), 1997, pp. 307-325.