DYNAMIC RESPONSE OF ACOUSTICALLY FORCED TURBULENT …
9
Proceedings of ASME Turbo Expo 2019 Turbo Expo 2019 June 17-21, 2019, Phoenix AZ, USA GT2019-91379 DYNAMIC RESPONSE OF ACOUSTICALLY FORCED TURBULENT PREMIXED BIOGAS FLAMES Oluwaseun Ajetunmobi Department of Mechanical Engineering University College London London WC1E 7JE, UK [email protected] Midhat Talibi * Department of Mechanical Engineering University College London London WC1E 7JE, UK [email protected] Ramanarayanan Balachandran Department of Mechanical Engineering University College London London WC1E 7JE, UK [email protected] ABSTRACT Increasing demand for energy and the need for diversifica- tion of fuels used in gas turbine power generation is continuing to drive forward the development of fuel-flexible combustion sys- tems, with particular focus on biomass derived sustainable fuels. The technical challenges arising from burning sustainable fuels are largely associated with the change in the chemical, thermal and transport properties of these fuels due to the variation of the constituents and their impact on the performance of the combus- tor including emissions, static and dynamic stabilities. There is a lack of detailed understanding on the effect of fuel composition on the flame sensitivity to acoustic and flow perturbations. This paper describes an experimental study investigating the acoustic flame response of simulated biogas (methane/carbon dioxide/air mixtures) turbulent premixed flames. The effect of variation in carbondioxide, CO 2 , content on the flame response was quantified. Special emphasis was placed on understanding the dependence of this flame response on the amplitude of the acoustic forcing. The flame was subjected to strong velocity per- turbations using loud speakers. It was observed that the addition of CO 2 had considerable influence on the magnitude of heat release response. The mag- nitude and the phase of flame describing function indicated that the mechanism of saturation in these flames for all conditions tested were the same. The difference in magnitude could been attributed to dilution effect and hence further investigation were carried out with N 2 andAr to clarify the role of CO 2 . The results * Corresponding author indicate that the thermal capacity of the diluent gases could be playing a significant role in nonlinear flame dynamics. NOMENCLATURE Q flowrate φ equivalence ratio f frequency U bulk velocity A normalised amplitude ϕ /π normalised phase 1 INTRODUCTION The requirement for substantial reduction in regulated haz- ardous emissions and the need for decarbonisation are two major challenges that directly impact the development and utilisation of gas turbines in power generation and transport sector. Partic- ular focus is placed on reduction in NOx and particulate emis- sions, and addressed by governments via stringent environmen- tal policies, as these emissions have been proven to contribute to various health problems. As a consequence, lean burn tech- nologies are commonly adopted to reduced these emissions, and for improving efficiency. Utilisation of biogas and biomethane offers important opportunities for decarbonisation without sub- stantial changes in infrastructure or operational strategies [1–3]. Thus, the combination of the right choice of fuel and combus- tion strategy (i.e. mode of combustion) could help gas turbine manufacturers meeting the above mentioned challenges. 1 Copyright c 2019 by ASME
Transcript of DYNAMIC RESPONSE OF ACOUSTICALLY FORCED TURBULENT …

Proceedings of ASME Turbo Expo 2019Turbo Expo 2019
June 17-21, 2019, Phoenix AZ, USA
GT2019-91379
DYNAMIC RESPONSE OF ACOUSTICALLY FORCED TURBULENT PREMIXEDBIOGAS FLAMES
Oluwaseun AjetunmobiDepartment of Mechanical Engineering
University College LondonLondon WC1E 7JE, UK
Midhat Talibi*Department of Mechanical Engineering
University College LondonLondon WC1E 7JE, UK
Ramanarayanan BalachandranDepartment of Mechanical Engineering
University College LondonLondon WC1E 7JE, UK
ABSTRACTIncreasing demand for energy and the need for diversifica-
tion of fuels used in gas turbine power generation is continuingto drive forward the development of fuel-flexible combustion sys-tems, with particular focus on biomass derived sustainable fuels.The technical challenges arising from burning sustainable fuelsare largely associated with the change in the chemical, thermaland transport properties of these fuels due to the variation of theconstituents and their impact on the performance of the combus-tor including emissions, static and dynamic stabilities. There isa lack of detailed understanding on the effect of fuel compositionon the flame sensitivity to acoustic and flow perturbations.
This paper describes an experimental study investigating theacoustic flame response of simulated biogas (methane/carbondioxide/air mixtures) turbulent premixed flames. The effect ofvariation in carbondioxide, CO2, content on the flame responsewas quantified. Special emphasis was placed on understandingthe dependence of this flame response on the amplitude of theacoustic forcing. The flame was subjected to strong velocity per-turbations using loud speakers.
It was observed that the addition of CO2 had considerableinfluence on the magnitude of heat release response. The mag-nitude and the phase of flame describing function indicated thatthe mechanism of saturation in these flames for all conditionstested were the same. The difference in magnitude could beenattributed to dilution effect and hence further investigation werecarried out with N2 andAr to clarify the role of CO2. The results
*Corresponding author
indicate that the thermal capacity of the diluent gases could beplaying a significant role in nonlinear flame dynamics.
NOMENCLATUREQ flowrateφ equivalence ratiof frequencyU bulk velocityA normalised amplitudeϕ/π normalised phase
1 INTRODUCTIONThe requirement for substantial reduction in regulated haz-
ardous emissions and the need for decarbonisation are two majorchallenges that directly impact the development and utilisationof gas turbines in power generation and transport sector. Partic-ular focus is placed on reduction in NOx and particulate emis-sions, and addressed by governments via stringent environmen-tal policies, as these emissions have been proven to contributeto various health problems. As a consequence, lean burn tech-nologies are commonly adopted to reduced these emissions, andfor improving efficiency. Utilisation of biogas and biomethaneoffers important opportunities for decarbonisation without sub-stantial changes in infrastructure or operational strategies [1–3].Thus, the combination of the right choice of fuel and combus-tion strategy (i.e. mode of combustion) could help gas turbinemanufacturers meeting the above mentioned challenges.
1 Copyright c© 2019 by ASME

Lean burn combustion systems used to achieve high fuel ef-ficiency and lower pollutant emissions, for power generation andpropulsion, are known to be susceptible to thermoacoustic in-stabilities. Lean burn operation allows substantial reduction inflame temperature and in particle emissions, however these oper-ating conditions are prone to undesired complex resonant feed-back interaction between the heat release rate variations in flamesand the different acoustic modes which can cause pressure andflow oscillations. These oscillations may lead to excessive vibra-tions which can eventually result in complete breakdown of thepower plant/system. There are number of mechanisms that couldtrigger interactions between acoustic oscillations and heat releasein combustion systems. The following mechanisms have beenidentified and studied in literature: flame-acoustic wave inter-actions, flame vortex interactions, equivalence ratio oscillationsand flame-wall interactions [4–6].
Gas turbines manufactures are keen to develop combustionsystems that are fuel-flexible [7–9]. The major attraction for theuse of fuel-flexible systems is their ability in utilising fuels fromvaried supply sources. Biogas and biomethane are among thevarious sustainable fuels that have potential for utilisation in nat-ural gas burning combustion systems with minimum modifica-tion. Biogas is generally produced from the anaerobic digestionof biomass or organic waste, such as industrial waste gases con-taining hydrogen and carbon-dioxide. Anaerobic digestion is abiological process that happens when bacteria breaks down or-ganic matter in environment with little or no oxygen. Typical bio-gas consists of N2, CO2, CH4 andC2H6, however, the proportioncould vary [10]. Biomethane is upgraded biogas with a higherpercentage of methane. The variation in composition of the fuelplays an important role in pollutant emissions and may also af-fect the flame stability.
The role of carbondioxide (CO2) in biogas flames was in-vestigated numerically by Ju et al. [11]. The radiation and re-absorption effect of CO2 had a significant effect on flame speedand the flammability limits, and the influence was highest at leanconditions particularly close to extinction. It is to be expectedthat the addition of CO2 on the combustion is effected throughthe variation of both transport and thermal properties of the mix-ture. Furthermore, CO2 could actively participate in the com-bustion kinetics [12–14]. It was shown experimentally by Shyet al. [15] that during combustion of methane/carbondioxide/airmixtures, the radiation losses due to CO2 have a strong influenceon the combustion intensity. Therefore the impact on flame bythe diluents in the fuel can be summarised in three ways, throughchanges in (1) mixture specific heat and adiabatic flame tempera-ture, (2) chemical kinematic rates, and (3) radiative heat transfer.All the above can influence the heat release from flames. Thiswork will aim to study the effect of CO2 content in methaneflames on acoustic response, and the related role of adiabaticflame temperature and the specific heat capacities. Furthermore,there is lack of information on the non-linear flame response
of biogas flames and saturation mechanisms that are relevant tothermo-acoustic instabilities in practical systems.
The specific objective of this paper is to compare the acous-tic flame response of methane (CH4) flames to that of simulatedbiogas (CH4 + CO2) flames of varying CO2 proportions. Addi-tionally, other diluent gases such as nitrogen (N2) and argon (Ar)were studied, to clarify the role of diluents on the nonlinear flameresponse. The paper is structured as follows: the description ofthe combustor, measurement methods and data reduction proce-dures are provided, followed by results and discussion regardingthe effect of CO2, N2 andAr addition and conclusions.
2 EXPERIMENTAL METHODSThis section describes the burner, measurement methods and
data processing procedures.
2.1 Bluff-body CombustorThe tests were conducted on a bluff-body stabilised combus-
tor, the design of which is based on Ref. [16], and a schematic isshown in Fig. 1(a). The plenum has an internal diameter of 100mm and and an overall length of 300 mm, including the diver-gent and convergent sections at the inlet and exit of the plenumprevented flow separation. The honeycomb mesh placed at thebase of the plenum streamlined the flow. The duct leading onfrom the plenum enables acoustic pressure measurements for thetwo-microphone method, and is of length 400 mm and internaldiameter 35 mm. The bluff body used in this combustor was con-ical in shape, with diameter 30 mm and blockage ratio ≈75%.An enclosure of square cross-section (100 mm x 100 mm x 100mm) made of UV quartz prevented air entrainment from the sur-roundings. The flow was acoustically excited using two loud-speakers. A sinusoidal signal from National Instruments signalgenerator was amplified and supplied to the loud speakers. Thepeak-to-peak voltage of the forcing signal was varied to increasethe forcing amplitude. Two frequencies, 260 Hz and 345 Hz,which provided high acoustic forcing amplitude were used tostudy the amplitude dependence of the acoustic flame response.
2.2 Measurement MethodsFlow rate measurements: Compressed air was delivered froma central facility, while the fuel (methane) and diluent gaseswere supplied from compressed gas cylinders. The flow ratesof air, methane and diluent gases were controlled by high preci-sion needle valve and the mass flow rates were measured usingBronkhorst MASS-VIEW high precision mass flow meters. Theflow ranges of air, methane, CO2, N2 and Ar flow meters were2-200 slpm, 0.2-20 slpm, 0.05-10 slpm, 0.05-10 slpm and 0.08-5slpm, in that order. The accuracy of these mass flow meters was± 1.5% Full Scale Division (FSD).
2 Copyright c© 2019 by ASME
(a)
(b)
FIGURE 1. SCHEMATIC OF (a) THE COMBUSTOR, (b) THE EX-PERIMENTAL ARRANGEMENT
Acoustic pressure measurements: Two high-sensitivityKuLite pressure transducers (Model XCS-093), positioned atlocations 93 mm and 380 mm upstream of the bluff body plane,were used to record pressure fluctuations in the flow passage.The sensitivity of the transducers were 4.2857× 10⁻³ mV/Pa.
The signal from the transducers were amplified using twochannel Flyde Micro Analogue amplifiers. The amplified signalis digitised and saved using a digital oscilloscope.
Heat release measurements: Heat release from the flameswere quantified from OH∗ chemiluminescence emission. Theuse of OH∗ chemiluminescence and the limitations related es-timating heat release modulation can be found in [16–18].The OH∗ chemiluminescence emission were measured using anUV-sensitive fast response side-on Photomultiplier tube, PMT(Hamamatsu R3788). The emissions from the entire combustionzone was collected using a plano-convex lens. An interferencefilter of 10 nm bandwidth centered at 307 nm was used to iso-late OH∗ chemiluminescence emission. The signal was recordedsimultaneously with acoustic pressure and the reference forcingsignal (input to the amplifier for the speakers) using the digitaloscilloscope.
Data acquisition and recording: A four channel digital oscil-loscope Tektronix DPO3014 was used to simultaneously recordthe reference signal, acoustic pressures from two transducers andthe chemiluminescence from the PMT. The signals were acquriedat a sampling rate of 50 kHz and the time series lasting 2 secondswere recorded and stored for post-processing.
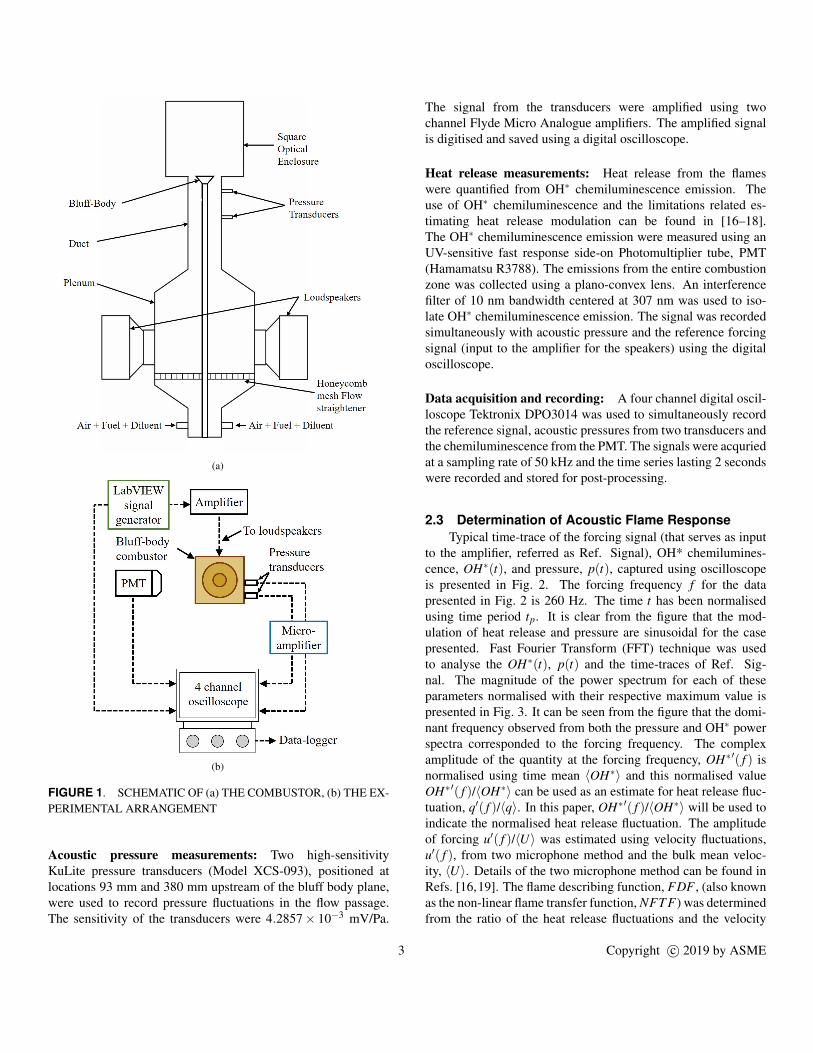
2.3 Determination of Acoustic Flame ResponseTypical time-trace of the forcing signal (that serves as input
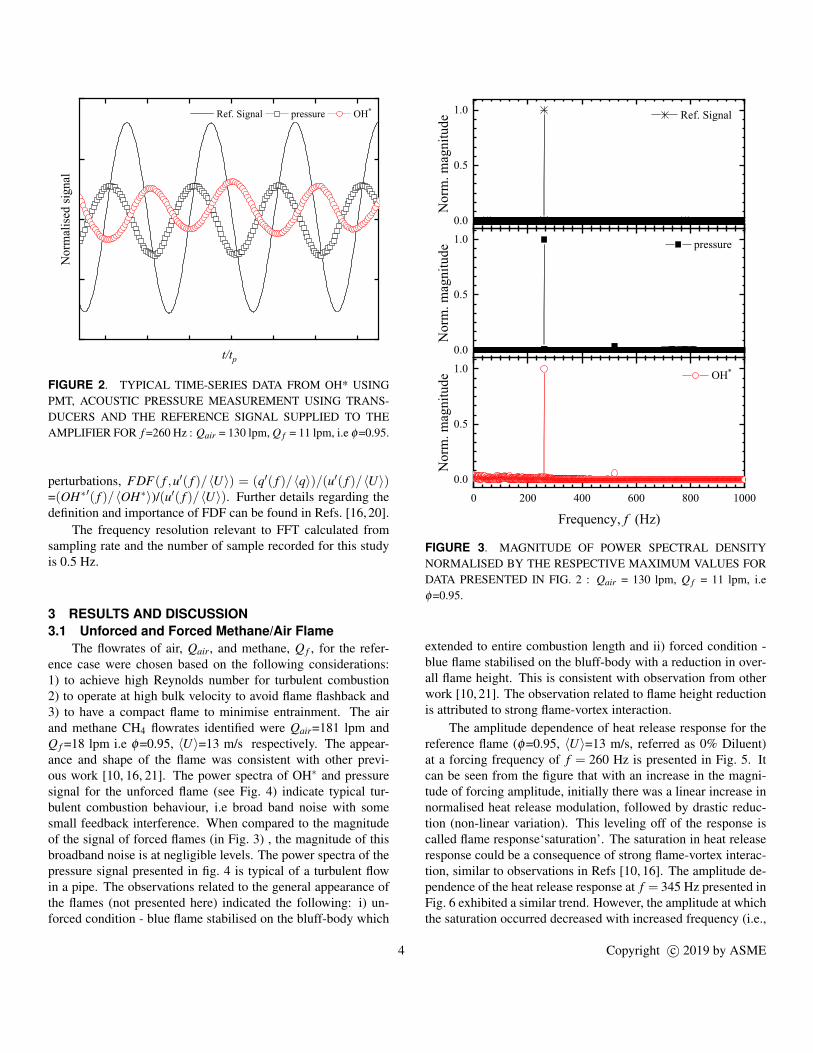
to the amplifier, referred as Ref. Signal), OH* chemilumines-cence, OH∗(t), and pressure, p(t), captured using oscilloscopeis presented in Fig. 2. The forcing frequency f for the datapresented in Fig. 2 is 260 Hz. The time t has been normalisedusing time period tp. It is clear from the figure that the mod-ulation of heat release and pressure are sinusoidal for the casepresented. Fast Fourier Transform (FFT) technique was usedto analyse the OH∗(t), p(t) and the time-traces of Ref. Sig-nal. The magnitude of the power spectrum for each of theseparameters normalised with their respective maximum value ispresented in Fig. 3. It can be seen from the figure that the domi-nant frequency observed from both the pressure and OH∗ powerspectra corresponded to the forcing frequency. The complexamplitude of the quantity at the forcing frequency, OH∗′( f ) isnormalised using time mean 〈OH∗〉 and this normalised valueOH∗′( f )/〈OH∗〉 can be used as an estimate for heat release fluc-tuation, q′( f )/〈q〉. In this paper, OH∗′( f )/〈OH∗〉 will be used toindicate the normalised heat release fluctuation. The amplitudeof forcing u′( f )/〈U〉 was estimated using velocity fluctuations,u′( f ), from two microphone method and the bulk mean veloc-ity, 〈U〉. Details of the two microphone method can be found inRefs. [16,19]. The flame describing function, FDF , (also knownas the non-linear flame transfer function, NFT F) was determinedfrom the ratio of the heat release fluctuations and the velocity
3 Copyright c© 2019 by ASME
Nor
mal
ised
signa
l
t/tp
Ref. Signal pressure OH*
FIGURE 2. TYPICAL TIME-SERIES DATA FROM OH* USINGPMT, ACOUSTIC PRESSURE MEASUREMENT USING TRANS-DUCERS AND THE REFERENCE SIGNAL SUPPLIED TO THEAMPLIFIER FOR f =260 Hz : Qair = 130 lpm, Q f = 11 lpm, i.e φ=0.95.
perturbations, FDF( f ,u′( f )/〈U〉) = (q′( f )/〈q〉)/(u′( f )/〈U〉)=(OH∗′( f )/〈OH∗〉)/(u′( f )/〈U〉). Further details regarding thedefinition and importance of FDF can be found in Refs. [16, 20].
The frequency resolution relevant to FFT calculated fromsampling rate and the number of sample recorded for this studyis 0.5 Hz.
3 RESULTS AND DISCUSSION3.1 Unforced and Forced Methane/Air Flame
The flowrates of air, Qair, and methane, Q f , for the refer-ence case were chosen based on the following considerations:1) to achieve high Reynolds number for turbulent combustion2) to operate at high bulk velocity to avoid flame flashback and3) to have a compact flame to minimise entrainment. The airand methane CH4 flowrates identified were Qair=181 lpm andQ f =18 lpm i.e φ=0.95, 〈U〉=13 m/s respectively. The appear-ance and shape of the flame was consistent with other previ-ous work [10, 16, 21]. The power spectra of OH∗ and pressuresignal for the unforced flame (see Fig. 4) indicate typical tur-bulent combustion behaviour, i.e broad band noise with somesmall feedback interference. When compared to the magnitudeof the signal of forced flames (in Fig. 3) , the magnitude of thisbroadband noise is at negligible levels. The power spectra of thepressure signal presented in fig. 4 is typical of a turbulent flowin a pipe. The observations related to the general appearance ofthe flames (not presented here) indicated the following: i) un-forced condition - blue flame stabilised on the bluff-body which
0.0
0.5
1.0
0.0
0.5
1.0
0 200 400 600 800 10000.0
0.5
1.0
Nor
m. m
agni
tude Ref. Signal
Nor
m. m
agni
tude pressure
Nor
m. m
agni
tude
Frequency, f (Hz)
OH*
FIGURE 3. MAGNITUDE OF POWER SPECTRAL DENSITYNORMALISED BY THE RESPECTIVE MAXIMUM VALUES FORDATA PRESENTED IN FIG. 2 : Qair = 130 lpm, Q f = 11 lpm, i.eφ=0.95.
extended to entire combustion length and ii) forced condition -blue flame stabilised on the bluff-body with a reduction in over-all flame height. This is consistent with observation from otherwork [10, 21]. The observation related to flame height reductionis attributed to strong flame-vortex interaction.
The amplitude dependence of heat release response for thereference flame (φ=0.95, 〈U〉=13 m/s, referred as 0% Diluent)at a forcing frequency of f = 260 Hz is presented in Fig. 5. Itcan be seen from the figure that with an increase in the magni-tude of forcing amplitude, initially there was a linear increase innormalised heat release modulation, followed by drastic reduc-tion (non-linear variation). This leveling off of the response iscalled flame response‘saturation’. The saturation in heat releaseresponse could be a consequence of strong flame-vortex interac-tion, similar to observations in Refs [10, 16]. The amplitude de-pendence of the heat release response at f = 345 Hz presented inFig. 6 exhibited a similar trend. However, the amplitude at whichthe saturation occurred decreased with increased frequency (i.e.,
4 Copyright c© 2019 by ASME
0 2000 4000 6000 8000 10000
0.0
0.5
1.0
Nor
mal
ised
mag
nitu
de
Frequency, f (Hz)
pressure OH*
FIGURE 4. MAGNITUDE OF POWER SPECTRAL DENSITYNORMALISED BY THE RESPECTIVE MAXIMUM VALUES FORTHE REFERENCE CASE WITH NO ACOUSTIC FORCING: Qair =130 lpm, Q f = 11 lpm, i.e φ=0.95.
the values of A at which saturation occurred for forcing frequen-cies, f = 260 Hz and 345 Hz were≈ 0.38 and 0.28 respectively).The amplitude dependence of the magnitude and the phase (ϕnormalised by π of the flame describing function for frequencies260 Hz and 345 Hz are presented in Figs. 7 and 8 respectively.The magnitudes of the flame describing function, |FDF |, con-firms the observations made from Figs. 5 and 6. The normalisedphase (ϕ/π) for 260 Hz and 345 Hz forcing exhibited slight in-crease with increasing amplitude that could be associated withappearance of vortices in flame [16]. For f = 260, at A ≈ 0.58the phase showed sudden reduction, while the magnitude reduc-tion is gradual. This additional variation in flame response re-quires further investigation. It has to be noted that the magnitudeof flame response at 260 Hz is about three-fold higher than at 345Hz.
3.2 Effect of CO2 Addition on Flame ResponseIn order to study the effect of carbondioxide, CO2, content
on the nonlinear response of the flames, CO2 gas was added tothe reference flame. The flowrate of CO2 was varied in incre-ments of 10% of fuel volume flow rate, upto 40 % (i.e., 10%,20%, 30%, and 40%). The flame response for forcing frequen-cies of 260 Hz and 345 Hz are presented in Figs. 5- 8 .
It is clearly evident from Figs. 5 and 7 that there was a sys-tematic decrease in heat release rate magnitudes (and the valuesof |FDF |) with increasing CO2 addition. However, magnitude offlame response (normalised heat release fluctuation and |FDF |),when forced at f = 345 Hz, was not systematic; after 10% CO2
addition the flame response seems to have a weak dependenceon the percentage addition of CO2. The saturation magnitudefor forcing frequency f = 260 Hz for all CO2 additions, exceptfor 40% case, was around A ≈ 0.38 (see Figs. 5 and 7). It canbeen seen clearly that the |FDF | trend for 40 % CO2 addition atf = 260 Hz had a significantly different amplitude dependencywhen compared to that of the other cases, including the referencecase (0% Diluent). The |FDF | at f = 260 Hz, for all cases, ex-cept 40% CO2 addition, was relatively constant until A ≈ 0.38,and then reduced beyond that value. However, |FDF | had a de-creasing trend for the 40 % addition of CO2 at f = 260 Hz.When forcing at f = 345 Hz, the |FDF | values and the trendswere more or less the same for the reference case and 10% CO2addition, with slightly increasing values initially followed by areduction. However, the rest of the cases (i.e, % additions of20,30 and 40) exhibited decreasing trend, very similar to that ofthe 40% CO2 addition at 260 Hz. The amplitude dependence ofphase of FDF are similar for all CO2 additions presented, for afixed forcing frequency condition. The gradual variation in phasecan be associated to kinematics of the flame, particularly to theflame-vortex rollup and subsequent dynamics [16].The observedtrends in the effect of CO2 on the magnitude of the heat releaseresponse can be attributed to the combined effect of reductionin flame temperature due to dilution effect and chemical interac-tion. The reduction in flame temperatures is expected to resultin decreased recirculation temperatures and also cause an overallreduction in the mean heat release. The observed differences inFDF with CO2 addition can be attributed to the flame responseto vorticity. This is because at lower forcing amplitudes no ap-parent change can be seen, it is only at the higher amplitudes (thatcoincides with the appearance of vortex) change in the FDF isobserved.
3.3 Effect of Addition of N2 and Ar on Flame Re-sponse
In order to clarify the role of CO2 addition in biogas flames,additional experiments were carried out, whereby two other dilu-ents, namely N2 and Ar, were added to the reference flame. Forthis study, the flow conditions were determined so that the sametheoretical adiabatic flame temperature of the 10% CO2 additioncase (2170K) was achieved. Educational combustion software,GASEQ- A Chemical Equilibrium Program, was employed todetermine the adiabatic flame temperatures. The percentage ad-dition of N2 and Ar required to achieve the same adiabatic flametemperature as that of 10% CO2 were determined to be 20 % and30 % respectively. The results from test cases with same adia-batic flame temperatures i.e 10% CO2, 20%N2 and 30%Ar arepresented in Figs. 9-12. For consistency, the results from the ref-erence flame condition,referred as ‘0% Diluent’, have also beenincluded in all the figures.
Figure 9 presents the variation in normalised heat release
5 Copyright c© 2019 by ASME

0.0 0.2 0.4 0.6 0.80.00
0.04
0.08
0.12
0.16
0.20
OH'/áOH
ñ
A
0% Diluent 10% CO2
20% CO2
30% CO2
40% CO2
FIGURE 5. EFFECT OF CO2 ADDITION ON THE DEPENDENCEOF NORMALISED HEAT RELEASE OSCILLATIONS ON THENORMALISED FORCING AMPLITUDE A, AT FORCING FRE-QUENCY f =260 Hz, EVALUATED USING OH∗ CHEMILUMINES-CENCE AND ACOUSTIC PRESSURE MEASUREMENTS.
0.0 0.1 0.2 0.3 0.4 0.50.00
0.02
0.04
0.06
0.08
0.10
OH'/áOH
ñ
A
0% Diluent 10% CO2
20% CO2
30% CO2
40% CO2
FIGURE 6. EFFECT OF CO2 ADDITION ON THE DEPENDENCEOF NORMALISED HEAT RELEASE FLUCTUATION ON THENORMALISED FORCING AMPLITUDE A, AT FORCING FRE-QUENCY f =345 Hz.
with respect to varying forcing amplitudes at f =260 Hz, for allcases with the same adiabatic flame temperature as that of thereference case. It can be noted that the trend for all the casesare similar, i.e, linear variation followed by saturation with re-spect to the amplitude increase. The magnitudes of variation forN2 andAr lie in between the 10% CO2 addition and the reference
0.0
0.2
0.4
0.6
0.8
1.0
0.0 0.2 0.4 0.6 0.8-1.0
-0.5
0.0
0.5
1.0
ïFDFï
0% Diluent 10% CO2
20% CO2
30% CO2
40% CO2
j/p
A
0% Diluent 10% CO2
20% CO2
30% CO2
40% CO2
FIGURE 7. EFFECT OF CO2 ADDITION ON THE MAGNITUDEAND THE NORMALISED PHASE OF THE FLAME DESCRIBINGFUNCTION, FDF , AT FORCING FREQUENCY f =260 Hz.
case. Figure 11 presents the variation in normalised heat releasewith respect to varying forcing amplitude at f =345 Hz, for allcases with the same adiabatic flame temperature as that of thereference case. The flame response for both the cases, Ar and N2additions, had a lower magnitude of response compared to thatof CO2 addition and the reference case. The magnitude of heatrelease oscillation for the Ar dilution was higher than that of the(N2 dilution at both the forcing frequencies. It is clear from theseresults that the heat capacity between these three diluents couldpotentially be the biggest contributor to the observed behaviour.It has to be noted that, since nonlinear response is largely due tocomplex flame vortex interactions, the heat capacity difference isexpected to influence the flame behaviour, as can be evidencedin these data sets of same adiabatic temperature conditions.
The variation in the magnitude of the flame describing func-tion |FDF | and the normalised phase for increasing amplitude offorcing at particular forcing frequency, exhibited similar trendsfor all the test cases presented (see Figs. 10 - 12). The amplitudedependency of the phase is largely a consequence of the kine-matic flame response i.e., flame-vortex interactions. From the
6 Copyright c© 2019 by ASME

0.0
0.2
0.4
0.6
0.8
1.0
0.0 0.1 0.2 0.3 0.4 0.5-1.0
-0.5
0.0
0.5
1.0
ïFDFï
0% Diluent 10% CO2
20% CO2
30% CO2
40% CO2
j/
A
0% Dilluent 10% CO2
20% CO2
30% CO2
40% CO2
FIGURE 8. EFFECT OF CO2 ADDITION ON THE MAGNITUDEAND THE NORMALISED PHASE OF THE FLAME DESCRIBINGFUNCTION, FDF , AT FORCING FREQUENCY f =345 Hz.
amplitude dependency of the normalised phase presented here,we can conclude that for a fixed frequency, the mechanism ofheat release response for all these dilution conditions is the same.
4 CONCLUSIONSThis paper describes an experimental investigation of non-
linear flame response of simulated biogas flames. A labora-tory scale combustor with a square optical enclosure was usedfor the study. Loudspeakers were used for acoustic excitation,while flame response was evaluated from simultaneous measure-ments of OH∗ chemiluminescence and acoustic pressure mea-surements. Two-microphone method was used to determine thevelocity perturbations. The focus of the work is to detail theeffect of carbondioxide, CO2, content on the acoustic responseof the flames. The amplitude dependency of the flame dynam-ics was studied at different forcing frequencies, 260 Hz and345 Hz. The addition of CO2 to turbulent methane flames re-duced the magnitude of heat release response at both the forc-ing frequencies, 260 Hz and 345 Hz. The results indicate that
0.0 0.2 0.4 0.6 0.80.00
0.04
0.08
0.12
0.16
0.20
OH'/áOH
ñ
A
0% Diluent 10% CO2
20% N2 30% Ar
FIGURE 9. EFFECT OF DILUENT ADDITION ON HEAT RE-LEASE RESPONSE FOR FLAMES WITH SAME ADIABATICFLAME TEMPERATURE (ESTIMATED FROM GASEQ), AT FORC-ING FREQUENCY f =260 Hz.
0.0
0.2
0.4
0.6
0.8
1.0
0.0 0.2 0.4 0.6 0.8-1.0
-0.5
0.0
0.5
1.0
ïFDFï
0% Diluent 10% CO2
20% N2 30% Ar
j/p
A
0% Diluent 10% CO2
20% N2 30% Ar
FIGURE 10. EFFECT OF DILUENT ADDITION ON FDF FORFLAMES WITH SAME ADIABATIC FLAME TEMPERATURE ATFORCING FREQUENCY f =260 Hz.
7 Copyright c© 2019 by ASME

0.0 0.1 0.2 0.3 0.4 0.50.00
0.02
0.04
0.06
0.08
0.10
OH'/áOH
ñ
A
0% Diluent 10% CO2
20% N2
30% Ar
FIGURE 11. EFFECT OF DILUENT ADDITION ON HEAT RE-LEASE RESPONSE FOR FLAMES WITH SAME ADIABATICFLAME TEMPERATURE AT FORCING FREQUENCY f =345 Hz
0.0
0.2
0.4
0.6
0.8
1.0
0.0 0.1 0.2 0.3 0.4 0.5-1.0
-0.5
0.0
0.5
1.0
ïFDFï
0% Diluent 10% CO2
20% N2
30% Ar
j/
A
0% Dilluent 10% CO2
20% N2
30% Ar
FIGURE 12. EFFECT OF DILUENT ADDITION ON FDF FORFLAMES WITH SAME ADIABATIC FLAME TEMPERATURE ATFORCING FREQUENCY f =345 Hz.
the mechanisms of heat release variation and that of saturationcould be considered to be the same for all flames studied. How-ever, the observed differences in magnitudes of flame responsefor different diluents, CO2, N2 andAr, could be attributed to dif-ferences in physical properties of the gases, such as thermal ca-pacity. It is envisaged that the results obtained from this workwill inform combustor design for utilisation of multi-componentlow calorific value fuels, and provide data for thermo-acousticmodellers. Future work will focus on detailed flame imagingand flame-flow interactions (that is, interactions between theside/central recirculation zones and the shear layers) to betterunderstand the underpinning mechanisms related to the observedtrends in nonlinear flame response.
ACKNOWLEDGMENTThe authors would like to acknowledge EPSRC
(EP/P003036/1) for their financial support towards this work.Oluwaseun Ajetunmobi wishes to acknowledge PetroleumTechnology Development Fund (PTDF) Nigeria for providingfunding for her PhD study.
REFERENCES[1] Stern, J. P., 2017. The Future of Gas in Decarbonising
European Energy Markets: the need for a new approach.Oxford Institute for Energy Studies.
[2] Chen, H., He, J., and Zhong, X., 2018. “Engine combustionand emission fuelled with natural gas: A review”. Journalof the Energy Institute.
[3] Qian, Y., Sun, S., Ju, D., Shan, X., and Lu, X., 2017.“Review of the state-of-the-art of biogas combustion mech-anisms and applications in internal combustion engines”.Renewable and Sustainable Energy Reviews, 69, pp. 50–58.
[4] Lieuwen, T., 2003. “Modeling premixed combustion-acoustic wave interaction: A review”. Journal of Propul-sion and Power, 19(5), pp. 765–781.
[5] Candel, S., 2002. “Combustion dynamics and control:Progress and challenges”. Proceedings of the CombustionInstitute, 29, pp. 1–28.
[6] Dowling, A. P., 2000. “The 1999 Lanchester lecture- Vor-tices, sound and flame -damaging combination”. Aeronau-tical Journal, 104(1033), March, pp. 105–116.
[7] Runyon, J., 2017. “Gas turbine fuel flexibility: pressurizedswirl flame stability, thermoacoustics, and emissions”. PhDthesis, Cardiff University.
[8] Gokalp, I., and Lebas, E., 2004. “Alternative fuels for in-dustrial gas turbines (aftur)”. Applied Thermal Engineer-ing, 24(11-12), pp. 1655–1663.
[9] Lieuwen, T., McDonell, V., Petersen, E., and Santavicca,D., 2008. “Fuel flexibility influences on premixed combus-
8 Copyright c© 2019 by ASME

tor blowout, flashback, autoignition, and stability”. Jour-nal of engineering for gas turbines and power, 130(1),p. 011506.
[10] Dowlut, A. I., Hussain, T., Balachandran, R., and Swami-nathan, N., 2012. “Experimental investigation of dynamicresponse of acoustically forced turbulent premixed ch 4/co2/air flames”. In 19th International Congress on Sound andVibration 2012, ICSV 2012, Vol. 1, pp. 498–505.
[11] Ju, Y., Masuya, G., and Ronney, P. D., 1998. “Effects ofradiative emission and absorption on the propagation andextinction of premixed gas flames”. Symposium (Interna-tional) on Combustion, 27(2), pp. 2619 – 2626.
[12] Liu, F., Guo, H., Smallwood, G. J., and Gulder, O. L., 2001.“The chemical effects of carbon dioxide as an additive inan ethylene diffusion flame: implications for soot and noxformation”. Combustion and Flame, 125(1-2), pp. 778–787.
[13] Greco, A., Mira, D., and Jiang, X., 2017. “Effects offuel composition on biogas combustion in premixed lam-inar flames”. Energy Procedia, 105, pp. 1058–1062.
[14] Mazas, A., Lacoste, D., and Schuller, T., 2010. “Exper-imental and numerical investigation on the laminar flamespeed of ch4/o2 mixtures diluted with co2 and h2o”. InASME Turbo Expo 2010: Power for Land, Sea, and Air,American Society of Mechanical Engineers, pp. 411–421.
[15] Shy, S., Yang, S., Lin, W., and Su, R., 2005. “Turbulentburning velocities of premixed ch4/diluent/air flames in in-tense isotropic turbulence with consideration of radiationlosses”. Combustion and Flame, 143(1-2), pp. 106–118.
[16] Balachandran, R., Ayoola, B. O., Kaminski, C. F., Dowl-ing, A. P., and Mastorakos, E., 2005. “Experimental inves-tigation of the non-linear response of turbulent premixedflames to imposed inlet velocity oscillations”. Combustionand Flame, 143(1-2), October, pp. 37–55.
[17] Lee, J. G., and Santavicca, D. A., 2003. “Experimentaldiagnostics for the study of combustion instabilities in leanpremixed combustors”. Journal of Propulsion and Power,19(5), pp. 735–750.
[18] Quintino, F., Trindade, T., and Fernandes, E., 2018. “Bio-gas combustion: Chemiluminescence fingerprint”. Fuel,231, pp. 328–340.
[19] Seybert, A. F., and Ross, D. F., 1977. “Experimental de-termination of acoustic properties using a two-microphonerandom-excitation technique”. the Journal of the Acousti-cal Society of America, 61(5), pp. 1362–1370.
[20] Palies, P., Durox, D., Schuller, T., and Candel, S., 2010.“The combined dynamics of swirler and turbulent pre-mixed swirling flames”. Combustion and Flame, 157(9),pp. 1698–1717.
[21] Hussain, T., and Balachandran, R., 2011. “Investigation ofthe effect of fuel stratification on response of turbulent pre-mixed flames to acoustic excitation”. In 18th International
Congress on Sound and Vibration 2011, ICSV 2011, Vol. 1,pp. 529–536.
9 Copyright c© 2019 by ASME

![A Thesis Presented to - Northeastern University349748/fulltext.pdf · ribs. Promvonge and Thianpong [10] conducted experiments to assess turbulent forced convection heat transfer](https://static.fdocuments.in/doc/165x107/5f8d59a9f904745a65370ed7/a-thesis-presented-to-northeastern-university-349748fulltextpdf-ribs-promvonge.jpg)