DYNAMIC RELIABILITY ANALYSIS OF THE REACTOR BUILDING …
38
1 DYNAMIC RELIABILITY ANALYSIS OF THE REACTOR BUILDING OF A NUCLEAR POWER PLANT FOR ACCOUNTING OF ITS AGING AND DEGRADATION Di Maio Francesco 1 , Fumagalli Matteo 1 , Guerini Carlo 2 , Perotti Federico 2 , Zio Enrico 1,3 1 Energy Department, Politecnico di Milano, Via La Masa 34, 20156 Milano, Italy 2 Department of Civil and Environmental Engineering, Politecnico di Milano, Milano, Italy 3 MINES ParisTech, PSL Research University, CRC, Sophia Antipolis, France ABSTRACT The ultimate barrier to prevent contamination of the environment due to a release of radioactivity from a Nuclear Power Plant (NPP) is the reinforced concrete (RC) Reactor Building (RB) which encloses the nuclear reactor. The integrity of this barrier is the main focus of Probabilistic Risk Assessment (PRA)-Level 2, in which accident scenarios that might affect this barrier are modeled in terms of their consequences and their probabilities of occurrence. Traditionally, aging and degradation of the RB are not explicitly considered in the modeling. In this paper, a dynamic reliability approach is adopted to explicitly model aging and degradation, and the effects on the RB resistance to the accidental stresses and eventually its failure probability. A Finite Element Model (FEM) of the RC is developed and coupled with a degradation model. By this, risk measures, like the Large Early Release Frequency (LERF) and its increase in time due to aging (ΔLERF), are actualized on the basis of the condition monitoring data related to the reactor building and the risk of failure is dynamically quantified. A case study of an internal overpressure due to a hydrogen explosion is considered to exemplify the methodology. KEYWORDS: Level 2 Probabilistic Risk Assessment, Dynamic reliability, Nuclear Power Plant, Reactor Building, Reinforced Concrete Containment, Aging, Degradation, Hydrogen Combustion.
Transcript of DYNAMIC RELIABILITY ANALYSIS OF THE REACTOR BUILDING …

1
DYNAMIC RELIABILITY ANALYSIS OF THE REACTOR BUILDING OF A NUCLEAR
POWER PLANT FOR ACCOUNTING OF ITS AGING AND DEGRADATION
Di Maio Francesco1, Fumagalli Matteo1, Guerini Carlo2, Perotti Federico2, Zio Enrico1,3
1 Energy Department, Politecnico di Milano, Via La Masa 34, 20156 Milano, Italy
2 Department of Civil and Environmental Engineering, Politecnico di Milano, Milano, Italy
3 MINES ParisTech, PSL Research University, CRC, Sophia Antipolis, France
ABSTRACT
The ultimate barrier to prevent contamination of the environment due to a release of radioactivity
from a Nuclear Power Plant (NPP) is the reinforced concrete (RC) Reactor Building (RB) which
encloses the nuclear reactor. The integrity of this barrier is the main focus of Probabilistic Risk
Assessment (PRA)-Level 2, in which accident scenarios that might affect this barrier are modeled in
terms of their consequences and their probabilities of occurrence. Traditionally, aging and
degradation of the RB are not explicitly considered in the modeling. In this paper, a dynamic
reliability approach is adopted to explicitly model aging and degradation, and the effects on the RB
resistance to the accidental stresses and eventually its failure probability. A Finite Element Model
(FEM) of the RC is developed and coupled with a degradation model. By this, risk measures, like the
Large Early Release Frequency (LERF) and its increase in time due to aging (ΔLERF), are actualized
on the basis of the condition monitoring data related to the reactor building and the risk of failure is
dynamically quantified. A case study of an internal overpressure due to a hydrogen explosion is
considered to exemplify the methodology.
KEYWORDS: Level 2 Probabilistic Risk Assessment, Dynamic reliability, Nuclear Power Plant,
Reactor Building, Reinforced Concrete Containment, Aging, Degradation, Hydrogen Combustion.

2
List of acronyms
ADAPT Analysis of Dynamic Accident Progression Tree
BWR Boiling Water Reactor
CDF Core Damage Frequency
CoV Coefficient of Variation
DDET Discrete Dynamic Event Tree
DEF Deflagration
DET Detonation
EI Early Ignition
ESP Equipment Storage Pool
ET Event Tree
FEM Finite Element Model
LERF Large Early Release Frequency
LRF Large Release Frequency
LOCA Loss of Coolant Accident
LODHR Loss of Decay Heat Removal
LPSD Low Power ShutDown
MC Monte Carlo
MCDET Monte Carlo Dynamic Event Tree
NPP Nuclear Power Plant
NRC Nuclear Regulatory Commission
OS Order Statistics
PRA Probabilistic Risk Assessment
RB Reactor Building
RC Reinforced Concrete
SFP Spent Fuel Pool
TH Thermal-Hydraulic
ΔLERF Increase in LERF
Notation
𝑓𝑐 Concrete nominal compressive strength
𝑓𝑦 Steel nominal yield strength
E Steel elastic modulus
𝜎𝑠𝑡 Tensile stress in reinforcement
𝜎𝑐 Compressive stress in concrete
[𝐻2] Hydrogen concentration
𝑘𝑠𝑡 Proportionality constant for steel/concrete
𝑘𝑐 Proportionality constant for concrete
𝐶 Chlorides concentration in concrete
𝑥 Reinforcement depth
𝐶𝑠 Chlorides concentration at surface
𝐷𝑎𝑣 Average diffusion coefficient
𝐷𝑟𝑒𝑓 Reference diffusion coefficient
𝑈𝑐 Activation energy of chlorides diffusion
𝑅𝑔 Gas constant
𝑇𝑟𝑒𝑓 Reference temperature
𝑇 Concrete temperature
𝑡𝑟𝑒𝑓 Reference time
𝑡𝑜𝑐𝑐 random time of [𝐻2] generation

3
𝜉 Age factor
𝑅𝐻 Concrete relative humidity
𝑅𝐻𝑐 Concrete reference relative humidity
𝐴𝑝𝑖𝑡 Steel cross-sectional area loss
∅ Steel reinforcement diameter
𝑝 Maximum pit depth
𝑖𝑐𝑜𝑟𝑟 Corrosion current
𝑅 Pitting factor
𝛼 , 𝛼0 Gumbel distribution parameters
𝜇 , 𝜇0 Gumbel distribution parameters
𝑅𝑐 Steel resistivity
𝑓𝑦𝐷 Degraded compressive strength
𝐴𝑠0 Threshold pit area for crack onset
𝑄𝑐𝑜𝑟𝑟 Percentage cross-sectional area loss
𝛼𝑦 Empirical parameter for degradation
𝑓𝑐𝐷 Degraded compressive strength
𝜀𝑐0 Strain at peak compressive strength
𝜀1 Strain in cracked concrete
𝑘 Coefficient related to rebar
N Number of outer loop simulations
M Number of inner loop simulations
𝑡𝑜𝑐𝑐 Occurrence time
𝑃𝐸𝐼 Early ignition probability
Δ𝑝𝐸𝐼 Early ignition overpressure
Δ𝑝𝐻2 Overpressure generated by a generic [𝐻2]
𝑃𝐷𝐸𝐹 Deflagration probability
Δ𝑝𝐷𝐸𝐹 Deflagration overpressure
Δ𝑝10(Δ𝑝14) Overpressure generated by 10% (14%) [H2]
𝑃𝐷𝐸𝑇 Detonation probability
Δ𝑝𝐷𝐸𝑇 Detonation overpressure
𝐿𝑠𝑡 Tensile load in steel reinforcement
𝐴𝑠𝑡 Nominal steel reinforcement area
𝐿𝑐 Compressive load in concrete
𝐴𝑐 Nominal concrete area
𝑅𝑠𝑡 Steel reinforcement resistance capacity
𝐴𝐷 Degraded steel area
𝑅𝑐 Concrete compressive resistance capacity
𝑔𝑠𝑡 (𝑔𝑐) Limit state function for steel (concrete)
𝑃𝑓 Failure probability
𝑇𝑚𝑖𝑠𝑠 Mission time
𝑈 (𝐿) Upper (Lower) Safety Threshold
𝑦 Safety parameter
�̂�𝛾 Estimated γ-th percentile of safety parameter
𝑦𝛾 Real value of the γ-th percentile
𝑀(𝛾1, 𝛽1, 𝛾2, 𝛽2) Probabilistic safety margin
𝑦𝑗 ,𝑟𝑒𝑓 Nominal, reference value of the j-th safety parameter
𝛽 Confidence value of the safety parameter

4
1 Introduction
Probabilistic Risk Assessment (PRA) is a comprehensive, structured and logical analysis method
aiming at identifying and assessing risks in complex technological systems, such as Nuclear Power
Plants (NPPs). A PRA is typically developed in three steps, Level 1, Level 2 and Level 3
(NUREG/CR-2300; NUREG/CR-2815): Level 1 assesses the Core Damage Frequency (CDF); Level
2, the Large Early Release Frequency (LERF) and the Large Release Frequency (LRF) of different
types of isotopes due to Reactor Building (RB) failure; Level 3, the environmental and human health
effects (IAEA, 1994).
Conventional PRA traditionally does not model explicitly time-dependent phenomena. In particular,
in this work, we are concerned with the fact that, in Level 2 PRA, the effects of RB aging and
degradation on its failure probability are not modeled. This can become critical also in view of the
life extension of the existing (and aging) NPPs. To overcome this limitation, we embrace a dynamic
reliability analysis framework to introduce a time-dependent physical model that describes RB aging
and degradation and allows accounting for the effects on its resistance to the overloads developing
during accident scenarios throughout its life (mission) time 𝑇𝑚𝑖𝑠𝑠. Dynamic reliability analysis allows
the integration of time-dependent phenomenological models with the models of the stochastic failure
processes (Aldemir, 2013; Zio, 2014; Coyne & Mosleh, 2018). Compared to traditional analysis,
dynamic reliability analysis can provide a more realistic representation of the plant response to an
accident, by the inclusion of a Best Estimate physical model.
Over the years, various approaches of dynamic reliability analysis have been developed, such as
Cognitive Event Simulator, Monte Carlo Dynamic Event Tree (MCDET) (Kloos et al., 2006),
Discrete Dynamic Event Tree (DDET) (Durga et al., 2011), Analysis of Dynamic Accident
Progression Trees (ADAPT) (Aldemir, 2018). In literature, such approaches has so far regarded
modelling of dynamic processes such as thermal-hydraulic (TH) transients, with focus also on
radiological an structural aspects, initiated by the occurrence of accidents (Devooght, 1997; Labeau,

5
Smidts, & Swaminathan, 2000; Hakobyan et al., 2008; Secchi, Zio, & Di Maio, 2008; Zio & Di Maio,
2008 Di Maio, Baronchelli, Vagnoli, & Zio, 2017).
In this work, we develop a dynamic reliability analysis for modeling the reduction of RB resistance
due to Reinforced Concrete (RC) degradation by aging, thus targeting slow dynamics and long time
horizons. Even though the general idea is not new (see Naus, Oland, & Ellingwood, 1996), this is the
first time, to the authors’ knowledge, that an analytical and numerical procedure of this type is fully
developed, addressing: (1) a sophisticated probabilistic load model for overpressure, (2) the complete
3D modelling of the RB structure, (3) a refined degradation model for RC and (4) a state-of-the-art
reliability analysis procedure, which consistently accounts for both epistemic and aleatory
uncertainties.
For illustration, we consider a Mark I Boiling Water Reactor (BWR) and build a dynamic reliability
analysis model for estimating the RB failure probability following the combustion of hydrogen
internally generated at a random time 𝑡𝑜𝑐𝑐. Low Power ShutDown (LPSD) is considered for the NPP,
as it is of concern for the United States Nuclear Regulatory Commission (NRC) licensing (Wakefield,
Budniz, & Kiper, 2014).
The importance and possible consequences of the aging of the RB, which can lead to microstructural
changes due to environmental factors, was recognized by many researchers; pioneering work, in this
field, was performed by Naus and co-authors (Naus, 2007; Naus, Oland, & Ellingwood, 1996). In
fact, aging may impair the ability to withstand accidental internal overpressures, whose dominant
mechanism, for NPPs RBs, is hydrogen combustion (Izquierdo et al., 2009; Fernández-Cosials et al.,
2017; Mercurio, Andersen, & Wagner, 2017). During accident sequences, the slow release of steam
and non-condensable gas into the RB vault does not endanger the containment, because of controlled
RB leakages, whereas pressure increase due to hydrogen combustion (either deflagrations or
detonations) occurs more rapidly than leakage controlled pressure surge (Mercurio et al., 2017).

6
In this work, to model the progression of the hydrogen combustion accident, and the related RB
pressure surge and structural response, a probabilistic hydrogen combustion model (Camp et al.,
1983; Mercurio et al., 2017) is coupled with a Finite Element Model (FEM) of the RB, whose
parameters of structural properties are updated according to a probabilistic RC degradation model of
literature, describing the pitting corrosion of steel reinforcement bars (rebars) induced by chlorides
and leading to loss of cross-sectional area and concrete spalling, which in turns leads to RB resistance
reduction (Stewart & Rosowsky, 1998). The code MELCOR is used to evaluate the source term of
each accidental sequence. The RB resistance, provided by the FEM and by the material degradation
model, is compared to the overpressure generated by the probabilistic hydrogen combustion model,
to get the time-dependent RB fragility curve. The uncertainties involved in the analysis (both
epistemic and aleatory, such as degradation model and FEM parameters, and timing and magnitude
of hydrogen combustion model parameters, respectively) are accounted for by calculating
probabilistic safety margins (Helton, 2009, 2011; Di Maio, Picoco, Zio, & Rychkov, 2017; Di Maio,
Rai, & Zio, 2016) that are calculated via a double loop Monte Carlo (MC) simulation approach of
literature (Durga Rao, Kushwaha, Verma, & Srividya, 2007). Eventually, time-dependent risk
measures of LERF and ∆LERF are calculated. The latter can, for example, serve the scope of
optimally planning RB inspections, to keep LERF below the limits prescribed by the NRC in the
Regulatory Guide 1.174 (Nuclear Regulatory Commission, 2018).
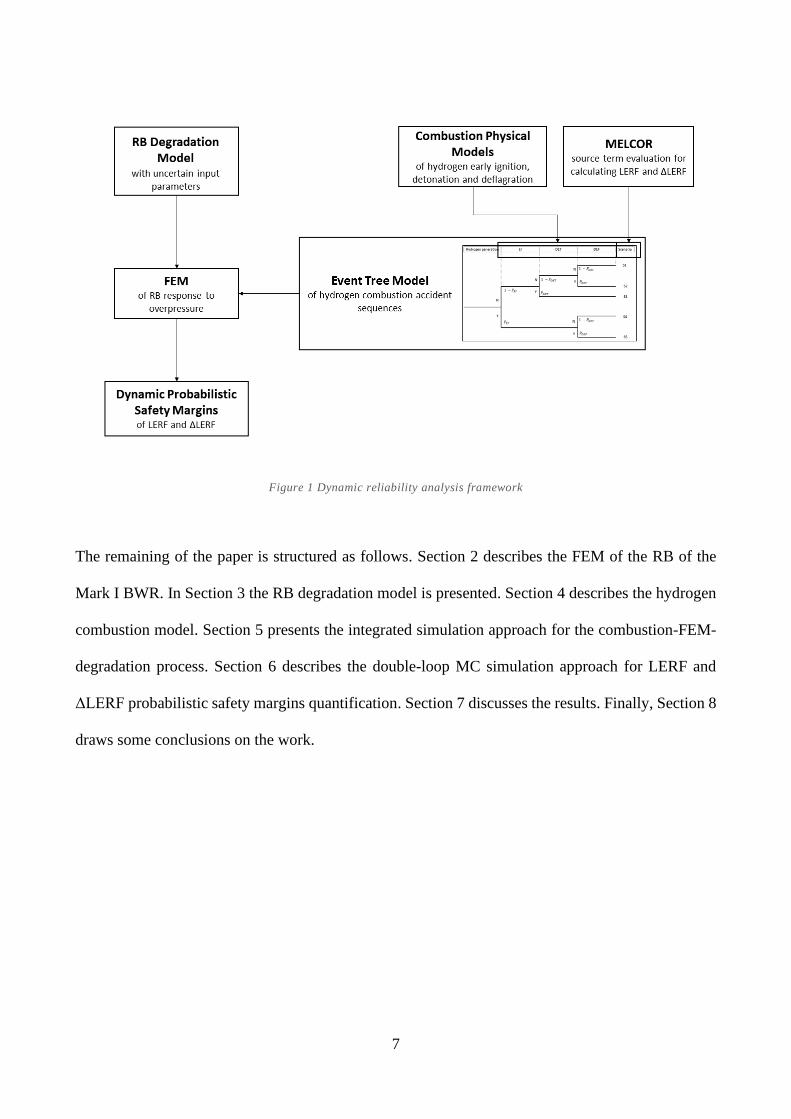
Figure 1 shows the overall scheme of the dynamic reliability analysis framework here developed for
dynamically calculating the LERF and ΔLERF, with reference to a hydrogen combustion accident.
7
Figure 1 Dynamic reliability analysis framework
The remaining of the paper is structured as follows. Section 2 describes the FEM of the RB of the
Mark I BWR. In Section 3 the RB degradation model is presented. Section 4 describes the hydrogen
combustion model. Section 5 presents the integrated simulation approach for the combustion-FEM-
degradation process. Section 6 describes the double-loop MC simulation approach for LERF and
ΔLERF probabilistic safety margins quantification. Section 7 discusses the results. Finally, Section 8
draws some conclusions on the work.

8
2 The FEM of RB
The RB of a Mark I BWR comprises several floors, beams, walls and other structural elements (Naus,
Oland, & Ellingwood, 1996), as shown in Figure 2 where a simplified view of the vertical section
looking West is given.
A Finite Element Model (FEM) of the upper part of the containment (highlighted by the dashed box
in Figure 2) has been developed in Abaqus Software (Simulia, 2011), as shown in different views in
Figure 3. It consists of the drywell, the spent fuel pool (SFP) and the equipment storage pool (ESP),
with the dimensions reported in Figure 4. The FEM is developed for a limited portion of the RB
because hydrogen generally accumulates at the top of the containment, making this part of the RB
more likely to be subjected to hydrogen combustion (Kuznetsov, Yanez, Grune, Friedrich, & Jordan,
2015).
Figure 2 Vertical section looking West of the RB of a BWR Mark I

9
Figure 3 FEM of the main internal structural elements in the upper part of the RB (TEPCO, 2012)
Figure 4 Dimensions of the main structural elements of the upper part of the RB
Hexahedral solid elements C3D8R have been adopted in the model, consisting of 8-node linear bricks,
with reduced integration and hourglass control. Since the thickness of the internal horizontal plates is
equal to 1.0 m, the mesh has been generated with respect to an approximate global size of the finite
elements of 0.33 m in order to correctly catch the shear and tensile/compressive response of the
structural components. A uniform pressure equal to 1 kN/m2 has been separately applied to the walls
of each main room of the upper part of the RB.
The RC consists of Type II Portland cement, with fine aggregates and various admixtures to enhance
performances against environmental stressors. This results in a nominal compressive strength 𝑓𝑐 that

10
follows a Gaussian distribution with mean 35 MPa and coefficient of variation 0.12 (Naus, Oland, &
Ellingwood, 1996). The concrete reinforcement consists in 100 𝑐𝑚2/𝑚 of ASTM A – 615 Grade 60
#18 steel, with nominal yield strength 𝑓𝑦 that follows a lognormal distribution with mean 420 MPa
and coefficient of variation 0.11, and elastic modulus E equal to 200 GPa (Naus, 2007; Naus, Oland,
& Ellingwood, 1996). In this work, it is assumed that tensile loads are withstood by steel
reinforcements, compressive loads by concrete (Naus, 2007) and that stresses generated in the RC
(i.e., 𝜎𝑠𝑡 the tensile stress in rebars and 𝜎𝑐 the compressive stress in concrete) depend linearly on
overpressure (that, in turn, depends on the hydrogen concentration [𝐻2] , see Section 4) , as in
Equations (1) and (2) below:
𝜎𝑠𝑡(∆𝑝) = 𝑘𝑠𝑡 ∙ ∆𝑝 (1)
𝜎𝑐(∆𝑝) = 𝑘𝑐 ∙ ∆𝑝 (2)
where ∆p is the internal overpressure and 𝑘𝑠𝑡 and 𝑘𝑐 are calculated by solving the FEM of the
structure.
Figure 5 shows on the left the uniform pressure applied to the most critical room of the structure, in
which span dimensions are larger and there are no internal walls, and on the right the contour plot of
tensile/compressive loads on the associated horizontal plates.
Figure 5 FEM applied loads and results for the studied case

11
3 RB degradation model
Steel reinforcement nominal yield strength 𝑓𝑦 and concrete nominal compressive strength 𝑓𝑐 change
with the increase of chlorides ion concentration in the concrete 𝐶(𝑥, 𝑡), up to reaching the threshold
value 𝐶𝑡ℎ at the reinforcement depth 𝑥; at this level, the passive layer of the rebar is destroyed, and
corrosion pits are generated and propagated through the rebar cross sectional area (Stewart, 2009;
Stewart & Rosowsky, 1998; Tuutti, 1982). The chloride-induced pitting corrosion process can, then,
be divided into initiation and propagation phases: the former case concerns chlorides diffusion from
the external surface to the rebar; the latter phase regard pits penetrating the steel (El Hassan,
Bressolette, Chateauneuf, & El Tawil, 2010; Tuutti, 1982; Vu & Stewart, 2000).
Chlorides diffusion depends on many factors which are related to concrete properties (composition
and microstructure) and exposure conditions (temperature, relative humidity, chlorides…), and can
be modeled as in Equation (3) (El Hassan et al., 2010; Kwon, Na, Park, & Jung, 2009; Luping &
Gulikers, 2007; Papakonstantinou & Shinozuka, 2013b):
𝐶(𝑥, 𝑡) = 𝐶𝑠 [1 − 𝑒𝑟𝑓 (𝑥
2√𝐷𝑎𝑣𝑡)] (3)
where 𝐶(𝑥, 𝑡) is the chlorides ion concentration at exposure time t and reinforcement depth x in the
diffusion direction, 𝐶𝑠 is the chlorides concentration at surface and 𝐷𝑎𝑣 is the average apparent
diffusion coefficient that accounts for environmental conditions:
𝐷𝑎𝑣(𝑡) =
1
𝑡 ∫ 𝐷𝑟𝑒𝑓 ∙ 𝑒𝑥𝑝 [
𝑈𝑐𝑅𝑔(1
𝑇𝑟𝑒𝑓 −
1
𝑇)] (
𝑡𝑟𝑒𝑓
𝜏)𝜉
[1 + (1 − 𝑅𝐻)4
(1 − 𝑅𝐻𝑐)4]
−1
𝑑𝜏𝑡
0
(4)
In (4), 𝐷𝑟𝑒𝑓 is the reference diffusion coefficient (see Table 1), 𝑈𝑐 the activation energy of the
chlorides diffusion process (kJ/mol), 𝑅𝑔 the gas constant (8.314 𝐽
𝑘𝑔∙𝑚𝑜𝑙) , 𝑇𝑟𝑒𝑓 the reference
temperature of concrete (296 K), T the current temperature of concrete (K), 𝑡𝑟𝑒𝑓 the reference time
(28 days), ξ a constant called age factor, RH the relative humidity and 𝑅𝐻𝑐 the reference humidity
(0.75) (El Hassan et al., 2010).

12
Table 1 summarizes the uncertainty distributions here assumed (in terms of mean and Coefficient of
Variation (CoV)) (El Hassan et al., 2010; Papakonstantinou & Shinozuka, 2013a; Mercurio et al.,
2017).
Parameter Type Symbol Distribution Mean CoV
Threshold for chlorides
concentration
Epistemic 𝐶𝑡h Uniform 0.9 kg/m3 0.19
Reinforcement depth Epistemic 𝑥 Gaussian 50 mm 0.1
Chlorides concentration at
surface
Epistemic 𝐶𝑠 Gaussian 2.95 kg/m3 0.5
Reference diffusion coefficient Epistemic 𝐷𝑟𝑒𝑓 Lognormal 6 ∙ 10−12
m2/s
0.2
Temperature of concrete Epistemic T Gaussian 296 K 0.1
Age factor Epistemic ξ Beta 0.15 0.3
Relative humidity Epistemic RH Gaussian 0.75 0.1
Pitting factor Epistemic R Gumbel 23.75 0.06
Yield Strength Epistemic 𝑓𝑦 Gaussian 420 MPa 0.11
Compressive Strength Epistemic 𝑓𝑐 Gaussian 35 Mpa 0.12
Hydrogen Concentration Aleatory [H2] Uniform 0 0.57
Early Ignition Probability Aleatory 𝑃𝐸𝐼 Gaussian 0.5 0.1
Deflagration Probability Aleatory 𝑃𝐷𝐸𝐹 Gaussian 0.5 0.1
Detonation Probability Aleatory 𝑃𝐷𝐸𝑇 Gaussian See Eq. (13)
Early Ignition Overpressure Aleatory Log Normal See Eq. (11)

13
Deflagration Overpressure Aleatory Log Normal See Eq. (12)
Detonation Overpressure Aleatory Uniform 7 MPa 0.08
Table 1 Uncertainty distributions of the degradation model parameters
The chlorides diffusion leads to pits generation and penetration into steel, whose loss of cross-
sectional area 𝐴𝑝𝑖𝑡(𝑡) at time t is defined as in Equation (5):
(5)
where 𝐴1 = 0.5 [𝜃1 (∅
2)2
− 𝑏 |∅
2 −
𝑝(𝑡)2
∅|] , 𝐴2 = 0.5 [𝜃2𝑝(𝑡)
2 − 𝑏𝑝(𝑡)^2
∅],
𝑏(𝑡) = 2𝑝(𝑡)√1 − (𝑝(𝑡)
∅)2
, 𝜃1 = 2 𝑎𝑟𝑐𝑠𝑖𝑛 (𝑏
∅) , 𝜃2 = 2 𝑎𝑟𝑐𝑠𝑖𝑛 (
𝑏
2 𝑝(𝑡)) , ∅ is the rebar diameter
and p(t) is the maximum pit depth that is reached in the rebar at time t, defined as in Equation (6)
(Stewart, 2009):
𝑝(𝑡) = 0.0116 𝑅 ∫ 𝑖𝑐𝑜𝑟𝑟(𝑡)𝑑𝑡 (6)
where 𝑖𝑐𝑜𝑟𝑟 is the corrosion current density, R the pitting factor (known to be distributed as a Gumbel
(EV – Type I) with modified parameters 𝜇 = 𝜇0 + 1
𝛼0 𝑙𝑛 (
𝐿𝑈
𝐿0) and 𝛼 = 𝛼0 (Stewart, 2009), where
𝛼0, 𝜇0 are the Gumbel parameters derived from pitting data for a reinforcement of length 𝐿0 and 𝐿𝑈
is the length of a generic reinforcement).
For completeness, 𝑖𝑐𝑜𝑟𝑟 can be modeled as in Equations (7) (Liu & Weyers, 1998):
ln (1.08 𝑖𝑐𝑜𝑟𝑟(𝑡)) = 7.89 + 0.7771ln (1.69 ∙ 𝐶(𝑥, 𝑡)) − 3006
𝑇− 0.000116 𝑅𝑐 + 2.24𝑡
−0.215 +
+ 𝑁(0,0.3312) (7)
𝐴𝑝𝑖𝑡(𝑡) =
{
𝐴1 + 𝐴2 𝑖𝑓 𝑝(𝑡) ≤
∅
√2𝜋∅2
4 − 𝐴1 + 𝐴2 𝑖𝑓
∅
√2 ≤ 𝑝(𝑡) ≤ ∅
𝜋∅2
4 𝑖𝑓 𝑝(𝑡) ≥ ∅

14
where 𝑅𝑐 is the rebar resistance that can be calculated as in Equation (8):
ln(𝑅𝑐) = 8.03 − 0.549 ln(1 + 1.69 𝐶(𝑥, 𝑡)) + 𝑁(0,0.1203)
(8)
Finally, the loss of cross-sectional area 𝐴𝑝𝑖𝑡(𝑡) reduces steel reinforcement performance by reducing
the nominal yield strength 𝑓𝑦, resulting in the degraded yield strength 𝑓𝑦𝐷(𝑡) at time t according to
Equation (9) (Du, Clark, & Chan, 2005):
𝑓𝑦𝐷(𝑡) = (1 − 𝛼𝑦 𝑄𝑐𝑜𝑟𝑟(𝑡)) 𝑓𝑦 (9)
where 𝛼𝑦 is an empirical parameter (here taken equal to 0.005, as in (Du et al., 2005)),
and 𝑄𝑐𝑜𝑟𝑟(𝑡) = 𝐴𝑝𝑖𝑡(𝑡)
𝐴 ∙ 100 is the percentage of cross section loss due to corrosion.
Furthermore, as long as the pit area increases, 𝑓𝑦𝐷(𝑡) decreases and corrosion products, that have a
larger specific volume than rebar material, accumulate on the external surface of the rebar; this causes
tensile stresses in the surrounding concrete, leading to cracking when the pit area reaches the
threshold value 𝐴𝑠0 and, in turn, to the reduction of the nominal concrete compressive strength 𝑓𝑐 into
𝑓𝑐𝐷(𝑡) at time t, according to Equation (10) (Coronelli & Gambarova, 2004):
𝑓𝑐𝐷(𝑡) =
𝑓𝑐
1 + 𝑘 ∙𝜀1(𝑡)𝜀𝑐0
(10)
where 𝜀𝑐0 is the strain at peak compressive strength 𝑓𝑐, 𝜀1(𝑡) is the tensile strain in cracked concrete,
k is a coefficient related to the bar roughness and diameter (here taken equal to 0.01 as in (Coronelli
& Gambarova, 2004)).
It must be pointed out that the degradation model here presented, and hereafter adopted for the
reliability analysis, neglects the spatial distribution of damage: this can be considered of sufficient
level of detail to show the complexity of the phenomena modelled and the need for a dynamic
reliability analysis.

15
4 Hydrogen generation and combustion model
We consider the RB resistance to be verified to withstand the overpressure generated in a hydrogen
combustion accident. During BWR operation, hydrogen is produced by steam-zirconium and steam-
steel reactions (Camp et al., 1983) in a controlled way to keep it below the combustion concentration
threshold, although mixing with surrounding air in a non-uniform manner (i.e. hydrogen migrates
towards higher floors of the RB). During an accident, the concentration might exceed the combustion
threshold especially in the highest RB floors, where SFP and ESP are located (as described in Section
2). In this paper, hydrogen generation is assumed to occur during an LPSD state due to an SFP failure
(i.e., for a Loss Of Decay Heat Removal (LODHR) or SFP Loss Of Coolant Accident (LOCA) that
can cause spent fuel overheating and the consequent abnormal hydrogen production). Under these
circumstances and a predefined SFP radioactive inventory, magnitude and timing of the release can
be calculated using the MELCOR code for simulating accident progression and the behavior of the
fission products (Mercurio et al., 2017; Sandia National Laboratories, 2017). Indeed, MELCOR is a
fully integrated, engineering-level computer code that models the progression of severe accidents in
light water reactor nuclear power plants. It can simulate many physical processes following a severe
accident: thermal-hydraulic response in the reactor coolant system, reactor cavity, containment, and
confinement buildings; core heatup, degradation and relocation; core-concrete attack; hydrogen
production, transport, and combustion; fission product release and transport; and the impact of
engineered safety features on thermal-hydraulic and radionuclide behavior. Thus, the time-dependent
evolution of the hydrogen production during the SFP failure considered in the case of application
could be simulated by MELCOR. However, in this work, neither the time-dependent evolution of
hydrogen production nor the duration of the particular severe accident considered are modelled by
MELCOR, but rather a random amount of hydrogen concentration [𝐻2] is assumed to be generated
in the uniform range [0,100] % at a random time 𝑡𝑜𝑐𝑐, also uniformly distributed in [0,100] years. The
NPP mission time Tmiss, has been considered 100 years, in light of the considerations pointed out in

16
(Nuclear Regulatory Commission, 2017) where the NRC license renewal program for existing plants
is considered and claimed to be possibly extended to 100 years.
As known, hydrogen concentration [𝐻2] is the parameter controlling the probabilities of the different
hydrogen combustion modes, as summarized in Table 2 (Camp et al., 1983).
Hydrogen concentration [%] Combustion mode
0 – 4 Non-combustible
4 – 10 Early Ignition (EI)
10 – 14 Deflagration (DEF)
14 – 59 Detonation (DET)
59 – 75 Deflagration (DEF)
75 – 100 Non-combustible
Table 2 Hydrogen concentration and related combustion mode
Early Ignition (EI) consists in hydrogen combustion close to the flammability limit, that can lead to
deflagration (DEF) but can never progress to detonation (DET). When EI is not triggered, both DET
and DEF must be considered as possible scenarios following hydrogen concentration build up. The
Event Tree (ET) of Figure 6 shows the five different scenarios (S1 to S5) of progression of hydrogen
generation into one of the combustion modes of Table 2.

17
Figure 6 Hydrogen combustion Event Tree
The probabilities of occurrence of the five scenarios in Figure 6 depend on the probabilities of EI,
DEF and DET, 𝑃𝐸𝐼 , 𝑃𝐷𝐸𝐹 , 𝑃𝐷𝐸𝑇 , respectively, whose values are taken from (Mercurio et al., 2017).
The probability 𝑃𝐸𝐼 that EI occurs is assumed to be normally distributed with mean 0.5 and standard
deviation 0.05, whereas the resulting RB overpressure probability distribution Pr(∆𝑃 = ∆𝑝|𝐸𝐼) is
assumed to be lognormal with mean ln(∆𝑝𝐸𝐼) and standard deviation 𝜎𝐸𝐼, as in (Mercurio et al., 2017)
(see Equation (11)):
Pr(∆𝑃 = ∆𝑝|𝐸𝐼)~𝐿𝑁(ln(∆𝑝𝐸𝐼) , 𝜎𝐸𝐼) (11)
where ∆𝑝𝐸𝐼 = {∆𝑝𝐻2 𝑖𝑓 [𝐻2] < 10 %
∆𝑝10 𝑖𝑓 [𝐻2] > 10 % , 𝜎𝐸𝐼 = √
∆𝑝∗ − ∆𝑝
2 , ∆𝑝∗ = {
∆𝑝𝐻2 𝑖𝑓 [𝐻2] > 10 %
∆𝑝10 𝑖𝑓 [𝐻2] < 10 %
where ∆𝑝𝐻2 is the pressure generated while a mixture with [𝐻2] hydrogen concentration is burning,
whereas ∆𝑝10 the maximum pressure generated while a mixture with 10% hydrogen is burning.
When EI is not triggered, the hydrogen concentration keeps increasing and can potentially lead to
concentrations that may originate DEF, whose probability of occurrence 𝑃𝐷𝐸𝐹 is assumed to be
normally distributed with mean 0.5 and standard deviation 0.05. The related overpressure probability
distribution Pr(∆𝑃 = ∆𝑝|𝐷𝐸𝐹) is assumed lognormal with mean ln(∆𝑝𝐷𝐸𝐹) and standard deviation
𝜎𝐷𝐸𝐹, as outlined in Equation (12):

18
Pr(∆𝑃 = ∆𝑝|𝐷𝐸𝐹)~𝐿𝑁(ln(∆𝑝𝐷𝐸𝐹) , 𝜎𝐷𝐸𝐹) (12)
where ∆𝑝𝐷𝐸𝐹 = {∆𝑝𝐻2 𝑖𝑓 [𝐻2] < 14 %
∆𝑝14 𝑖𝑓[𝐻2] > 14 % , 𝜎𝐷𝐸𝐹 = √
∆𝑝∗ −∆𝑝
2 , ∆𝑝∗ = {
∆𝑝𝐻2 𝑖𝑓 [𝐻2] > 14 %
∆𝑝14 𝑖𝑓[𝐻2] < 14 % ,
where ∆𝑝14 is the maximum pressure generated while a mixture with 14% hydrogen is burning.
DET leads to the highest overpressure inside the containment. Its probability of occurrence is assumed
to be normal with mean 𝑃𝐷𝐸𝑇 and standard deviation 0.02 (see Equation (13)):
𝑃𝐷𝐸𝑇 =
{
0.01 𝑖𝑓 [𝐻2] < 14% 𝑜𝑟 [𝐻2] ≥ 59%
1 𝑖𝑓 [𝐻2] ≥ 28% 𝑜𝑟 [𝐻2] < 45%
10(17[𝐻2] − 4) 𝑖𝑓 [𝐻2] ≥ 14% 𝑜𝑟 [𝐻2] < 28%
10(− 17[𝐻2] −
457) 𝑖𝑓 [𝐻2] ≥ 45% 𝑜𝑟 [𝐻2] < 59%
(13)
The related overpressure ∆𝑝𝐷𝐸𝑇 is assumed to be generated by a uniform distribution
Pr(∆𝑃 = ∆𝑝|𝐷𝐸𝑇)~𝑈(6,8) bar.
MELCOR calculations were performed in (Mercurio et a., 2018) for each scenario of the ET of Figure
6 to evaluate the source term, i.e., the amount and type of radioactive material released. For each
scenario, both LERF or LRF can be calculated (Rebollo et al., 2016). In this work, in line with
(Mercurio et al., 2017; Mercurio et al., 2018), the release of 137Cs discriminates between LERF and
LRF.
A summary of the characterization of the scenarios of the ET of Figure 6 is given in Table 3.
Scenario RB end state Consequence Note
S1 Safe LRF RB leakage
S2 Failed LRF Slow release
S3 Failed LERF Early release
S4 Safe LRF RB leakage
S5 Failed LERF Early release
Table 3 Characteristics of the scenarios of the ET in Figure 6 (Mercurio et al., 2017)
19
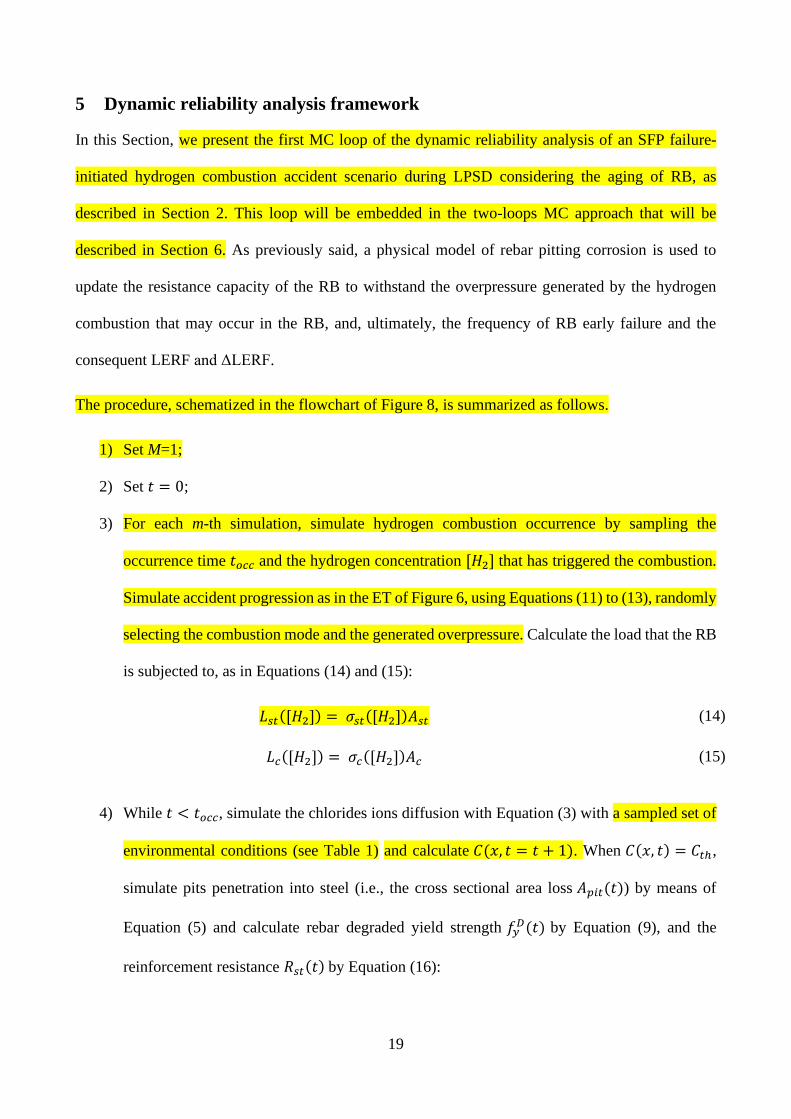
5 Dynamic reliability analysis framework
In this Section, we present the first MC loop of the dynamic reliability analysis of an SFP failure-
initiated hydrogen combustion accident scenario during LPSD considering the aging of RB, as
described in Section 2. This loop will be embedded in the two-loops MC approach that will be
described in Section 6. As previously said, a physical model of rebar pitting corrosion is used to
update the resistance capacity of the RB to withstand the overpressure generated by the hydrogen
combustion that may occur in the RB, and, ultimately, the frequency of RB early failure and the
consequent LERF and ΔLERF.
The procedure, schematized in the flowchart of Figure 8, is summarized as follows.
1) Set M=1;
2) Set 𝑡 = 0;
3) For each m-th simulation, simulate hydrogen combustion occurrence by sampling the
occurrence time 𝑡𝑜𝑐𝑐 and the hydrogen concentration [𝐻2] that has triggered the combustion.
Simulate accident progression as in the ET of Figure 6, using Equations (11) to (13), randomly
selecting the combustion mode and the generated overpressure. Calculate the load that the RB
is subjected to, as in Equations (14) and (15):
𝐿𝑠𝑡([𝐻2]) = 𝜎𝑠𝑡([𝐻2])𝐴𝑠𝑡 (14)
𝐿𝑐([𝐻2]) = 𝜎𝑐([𝐻2])𝐴𝑐 (15)
4) While 𝑡 < 𝑡𝑜𝑐𝑐, simulate the chlorides ions diffusion with Equation (3) with a sampled set of
environmental conditions (see Table 1) and calculate 𝐶(𝑥, 𝑡 = 𝑡 + 1). When 𝐶(𝑥, 𝑡) = 𝐶𝑡ℎ,
simulate pits penetration into steel (i.e., the cross sectional area loss 𝐴𝑝𝑖𝑡(𝑡)) by means of
Equation (5) and calculate rebar degraded yield strength 𝑓𝑦𝐷(𝑡) by Equation (9), and the
reinforcement resistance 𝑅𝑠𝑡(𝑡) by Equation (16):

20
𝑅𝑠𝑡(𝑡) = 𝑓𝑦𝐷(𝑡)𝐴𝐷(𝑡) (16)
When 𝐴𝑝𝑖𝑡(𝑡) > 𝐴𝑠0 calculate concrete degraded compressive strength 𝑓𝑐𝐷(𝑡) by Equation
(10) and concrete resistance with Equation (17):
𝑅𝑐(𝑡) = 𝑓𝑐𝐷(𝑡)𝐴𝑐 (17)
5) When 𝑡 = 𝑡𝑜𝑐𝑐, determine whether the structure fails or not, evaluating the limit state function
𝑔(𝑡, [𝐻2]) as the difference between the capacity 𝑅(𝑡) and the load 𝐿([𝐻2]) (Melchers &
Beck, 2018; Thoft-Christensen & Beck, 1982):
𝑔(𝑡, [𝐻2]) = 𝑅(𝑡) − 𝐿([𝐻2]) (18)
where 𝑔(𝑡, [𝐻2]) = min{𝑔𝑠𝑡(𝑡, [𝐻2]), 𝑔𝑐(𝑡, [𝐻2]} and
𝑔𝑠𝑡(𝑡, [𝐻2]) = 𝑅𝑠𝑡(𝑡) − 𝐿𝑠𝑡([𝐻2]) = 𝑓𝑦𝐷(𝑡)𝐴𝐷(𝑡) – 𝜎𝑠𝑡([𝐻2])𝐴𝑠𝑡 (19)
𝑔𝑐(𝑡, [𝐻2]) = 𝑅𝑐(𝑡) − 𝐿𝑐([𝐻2]) = 𝑓𝑐𝐷(𝑡)𝐴𝐷(𝑡) – 𝜎𝑐([𝐻2])𝐴𝑐 (20)
6) When 𝑡 = 𝑇𝑚𝑖𝑠𝑠, end simulation.
7) M=M+1;
8) Repeat from 2) to 7)
When M=1000:
9) Calculate the probability of failure 𝑃𝑓(𝑡) at each time 𝑡 by Equation (21):
𝑃𝑓(𝑡) = Pr{𝑔𝑠𝑡(𝑡, [𝐻2]) < 0 } ∪ Pr{𝑔𝑐(𝑡, [𝐻2]) < 0} (21)
Figure 7 illustrates this concept: at each time t, the area 𝑃𝑓(𝑡) represents the condition in
which the overpressure load 𝐿([𝐻2] is incidentally larger than the capacity 𝑅(𝑡), i.e., the
structure is failed.

21
Figure 7 Capacity vs load curve to estimate failure probability. The dashed area represents the failure probability.
10) Calculate LERF(t) considering failure probabilities originated by S3 and S5 scenarios only
(being the two scenarios implying a LERF, as assumed in (Mercurio et al., 2017) and reported
in Table 3).
11) Calculate the increase in LERF (i.e., ΔLERF) at time 𝑡 as Equation (22):
Δ𝐿𝐸𝑅𝐹(𝑡) = 𝐿𝐸𝑅𝐹(𝑡) − 𝐿𝐸𝑅𝐹(𝑡 − 1) (22)
where LERF(t) is the LERF that is calculated at the actual time (with the RB in the current
degradation state) and LERF(t-1) is the LERF that was calculated at the previous time step
(where the RB was less degraded than at the current time t).

22
Figure 8 Flowchart of the first-loop simulation procedure

23
6 Probabilistic Safety Margins quantification
Here, safety margin is taken as the difference between the (conservatively) computed value reached
by a selected safety parameter 𝑦𝑗 and an upper (lower) safety threshold 𝑈𝑗 (𝐿𝑗) for a specific accident
scenario (Helton, 2009, 2011; Di Maio et al., 2016). To explicitly account for uncertainty and to
reduce conservatism, the safety margin can be defined in probabilistic terms as the difference between
the upper (lower) threshold 𝑈𝑗 (𝐿𝑗 ) and the estimate �̂�𝛾𝑗 of a specific 𝛾 percentile 𝑦𝛾𝑗 of the
distribution of the safety parameter 𝑦𝑗 (Di Maio, Picoco, et al., 2017; Di Maio et al., 2016; Martorell
et al., 2006, 2009), as in Equation (23):
𝑀(𝛾1, 𝛽1, 𝛾2, 𝛽2) = {
𝑈𝑗 − �̂�𝛾𝑗
𝑈𝑗−𝑦𝑗,𝑟𝑒𝑓 𝑖𝑓 �̂�𝛾𝑗 ≤ 𝑈𝑗
0 𝑖𝑓 𝑈𝑗 ≤ �̂�𝑗 1 𝑖𝑓 �̂�𝛾𝑗 ≤ 𝑦𝑗 ,𝑟𝑒𝑓
(23)
where 𝛽1 = Pr(𝑦𝛾1 < �̂�𝛾1) is defined as the confidence on the estimate of the actual percentile 𝑦𝛾1,
in the same way, 𝛽2 = Pr(𝑦𝛾2 < �̂�𝛾2) , and 𝑦𝑗 ,𝑟𝑒𝑓 is the nominal, reference value of the safety
parameter j.
In this work, we take as safety parameters 𝑦1 = 𝐿𝐸𝑅𝐹 and 𝑦2 = Δ𝐿𝐸𝑅𝐹, 𝑦1,𝑟𝑒𝑓 is the LERF value
for the case of no corrosion, 𝑦2,𝑟𝑒𝑓 is the Δ𝐿𝐸𝑅𝐹 for the case of no corrosion, and �̂�𝛾1 and �̂�𝛾2 are
estimated using Order Statistics (OS) (Nutt & Wallis, 2004), that allows obtaining, with the desired
confidence 𝛽, the estimate of the 𝛾 percentile of the distribution of the safety parameter, limiting the
computational cost related to the number 𝑁 of code simulations (Di Maio et al., 2016; Nutt & Wallis,
2004). In particular, the Coverage approach (Wald, 1943) seems to suit well to our case, since it
provides, with a given confidence, the estimates of tolerance limits (i.e., percentiles) of the
distribution of the N sorted values of correlated outputs (LERF and ΔLERF, in our case) accounting
for the joint probability distribution of the outputs (Nutt & Wallis, 2004).
Following the approach proposed in (Helton, 1998) and, then, applied in (Kloos et al., 2002; Durga
Rao et al., 2007), a two-loop MC simulation is implemented, where an external loop with N=59 allows

24
sampling values for inputs affected by epistemic uncertainties (e.g., degradation model and FEM)
and an inner loop with M=1000 allows sampling (for each set of sampled values in the outer loop)
values of input parameters affected by aleatory uncertainty (e.g., hydrogen combustion accident
timing and magnitude), as shown in Figure 9.
Figure 9 Double loop MC for epistemic and aleatory uncertainty propagation
Input parameters distributions are given in Table 1 and 4 (Kwon et al., 2009; Naus, 2007; Naus,
Oland, Ellingwood, Graves, & Norris, 1996).
Parameter Symbol Distribution
Occurrence time 𝑡𝑜𝑐𝑐 Uniform [0,100] years
Hydrogen concentration [𝐻2] Uniform [0,100] %
Table 4 Aleatory uncertainty distributions
The procedure for probabilistic safety margin quantification by the Coverage OS approach is
summarized as follows (Durga Rao et al., 2007):

25
1) Set the optimal number 𝑁 of code runs to estimate �̂�𝛾1 and �̂�𝛾2 with confidence 𝛽1 and 𝛽2 as
in (Nutt & Wallis, 2004);
2) Sample the n-th set of epistemic variables (i.e., degradation model parameters and
construction materials properties) from the probability distributions listed in Table 1;
3) Sample the m-th realization of the aleatory variables (i.e., hydrogen combustion accident
timing and magnitude) from the distributions listed in Table 4
4) Repeat M times Steps 2) and 3) to simulate the RB behavior with the dynamic reliability
analysis approach described in Section 5;
5) Estimate �̂�𝛾1 and �̂�𝛾2 of the distribution of the 𝛾 percentiles due to epistemic uncertainty as
in (Nutt & Wallis, 2004);
6) Calculate the probabilistic safety margin 𝑀(𝛾1, 𝛽1, 𝛾2, 𝛽2) as in Equation (23).
7 Results
Each curve of Figure 0 represents the fragility curves (i.e., 𝑃𝑓(𝑡) vs [𝐻2]) for the RB that does not
degrade (bold stars) or degrades in time (10-100 years) as described in Section 3, resulting in larger
𝑃𝑓(𝑡) for aged RB, for any fixed [𝐻2].

26
Figure 10 Fragility curve in time
It can be seen that:
1) The different overpressures generated by different combustion regimes are easily identifiable
in the different ranges of hydrogen concentration (vertical dashed lines refer to the different
combustion modes listed in Table 2); it can be seen that detonation range [14%;59%] is more
likely to lead to large overpressure, making 𝑃𝑓(𝑡) grow faster than for any other combustion
mode.
2) The effect of degradation worsens the RB resistance faster for older RBs: indeed, as shown in
Figure 1, the overlap region between the load distribution and the resistance distribution
increases as t increases, meaning that the failure probability 𝑃𝑓(𝑡) increases.

27
Figure 11 Capacity distribution (dark) and load distribution (light) comparison for different RB ages
Figure 22 shows the �̂�𝛾1 and �̂�𝛾2 (𝛾1 = 𝛾2 = 95) values obtained for different NPP ages (10 - 100
years) (dots) and their uncertainty bounds (ellipses that define the pairs of iso-probability values for
LERF and ΔLERF, with confidence 𝛽1 = 𝛽2 = 95%), and plotted against NRC criteria LERF -
ΔLERF plane; if the increase in LERF (ΔLERF) upon RB resistance change exceeds 10−6 (i.e. it falls
within Region I), the change is not allowed; when ΔLERF lies in the range between 10−7 and 10−6
(i.e. it lies in Region II), the change is considered acceptable only if it can be reasonably shown that
the total LERF is less than 10−5; finally, if ΔLERF is less than 10−7 (i.e. it falls in Region III), the
change is accepted.

28
Figure 22 NRC acceptance criteria for LERF. Each dot represents the pair LERF and ΔLERF, evaluated at 10 years
interval; ellipses indicate uncertainty bounds
The dynamic reliability analysis approach here developed allows describing the time evolution of
LERF and ΔLERF due to the degradation of the RB. The degradation due to aging can lead to
unacceptable conditions, starting from 𝑡 > 60 years, if no maintenance activity is undertaken to
counteract the degradation processes. Indeed, for 𝑈1 = {10−4 𝑖𝑓 𝑦2 < 10−7
10−5 𝑖𝑓 𝑦2 > 10−7 , 𝑈2 = 10
−6, 𝑦1,𝑟𝑒𝑓 =
1.4 ∙ 10−6 , 𝑦2,𝑟𝑒𝑓 = 0 the results of Table 5 are collected. This result confirms the necessity of
maintaining the RB within 60 years, as it is currently done in the nuclear industry, where modeling
the RB deterioration and repair is state-of-practice. The added value of the result shown in Figure 12
is that it allows providing actualized estimates of risk measures and probabilistic safety margins, as
degradation progresses with time: this information is useful for decision-makers to decide when to
perform RB maintenance. For example, one might decide to never accept exceeding Region III or
Region II and, correspondingly, proceed conservatively to maintain the RB no more than each 10

29
years, or 50 years, respectively, as suggested by the estimates of the percentiles �̂�𝛾2 and the associated
probabilistic safety margins 𝑀(𝛾2 = 0.95, 𝛽2 = 0.95) for LERF and ΔLERF at the different NPP
ages 10-100 years, shown in Table 5. On the other hand, one might rely on the estimates of the
percentiles �̂�𝛾1 and the associated probabilistic safety margins 𝑀(𝛾1 = 0.05, 𝛽1 = 0.95) to decide
with less conservativism to maintain the RB even between 70 and 80 years (after which M=0).
Time LERF ∆LERF
Percentile
�̂�𝛾1
Margin
𝑀
Percentile
�̂�𝛾2
Margin
𝑀
0 7.0387e-07 0.9390 / /
10 1.4422e-6 0.8644 7.1578e-08 1
20 1.5930e-6 0.8491 1.3545e-07 0.8732
30 1.8899e-6 0.8192 2.9251e-07 0.7146
40 2.4458e-6 0.7617 5.3181e-07 0.4729
50 3.3476e-6 0.6719 8.4190e-07 0.1596
60 4.6743e-6 0.5379 1.2893e-06 0
70 6.5009e-06 0.3534 1.7299e-06 0
80 8.5916e-06 0.1422 2.0129e-06 0
90 1.0652e-05 0 1.9691e-06 0
100 1.2151e-05 0 1.4361e-06 0
Table 5 LERF and ΔLERF percentile estimates and probabilistic safety margin

30
8 Conclusions
In recent years, in light of the international concern on the safety of nuclear facilities, the assessment
of the conditions of aging RC RBs has become a focal point of attention to guarantee containment of
radioactivities. In this work, we have proposed a dynamic reliability analysis framework and applied
it to evaluate the resistance of the RB of a BWR Mark I to a hydrogen combustion accident scenario,
while accounting for the effects of aging and degradation of the reinforced concrete.
Monte Carlo is adopted to duly account for both epistemic and aleatory uncertainty, whereas a FEM
of the RB has been built to analyze how the structure reacts to an internal overpressure and a physics-
based model of chlorides-induced corrosion of steel reinforcement and concrete cracking is employed
to update the resistance of the RB, and the resulting time-dependent fragility curve to reflect how the
failure probability increases in time due to aging effects: resorting to Order Statistics, the percentiles
of the distributions of the safety parameters (i.e., LERF and ΔLERF) are estimated. In the case study
considered, given the assumptions made, the comparison of the updated LERF and ΔLERF with the
NRC requirements shows that, without any maintenance activity, the risk may become unacceptable
to the purpose of license renewal.
The main advancement of the framework here proposed consists in the capability of providing
actualized estimates of risk measures and probabilistic safety margins, as degradation progresses with
time.
On the other hand, the main limitation is that the actualized estimates are not informed about the
actual state of the RC structure (i.e., any condition monitoring system gathering data from sensors is
neglected), but the estimates are provided on the basis of only simulated data (as the NPP RB
degrades). Therefore, future work will consider embedding of condition monitoring data within the
dynamic reliability framework for actualizing the risk measures and safety margins, based on
degradation evidence measured directly on the RB.

31
Acknowledgment
The work is developed within the research project "SMART MAINTENANCE OF INDUSTRIAL
PLANTS AND CIVIL STRUCTURES BY 4.0 MONITORING TECHNOLOGIES AND
PROGNOSTIC APPROACHES - MAC4PRO ", sponsored by the call BRIC-2018 of the National
Institute for Insurance against Accidents at Work - INAIL.
References
(Aldemir, 2013) Aldemir, T., A survey of dynamic methodologies for probabilistic safety assessment
of nuclear power plants, Annals of Nuclear Energy, 52, 113–124, 2013.
(Aldemir, 2018) Aldemir, T., Advanced Concepts in Nuclear Energy Risk Assessment and
Management. WORLD SCIENTIFIC, 2018.
(Camp, Cummings, Sherman, Kupiec, Healy, Caplan, … Saunders, 1983) Camp, A. L., Cummings,
J. C., Sherman, M. P., Kupiec, C. F., Healy, R. J., Caplan, J. S., … Saunders, J. H., Light Water
Reactor Hydrogen Manual, 1983.
(Coronelli & Gambarova, 2004) Coronelli, D., & Gambarova, P., Structural Assessment of Corroded
Reinforced Concrete Beams: Modeling Guidelines, Journal of Structural Engineering, 130(8),
1214–1224, 2004.
(Coyne & Mosleh, 2018) Coyne, K., & Mosleh, A., Dynamic Probabilistic Risk Assessment Model
Validation and Application — Experience with ADS-IDAC, Version 2.0, In Advanced Concepts
in Nuclear Energy Risk Assessment and Management (pp. 45–85), 2018.
(Devooght, 1997) Devooght, J., Dynamic reliability, Advances in Nuclear Science and Technology,
25, 215–278, 1997.

32
(Di Maio, Baronchelli, Vagnoli, & Zio, 2017) Di Maio, F., Baronchelli, S., Vagnoli, M., & Zio, E.,
Determination of prime implicants by differential evolution for the dynamic reliability analysis
of non-coherent nuclear systems, Annals of Nuclear Energy, 102, 91–105, 2017.
(Di Maio, Picoco, Zio, & Rychkov, 2017) Di Maio, F., Picoco, C., Zio, E., & Rychkov, V., Safety
margin sensitivity analysis for model selection in nuclear power plant probabilistic safety
assessment, Reliability Engineering and System Safety, 162(February), 122–138, 2017.
(Di Maio, Rai, & Zio, 2016) Di Maio, F., Rai, A., & Zio, E., A dynamic probabilistic safety margin
characterization approach in support of Integrated Deterministic and Probabilistic Safety
Analysis, Reliability Engineering and System Safety, 145, 9–18, 2016.
(Durga et al., 2011) Durga, R. K,, Dang, V. N., Kim, T.W., Discrete dynamic event tree analysis of
mloca using ads-trace, NS PSA 2011 International Topical Meeting on Probabilistic Safety
Assessment and Analysis, 2011
(Du, Clark, & Chan, 2005) Du, Y. G., Clark, L. A., & Chan, A. H. C., Residual capacity of corroded
reinforcing bars, Magazine of Concrete Research, 57(3), 135–147, 2005.
(Durga Rao, Kushwaha, Verma, & Srividya, 2007) Durga Rao, K., Kushwaha, H. S., Verma, A. K.,
& Srividya, A., Quantification of epistemic and aleatory uncertainties in level-1 probabilistic
safety assessment studies, Reliability Engineering & System Safety, 92(7), 947–956, 2007.
(El Hassan, Bressolette, Chateauneuf, & El Tawil, 2010) El Hassan, J., Bressolette, P., Chateauneuf,
A., & El Tawil, K., Reliability-based assessment of the effect of climatic conditions on the
corrosion of RC structures subject to chloride ingress, Engineering Structures, 32(10), 3279–
3287, 2010.
(Fernández-Cosials et al., 2017) Fernández-Cosials, K., Jimenez, G., Bocanegra, R., Queral, C., Study
of hydrogen risk in a PWR-W containment during a SBO scenario; Tau parameter definition and

33
application on venting strategy analysis, Nuclear Engineering and Design, Volume 325, 15
December 2017, Pages 164-177.
(Hakobyan et al., 2008) Hakobyan, A. et al., Dynamic generation of accident progression event trees,
Nucl. Eng. Des. 238, 3457-3467, 2008.
(Helton, 1998) Helton J.C. et al., Uncertainty and sensitivity analysis results obtained in the 1996
performance assessment for the waste isolation pilot plant. SAND98-0365. Sandia National
Laboratories, 1998.
(Helton, 2009) Helton, J. C., Conceptual and computational basis for the quantification of margins
and uncertainty., Reliability Engineering and System Safety, 2009.
(Helton, 2011) Helton, J. C., Quantification of margins and uncertainties: Conceptual and
computational basis, Reliability Engineering and System Safety, 96(9), 976–1013, 2011.
(IAEA, 1994) IAEA, Advances in Reliability Analysis and Probabilistic Safety Assessment for
Nuclear Power Reactors, IAEA-TECDOC-737, 1994.
(Izquierdo et al., 2009) Izquierdo, J.M., Hortal, J., Sánchez-Perea, M., Meléndez, E., Herrero, R.,
Gil, J., Fernández, I., Mundina, J., Rodríguez-Martín, G., Cañamón, I., Queral, C., Expósito,
A., Ibáñez, L., Elorza, F.J., Ibáñez, C., Nieto, F., Pilot applications of the integrated safety
assessment methodology, International Congress on Advances in Nuclear Power Plants 2009,
ICAPP 2009; Shinjuku, Tokyo; Japan; 10 May 2009 through 14 May 2009; Code 108003.
(Kuznetsov, Yanez, Grune, Friedrich, & Jordan, 2015) Kuznetsov, M., Yanez, J., Grune, J., Friedrich,
A., & Jordan, T., Hydrogen combustion in a flat semi-confined layer with respect to the
Fukushima Daiichi accident, Nuclear Engineering and Design, 286(January), 36–48, 2015.

34
(Kloss et al., 2002) Kloos M. et al. (2002), "Analysis of epistemic and aleatory uncertainties in the
context of a dynamic fire-PSA", 6th International Conference on Probabilistic Safety Assessment
and Management, Conference Proceedings 23 – 28 June 2002, San Juan, Puerto Rico, USA.
(Kloos et al., 2006) Kloos, M., Peschke, J., MCDET: A Probabilistic Dynamics Method Combining
Monte Carlo Simulation with the Discrete Dynamic Event Tree Approach, Nuclear Science and
Engineering Volume 153, 2006 - Issue 2, 2006.
(Kwon, Na, Park, & Jung, 2009) Kwon, S. J., Na, U. J., Park, S. S., & Jung, S. H., Service life
prediction of concrete wharves with early-aged crack : Probabilistic approach for chloride
diffusion, Structural Safety, 31(1), 75–83, 2009.
(Labeau, Smidts, & Swaminathan, 2000) Labeau, P. E., Smidts, C., & Swaminathan, S., Dynamic
reliability: towards an integrated platform for probabilistic risk assessment, Reliability
Engineering & System Safety, 68(3), 219–254, 2000.
(Liu & Weyers, 1998) Liu, T., & Weyers, R. W., Modeling the dynamic corrosion process in chloride
contaminated concrete structures, Cement and Concrete Research, 28(3), 365–379, 1998.
(Luping & Gulikers, 2007) Luping, T., & Gulikers, J., On the mathematics of time-dependent
apparent chloride diffusion coefficient in concrete, Cement and Concrete Research, 37(4), 589–
595, 2007.
(Martorell, Nebot, F Vilanueva, Carlos, Serradell, Pelayo, & Mendizabal, 2006) Martorell, S., Nebot,
Y., F Vilanueva, J., Carlos, S., Serradell, V., Pelayo, F., & Mendizabal, R., Safety margins
estimation method considering uncertainties within the risk- informed decision-making
framework, In Proceedings of the PHYSOR 2006 conference. Vancouver, Canada, 2006.
(Martorell, Nebot, Villanueva, Carlos, Serradell, Pelayo, & Mendizabal, 2009) Martorell, S., Nebot,

35
Y., Villanueva, J., Carlos, S., Serradell, V., Pelayo, F., & Mendizabal, R., An approach to
integrate thermal-hydraulic and probabilistic analyses in addressing safety margins estimation
accounting for uncertainties. Safety, reliability and risk analysis: theory, methods and
applications, In Proceedings of the Joint ESREL and SRA-Europe conference (Vol. 4, pp. 2827–
2835), 2009.
(Melchers & Beck, 2018) Melchers, R. E., & Beck, A. T., Structural Reliability Analysis and
Prediction. John Wiley & Sons, 2018.
(Mercurio, Andersen, & Wagner, 2017) Mercurio, D., Andersen, V. M., & Wagner, K. C., Integrated
level 1–level 2 decommissioning probabilistic safety assessment methodology for boiling water
reactors, In Safety and Reliability - Theory and Applications - Proceedings of the 27th European
Safety and Reliability Conference, ESREL 2017 (Vol. 50, pp. 1441–1450). Elsevier, 2017.
(Mercurio et a., 2018) D. Mercurio et al., "Integrated Level 1-Level 2 decommissioning probabilistic
risk assessment for boiling water reactors", Nuclear Engineering and Technology, 50, 2018.
(Naus, 2007) Naus, D. J., Primer on Durability of Nuclear Power Plant Reinforced Concrete
Structures - A Review of Pertinent Factors, NUREG/CR-6927 ORNL/TM-2006/529, 130, 2007.
(Naus, Oland, & Ellingwood, 1996) Naus, D. J., Oland, C. B., & Ellingwood, B. R., Report on aging
of nuclear power plant reinforced concrete structures, NUREG/CR-6424 ORNL/TM-13148,
1996.
(Naus, Oland, Ellingwood, Graves, & Norris, 1996) Naus, D. J., Oland, C. B., Ellingwood, B. R.,
Graves, H. L., & Norris, W. E., Aging management of containment structures in nuclear power
plants, Nuclear Engineering and Design, 166(3), 367–379, 1996.
(Nuclear Regulatory Commission, 2017) Nuclear Regulatory Commission, Generic Aging Lessons
Learned for Subsequent License Renewal (GALL-SLR) Report, 2, 2017.
36
(Nuclear Regulatory Commission, 2018) Nuclear Regulatory Commission, An Approach for Using
Probabilistic Risk Assessment in Risk-Informed Decisions on Plant-Specific Changes to the
Licensing Basis, Regulatory Guide 1.174, (January), 2018.
(NUREG/CR-2300, 1983) NUREG/CR-2300, PRA Procedure Guide, US Nuclear Regulatory
Commision, 1, 1983.
(NUREG/CR-2815, 1983) NUREG/CR-2815, Probabilistic Safety Analysis Procedures Guide,
Nureg/Cr-2815 Bnl-Nureg-51559, 1983.
(Nutt & Wallis, 2004) Nutt, W. T., & Wallis, G. B., Evaluation of nuclear safety from the outputs of
computer codes in the presence of uncertainties, Reliability Engineering and System Safety,
83(1), 57–77, 2004.
(Papakonstantinou & Shinozuka, 2013a) Papakonstantinou, K. G., & Shinozuka, M., Probabilistic
model for steel corrosion in reinforced concrete structures of large dimensions considering crack
effects, Engineering Structures, 57, 306–326, 2013a.
(Papakonstantinou & Shinozuka, 2013b) Papakonstantinou, K. G., & Shinozuka, M., Spatial
stochastic direct and inverse analysis for the extent of damage in deteriorated RC structures,
Computers and Structures, 128, 286–296, 2013b.
(Rebollo et al., 2016) Rebollo, M.J., Queral, C., Jimenez, G., Gomez-Magan, J., Meléndez, E.,
Sanchez-Perea, M., Evaluation of the offsite dose contribution to the global risk in a Steam
Generator Tube Rupture scenario, Reliability Engineering and System Safety, Volume 147,
March 2016, Pages 32-48
(Sandia National Laboratories, 2017) Sandia National Laboratories, MELCOR Computer Code
Manuals, Vol.1: Primer and Users’ Guide, 1(January), 2017.

37
(Secchi, Zio, & Di Maio, 2008) Secchi, P., Zio, E., & Di Maio, F., Quantifying uncertainties in the
estimation of safety parameters by using bootstrapped artificial neural networks, Annals of
Nuclear Energy, 35(12), 2338–2350, 2008.
(Simulia, 2011) Simulia, D. C. S., Abaqus 6.11 analysis user’s manual, Abaqus 6.11 Documentation,
22, 2011.
(Stewart, 2009) Stewart, M. G., Mechanical behaviour of pitting corrosion of flexural and shear
reinforcement and its effect on structural reliability of corroding RC beams, Structural Safety,
31(1), 19–30, 2009.
(Stewart & Rosowsky, 1998) Stewart, M. G., & Rosowsky, D. V., Time-dependent reliability of
deteriorating reinforced concrete bridge decks, Structural Safety, 20(1), 91–109, 1998.
(Thoft-Christensen & Beck, 1982) Thoft-Christensen, P., & Beck, A. T., Structural Reliability Theory
and Its Applications. Springer - Verlag, 1982.
(Tuutti, 1982) Tuutti, K., Corrosion of steel in concrete. Swedish Cement and Concrete Research
Institute, 1982.
(Vu & Stewart, 2000) Vu, K. A. T., & Stewart, M. G., Structural reliability of concrete bridges
including improved chloride-induced corrosion models, Structural Safety, 22(4), 313–333, 2000.
(Wald, 1943) Wald A., An extension of Wilks method for setting tolerance limits. Ann Math Stat
1943; 14(1): 45–55.
(Wakefield, Budniz, & Kiper, 2014) Wakefield, D. J., Budniz, R. J., & Kiper, K. L., Requirements
for Low Power and Shutdown Probabilistic Safety Assessment, ANS/ASME-58.22. ASME,
2014.
(Zio, 2014) Zio, E., Integrated deterministic and probabilistic safety assessment: Concepts,

38
challenges, research directions, Nuclear Engineering and Design, 280, 413–419, 2014.
(Zio & Di Maio, 2008) Zio, E., & Di Maio, F., Bootstrap and Order Statistics for Quantifying
Thermal-Hydraulic Code Uncertainties in the Estimation of Safety Margins, Science and
Technology of Nuclear Installations, 2008, 1–9, 2008.