Dynamic Regulation of H3K27 Trimethylation during ...
20
Dynamic Regulation of H3K27 Trimethylation during Arabidopsis Differentiation Marcel Lafos 1 , Phillip Kroll 1 , Mareike L. Hohenstatt 1 , Frazer L. Thorpe 2 , Oliver Clarenz 1¤ , Daniel Schubert 1 * 1 Institute of Genetics, Heinrich-Heine-University Duesseldorf, Duesseldorf, Germany, 2 Institute for Molecular Plant Sciences, University of Edinburgh, Edinburgh, United Kingdom Abstract During growth of multicellular organisms, identities of stem cells and differentiated cells need to be maintained. Cell fate is epigenetically controlled by the conserved Polycomb-group (Pc-G) proteins that repress their target genes by catalyzing histone H3 lysine 27 trimethylation (H3K27me3). Although H3K27me3 is associated with mitotically stable gene repression, a large fraction of H3K27me3 target genes are tissue-specifically activated during differentiation processes. However, in plants it is currently unclear whether H3K27me3 is already present in undifferentiated cells and dynamically regulated to permit tissue-specific gene repression or activation. We used whole-genome tiling arrays to identify the H3K27me3 target genes in undifferentiated cells of the shoot apical meristem and in differentiated leaf cells. Hundreds of genes gain or lose H3K27me3 upon differentiation, demonstrating dynamic regulation of an epigenetic modification in plants. H3K27me3 is correlated with gene repression, and its release preferentially results in tissue-specific gene activation, both during differentiation and in Pc-G mutants. We further reveal meristem- and leaf-specific targeting of individual gene families including known but also likely novel regulators of differentiation and stem cell regulation. Interestingly, H3K27me3 directly represses only specific transcription factor families, but indirectly activates others through H3K27me3-mediated silencing of microRNA genes. Furthermore, H3K27me3 targeting of genes involved in biosynthesis, transport, perception, and signal transduction of the phytohormone auxin demonstrates control of an entire signaling pathway. Based on these and previous analyses, we propose that H3K27me3 is one of the major determinants of tissue-specific expression patterns in plants, which restricts expression of its direct targets and promotes gene expression indirectly by repressing miRNA genes. Citation: Lafos M, Kroll P, Hohenstatt ML, Thorpe FL, Clarenz O, et al. (2011) Dynamic Regulation of H3K27 Trimethylation during Arabidopsis Differentiation. PLoS Genet 7(4): e1002040. doi:10.1371/journal.pgen.1002040 Editor: Tetsuji Kakutani, National Institute of Genetics, Japan Received October 20, 2010; Accepted February 16, 2011; Published April 7, 2011 Copyright: ß 2011 Lafos et al. This is an open-access article distributed under the terms of the Creative Commons Attribution License, which permits unrestricted use, distribution, and reproduction in any medium, provided the original author and source are credited. Funding: Work in the Schubert lab is supported by the Deutsche Forschungsgemeinschaft (www.dfg.de) through grant SFB590. The funders had no role in study design, data collection and analysis, decision to publish, or preparation of the manuscript. Competing Interests: The authors have declared that no competing interests exist. * E-mail: [email protected] ¤ Current address: University of Bamberg, Bamberg, Germany Introduction Throughout their lifecycle, plants produce new organs through a group of undifferentiated cells which are maintained in structures called meristems. These pluripotent cells continuously divide and, in the shoot, cells in the periphery of the apical meristem differentiate to give rise to lateral organs like leaves or flowers. Stem cell maintenance is tightly controlled by numerous and interconnected pathways involving transcriptional regulation, phytohormones, microRNAs and epigenetic gene regulation (reviewed in [1]). Epigenetic gene regulation is a key mechanism to confer stable, but reversible gene expression states. Epigenetics has been revealed as fundamental mechanism to maintain cell and tissue identity and to regulate stem cells and cancer. Important epigenetic regulators of developmental processes are the Polycomb-group (Pc-G) and Trithorax-group (Trx-G) proteins which catalyze histone H3 lysine 27 trimethylation (H3K27me3) or H3K4me3, respectively (reviewed in [2,3]). In Arabidopsis, around 5% of the canonical histone H3.1 is trimethylated at K27 [4]. Pc-G target genes in plants and animals are covered by H3K27me3 [5–8], a distribution that likely permits epigenetic inheritance of the modification [9]. Whereas Drosophila melanogaster Polycomb repressive complex 2 (PRC2) was shown to methylate H3K27 in vitro and in vivo via its histone methyltransferase subunit Enhancer of zeste [E(z)] [10–13], evidence for the biochemical activity of the conserved plant PRC2 is still lacking. H3K27me3 was shown to depend at least partially on plant PRC2 members as loss of the E(z) homolog CURLY LEAF (CLF) leads to reduced levels of H3K27me3 [8,14]. In addition, immunoflu- orescence analyses of plants lacking the redundantly acting E(z) homologs CLF and SWINGER (SWN) revealed a reduction in euchromatic H3K27me3, but also a frequent re-distribution to chromocenters [15]. In plants, numerous developmental pathways are controlled by Pc-G proteins including seed development, flowering time, vernalization and organ identity (reviewed in [16,17]). Loss of sporophytic Pc-G activity results in plants that show overprolifera- tion and strong defects in organ identity [18,19]. The severe phenotypes of Pc-G mutants indicate an essential role for Pc-G proteins in plant development which was strongly supported by whole genome analyses of H3K27me3 targets. In seedlings, more PLoS Genetics | www.plosgenetics.org 1 April 2011 | Volume 7 | Issue 4 | e1002040 brought to you by CORE View metadata, citation and similar papers at core.ac.uk provided by PubMed Central
Transcript of Dynamic Regulation of H3K27 Trimethylation during ...

Dynamic Regulation of H3K27 Trimethylation duringArabidopsis DifferentiationMarcel Lafos1, Phillip Kroll1, Mareike L. Hohenstatt1, Frazer L. Thorpe2, Oliver Clarenz1¤, Daniel
Schubert1*
1 Institute of Genetics, Heinrich-Heine-University Duesseldorf, Duesseldorf, Germany, 2 Institute for Molecular Plant Sciences, University of Edinburgh, Edinburgh, United
Kingdom
Abstract
During growth of multicellular organisms, identities of stem cells and differentiated cells need to be maintained. Cell fate isepigenetically controlled by the conserved Polycomb-group (Pc-G) proteins that repress their target genes by catalyzinghistone H3 lysine 27 trimethylation (H3K27me3). Although H3K27me3 is associated with mitotically stable gene repression,a large fraction of H3K27me3 target genes are tissue-specifically activated during differentiation processes. However, inplants it is currently unclear whether H3K27me3 is already present in undifferentiated cells and dynamically regulated topermit tissue-specific gene repression or activation. We used whole-genome tiling arrays to identify the H3K27me3 targetgenes in undifferentiated cells of the shoot apical meristem and in differentiated leaf cells. Hundreds of genes gain or loseH3K27me3 upon differentiation, demonstrating dynamic regulation of an epigenetic modification in plants. H3K27me3 iscorrelated with gene repression, and its release preferentially results in tissue-specific gene activation, both duringdifferentiation and in Pc-G mutants. We further reveal meristem- and leaf-specific targeting of individual gene familiesincluding known but also likely novel regulators of differentiation and stem cell regulation. Interestingly, H3K27me3 directlyrepresses only specific transcription factor families, but indirectly activates others through H3K27me3-mediated silencing ofmicroRNA genes. Furthermore, H3K27me3 targeting of genes involved in biosynthesis, transport, perception, and signaltransduction of the phytohormone auxin demonstrates control of an entire signaling pathway. Based on these and previousanalyses, we propose that H3K27me3 is one of the major determinants of tissue-specific expression patterns in plants,which restricts expression of its direct targets and promotes gene expression indirectly by repressing miRNA genes.
Citation: Lafos M, Kroll P, Hohenstatt ML, Thorpe FL, Clarenz O, et al. (2011) Dynamic Regulation of H3K27 Trimethylation during Arabidopsis Differentiation. PLoSGenet 7(4): e1002040. doi:10.1371/journal.pgen.1002040
Editor: Tetsuji Kakutani, National Institute of Genetics, Japan
Received October 20, 2010; Accepted February 16, 2011; Published April 7, 2011
Copyright: � 2011 Lafos et al. This is an open-access article distributed under the terms of the Creative Commons Attribution License, which permitsunrestricted use, distribution, and reproduction in any medium, provided the original author and source are credited.
Funding: Work in the Schubert lab is supported by the Deutsche Forschungsgemeinschaft (www.dfg.de) through grant SFB590. The funders had no role in studydesign, data collection and analysis, decision to publish, or preparation of the manuscript.
Competing Interests: The authors have declared that no competing interests exist.
* E-mail: [email protected]
¤ Current address: University of Bamberg, Bamberg, Germany
Introduction
Throughout their lifecycle, plants produce new organs through
a group of undifferentiated cells which are maintained in
structures called meristems. These pluripotent cells continuously
divide and, in the shoot, cells in the periphery of the apical
meristem differentiate to give rise to lateral organs like leaves or
flowers. Stem cell maintenance is tightly controlled by numerous
and interconnected pathways involving transcriptional regulation,
phytohormones, microRNAs and epigenetic gene regulation
(reviewed in [1]).
Epigenetic gene regulation is a key mechanism to confer stable,
but reversible gene expression states. Epigenetics has been
revealed as fundamental mechanism to maintain cell and tissue
identity and to regulate stem cells and cancer.
Important epigenetic regulators of developmental processes are
the Polycomb-group (Pc-G) and Trithorax-group (Trx-G) proteins
which catalyze histone H3 lysine 27 trimethylation (H3K27me3)
or H3K4me3, respectively (reviewed in [2,3]). In Arabidopsis,
around 5% of the canonical histone H3.1 is trimethylated at K27
[4]. Pc-G target genes in plants and animals are covered by
H3K27me3 [5–8], a distribution that likely permits epigenetic
inheritance of the modification [9]. Whereas Drosophila melanogaster
Polycomb repressive complex 2 (PRC2) was shown to methylate
H3K27 in vitro and in vivo via its histone methyltransferase
subunit Enhancer of zeste [E(z)] [10–13], evidence for the
biochemical activity of the conserved plant PRC2 is still lacking.
H3K27me3 was shown to depend at least partially on plant PRC2
members as loss of the E(z) homolog CURLY LEAF (CLF) leads
to reduced levels of H3K27me3 [8,14]. In addition, immunoflu-
orescence analyses of plants lacking the redundantly acting E(z)
homologs CLF and SWINGER (SWN) revealed a reduction in
euchromatic H3K27me3, but also a frequent re-distribution to
chromocenters [15].
In plants, numerous developmental pathways are controlled by
Pc-G proteins including seed development, flowering time,
vernalization and organ identity (reviewed in [16,17]). Loss of
sporophytic Pc-G activity results in plants that show overprolifera-
tion and strong defects in organ identity [18,19]. The severe
phenotypes of Pc-G mutants indicate an essential role for Pc-G
proteins in plant development which was strongly supported by
whole genome analyses of H3K27me3 targets. In seedlings, more
PLoS Genetics | www.plosgenetics.org 1 April 2011 | Volume 7 | Issue 4 | e1002040
brought to you by COREView metadata, citation and similar papers at core.ac.uk
provided by PubMed Central

than 4000 H3K27me3 target genes were uncovered which are
largely protein-coding genes and mostly exclude transposable
element genes and heterochromatic regions [5,20,21]. A strikingly
large number of developmentally important transcription factor
genes showed H3K27me3 coverage [5]. However, the fact that
key genes involved in the biosynthesis and inactivation of the
phytohormone gibberellic acid exhibit enrichment in H3K27me3
[22] indicates an important role for Pc-G proteins in regulating
developmental processes beyond the transcription factor level.
Numerous genome-wide analyses of H3K27me3 and Pc-G protein
binding have been performed for mammals and Drosophila [6,23–
29]. These studies revealed a considerably smaller number of
target genes in Drosophila and mammals compared to Arabidopsis,
but also key developmental transcription factor genes as
H3K27me3 targets.
Presence of H3K27me3 is largely correlated with gene silencing
in animals and plants, although H3K27me3 is only partially
removed upon gene activation in Drosophila [30]. In Arabidopsis,
H3K27me3 targets are enriched for genes with tissue-specific
expression patterns or are induced by abiotic or biotic stresses
suggesting that H3K27me3 is dynamically regulated in response to
developmental or environmental cues [5]. Indeed, several
thousand genes either lose or gain H3K27me3 when etiolated
seedlings were transferred into light [22]. Furthermore, a novel
approach of cell-type specific tagging and isolation of nuclei
allowing cell type specific analyses of hair and non-hair cells of the
Arabidopsis root epidermis revealed hundreds of genes carrying
differential H3K4me3 and H3K27me3 in the two cell types and a
strong correlation of gene repression with low H3K4me3 and high
H3K27me3 [31].
Different cell types can harbor distinct chromatin profiles which
is particularly the case for pluripotent mammalian embryonic stem
(ES) cells [7,32]. Many genes in ES cells carry bivalent marks, thus
both H3K4me3 and H3K27me3, which are mostly resolved to
monovalent states of either H3K4me3 or H3K27me3 during
differentiation [7,33]. In plants, however, it is currently unclear if
undifferentiated cells harbor distinct chromatin profiles.
Here, we present genome-wide analyses of H3K27me3 as well
as gene expression analyses from meristematic, undifferentiated
cells and differentiated leaf cells using the vegetative shoot apical
meristem as a model system. We confirm a large fraction of
previously identified H3K27me3 targets and reveal several
hundred additional, tissue-specifically methylated genes. Genes
with strong expression differences in the two tissues are enriched
for differential H3K27me3 suggesting that also in plants Pc-G
proteins define gene ON/OFF expression states. We find that a
large fraction of microRNA genes are differentially methylated in
meristems and leaves and that their tissue-specific expression
patterns are controlled by Pc-G proteins. In addition, a large
number of genes involved in biosynthesis, transport, perception
and signaling of the phytohormone auxin are among the identified
target genes suggesting that entire gene regulatory networks are
controlled and possibly stabilized by Pc-G mediated gene
regulation. Collectively, our analyses suggest that Pc-G proteins
control differentiation processes by conferring tissue-specific
H3K27me3 of hundreds of genes including microRNA genes
and genes involved hormonal pathways.
Results
Genome-wide analyses of gene expression andH3K27me3 in meristems and leaves
In Arabidopsis seedlings, several thousand genes are covered by
H3K27me3 [5,20].
It was previously suggested that H3K27me3 is required for
stable gene repression throughout most of the plants lifecycle and
is either reset to allow gene activation or acquired at later
developmental stages to confer stable expression states during
differentiation processes [5,34]. In order to uncover dynamic
regulation of H3K27me3 during development, undifferentiated
meristematic (Me) and differentiated leaf (Le) tissues of clavata3
(clv3) mutant plants were analysed. Meristematic tissue and stem
cells can be easily isolated from clv3 mutants by manual dissection
as the mutant harbours larger vegetative shoot apical meristems
and increased stem cell numbers [35] (Figure 1A). Importantly,
leaf development is not affected by loss of CLV3. Both leaf and
meristematic tissue samples were subjected to array based genome
wide expression (Figure 1) and H3K27me3 (Figure 2) profiling.
Therefore, this approach permits the identification of H3K27me3
targets that gain or lose H3K27me3 during differentiation of
meristematic cells. In addition, the associated changes in gene
expression of H3K27me3 targets can be revealed.
The expression analysis verified both sample identity and
specific enrichment of each dissected tissue because typical
transcripts characteristic for the meristematic domain or green
tissue were detected as highly and differentially expressed
(Figure 1C). Meristem and stem cell identity genes like
SHOOTMERISTEMLESS (STM), CLV3 and WUSCHEL (WUS)
were highly expressed in the meristematic sample whereas
photosynthesis-related genes encoding for subunits of RUBISCO
(RBCS-1B) or light harvesting complexes (LHCB1.4) were exclu-
sively detected in leaves.
We generated genome-wide H3K27me3 profiles for each tissue
by hybridizing sheared genomic DNA that was immunoprecipi-
tated with an antibody detecting H3K27me3 to high density tiling
arrays, as was previously described [36,37]. We identified a total of
9006 H3K27me3 target genes in the two tissues which include
more than 7400 protein coding genes (27,6% of all annotated
Arabidopsis protein coding genes) and interestingly also 74 miRNA
genes (43% of all miRNA genes) (Figure 2). Importantly, more
than 80% of protein coding H3K27me3 target genes identified in
Author Summary
All organs and differentiated tissues in multicellularorganisms are derived from undifferentiated pluripotentstem cells. The evolutionarily conserved Polycomb-group(Pc-G) proteins control stem cell identity and maintenance,likely by repressing genes involved in differentiationprocesses. Pc-G proteins are epigenetic regulators, thusthey maintain stable expression states of their target genesthrough cell divisions that are not accompanied bychanges in their DNA sequence. In this study, we askedwhether Pc-G–mediated gene regulation is also dynami-cally regulated in plant development to confer stable, butflexible gene expression states that may switch in responseto developmental or environmental cues. We thereforegenerated genome-wide maps of Pc-G activity of undif-ferentiated stem cell and differentiated leaf cell tissueswhich revealed dynamic regulation of Pc-G activity inplants. Pc-G activity is correlated with gene repression andits tissue-specific release results in local gene activation.Pc-G proteins target specific gene families in the twoanalyzed tissues, indicating a role for Pc-G proteins inbalancing pluripotency and differentiation in plants. Basedon our analyses, we propose that Pc-G activity not onlypermits long-term gene regulation but also has a morebasic gene regulatory function in fine-tuning expressionpatterns of specific gene families during differentiation.
Dynamic Regulation of H3K27me3 in Plants
PLoS Genetics | www.plosgenetics.org 2 April 2011 | Volume 7 | Issue 4 | e1002040

our study were also revealed in previous analyses of young
seedlings [5,20], demonstrating the validity of our approach. Both
former studies were performed with 14 days old wildtype plants,
whole seedlings or their aerial parts, whereas the tissue samples
analyzed in our study were derived from 9 weeks old clv3 mutant
plants. The large H3K27me3 overlap in the different tissues
therefore suggests extensive and stable gene silencing by Pc-G
mediated H3K27me3 throughout vegetative plant development.
In addition to a large number of common H3K27me3 targets, the
analysis identified many, presumably tissue-specific protein coding
target genes (1001 genes only detected in seedlings (by Oh et al.
[20]); 1230 genes only identified in meristem or young leaf tissue in
our study) (Figure 2A). Interestingly, although previous studies
showed that transposable elements (TE) are largely devoid of
H3K27me3 [5,20], we detected a high number of TEs as
meristem-specific H3K27me3 targets (Figure 2B). This suggests
an unexpected role for Pc-G proteins in the regulation of TEs
specifically in the stem cell harbouring meristem.
To study the role of H3K27me3 in controlling developmentally
important genes we focused our analyses on protein coding and
miRNA genes and compared the methylation profiles of the
individual tissues (Figure 2B, 2C). This uncovered large differences
between both samples as nearly 2000 protein coding and 27
miRNA genes were exclusively methylated in one sample (Me or
Le) revealing these as tissue-specific H3K27me3 targets (details for
all annotations are shown in Table S1). Interestingly, in contrast to
the largely meristem-specific H3K27me3 targeting of TEs, a larger
set of protein coding and miRNA H3K27me3 targets was
identified in the leaf compared to the meristematic sample
(Figure 2B). Thus, heterochromatic and euchromatic loci may
be differentially targeted by Pc-G proteins in undifferentiated and
differentiated tissues.
For further analyses on the comparison of H3K27me3 presence
and gene expression and on gene families we isolated genes
harbouring defined methylation levels and performed conservative
statistical analyses to group these into sets of equally (M = L) and
differentially methylated genes [meristem- (dM+) and leaf- (dL+)
specific] (see methods). These analyses uncovered 1519 protein
coding genes showing equal H3K27me3 levels in both samples,
158 genes specifically methylated in the meristem and 457 genes
methylated in leaves (Figure 2C).
Collectively, our analyses uncover dynamic regulation of a large
number of H3K27me3 target genes during differentiation which
involves acquisition and removal of H3K27me3 at protein coding,
miRNA and TE genes.
Confirmation of differential methylation in wildtypemeristems and leaves
We sought to confirm the genome-wide, tissue-specific
H3K27me3 patterns by independent ChIP experiments on
meristems and leaves of clv3 mutants (Figure S1) and wildtype
(Figure 3). The transcription factors KNOTTED-LIKE FROM
ARABIDOPSIS THALIANA2 (KNAT2) and KNAT6 are specifically
expressed in the meristem ([38], (Figure 3)) and were identified as
leaf specifically methylated (dL+) (Figure S1A representatively
shows the KNAT6 locus). H3K27me3 ChIP-qPCR analysis of
independently dissected clv3 tissues confirmed low meristematic and
high leaf H3K27me3 levels for KNAT2 and KNAT6 and revealed an
antagonistic pattern of the active mark H3K4me3 (Figure S1B,
S1C). Thus, H3K4me3 and H3K27me3 distribution are consistent
with meristem specific expression of both KNAT genes (Figure 3E).
To further prove the significance of differential H3K27me3
identified by ChIP-chip on clv3 mutants (Figure 2) we performed
Figure 1. Tissue enrichment through manual dissection of Arabidopsis clv3 mutants. (A) Nine week old clv3–9 plant grown under short dayconditions, (B) longitudinal section of plant shown in (A). The section plane is marked with a dashed line in A, scale bars indicate 1 cm. Two samples, ameristematic fraction (Me) marked with a dotted circle and young leaves (Le) were harvested. (C) Differential expression of known reference genesobtained by genome wide expression analysis in the two dissected tissues. CLV3 expression is detected as the point mutation in the clv3–9 allele doesnot interfere with CLV3 transcriptional regulation.doi:10.1371/journal.pgen.1002040.g001
Dynamic Regulation of H3K27me3 in Plants
PLoS Genetics | www.plosgenetics.org 3 April 2011 | Volume 7 | Issue 4 | e1002040

ChIP-qPCR analyses of 2 months old dissected wildtype plants,
grown under short day conditions. Consistent with the data on clv3,
KNAT2 and KNAT6 showed leaf specific H3K27me3 (Figure 3). In
addition, equal methylation for the non-expressed genes AGAMOUS
and FUSCA3 and differential methylation of several transcription
factor genes, PIN-FORMED (PIN) auxin efflux carriers and
microRNA genes were confirmed (Figure 3). For all genes tested
by ChIP, moderate to strong differential expression was detected
which was highest in the tissues lacking H3K27me3 (Figure 3E).
Thus, these analyses strongly suggest that the clv3 ChIP-chip results
are transferable to wild type plants.
Presence of H3K27me3 is correlated with generepression in a tissue-specific manner
Since we had identified tissue-specific H3K27me3 target genes
we asked whether differential H3K27me3 is correlated with
Figure 2. Tissue-specific ChIP-on-chip analysis reveals differentially methylated genes. (A, B) The venn diagrams represent a comparisonof H3K27me3 covered loci taken from three independent genome wide analyses of Arabidopsis plants (Zhang et al. [5]; Oh et al. [20] and this work,meristem (Me) + leaves (Le)). (A) Comparison of all annotations (left) and of protein coding genes (right) in published data and union of Me+Le. (B)Comparison of protein coding (left), transposable element (middle) and microRNA genes (right) in union of published data and Me and Le sample. (C)Comparison of Me and Le targets, protein coding (left) and microRNA genes (right). Statistical analyses (see methods) were applied to uncoversignificantly differentially or equally methylated genes in meristem and leaves. Annotations are based on TAIR8 genome annotation.doi:10.1371/journal.pgen.1002040.g002
Dynamic Regulation of H3K27me3 in Plants
PLoS Genetics | www.plosgenetics.org 4 April 2011 | Volume 7 | Issue 4 | e1002040

differential gene expression. In total, more than 22000 protein
coding genes (85% of the genome) were expressed in at least one of
the tissues. A large fraction (nearly 9500 genes) showed equal
expression in both samples [X(M = L)], whereas 2.833 were at
least four times higher expressed in one sample compared to the
other [1.865 higher in the meristem (dXM$2, Dlog2) and 968
higher in leaves (dXL#22, Dlog2)] (Figure 4A, Figure S2). We
next binned genes with similar expression differences in the two
tissues (Figure 4B, Table S2). These gene sets were analyzed for
enrichment of H3K27me3 targets (Figure 4B) and of genes
harbouring equal or differential H3K27me3 levels (M = L, dM+,
dL+) (Figure 4C). In addition, we performed the reciprocal
analyses (Figure 4D). Genes that were equally expressed both in
the meristem and the leaves (X(M = L)) showed a significant
underrepresentation of H3K27me3 targets (Figure 4B). In
contrast, methylated genes were more frequent in the groups of
non expressed and differentially expressed genes (Figure 4B).
Interestingly, the relative abundance of target genes increased with
increasing tissue specific expression in the meristem (Me+) or
leaves (Le+) (Figure 4B). We next asked how differential
expression relates to differential or equal H3K27me3
(Figure 4C). This detailed tissue specific analysis clearly revealed
that the highly specific expression in one tissue (dXM$2 or
dXL#22) was correlated with a depletion of tissue specific
methylation (dM+ or dL+) in the same sample and a strong
enrichment of repressive histone methylation in the other – non
expressing – sample. Importantly, the stronger the differences in
gene expression levels between the two tissues, the more genes
were identified which showed antagonistic, differential
H3K27me3 (Figure 4C). Genes showing equal H3K27me3 levels
in both tissues were enriched for non-expressed genes which was
not the case for differentially methylated genes, revealing that
most genes carrying differential methylation are expressed in at
least one of the tissues (Figure 4C, 4D). We found the same
correlations when the analyses were performed with the different
subsets of H3K27me3 covered genes (Figure 4D). Leaf-specifi-
Figure 3. Confirmation of differentially methylated genes in wildtype plants. Differential H3K27me3 in meristem and leaves of wildtypewas confirmed by independent H3K27me3-ChIP analyses for selected transcription factors (A), transporters (B), enzymes (C) and miRNA genes (D).Green: relative enrichment of H3K27me3 in leaves; yellow: relative enrichment of H3K27me3 in meristem. Enrichment factors between differenttissues are indicated in brackets. 2 months old, short-day grown wild type plants were manually dissected. Enrichment of specific loci is normalized tothe H3K27me3 target FUSCA3 harbouring equal methylation levels in both tissues. The results are shown as mean values of two independentprecipitations and qPCR analyses. Methylation of KNAT6 was not detectable (nd) in the meristem sample. (E) Differential expression of genes analyzedin (A) – (D). Data was retrieved from whole transcriptome analyses of manually dissected clv3 mutant meristems and leaves.doi:10.1371/journal.pgen.1002040.g003
Dynamic Regulation of H3K27me3 in Plants
PLoS Genetics | www.plosgenetics.org 5 April 2011 | Volume 7 | Issue 4 | e1002040

cally expressed genes (dXL#22) were more frequent in the set of
meristem specifically methylated genes (dM+) and vice versa
whereas genes showing equal, but detectable methylation
(M = L) were depleted of expressed genes.
In whole genome analyses of H3K27me3 in seedlings, Oh et al.
[20] identified 1001 H3K27me3 targets which were not revealed
in our analyses (Figure 2A). 824 of these are expressed in at least
one of the tissues we analyzed (data not shown), suggesting that
these targets are seedling-specifically methylated and are subjected
to dynamic changes of H3K27me3 in development.
Functional characterization of H3K27me3 target genesby Gene Ontology and gene family analyses
Previous analyses of H3K27me3 target genes in seedlings
identified transcription factors as a major class of H3K27me3
target genes [5]. To reveal whether all transcription factor families
and other gene families are preferentially targeted by H3K27me3
we analyzed our datasets generated from leaves and meristems.
We first exploited the resources of the Gene Ontology (GO)
annotations from TAIR (http://www.arabidopsis.org/) providing
functional categorizations of Arabidopsis protein coding genes
Figure 4. Anti-correlation of gene expression and repressive H3K27 tri-methylation. (A) Genome-wide relation of gene expression andH3K27me3 targeting (I). (II) Representation of percentage of genes for defined expression states. (III) Representation of percentage of genes fordefined H3K27me3 levels. For expressed genes and H3K27me3 targets, number of genes detected in leaves or meristems of clv3 mutants wasmerged and compared to genes present on Agilent array (for II) or all protein coding genes (for III). (B) Relative proportion of H3K27me3 target geneswithin gene sets of defined expression levels, y-axis indicates fold enrichment compared to subset frequency in the genome, i.e. target genes or nontarget genes. (C) Relative proportion of equally and differentially methylated H3K27me3 target genes within gene sets of defined expression levels, y-axis indicates fold enrichment compared to specific subset frequency in the genome. (D) Relative proportion of differentially or equally expressedgenes within gene sets of differentially, equally or non-methylated genes, y-axis indicates fold enrichment compared to specific subset frequency inthe genome. Significant differences (Students tTest; p#0.05) are marked with an asterisk (*). Coloured brackets indicate significant differences forsimilarly coloured bars within the bracket. Statistical analyses and gene lists are shown in Table S2. Abbreviations: exp. (expressed); dXM (preferentialexpression in meristem as Dlog2(Me/Le)); dXL (preferential expression in leaf as Dlog2(Me/Le)); X(M = L) (equal expression in meristem and leaf); dM+(H3K27me3 meristem specific); dL+ (H3K27me3 leaf specific); M = L (equal level of H3K27me3 in leaf and meristem); see methods for details onsubsets of differentially expressed and methylated genes.doi:10.1371/journal.pgen.1002040.g004
Dynamic Regulation of H3K27me3 in Plants
PLoS Genetics | www.plosgenetics.org 6 April 2011 | Volume 7 | Issue 4 | e1002040
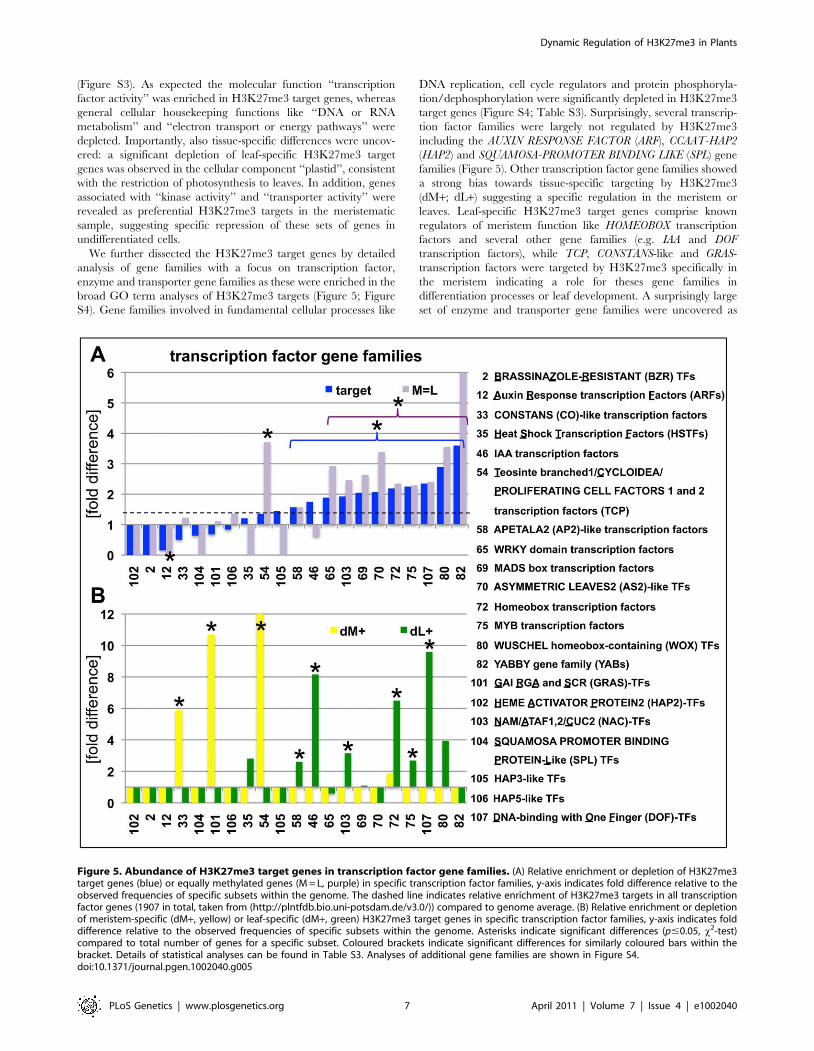
(Figure S3). As expected the molecular function ‘‘transcription
factor activity’’ was enriched in H3K27me3 target genes, whereas
general cellular housekeeping functions like ‘‘DNA or RNA
metabolism’’ and ‘‘electron transport or energy pathways’’ were
depleted. Importantly, also tissue-specific differences were uncov-
ered: a significant depletion of leaf-specific H3K27me3 target
genes was observed in the cellular component ‘‘plastid’’, consistent
with the restriction of photosynthesis to leaves. In addition, genes
associated with ‘‘kinase activity’’ and ‘‘transporter activity’’ were
revealed as preferential H3K27me3 targets in the meristematic
sample, suggesting specific repression of these sets of genes in
undifferentiated cells.
We further dissected the H3K27me3 target genes by detailed
analysis of gene families with a focus on transcription factor,
enzyme and transporter gene families as these were enriched in the
broad GO term analyses of H3K27me3 targets (Figure 5; Figure
S4). Gene families involved in fundamental cellular processes like
DNA replication, cell cycle regulators and protein phosphoryla-
tion/dephosphorylation were significantly depleted in H3K27me3
target genes (Figure S4; Table S3). Surprisingly, several transcrip-
tion factor families were largely not regulated by H3K27me3
including the AUXIN RESPONSE FACTOR (ARF), CCAAT-HAP2
(HAP2) and SQUAMOSA-PROMOTER BINDING LIKE (SPL) gene
families (Figure 5). Other transcription factor gene families showed
a strong bias towards tissue-specific targeting by H3K27me3
(dM+; dL+) suggesting a specific regulation in the meristem or
leaves. Leaf-specific H3K27me3 target genes comprise known
regulators of meristem function like HOMEOBOX transcription
factors and several other gene families (e.g. IAA and DOF
transcription factors), while TCP, CONSTANS-like and GRAS-
transcription factors were targeted by H3K27me3 specifically in
the meristem indicating a role for theses gene families in
differentiation processes or leaf development. A surprisingly large
set of enzyme and transporter gene families were uncovered as
Figure 5. Abundance of H3K27me3 target genes in transcription factor gene families. (A) Relative enrichment or depletion of H3K27me3target genes (blue) or equally methylated genes (M = L, purple) in specific transcription factor families, y-axis indicates fold difference relative to theobserved frequencies of specific subsets within the genome. The dashed line indicates relative enrichment of H3K27me3 targets in all transcriptionfactor genes (1907 in total, taken from (http://plntfdb.bio.uni-potsdam.de/v3.0/)) compared to genome average. (B) Relative enrichment or depletionof meristem-specific (dM+, yellow) or leaf-specific (dM+, green) H3K27me3 target genes in specific transcription factor families, y-axis indicates folddifference relative to the observed frequencies of specific subsets within the genome. Asterisks indicate significant differences (p#0.05, x2-test)compared to total number of genes for a specific subset. Coloured brackets indicate significant differences for similarly coloured bars within thebracket. Details of statistical analyses can be found in Table S3. Analyses of additional gene families are shown in Figure S4.doi:10.1371/journal.pgen.1002040.g005
Dynamic Regulation of H3K27me3 in Plants
PLoS Genetics | www.plosgenetics.org 7 April 2011 | Volume 7 | Issue 4 | e1002040

H3K27me3 targets which are involved in differentiation or
developmental processes (e.g. cell wall biosynthesis), hormone
biosynthesis (YUCCA flavin monooxygenases, CYTOCHROME
P450s) or transport of photosynthetic products (sucrose transport-
ers) and hormones (PINFORMED (PIN)-like auxin efflux carriers)
(Figure S4, Table S3). Previous analysis had identified the actin
regulator formin ARABIDOPSIS FORMIN HOMOLOGUE 5
(AtFH5) as Pc-G target gene whose mis-expression is partially
responsible for Pc-G mutant seed phenotypes, revealing that
regulation of enzymatic genes is an important function of Pc-G
proteins [39].
Lastly, we studied whether specific transposable element gene
families were overrepresented in the different tissues. We generally
observed a significantly larger amount of retrotransposons
compared to DNA transposons as H3K27me3 target genes (Figure
S4H, Table S3). Also tissue-specific differences were identified
among retrotransposon gene families. Whereas gypsy-like retro-
transposons were significantly enriched in the meristematic
fraction, copia-like retrotransposons were overrepresented in
leaves and athila-like retrotransposons almost completely non-
targeted by H3K27me3 in leaves (Figure S4H).
Collectively, these analyses uncovered H3K27me3 targeting of
a diverse set of gene families which are involved in biosynthesis
and transport of secondary metabolites and transcriptional
regulation and ultimately in cellular differentiation. These sets of
genes include many known regulators of meristem or leaf
development and provide an important resource for the
identification of additional, novel factors involved in differentiation
or stem cell regulation. In addition, also specific transposable
element gene families are tissue-specifically targeted by
H3K27me3 suggesting differential regulation of TE genes in the
different tissues.
H3K27me3 targets specific miRNA gene families and isreduced at miRNA target genes
During the analyses of H3K27me3 targets we found that a large
number of miRNA and several trans-acting siRNA (tasiRNA)
genes carried H3K27me3 which was, to our knowledge, not
previously revealed (Figure 2). These regulatory RNAs display
differential methylation in the same way as protein coding genes,
thus many show leaf-specific H3K27me3, whereas only few carry
H3K27me3 exclusively in the meristem (Figure 2C). Seventy four
of the annotated 174 miRNA loci were identified in our analysis
and we revealed additional 12 that were detected, but not
described by previous studies [5,20]. Thus, nearly 50% of all
microRNA genes are covered by H3K27me3 (Figure 2, Table 1).
A high number of miRNAs (25 of 103 unique miRNAs) are encoded
in multiple loci which constitute 96 of all 174 miRNA loci
(Arabidopsis Small RNA Project (http://asrp.cgrb.oregonstate.edu/)
[40]). Multiple and single loci miRNAs are regulated by
H3K27me3 but miRNAs encoded in multiple loci are heavily
targeted (72%) whereas only 22% of miRNAs present at a single
locus are H3K27me3 targets.
Currently 206 genes including many developmentally important
transcription factors are known which are negatively regulated by
miRNAs at a post-transcriptional level. Interestingly, genes that
are regulated by a H3K27me3 covered miRNA genes less
frequently carry H3K27me3 compared to genes whose expression
is controlled by a miRNA gene devoid of H3K27me3 (Table 1).
This bias is even more apparent when specific miRNA and
tasiRNA gene families and their targets are analyzed (Table 2):
whereas most miRNA169, miRNA156/157, miRNA167 and ta-
siRNA3 loci carry H3K27me3, their target genes (HAP2, SPL or
ARF genes) are largely devoid of H3K27me3. The lack of
H3K27me3 targeting of these transcription factor genes is in
contrast to the generally high enrichment of transcription factors
as H3K27me3 targets (Figure 5; compare HAP2, SPL and ARF
families to average enrichment in H3K27me3 targets of all
transcription factor genes, p,0.05 (x2-test) for HAP2 and ARF
genes (Table S3)). However, H3K27me3-mediated repression of
the miRNA genes likely permits an indirect positive regulation of
these specific transcription factor families by Pc-G proteins.
Interestingly, for other gene families (e.g. TCP and HD-ZIP
transcription factors) both miRNA genes and their targets carry
H3K27me3, suggesting that expression of these transcription
factors is regulated transcriptionally by Pc-G proteins and post-
transcriptionally by miRNAs.
Biosynthesis, transport, perception, and signaling genesof the phytohormone auxin are regulated byPc-G/H3K27me3
Our in-depth gene family analyses revealed enrichment of
specific biosynthetic enzymes, transporters and transcription
factors (Figure 5). Therefore, we inquired whether H3K27me3
targets entire developmental pathways which involve local
biosynthesis of a signaling molecule, its transport, perception and
signal transduction. We focused on the phytohormone auxin as we
initially realized that the PIN auxin efflux carriers are largely
H3K27me3 targets (Figure S4). Several pathways and gene
families (YUCCA monooxygenases, CYTOCHROME P450s and
TRYPTOPHANE AMINO TRANSFERASES) participate in the
biosynthesis of the phytohormone auxin from tryptophan
(reviewed in [41,42]). Auxin is transported by several different
carrier proteins in the plant. The AUXIN RESISTANT1 (AUX1)/
LIKE AUX1 (LAX) gene family enables auxin influx and PIN- and
several ATP-BINDING CASSETTE (ABC) transporters mediate
auxin efflux (reviewed in [43]). The analysis of gene families
uncovered that most of these gene families are enriched for
H3K27me3 targets (Figure 5, Figure S4), including the genes for
which a role in auxin regulation was shown (Table 3, Table 4).
Interestingly, although the auxin receptor gene TRANSPORT
INHIBITOR RESPONSE 1 (TIR1) and its homologues are largely
devoid of H3K27me3, miRNA393a which negatively regulates
Table 1. Regulation of miRNA and tasiRNA genes and theirtargets by H3K27me3.
type of small RNA no. of genes
total H3K27me3 targeted
miRNAs, single locus [78] 78 17 21.8%
miRNAs, multiple loci [25] 96 69 71.9%
total 174 86 49.4%
tasiRNAs [4] 8 2 25.0%
protein coding genesregulated by no. of genes
(type of small RNA) total H3K27me3 targeted
miRNAs (H3K27me3 targeted) 90 31 34.4%
miRNAs (non targeted) 119 49 41.2%
total 206 78 37.9%
tasiRNA 43 11 25.6%
H3K27me3 targeted small regulatory RNA genes encoded at single or multiplesites in the genome. H3K27me3 targets among miRNA or tasiRNA regulatedprotein coding genes.doi:10.1371/journal.pgen.1002040.t001
Dynamic Regulation of H3K27me3 in Plants
PLoS Genetics | www.plosgenetics.org 8 April 2011 | Volume 7 | Issue 4 | e1002040

these is targeted by H3K27me3 in leaves (Table 4). Similarly, the
ARF transcription factor genes which are involved in repressing
auxin inducible genes (reviewed in [44]) are depleted in
H3K27me3, however, miRNAs and tasiRNAs controlling ARF
expression levels are largely targeted by H3K27me3 (Figure 5,
Table 2, Table 4). On the other hand, IAA class of transcription
factors which positively regulate auxin responsive genes are highly
enriched for H3K27me3 targets, similar to other transcription
factor families. Thus, auxin biosynthesis, transport, perception and
transcriptional responses are controlled by H3K27me3, both by
direct targeting of the regulatory genes or by indirect regulation
through miRNAs. The analyses of the auxin pathway therefore
reveal that not only specific gene families but also entire pathways
involving diverse gene families can be controlled by H3K27me3.
H3K27me3 is entirely dependent on Pc-G proteinsOnly selected plant genes expressed in vegetative tissues were
previously analyzed for an overlap of H3K27me3 and Pc-G
protein binding and dependence of H3K27me3 on Pc-G proteins
[8,14,45,46]. Although immunofluorescence analyses on the
severe clf/swn mutants revealed a reduction in euchromatic
H3K27me3 [15], it is currently unclear whether the H3K27me3
is completely dependent on Pc-G proteins. To reveal whether
presence of H3K27me3 is likely corresponding to Pc-G binding
and regulation we used immunoblot analyses to study histone
methylation levels in various PRC2 mutants. We used mutants
that are partially or completely deficient for Arabidopsis homologs
Table 2. H3K27me3 targeted miRNAs or tasiRNAs encodedby multiple loci and H3K27me3 regulation of their targetgenes.
small RNA no. of genestarget genefamily no. of genes
(name) total H3K27me3 (name) miRNA H3K27me3
targeted targeted
miR394 2 2 100% F-Box 1 0 0%
miR845 2 2 100% - - - -
miR164 3 3 100% NAC 7 2 29%
miR158 2 2 100% PPR 22 3 14%
miR166/165 9 8 89% HDZIPIII 5 2 40%
miR169 14 12 86% HAP2 7 0 0%
miR395 6 5 83% APS,AST 4 1 25%
miR399 6 5 83% E2-UBC 1 0 0%
miR156/157 12 10 83% SPL 11 1 9%
miR172 5 4 80% AP2 6 2 33%
miR160/167 7 5 71% ARF 5 0 0%
miR159/319 6 4 67% MYB/TCP 12 5 42%
miR171 3 2 67% SCL 3 1 33%
miR393 2 1 50% TIR1 (F-box) 5 0 0%
miR168 2 1 50% AGO 1 0 0%
miR397 2 1 50% LAC 3 2 67%
miR390 2 1 50% TAS3 3 2 67%
miR447 3 1 33% 2-PGK 2 1 50%
total 88 69 78% total 98 22 22%
tasiRNA3 3 2 67% ARF 3 0 0%
All 174 annotated miRNA loci (based on TAIR8 annotation) were analyzed, 74 ofthem are H3K27me3 targeted in our analyses and 12 additional loci wereidentified as targets by Oh et al. [20]. miRNA regulated genes were extractedfrom the Arabidopsis Small RNA Project (http://asrp.cgrb.oregonstate.edu/) andTAIR (www.arabidopsis.org).doi:10.1371/journal.pgen.1002040.t002
Table 3. Genes involved in auxin biosynthesis and transportare regulated by PcG/H3K27me3.
source (biosynthesis and transport)
gene family/gene(name)
no. of loci(accession)
H3K27me3targeted loci
biosynthetic enzymes:
YUCCAs 34 23 67.6%
YUC1 AT4G32540 +
YUC2 AT4G13260 M = L
YUC4 AT5G11320 +
YUC6 AT5G25620 +
YUC11 AT1G21430 2
Cytochrome P450s 227 147 64.8%
CYP79b2 AT4G3995 +
CYP79b3 AT2G22330 +
CYP83b1 AT4G31500 2
CYP71A13 AT2G30770 M = L
TRP-a-transferases 3 2 66.7%
TAA1 AT1G70560 +
TAR1 AT1G23320 M = L
TAR2 AT4G24670 2
other enzymes
SUR1 (C-S LYASE) AT2G20610 2
NIT1 (Nitrilase) AT3G44310 2
NIT2 (Nitrilase) AT3G44300 +
NIT3 (Nitrilase) AT3G44320 2
transporters:
PINs 8 5 62.5%
PIN1 AT1G73590 dL+
PIN2 AT5G57090 M = L
PIN3 AT1G70940 2
PIN4 AT2G01420 (+*)
PIN5 AT5G16530 M = L
PIN6 AT1G77110 dL+
PIN7 AT1G23080 2
PIN8 AT5G15100 +
AUX/LAXs 4 3 75.0%
AUX1 AT2G38120 dL+
LAX1 AT5G01240 2
LAX2 AT2G21050 +
LAX3 AT1G77690 dL+
ABCs 128 46 35.9%
(ABCb1; ABCb4 and ABCb19 are no targets)
The table shows the fraction of H3K27me3 targeted genes in gene familiesinvolved in auxin biosynthesis and transport. Genes described to be involved inauxin biosynthesis [41,42] or transport [43,64] are listed below thecorresponding gene family. (+*) PIN4 was not detected as H3K27me3 target byChIP-chip but by ChIP-qPCR in wildtype meristems (see Figure 3).doi:10.1371/journal.pgen.1002040.t003
Dynamic Regulation of H3K27me3 in Plants
PLoS Genetics | www.plosgenetics.org 9 April 2011 | Volume 7 | Issue 4 | e1002040

of Drosophila E(z) [clf-28 (null allele), swn-7 (null allele)] or
Suppressor of zeste 12 [vernalization2-1 (vrn2-1) (null allele),
embryonic flower2–10 (emf2–10) (weak allele of emf2)] [18,47]. We
studied single and double mutants of these as they show different
degrees of reduction in somatic Pc-G activity: moderate reduction
in clf-28 and emf2–10 more severe reduction in vrn2/emf2–10
double mutants and complete loss of somatic Pc-G activity in the
clf/swn double mutant (Figure 6) [18]. H3K27me3 was completely
lost in the clf/swn mutants, strongly reduced in vrn2/emf2-10
mutants and only mildly affected in clf or emf2–10 mutants
(Figure 6). Loss of H3K27me3 in clf/swn was correlated with a
strong increase in H3K4me3. H3K27me1, a modification
preferentially present in heterochromatin, was not affected in
any of the mutants whereas H3K27me2 showed a clear reduction
in vrn2/emf2–10, but increase in clf/swn mutants (Figure S5). Thus,
our study of histone methylation in Pc-G mutants strongly suggests
that all H3K27me3 is catalyzed by PRC2 proteins and that a
possible re-distribution to heterochromatic regions [15] involves
only marginal amounts of H3K27me3.
Since the global analysis of H3K27me3 abundance revealed a
strong reduction even in the vrn2/emf2–10 double mutant
showing relatively mild morphological alterations (Figure 6A)
we were interested if a H3K27me3 reduction occurs at most
genes or gene-specifically. We therefore studied H3K27me3 of
selected genes in leaves from wildtype and vrn2/emf2–10 plants
by ChIP-qPCR (Figure S6). This analysis identified three
different classes: STM and FUS3 displayed no difference in
H3K27me3 in the mutants, several genes including KNAT2 or
PIN8 had intermediate H3K27me3 levels and most analyzed
genes (e.g. PIN1 and PIN6) showed a strong reduction or a
complete loss in the mutants. Thus, the observed global
reduction in H3K27me3 is rather caused by the loss of
H3K27me3 at some loci than by an equal reduction of
H3K27me3 at all target loci (Figure S6).
Pc-G proteins control tissue-specific expression of theirtarget genes
To study possible changes in gene expression resulting from a
reduction in H3K27me3, we performed qRT-PCR based
expression analyses of clf/swn and vrn2/emf2–10 double mutants
(Figure 7, Figure 8). Clf/swn mutants show complete loss of
H3K27me3, do not maintain organ identity post-embryonically
and are therefore only comparable to wildtype shortly after
germination. However, vrn2/emf2–10 mutants show strong leaf
serration especially in older leaves, but produce leaves and flowers
(Figure 6), thus tissue-specific changes in gene expression can also
be analyzed at later developmental stages. In 9 d old clf/swn
seedlings, we observed mis-expression of several previously
analysed H3K27me3 targets [8,48,49], ranging from mild
(KNAT2) to strong (KNAT6, STM and AG) mis-expression
(Figure 7A). Surprisingly, for TCP2, TCP4, TCP10 and SPL3 we
observed a strong down-regulation in clf/swn mutants although
they likely lost H3K27me3 (Figure 7B). However, TCP2, TCP4
TCP10 are negatively regulated by miRNA319 [50] which is
targeted by H3K27me3 (Figure 3). Consistently, we observed mis-
expression of the miRNA319a precursor in clf/swn mutants which is
likely responsible for post-transcriptional down-regulation of
TCP2, 4 and 10 in the Pc-G mutant. Expression of TCP5 which
is not targeted by miRNA319 is not affected in the mutant.
Similarly, SPL3 whose abundance is regulated by the H3K27me3
targeted miRNA156 showed reduced expression in clf/swn
mutants (Figure 7B).
H3K27me3 targets 6 of the 8 PIN gene members (Table 3), we
therefore also analysed their expression in clf/swn and vrn2/emf2–
10 mutants. Except for PIN1, none of the PIN genes showed
upregulation in the mutants (Figure 7A, Figure S6). PIN3, PIN4
and PIN7 which are all not targeted by H3K27me3 in leaves even
showed a strong down-regulation of expression in clf/swn
mutants.
As we also revealed H3K27me3 targeting of several TE genes,
we studied expression of several H3K27me3 targeted TE genes.
We observed upregulation of two TE genes in the clf/swn mutant
Table 4. Genes involved in auxin perception and signalingare regulated by PcG/H3K27me3.
sink (perception and signaling)
gene family/gene(name)
no. of loci(accession)
H3K27me3targeted loci
receptors:
TIR1/Fboxes 6 1 16.7%
TIR1 AT3G62980 2 (miR393)
AFB1 AT4G03190 2 (miR393)
AFB2 AT3G26810 + (miR393)
AFB3 AT1G12820 2 (miR393)
AT4G24390 AT4G24390 2 (2)
AT5G49980 AT5G49980 2 (2)
transcription factors:
IAAs 29 14 48.3%
IAA1 AT4G14560 dL+
IAA2 AT3G23030 dL+
IAA5 AT1G15580 +
IAA6 AT1G52830 M = L
IAA7 AT3G23050 +
IAA14 AT4G14550 +
IAA15 AT1G80390 +
IAA17 AT1G04250 +
IAA19 AT3G15540 +
IAA20 AT2G46990 dL+
IAA28 AT5G25890 +
IAA29 AT4G32280 +
IAA30 AT3G62100 dL+
IAA33 AT5G57420 +
ARFs 23 1 4.3%
ARF2 AT5G62000 2 (tasiR3)
ARF3 AT2G33860 2 (tasiR3)
ARF4 AT5G60450 2 (tasiR3)
ARF6 AT1G30330 2 (miR167)
ARF7 AT5G20730 + (2)
ARF8 AT5G37020 2 (miR167)
ARF10 AT2G28350 2 (miR160)
ARF16 AT4G30080 2 (miR160)
ARF17 AT1G77850 2 (miR160)
The table shows the fraction of H3K27me3 targeted genes in gene familiesinvolved in auxin perception or signaling. Genes described to be involved inauxin perception [65] and the regulation of auxin dependent transcription [44]are listed below the corresponding gene family. Several members of TIR1 andARF families are regulated by small RNAs, therefore also H3K27me3 targetedmiRNA or tasiRNA genes are depicted.doi:10.1371/journal.pgen.1002040.t004
Dynamic Regulation of H3K27me3 in Plants
PLoS Genetics | www.plosgenetics.org 10 April 2011 | Volume 7 | Issue 4 | e1002040

(Figure 8), suggesting that Pc-G proteins and H3K27me3 can
prevent expression of TE genes, which is consistent with a previous
study revealing Pc-G mediated silencing of a TE gene in the
endosperm [51]. To study whether interference with DNA
methylation can further enhance activation of TE genes, we grew
wildtype and clf/swn plants on media containing the DNA
methyltransferase inhibitor zebularine [52] and analysed TE
activation (Figure 8). The tested TE genes were neither activated
by zebularine in wildtype nor further transcriptionally activated in
clf/swn suggesting DNA methylation independent regulation of the
TE genes which are activated in the Pc-G mutants.
Lastly, we investigated whether Pc-G mutants control tissue-
specific expression of differentially methylated H3K27me3
targets. Mir167a and 167d genes show higher levels of
H3K27me3 in the meristem compared to leaves (Figure 3).
Reporter transgenes in which b-GLUCURONIDASE (GUS) was
fused to the promoters of mir167a and mir167d [53] revealed
preferential expression of the miRNA genes in cotyledons, but
exclusion from the meristem, consistent with the H3K27me3
patterns (Figure 7, Figure S8). In clf/swn mutants, the expression
domains of mir167a and mir167d reporters were expanded to the
shoot apical meristem, the petioles, the main root and the base of
the hypocotyl (Figure 7F, Figure S8). The genes ARF6 and ARF8
genes are regulated by mir167 which is in agreement with their
mutually exclusive expression domains [53] (Figure 7E, 7G).
Consistent with mis-expression of mir167 in clf/swn mutants we
observed loss of shoot meristematic expression of a pARF6::ARF6-
GUS reporter gene construct that harbours the miRNA binding
Figure 6. Immunoblot analyses of histone modifications in Pc-G mutants. (A) clf-28/swn-7 double mutants, 60 d old and grown in axenicconditions in long days, (B) emf2–10, (C) vrn2–1/emf2–10 double mutants, (D) Wassilewskija (WS) wildtype. Plants in (B)–(D) are 17 old and grown inshort day conditions. (E), (F) 45 d old plants grown under short day conditions, (E) vrn2-1/emf2-10 double mutant, (F) wildtype. Scale bars in pictures(A) to (D) indicate 0.5 cm and in (E) and (F) 1 cm. (G) Immunoblot analyses of H3K4me3 and H3K27me3 levels in Pc-G mutants. Similar amounts ofhistone H3 were loaded as confirmed with a H3 specific antibody detecting the unmodified C-terminal part of H3. Immunoblot analyses of additionalhistone modifications are shown in Figure S5.doi:10.1371/journal.pgen.1002040.g006
Dynamic Regulation of H3K27me3 in Plants
PLoS Genetics | www.plosgenetics.org 11 April 2011 | Volume 7 | Issue 4 | e1002040

site (Figure 7H). This further demonstrates the expansion of the
miRNA expression domain to the meristem.
To uncover tissue-specific mis-expression of differentially
methylated H3K27me3 targets in the vrn2/emf2–10 mutant we
dissected plants and analyzed gene expression in meristematic
tissue, young leaves (up to 3 mm blade length) and older leaves
(3–10 mm). In wildtype, KNAT2, KNAT6, STM and PIN1 are
strongly expressed in the meristem and carry H3K27me3
Figure 7. Pc-G proteins control tissue-specific expression of H3K27me3 target genes. (A) – (C) qRT-PCR based expression analyses of (A, B)9 d old wildtype and clf-28/swn-7 plants or (C, D) 45 days old, dissected wildtype and vrn2-1/emf2–10 plants. Samples were enriched for meristem(Me) (C), young leaves (yLe, up to 3 mm blade length) or older leaves (oLe, 3 – 10 mm) (D). Expression values were normalized to At5g60390 (EF-1a).(E, F) Colorimetric analyses of pMir167a::GUS expression in 9 d old wildtype (E) and clf-28/swn-7 double mutants (F). Insets are close-ups. (G, H)Expression of pARF6::ARF6-GUS 9 d old wildtype (G) and clf-28/swn-7 double mutants (H). pARF6::ARF6-GUS carries the mir167 binding site. Asterisksmark meristematic region, white arrow base of hypocotyl. The border between the hypocotyl and the root is indicated with a dashed white line. Scalebars indicate 1 cm. All plants were grown in short day conditions.doi:10.1371/journal.pgen.1002040.g007
Dynamic Regulation of H3K27me3 in Plants
PLoS Genetics | www.plosgenetics.org 12 April 2011 | Volume 7 | Issue 4 | e1002040

preferentially in leaves (Figure 3, Figure 7). Expression of these
genes was not altered in meristems of vrn2/emf2–10 double
mutants as expected (Figure 7C). In older leaves of the mutant,
however, the KNAT genes were activated which correlates with a
reduction in H3K27me3 (Figure 7D, Figure S6). STM displayed
only moderate mis-expression in leaves, consistent with similar
levels of H3K27me3 in wildtype and vrn2/emf2–10 mutants.
Although H3K27me3 of PIN1 is depleted in vrn2/emf2-10
mutant leaves the gene is only slightly activated in the mutant
(Figure 7, Figure S6). For several H3K27me3 target genes
exhibiting differential methylation we revealed tissue-specific
mis-expression in Pc-G mutants indicating that Pc-G proteins
restrict expression of their targets by depositing tissue-specific
H3K27me3. We also showed that Pc-G proteins transcription-
ally regulate miRNA consistent with an up-regulation of miRNA
genes and concomitant down-regulation of miRNA target genes
in Pc-G mutants. In addition, although no global effect on DNA
methylation and TE activation was revealed in clf/swn mutants
[15], a subset of TE genes may be regulated by Pc-G proteins
(Figure 8 and [51]).
Discussion
In this study, we analyzed the dynamic regulation of the PRC2-
mediated modification H3K27me3 in undifferentiated meriste-
matic and differentiated leaf tissue. Our analyses revealed
differential methylation of hundreds of H3K27me3 target genes
including protein coding, transposable element and microRNA
genes and expand previous observations that plant Pc-G proteins
have important roles in controlling tissue-specific expression
patterns of gene families and regulatory networks.
Enrichment of meristematic and leaf tissue forH3K27me3 and expression analyses
To study the dynamics of H3K27me3 in Arabidopsis develop-
ment and its function in tissue differentiation we focused on the
vegetative shoot apical meristem which harbors continuously
dividing stem cells and gives rise to terminally differentiated organs
(leaves) and also differentiates into the flower producing inflores-
cence meristem. Manual dissection of meristems and young leaves
was performed on clv3 mutants as these have strongly enlarged
meristems and increased stem cell numbers [35], but show no
obvious defects in leaf development. Independent analyses on
dissected wildtype meristems and leaves confirmed differential
H3K27me3 of all tested genes (Figure 3). Furthermore, a large
overlap of H3K27me3 targets with previously published data on
seedlings [5,20] revealed a similar set of H3K27me3 targets both
in wildtype seedlings and clv3 mutant leaves and meristems. Thus,
overall the experimental system appeared highly suitable to study
the dynamics of H3K27me3 on a whole genome level during
differentiation.
H3K27me3 is dynamically regulated duringdifferentiation and correlates with gene repression in atissue-specific manner
Our analyses identified several hundred protein coding genes,
transposable elements and microRNA genes exhibiting differential
H3K27me3 patterns between meristematic and leaf tissue. Genes
that acquired H3K27me3 during differentiation included several
meristematic regulators like STM or KNAT2 and 6, but also many
previously non-characterized genes which may present novel
regulators of meristem regulation and maintenance. Leaf tissue is
Figure 8. Expression analysis of transposable element genes. The expression of several transposable element genes was analysed in 9 d oldwildtype and clf-28/swn-7 seedlings by qRT-PCR. Plants were grown on media with (+ z) and without the DNA methyltransferase inhibitor zebularine(2 z). Expression values were normalized to At5g60390 (EF-1a). [TE1 (AT3G28400; hAT transposase), TE2 (AT3G21020; copia element), TE3(AT3G21040; copia element), TE4 (AT3G43690; copia element), TE5 AT4G02960; copia element)].doi:10.1371/journal.pgen.1002040.g008
Dynamic Regulation of H3K27me3 in Plants
PLoS Genetics | www.plosgenetics.org 13 April 2011 | Volume 7 | Issue 4 | e1002040

developmentally derived from continuously dividing cells in the
shoot tip which differentiate in the periphery of the meristem. Thus,
H3K27me3 at the subset of genes showing meristem-specific
H3K27me3 must be actively or passively removed during
differentiation. H3K27me3 demethylases have not been identified
in plants yet, however, our analyses strongly suggest the
contribution of these enzymatic activities to confer dynamic
regulation of H3K27me3. Charron et al [22] observed differential
H3K27me3 patterns of protein coding and transposable element
genes when dark grown seedlings were compared with dark grown
seedlings shifted to light. In addition, dynamic changes in
H3K27me3 and/or Pc-G protein binding were also unveiled both
during Drosophila development and differentiation of mammalian
embryonic stem cells suggesting conserved mechanisms which
confer developmental dynamics of H3K27me3 [23,28,32,54].
We confirmed that H3K27me3 is largely excluded from
heterochomatic regions and transposable element (TE) genes,
especially in leaf tissue (only 4% of all targets) [5,20]. Interestingly,
more than 15% of H3K27me3 targets detected in the meristem
were TE genes (Figure 2). H3K27me3 detection at TEs was likely
not due to cross-reaction of the antibody to H3K27me1 which is
found in heterochromatin, because the same anti-H3K27me3
antibody was used for both analyzed tissues. In addition, the
antibody was not detecting histones in clf/swn mutants which
lacked all H3K27me3 but showed no alterations in H3K27me1
(Figure 6, Figure S5). Transposable elements are usually repressed
throughout sporophytic development, thus loss of H3K27me3 in
leaves likely does not result in transcriptional activation. The stem
cells are required for plant germline formation and therefore must
be particularly protected from transposable element activation.
Thus, H3K27me3 may represent an additional, meristem-specific
silencing mechanism besides the canonical heterochromatic marks
H3K9me2 and H3K27me1 [55,56]. Also in mammalian embry-
onic stem cells, transposable elements are marked by a specific set
of repressive histone modifications, suggesting that pluripotent
cells are protected by a large array of modifications [32]. For a few
TE genes we observed up-regulation in the clf/swn Pc-G mutant,
consistent with a previous report showing up-regulation of a TE
gene in Pc-G mutant endosperm [51], suggesting that Pc-G
proteins contribute to the regulation of TEs.
Our data revealed that non-expressed genes are preferential
H3K27me3 target genes (Figure 4) as previously reported
[5,20,21,31]. Interestingly, protein coding genes which showed
strong expression differences between meristem and leaf are
enriched for H3K27me3 targets. In addition, differential
H3K27me3 was anti-correlated with tissue-specific gene expres-
sion patterns (Figure 4). Thus, similar to Drosophila, Pc-G proteins
likely control ON/OFF expression states of their targets in
Arabidopsis [30]. However, tissue-specific H3K27me3 is not the
only determinant which generates tissue-specific expression
patterns as many genes showing differential expression are not
covered by H3K27me3.
Tissue-specific targeting of particular gene families byH3K27me3 in Arabidopsis
Previous analyses of H3K27me3 identified transcription factors
as one major class of H3K27me3 targets, but preference for
certain families was not unveiled [5]. We confirmed this finding as
most transcription factor families including MADS-, WOX-,
HOMEOBOX- and YABBY-transcription factors were preferentially
targeted by H3K27me3. However, others including SPL-, ARF-
and HAP2-transcription factor genes were largely devoid of
H3K27me3, indicating that transcription factor genes are not per
se enriched for H3K27me3 (see also below). In addition, certain
transporter gene families (e.g. sucrose transporters, auxin carriers)
and gene families involved in biosynthetic pathways (peroxidases,
cytochrome P450 genes) were among the H3K27me3 targets. In
Drosophila and mammals, transporter and biosynthetic genes
(hydrolases, cytochrome P450 genes) were also revealed as
preferential H3K27me3 targets in addition to transcription factor
genes [6,23,26,29]. This strongly suggests an unexpected level of
conservation not only of Pc-G proteins but also of their target gene
families between animals and plants.
We also identified gene families and functional categories
showing preferential H3K27me3 targeting in the meristem (e.g.
TCP transcription factor genes, Cytochrome P450 genes; func-
tional categories ‘‘plastid’’ and ‘‘kinase activity’’) or in leaves (e.g.
MYB and HOMEOBOX transcription factor genes). In particular
the differential methylation of HOMEOBOX transcription factor
genes confirmed the validity of our approach as these are repressed
in leaves by Pc-G proteins ([48] and this study).
Thus, our in-depth analyses of H3K27me3 targets confirmed
specific gene families as preferential H3K27me3 targets, but also
identified novel pathways and gene families that are likely
controlled by Pc-G proteins and epigenetic gene regulation.
Dynamic regulation of miRNA genes by H3K27me3controls expression of miRNA target genes
Our study discovered a large fraction of microRNA genes as
H3K27me3 targets many of which exhibited tissue-specific
differences in H3K27me3 (Figure 2, Figure 3, Table 1, Table 2).
In addition, we uncovered mis-expression of several miRNA genes
and down-regulation of their target genes in Pc-G mutants (Figure 7).
Although miRNAs largely post-transcriptionally regulate their target
genes, some miRNAs recruit the DNA methylation machinery to
their target genes resulting in transcriptional repression [57–59].
Similarly to H3K27me3, miRNA genes target a multitude of
transcription factor genes [60,61], raising the possibility that
miRNAs mediate recruitment of Pc-G proteins to some of their
targets. Our analyses suggest that this is likely a rare phenomenon as
transcription factor genes which are miRNA targets, are largely not
targeted by H3K27me3 (Table 1, Table 2), despite the general
enrichment of transcription factors as H3K27me3 targets ([5] and
this study). Nonetheless, we also identified gene pairs, for which both
the miRNA gene (e.g. mir319a) and their targets (e.g. TCP2, TCP10)
displayed differential, but antagonistic H3K27me3 patterns. Thus,
for a subset of genes miRNA-mediated targeting of H3K27me3 is an
attractive possibility.
In summary, our studies provide evidence that Pc-G proteins
and H3K27me3 do not only negatively regulate expression of
transcription factor genes by direct association, but also positively
control their expression by restricting expression of miRNA genes
(Figure 9). This regulation appears to be particularly important in
meristematic and leaf tissues as a large fraction of miRNA genes is
differentially methylated in these two tissues (Figure 2). Regulation
of miRNA genes by Pc-G proteins is likely a conserved
mechanism. Recent analyses of miRNA gene regulation during
mouse and human lymphopoiesis and genome-wide profiling of
Pc-G protein binding sites in Drosophila uncovered H3K27me3-
mediated control of miRNA gene expression [62,63]. In addition,
more than 30 miRNA loci were discovered as H3K27me3 targets
in human embryonic stem cells [26].
H3K27me3 regulates diverse pathways in auxinbiosynthesis, transport, perception, and signaling
Organ-specific auxin maxima are generated by both local auxin
biosynthesis and auxin transport, which is largely mediated by the
Dynamic Regulation of H3K27me3 in Plants
PLoS Genetics | www.plosgenetics.org 14 April 2011 | Volume 7 | Issue 4 | e1002040

PIN efflux carrier proteins (reviewed in [43,64,65]). To date, three
different pathways for the synthesis of auxin from tryptophan have
been identified or proposed for plants (reviewed in [42]). Our
analyses identified most of the key regulators of auxin transport
and biosynthesis to be H3K27me3 targets several of which are
leaf-specifically methylated (Figure 3, Figure 5, Table 3, Table 4).
Additionally, our results suggest that auxin perception is controlled
by Pc-G proteins as H3K27me3 targets the mir393a gene which in
turn regulates the auxin receptor genes TIR1/AFB (Table 4)
[66,67]. In addition, H3K27me3 regulates the transcriptional
responses to auxin as half of the AUX/IAA repressor genes are
covered by H3K27me3. Although only one of the 23 ARF
transcriptional activator genes carries H3K27me3, all known
miRNAs or tasiRNAs that regulate a total of 8 ARF genes are
H3K27me3 targets (Table 2). Thus, we propose that auxin
responsive genes are largely suppressed in Pc-G mutants as
H3K27me3 restricts expression of the AUX/IAA repressors and
promotes expression of the ARF activators by controlling the
expression of ARF-regulating miRNAs (Figure 7, Figure 9,
Table 2). Consistent with this hypothesis, we observed down-
regulation of several auxin-inducible PIN genes (PIN3, PIN4, PIN7)
[68] in clf/swn mutants (Figure S7). In addition, the Pc-G mutant
terminal flower2 was recently shown to have lower expression of
auxin responsive genes including the synthetic reporter DR5::GUS
[69] and genome-wide expression profiles of embryonic flower 1
(emf1) and emf2 Pc-G mutants identified more down- than
upregulated auxin regulatory genes in the mutants [70]. Loss of
vegetative Pc-G activity in clf/swn or vrn2/emf2 mutants is
accompanied by loss of organ identity, generation of somatic
embryos and callus-like appearance [18,19] and all these
phenotypes are associated with deregulated auxin responses.
Although we cannot rule out that these phenotypes are auxin-
Figure 9. Models of the H3K27me3-mediated regulation of protein coding genes and auxin signaling. (A) Protein coding genes can bedirectly repressed by Pc-G proteins through the deposition of H3K27me3 or indirectly positively regulated by Pc-G proteins through the H3K27me3-mediated repression of small RNA genes (tasiRNAs and miRNAs) (see Table 1, Table 2 for details). (B) Pc-G proteins directly repress auxin biosynthesis,transport, perception and signaling (IAA transcription factors). Thickness of arrows is relative to number of genes targeted by H3K27me3. Pc-Gproteins indirectly activate genes involved in auxin perception and signaling (ARF transcription factors) through the repression of miRNA (mir160, 167,393) and tasiRNA (TAS3) genes. Positive regulation of the ARF transcriptional activator and auxin perception genes and negative regulation of IAAtranscriptional repressor genes likely promotes expression of auxin inducible genes (see Table 3, Table 4 for details).doi:10.1371/journal.pgen.1002040.g009
Dynamic Regulation of H3K27me3 in Plants
PLoS Genetics | www.plosgenetics.org 15 April 2011 | Volume 7 | Issue 4 | e1002040

independent, we showed mis-regulation of PIN, ARF and
miRNA167 genes in Pc-G mutants revealing that loss of
H3K27me3 is indeed associated with mis-regulation of genes
involved in auxin responses (Figure 7). Other studies have also
linked Pc-G proteins to hormonal control of gene expression:
Charron and colleagues [22] uncovered strong H3K27me3
targeting of genes involved in gibberellic acid biosynthesis and
inactivation. Global gene expression in emf1 and emf2 mutants
revealed mis-regulation of many genes involved in diverse
hormonal pathways [70]. However, many of these effects are
likely indirect, thus a rigorous comparison of Pc-G protein
binding, H3K27me3 targeting and gene expression profiles in
Pc-G mutants in defined tissues will be essential to uncover the
mis-regulated target genes that determine the Pc-G mutant
phenotypes.
Role of H3K27me3 in Pc-G silencing and epigeneticinheritance
This and previous studies uncovered at least 25% of all
Arabidopsis protein coding genes as H3K27me3 targets, some of
which are tissue-specifically methylated [5,20–22,31]. Although
H3K27me3 is entirely dependent on Pc-G proteins, H3K4me3 is
enriched in clf/swn mutants (Figure 6) and H3K27me3 is strongly
correlated with gene repression (Figure 4), only a limited number
of H3K27me3 targets are mis-expressed in Pc-G mutants or in
tissues in which H3K27me3 is lost (this study and [70]). Also in
animals lack of Pc-G proteins results in mis-expression of only a
small number of target genes [24]. Thus, loss of H3K27me3 may
poise genes for activation but gene expression may require
additional environmental or developmental cues. Thus, Pc-G
proteins and H3K27me3 may confer stability of developmental
processes and gene regulatory networks.
Pc-G proteins are considered as epigenetic regulators conferring
mitotically stable gene expression states. The large number of
H3K27me3 targets implies that either more than 25% of all
protein coding genes are epigenetically regulated or that
H3K27me3 has a more general gene regulatory role. Certainly,
epigenetic phenomena like the vernalization response are
controlled by Pc-G proteins and H3K27me3 [8,71,72]. In
addition, Pc-G target genes are covered with H3K27me3 which
may ensure perpetuation of the modification through replication
[9]. Interestingly, for small genes like miRNA genes the number of
modified nucleosomes may not be sufficient to guarantee high
fidelity of inheritance.
This and previous studies unveiled tissue-specific dynamics of
H3K27me3 distribution [22,31,51], suggesting that if H3K27me3
is generally mitotically heritable it may persist for only limited cell
divisions until it is reset again to allow gene activation. The
mechanisms of H3K27me3 inheritance and resetting can now be
studied with the identified Pc-G target genes which are
dynamically regulated during differentiation.
Materials and Methods
Plant material and growth conditionsAll plants were grown under either long day (16 h light/8 h
darkness) or short day conditions (8 h light/16 h darkness). The
clavata3–9 mutant in Columbia background carries a point
mutation in the CLV3 coding region which disrupts CLV3 function.
clf-28 (SALK_139371), swn-7 (SALK_109121), clf-28 swn-7, vrn2-1
[47], emf2-10 [18] and vrn2-1/emf2–10 mutants were used in this
study. Pmir167a::GUS, Pmir167d::GUS and pARF6::ARF6-GUS were
previously described [53]. For expression and ChIP-chip analyses,
clv3 mutant plants were grown for 9 weeks under short day
conditions and enriched for meristematic and leaf tissue by manual
dissection. Tissues for expression and ChIP-chip analyses were
simultaneously harvested. For zebularine treatment, plants were
germinated on plates containing 40 mM zebularine (Sigma,
Munich) and harvested 9 days after germination.
Array-based expression analysis of different tissuesamples
Array hybridization. Total RNA was extracted with
QIAGEN plant RNeasy kit (Qiagen, Hilden), Superscript II
(Invitrogen, Carlsbad) was used for cDNA synthesis. Probe
labelling and array hybridisation on Agilent 44 k arrays
[G2519F, V4 (Agilent, Santa Clara)] were performed by the
Imagenes Corp. (Berlin, Germany).
Gene expression data analysis. The quality of the array
hybridization was tested with scatter plots of the raw intensities
(Figure S9). Pearson correlation coefficients were determined
showing high similarity of biological replicates. The normalized
and background subtracted data received from Imagenes was
processed with a spreadsheet program (Excel, Microsoft) resulting
in 22988 expressed genes (total), 22237 in the meristem (Me) and
22017 in the leaf (Le) sample (Figure S2). For the comparison of
different tissues the log2 values [log2(Me); log2(Le)] of the
normalized intensities and their difference between the tissues
[Dlog2(Me-Le)] were calculated. Gene sets of different expression
levels were binned to compare gene expression and histone
methylation (Figure 4). Genes with a minimal difference in
expression of Dlog2|Me-Le|$2 which were statistically
significantly different [determined by Students tTest (p#0.05)]
were considered as tissue specifically expressed. Genes with
Dlog2|Me-Le| ,1 and a standard deviation of the samples
#0.05% were considered as equally expressed (Figure S2). Genes
expressed in the different tissues area are provided in Table S4.
Tissue-specific H3K27me3 ChIP and ChIP-chip analysesChIP and array hybridization. For each tissue, 200 mg
plant material was harvested on ice, crosslinked with 1%
formaldehyde for 15 minutes under vacuum, frozen in liquid
nitrogen and stored at 270u until chromatin extraction. A
previously described protocol [8] was used for ChIP. Antibodies
specific for H3K27me3 (#07-449) and H3K4me3 (#07-473) were
retrieved from Millipore (Billerica, USA). Chromatin was sheared
with a Bioruptor sonicator (10 pulses, 30 seconds each)
(Diagenode, Liege, Belgium). High density tiling arrays with
probes tiled approximately every 220 bp over the entire sequenced
Arabidopsis genome were used as described [36,37]. Input and
precipitated DNA was amplified with a whole genome
amplification kit (WGA2, Sigma, St. Louis) as described in
‘‘PROT30’’ of The Epigenome NoE web-page (http://www.
epigenome-noe.net/). Labelling and array hybridisation were
performed by the Imagenes NimbleGen service (Berlin, Germany).
H3K27me3 ChIP-chip data analysis. The array
hybridization data was received from Imagenes (Berlin,
Germany) as intensity ratios of precipitate and input samples in
the GFF-file format. In a first processing step M-Values
[M = log2(IP/I) where IP is signal intensity from hybridized
immunoprecipitated DNA and I is signal intensity from hybridized
input DNA] were determined. The quality of the array
hybridization was analyzed with scatter plots of the M values for
biological replicates (Figure S10). The correlation of the two
biological replicates for each tissue was estimated with the
Spearman’s rank correlation coefficient (SCC) (Figure S10). The
data was analyzed with SignalMap1.9 software (Nimblegen) and
the Bioconductor R packages [73] in an R programming
Dynamic Regulation of H3K27me3 in Plants
PLoS Genetics | www.plosgenetics.org 16 April 2011 | Volume 7 | Issue 4 | e1002040
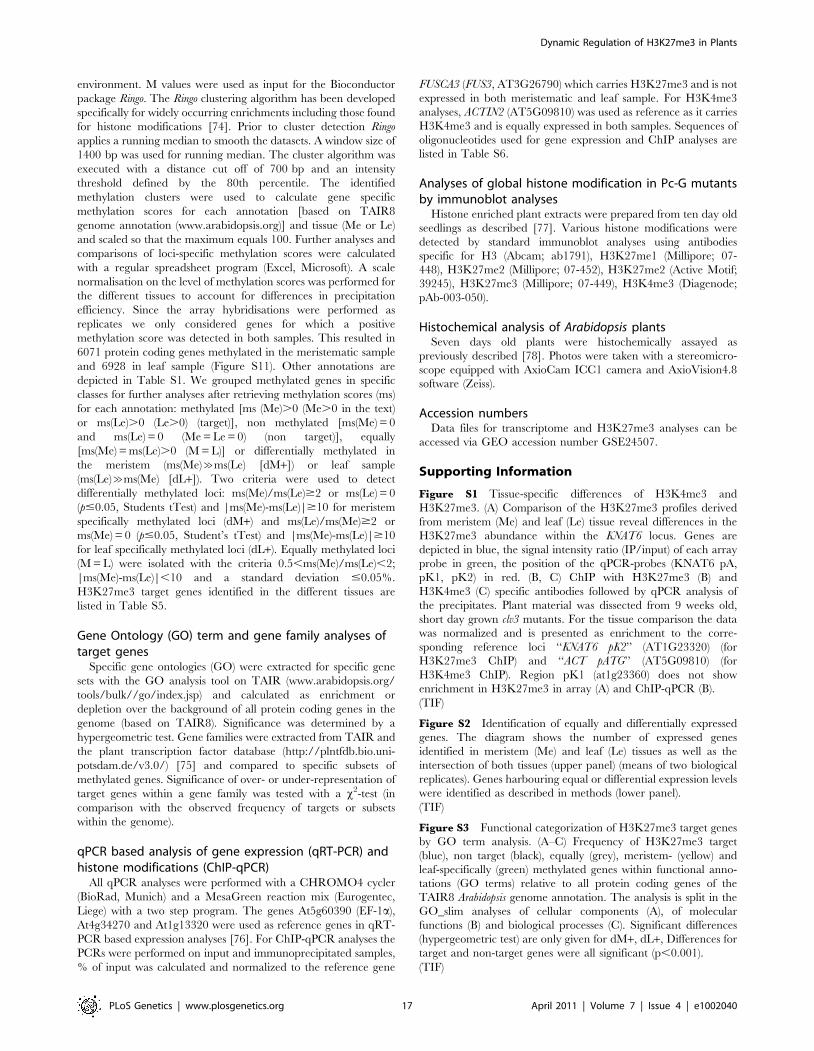
environment. M values were used as input for the Bioconductor
package Ringo. The Ringo clustering algorithm has been developed
specifically for widely occurring enrichments including those found
for histone modifications [74]. Prior to cluster detection Ringo
applies a running median to smooth the datasets. A window size of
1400 bp was used for running median. The cluster algorithm was
executed with a distance cut off of 700 bp and an intensity
threshold defined by the 80th percentile. The identified
methylation clusters were used to calculate gene specific
methylation scores for each annotation [based on TAIR8
genome annotation (www.arabidopsis.org)] and tissue (Me or Le)
and scaled so that the maximum equals 100. Further analyses and
comparisons of loci-specific methylation scores were calculated
with a regular spreadsheet program (Excel, Microsoft). A scale
normalisation on the level of methylation scores was performed for
the different tissues to account for differences in precipitation
efficiency. Since the array hybridisations were performed as
replicates we only considered genes for which a positive
methylation score was detected in both samples. This resulted in
6071 protein coding genes methylated in the meristematic sample
and 6928 in leaf sample (Figure S11). Other annotations are
depicted in Table S1. We grouped methylated genes in specific
classes for further analyses after retrieving methylation scores (ms)
for each annotation: methylated [ms (Me).0 (Me.0 in the text)
or ms(Le).0 (Le.0) (target)], non methylated [ms(Me) = 0
and ms(Le) = 0 (Me = Le = 0) (non target)], equally
[ms(Me) = ms(Le).0 (M = L)] or differentially methylated in
the meristem (ms(Me)&ms(Le) [dM+]) or leaf sample
(ms(Le)&ms(Me) [dL+]). Two criteria were used to detect
differentially methylated loci: ms(Me)/ms(Le)$2 or ms(Le) = 0
(p#0.05, Students tTest) and |ms(Me)-ms(Le)|$10 for meristem
specifically methylated loci (dM+) and ms(Le)/ms(Me)$2 or
ms(Me) = 0 (p#0.05, Student’s tTest) and |ms(Me)-ms(Le)|$10
for leaf specifically methylated loci (dL+). Equally methylated loci
(M = L) were isolated with the criteria 0.5,ms(Me)/ms(Le),2;
|ms(Me)-ms(Le)|,10 and a standard deviation #0.05%.
H3K27me3 target genes identified in the different tissues are
listed in Table S5.
Gene Ontology (GO) term and gene family analyses oftarget genes
Specific gene ontologies (GO) were extracted for specific gene
sets with the GO analysis tool on TAIR (www.arabidopsis.org/
tools/bulk//go/index.jsp) and calculated as enrichment or
depletion over the background of all protein coding genes in the
genome (based on TAIR8). Significance was determined by a
hypergeometric test. Gene families were extracted from TAIR and
the plant transcription factor database (http://plntfdb.bio.uni-
potsdam.de/v3.0/) [75] and compared to specific subsets of
methylated genes. Significance of over- or under-representation of
target genes within a gene family was tested with a x2-test (in
comparison with the observed frequency of targets or subsets
within the genome).
qPCR based analysis of gene expression (qRT-PCR) andhistone modifications (ChIP-qPCR)
All qPCR analyses were performed with a CHROMO4 cycler
(BioRad, Munich) and a MesaGreen reaction mix (Eurogentec,
Liege) with a two step program. The genes At5g60390 (EF-1a),
At4g34270 and At1g13320 were used as reference genes in qRT-
PCR based expression analyses [76]. For ChIP-qPCR analyses the
PCRs were performed on input and immunoprecipitated samples,
% of input was calculated and normalized to the reference gene
FUSCA3 (FUS3, AT3G26790) which carries H3K27me3 and is not
expressed in both meristematic and leaf sample. For H3K4me3
analyses, ACTIN2 (AT5G09810) was used as reference as it carries
H3K4me3 and is equally expressed in both samples. Sequences of
oligonucleotides used for gene expression and ChIP analyses are
listed in Table S6.
Analyses of global histone modification in Pc-G mutantsby immunoblot analyses
Histone enriched plant extracts were prepared from ten day old
seedlings as described [77]. Various histone modifications were
detected by standard immunoblot analyses using antibodies
specific for H3 (Abcam; ab1791), H3K27me1 (Millipore; 07-
448), H3K27me2 (Millipore; 07-452), H3K27me2 (Active Motif;
39245), H3K27me3 (Millipore; 07-449), H3K4me3 (Diagenode;
pAb-003-050).
Histochemical analysis of Arabidopsis plantsSeven days old plants were histochemically assayed as
previously described [78]. Photos were taken with a stereomicro-
scope equipped with AxioCam ICC1 camera and AxioVision4.8
software (Zeiss).
Accession numbersData files for transcriptome and H3K27me3 analyses can be
accessed via GEO accession number GSE24507.
Supporting Information
Figure S1 Tissue-specific differences of H3K4me3 and
H3K27me3. (A) Comparison of the H3K27me3 profiles derived
from meristem (Me) and leaf (Le) tissue reveal differences in the
H3K27me3 abundance within the KNAT6 locus. Genes are
depicted in blue, the signal intensity ratio (IP/input) of each array
probe in green, the position of the qPCR-probes (KNAT6 pA,
pK1, pK2) in red. (B, C) ChIP with H3K27me3 (B) and
H3K4me3 (C) specific antibodies followed by qPCR analysis of
the precipitates. Plant material was dissected from 9 weeks old,
short day grown clv3 mutants. For the tissue comparison the data
was normalized and is presented as enrichment to the corre-
sponding reference loci ‘‘KNAT6 pK2’’ (AT1G23320) (for
H3K27me3 ChIP) and ‘‘ACT pATG’’ (AT5G09810) (for
H3K4me3 ChIP). Region pK1 (at1g23360) does not show
enrichment in H3K27me3 in array (A) and ChIP-qPCR (B).
(TIF)
Figure S2 Identification of equally and differentially expressed
genes. The diagram shows the number of expressed genes
identified in meristem (Me) and leaf (Le) tissues as well as the
intersection of both tissues (upper panel) (means of two biological
replicates). Genes harbouring equal or differential expression levels
were identified as described in methods (lower panel).
(TIF)
Figure S3 Functional categorization of H3K27me3 target genes
by GO term analysis. (A–C) Frequency of H3K27me3 target
(blue), non target (black), equally (grey), meristem- (yellow) and
leaf-specifically (green) methylated genes within functional anno-
tations (GO terms) relative to all protein coding genes of the
TAIR8 Arabidopsis genome annotation. The analysis is split in the
GO_slim analyses of cellular components (A), of molecular
functions (B) and biological processes (C). Significant differences
(hypergeometric test) are only given for dM+, dL+, Differences for
target and non-target genes were all significant (p,0.001).
(TIF)
Dynamic Regulation of H3K27me3 in Plants
PLoS Genetics | www.plosgenetics.org 17 April 2011 | Volume 7 | Issue 4 | e1002040

Figure S4 Abundance of H3K27me3 target genes in gene
families. (A, C, E) Relative enrichment or depletion of H3K27me3
target genes (blue) or equally methylated genes (M = L, purple) in
specific transporter (A), regulatory RNA (C), enzyme and other
families (E). (B, D, F) Relative enrichment or depletion of
meristem-specific (dM+, yellow) or leaf-specific (dM+, green)
H3K27me3 target genes in specific transporter (B), small RNA
(D), enzyme and other families (F). Y-axes indicate fold difference
relative to the observed frequencies of specific subsets within the
genome. Asterisks indicate significant differences (p#0.05, x2-test)
compared to total number of genes for a specific subset (adjacent
subsets with same significance are labelled with coloured brackets).
Details of statistical analyses can be found in Table S3. Gene
family names are shown in G. (H) Relative enrichment or
depletion of H3K27me3 target genes in retrotransposon and DNA
transposon genes. Retrotransposon and DNA transposon genes
were grouped. (I) Relative enrichment or depletion of H3K27me3
target genes in subclasses of retrotransposon and DNA transposon
genes (based on TAIR8 genome annotation). Y-axes indicate fold
difference relative to the observed frequencies of specific subsets
within the genome. Asterisks indicate significant differences
(p#0.05, x2-test) compared to total number of genes for a specific
subset. Details of statistical analyses can be found in Table S3.
(TIF)
Figure S5 Immunoblot analyses of H3K27me1 and H3K27me2
in Pc-G mutants. Immunoblot analyses of H3K27me1 and
H3K27me2 levels in wildtype and Pc-G mutants. Similar amounts
of histone H3 was loaded as confirmed with a H3 specific antibody
detecting the unmodified C-terminal part of H3. Same plant
material was used as in Figure 6.
(TIF)
Figure S6 Gene-specific analyses of H3K27me3 in wildtype and
vrn2-1/emf2-10 leaves. H3K27me3 target genes were analyzed in
leaf material derived from 70d old, short day grown wild type and
vrn2-1/emf2-10 plants by ChIP-qPCR. The qPCR data is
presented as enrichment to the reference locus FUS3
(AT3G26790) as described in Figure 3, enrichment factors wt
compared to vrn2-1/emf2-10 are indicated in brackets. The results
are shown as mean values of two biological replicates.
(TIF)
Figure S7 Regulation of PIN gene expression in Pc-G mutants.
(A)–(B) qRT-PCR based expression analyses of (A) 9 d old
wildtype and clf-28/swn-7 plants or (B) 45 days old leaves of
wildtype and vrn2-1/emf2-10 plants. Expression values were
normalized to At5g60390 (EF-1a).
(TIF)
Figure S8 Colorimetric analyses of pMIR167d::GUS in wildtype
and clf/swn mutants. Colorimetric analyses of pMir167d::GUS
expression in 9 d old wildtype (A) and clf-28/swn-7 double mutants
(F). Insets are close-ups. Asterisks mark meristematic region, white
arrow base of hypocotyls. Scale bars indicate 1 cm. All plants were
grown in short day conditions.
(TIF)
Figure S9 Comparison of expression arrays. Microarray hybrid-
ization intensities (XM1, XM2 = meristem expression profiles;
XL1, XL2 = leaf expression profiles) were compared in a matrix of
scatter plots revealing high overlap for biological replicates. The
density of data points is represented by a darker colouration. White
areas correspond to areas without data points. In low density areas
single data points are indicated by single dots. The Pearson
correlation coefficient (PCC) is shown below the diagonal.
(TIF)
Figure S10 Correlation of H3K27me3 arrays (ChIP-chip) on
the level of raw intensity values. The matrix plot correlates
H3K27me3 ChIP-chip signal intensities between samples. L1 and
L2 are biological replicates of leaf tissue, M1 and M2 of
meristematic tissue. The upper triangle of the matrix displays
scatter plots to compare each sample to the other samples. The
axes represent the M-Values (M = log2(R)-log2(G) with R(red) = IP
and G(green) = input) for all probes of the according sample. The
intensity of shading of the scatter plot represents the density of data
points within that area. Where density of data points is low single
data points are shown. The lower triangle shows Spearman’s rank
correlation coefficients between different samples revealing high
overlap between biological replicates.
(TIF)
Figure S11 Comparison of identified H3K27me3 target genes in
biological replicates. The diagram shows the identified numbers of
H3K27me3 target genes for biological replicates for meristem
(Me) or leaf (Le) material. The arrays of the same tissue share
85.2% (Me1 and Me2) and 89.9% (Le1 and Le2), respectively (two
upper panels). Target genes identified in both replicates were used
for the tissue comparison (lower panel and Figure 2).
(TIF)
Table S1 Summary of all identified H3K27me3 target gene loci.
All annotations of TAIR8 (www.arabidopsis.org) were analysed for
their H3K27me3 coverage in leaf and meristematic tissue. The
table shows the total numbers of identified target loci in
comparison to the analysis of Zhang et al. [5] and Oh et al.
[20]. TEs: transposable elements, ncRNAs: non coding RNAs. See
methods for details on different subsets of meristem and leaf-
specific H3K27me3 targets.
(TIF)
Table S2 Analysis of the significance of over- or under-
representation of target genes within expression gene sets.
Comparisons were performed between the frequency of a given
H3K27me3 subset and the frequency of expression set in the
genome (upper table) or between the frequency of a given
expression set and the frequency of H3K27me3 subset in the
genome (lower table). X2-test was applied to identify significantly
different genes (p#0.05).
(TIF)
Table S3 Frequency of H3K27me3 target genes within gene
families. The tables (A–E) show the percentages of H3K27me3
target genes, equally (M = L), meristem (dM+) and leaf (dL+)
specifically methylated genes for transcription factor (A), trans-
porter (B), other gene families (C, D) and transposable element
genes (E). The probabilities that the observed frequencies within a
gene family match the average representation in the genome
[p(ga)] are given by a X2-test. Frequencies resulting in p#0.05
were considered as significantly different. For transcription factor
genes, the probabilities that the observed frequencies match the
average of all transcription factor genes [p(TF)] were also
calculated.
(TIF)
Table S4 Lists of equally and differentially expressed genes.
Genes harbouring specific expression levels are grouped and
shown as gene sets X(M = L), dXM$2 (Dlog2(M-L)$2) and
dXL#22 (Dlog2(M-L)#22).
(XLSX)
Table S5 Lists of H3K27me3 target genes identified by ChIP-
chip. Enriched genes were separately identified for each tissue
(Me, Le) and methylation scores were calculated for each gene as
Dynamic Regulation of H3K27me3 in Plants
PLoS Genetics | www.plosgenetics.org 18 April 2011 | Volume 7 | Issue 4 | e1002040

described in methods. All genes harbouring H3K27me3 scores .0
are included in the lists. Genes harbouring defined methylation
levels were identified as described above (Figure 2 and methods).
(XLSX)
Table S6 Oligonucleotides used for ChIP-qPCR and qRT-PCR
analyses.
(XLSX)
Acknowledgments
We are grateful to Rudiger Simon for providing clv3–9 mutant seeds and to
Miin-Feng Wu and John W. Reed for pmir167a::GUS, pmir167d::GUS,
and pARF6::ARF6-GUS seeds. We thank Steve Henikoff and Francoise
Thibaud-Nissen for providing the design of the Nimblegen tiling array,
Nora Lorberg for excellent technical assistance, and the Nottingham
Arabidopsis Stock Centre for seeds. We appreciate critical reading of the
manuscript by Helge Pallakies, Yvonne Stahl, and Andrea Bleckmann.
Author Contributions
Conceived and designed the experiments: ML MLH DS. Performed the
experiments: ML MLH FLT OC DS. Analyzed the data: ML PK DS.
Wrote the paper: ML DS.
References
1. Barton MK (2010) Twenty years on: the inner workings of the shoot apical
meristem, a developmental dynamo. Dev Biol 341: 95–113.
2. Schuettengruber B, Chourrout D, Vervoort M, Leblanc B, Cavalli G (2007)
Genome regulation by polycomb and trithorax proteins. Cell 128: 735–745.
3. Muller J, Verrijzer P (2009) Biochemical mechanisms of gene regulation by
polycomb group protein complexes. Curr Opin Genet Dev 19: 150–158.
4. Johnson L, Mollah S, Garcia BA, Muratore TL, Shabanowitz J, et al. (2004)
Mass spectrometry analysis of Arabidopsis histone H3 reveals distinct
combinations of post-translational modifications. Nucleic Acids Res 32:
6511–6518.
5. Zhang X, Clarenz O, Cokus S, Bernatavichute YV, Pellegrini M, et al. (2007)
Whole-genome analysis of histone H3 lysine 27 trimethylation in Arabidopsis.
PLoS Biol 5: e129. doi:10.1371/journal.pbio.0050129.
6. Schwartz YB, Kahn TG, Nix DA, Li XY, Bourgon R, et al. (2006) Genome-
wide analysis of Polycomb targets in Drosophila melanogaster. Nat Genet 38:
700–705.
7. Bernstein BE, Mikkelsen TS, Xie X, Kamal M, Huebert DJ, et al. (2006) A
bivalent chromatin structure marks key developmental genes in embryonic stem
cells. Cell 125: 315–326.
8. Schubert D, Primavesi L, Bishopp A, Roberts G, Doonan J, et al. (2006)
Silencing by plant Polycomb-group genes requires dispersed trimethylation of
histone H3 at lysine 27. EMBO J 25: 4638–4649.
9. Hansen KH, Bracken AP, Pasini D, Dietrich N, Gehani SS, et al. (2008) A
model for transmission of the H3K27me3 epigenetic mark. Nat Cell Biol 10:
1291–1300.
10. Muller J, Hart CM, Francis NJ, Vargas ML, Sengupta A, et al. (2002) Histone
methyltransferase activity of a Drosophila Polycomb group repressor complex.
Cell 111: 197–208.
11. Cao R, Wang L, Wang H, Xia L, Erdjument-Bromage H, et al. (2002) Role of
histone H3 lysine 27 methylation in Polycomb-group silencing. Science 298:
1039–1043.
12. Czermin B, Melfi R, McCabe D, Seitz V, Imhof A, et al. (2002) Drosophila
enhancer of Zeste/ESC complexes have a histone H3 methyltransferase activity
that marks chromosomal Polycomb sites. Cell 111: 185–196.
13. Kuzmichev A, Nishioka K, Erdjument-Bromage H, Tempst P, Reinberg D
(2002) Histone methyltransferase activity associated with a human multiprotein
complex containing the Enhancer of Zeste protein. Genes Dev 16: 2893–2905.
14. Jiang D, Wang Y, Wang Y, He Y (2008) Repression of FLOWERING LOCUS
C and FLOWERING LOCUS T by the Arabidopsis Polycomb repressive
complex 2 components. PLoS ONE 3: e3404. doi:10.1371/journal.
pone.0003404.
15. Lindroth AM, Shultis D, Jasencakova Z, Fuchs J, Johnson L, et al. (2004) Dual
histone H3 methylation marks at lysines 9 and 27 required for interaction with
CHROMOMETHYLASE3. EMBO J 23: 4286–4296.
16. Schatlowski N, Creasey K, Goodrich J, Schubert D (2008) Keeping plants in
shape: Polycomb-group genes and histone methylation. Semin Cell Dev Biol 19:
2291–2305.
17. Kohler C, Villar CB (2008) Programming of gene expression by Polycomb
group proteins. Trends Cell Biol 18: 236–243.
18. Chanvivattana Y, Bishopp A, Schubert D, Stock C, Moon YH, et al. (2004)
Interaction of Polycomb-group proteins controlling flowering in Arabidopsis.
Development 131: 5263–5276.
19. Schubert D, Clarenz O, Goodrich J (2005) Epigenetic control of plant
development by Polycomb-group proteins. Curr Opin Plant Biol 8: 553–561.
20. Oh S, Park S, van NS (2008) Genic and global functions for Paf1C in chromatin
modification and gene expression in Arabidopsis. PLoS Genet 4: e1000077.
doi:10.1371/journal.pgen.1000077.
21. Turck F, Roudier F, Farrona S, Martin-Magniette ML, Guillaume E, et al.
(2007) Arabidopsis TFL2/LHP1 specifically associates with genes marked by
trimethylation of histone H3 lysine 27. PLoS Genet 3: e86. doi:10.1371/
journal.pgen.0030086.
22. Charron JB, He H, Elling AA, Deng XW (2009) Dynamic landscapes of four
histone modifications during deetiolation in Arabidopsis. Plant Cell 21:
3732–3748.
23. Schuettengruber B, Ganapathi M, Leblanc B, Portoso M, Jaschek R, et al.
(2009) Functional anatomy of polycomb and trithorax chromatin landscapes in
Drosophila embryos. PLoS Biol 7: e13. doi:10.1371/journal.pbio.1000013.
24. Bracken AP, Dietrich N, Pasini D, Hansen KH, Helin K (2006) Genome-widemapping of Polycomb target genes unravels their roles in cell fate transitions.
Genes Dev 20: 1123–1136.
25. Boyer LA, Plath K, Zeitlinger J, Brambrink T, Medeiros LA, et al. (2006)
Polycomb complexes repress developmental regulators in murine embryonicstem cells. Nature 441: 349–353.
26. Lee TI, Jenner RG, Boyer LA, Guenther MG, Levine SS, et al. (2006) Control
of developmental regulators by Polycomb in human embryonic stem cells. Cell
125: 301–313.
27. Squazzo SL, O’Geen H, Komashko VM, Krig SR, Jin VX, et al. (2006) Suz12binds to silenced regions of the genome in a cell-type-specific manner. Genome
Res 16: 890–900.
28. Oktaba K, Gutierrez L, Gagneur J, Girardot C, Sengupta AK, et al. (2008)
Dynamic regulation by polycomb group protein complexes controls patternformation and the cell cycle in Drosophila. Dev Cell 15: 877–889.
29. Tolhuis B, de Wit E, Muijrers I, Teunissen H, Talhout W, et al. (2006) Genome-
wide profiling of PRC1 and PRC2 Polycomb chromatin binding in Drosophila
melanogaster. Nat Genet 38: 694–699.
30. Papp B, Muller J (2006) Histone trimethylation and the maintenance oftranscriptional ON and OFF states by trxG and PcG proteins. Genes Dev 20:
2041–2054.
31. Deal RB, Henikoff S (2010) A Simple Method for Gene Expression and
Chromatin Profiling of Individual Cell Types within a Tissue. DevelopmentalCell 18: 1030–1040.
32. Mikkelsen TS, Ku M, Jaffe DB, Issac B, Lieberman E, et al. (2007) Genome-
wide maps of chromatin state in pluripotent and lineage-committed cells. Nature
448: 553–560.
33. Azuara V, Perry P, Sauer S, Spivakov M, Jorgensen HF, et al. (2006) Chromatinsignatures of pluripotent cell lines. Nat Cell Biol 8: 532–538.
34. Lafos M, Schubert D (2009) Balance of power—dynamic regulation of
chromatin in plant development. Biol Chem 390: 1113–1123.
35. Fletcher JC, Brand U, Running MP, Simon R, Meyerowitz EM (1999) Signaling
of cell fate decisions by CLAVATA3 in Arabidopsis shoot meristems. Science283: 1911–1914.
36. Zilberman D, Gehring M, Tran RK, Ballinger T, Henikoff S (2007) Genome-wide analysis of Arabidopsis thaliana DNA methylation uncovers an
interdependence between methylation and transcription. Nat Genet 39: 61–69.
37. Thibaud-Nissen F, Wu H, Richmond T, Redman JC, Johnson C, et al. (2006)Development of Arabidopsis whole-genome microarrays and their application to
the discovery of binding sites for the TGA2 transcription factor in salicylic acid-
treated plants. Plant J 47: 152–162.
38. Semiarti E, Ueno Y, Tsukaya H, Iwakawa H, Machida C, et al. (2001) TheASYMMETRIC LEAVES2 gene of Arabidopsis thaliana regulates formation of
a symmetric lamina, establishment of venation and repression of meristem-
related homeobox genes in leaves. Development 128: 1771–1783.
39. Fitzgerald JN, Hui PS, Berger F (2009) Polycomb group-dependent imprintingof the actin regulator AtFH5 regulates morphogenesis in Arabidopsis thaliana.
Development 136: 3399–3404.
40. Gustafson AM, Allen E, Givan S, Smith D, Carrington JC, et al. (2005) ASRP:
the Arabidopsis Small RNA Project Database. Nucleic Acids Res 33:D637–D640.
41. Chandler JW (2009) Local auxin production: a small contribution to a big field.
Bioessays 31: 60–70.
42. Zhao Y (2010) Auxin biosynthesis and its role in plant development. Annu Rev
Plant Biol 61: 49–64.
43. Vanneste S, Friml J (2009) Auxin: a trigger for change in plant development.Cell 136: 1005–1016.
44. Liscum E, Reed JW (2002) Genetics of Aux/IAA and ARF action in plantgrowth and development. Plant Mol Biol 49: 387–400.
45. Sung S, Schmitz RJ, Amasino RM (2006) A PHD finger protein involved in both
the vernalization and photoperiod pathways in Arabidopsis. Genes Dev 20:3244–3248.
Dynamic Regulation of H3K27me3 in Plants
PLoS Genetics | www.plosgenetics.org 19 April 2011 | Volume 7 | Issue 4 | e1002040

46. Calonje M, Sanchez R, Chen L, Sung ZR (2008) EMBRYONIC FLOWER1
participates in polycomb group-mediated AG gene silencing in Arabidopsis.
Plant Cell 20: 277–291.
47. Gendall AR, Levy YY, Wilson A, Dean C (2001) The VERNALIZATION 2
gene mediates the epigenetic regulation of vernalization in Arabidopsis. Cell
107: 525–535.
48. Katz A, Oliva M, Mosquna A, Hakim O, Ohad N (2004) FIE and CURLY
LEAF polycomb proteins interact in the regulation of homeobox gene expression
during sporophyte development. Plant J 37: 707–719.
49. Xu L, Shen WH (2008) Polycomb silencing of KNOX genes confines shoot stem
cell niches in Arabidopsis. Curr Biol 18: 1966–1971.
50. Palatnik JF, Allen E, Wu X, Schommer C, Schwab R, et al. (2003) Control of
leaf morphogenesis by microRNAs. Nature 425: 257–263.
51. Weinhofer I, Hehenberger E, Roszak P, Hennig L, Kohler C (2010) H3K27me3
profiling of the endosperm implies exclusion of polycomb group protein
targeting by DNA methylation. PLoS Genet 6: e1001152. doi:10.1371/
journal.pgen.1001152.
52. Baubec T, Pecinka A, Rozhon W, Mittelsten SO (2009) Effective, homogeneous
and transient interference with cytosine methylation in plant genomic DNA by
zebularine. Plant J 57: 542–554.
53. Wu MF, Tian Q, Reed JW (2006) Arabidopsis microRNA167 controls patterns
of ARF6 and ARF8 expression, and regulates both female and male
reproduction. Development 133: 4211–4218.
54. Negre N, Hennetin J, Sun LV, Lavrov S, Bellis M, et al. (2006) Chromosomal
distribution of PcG proteins during Drosophila development. PLoS Biol 4: e170.
doi:10.1371/journal.pbio.0040170.
55. Jackson JP, Johnson L, Jasencakova Z, Zhang X, PerezBurgos L, et al. (2004)
Dimethylation of histone H3 lysine 9 is a critical mark for DNA methylation and
gene silencing in Arabidopsis thaliana. Chromosoma 112: 308–315.
56. Jacob Y, Feng S, LeBlanc CA, Bernatavichute YV, Stroud H, et al. (2009)
ATXR5 and ATXR6 are H3K27 monomethyltransferases required for
chromatin structure and gene silencing. Nat Struct Mol Biol 16: 763–768.
57. Grigg SP, Canales C, Hay A, Tsiantis M (2005) SERRATE coordinates shoot
meristem function and leaf axial patterning in Arabidopsis. Nature 437:
1022–1026.
58. Chellappan P, Xia J, Zhou X, Gao S, Zhang X, et al. (2010) siRNAs from
miRNA sites mediate DNA methylation of target genes. Nucleic Acids Res. doi
10.1093/nar/gkq590.
59. Bao N, Lye KW, Barton MK (2004) MicroRNA binding sites in Arabidopsis
class III HD-ZIP mRNAs are required for methylation of the template
chromosome. Dev Cell 7: 653–662.
60. Jones-Rhoades MW, Bartel DP (2004) Computational identification of plant
microRNAs and their targets, including a stress-induced miRNA. Mol Cell 14:
787–799.
61. Rhoades MW, Reinhart BJ, Lim LP, Burge CB, Bartel B, et al. (2002) Prediction
of plant microRNA targets. Cell 110: 513–520.
62. Kuchen S, Resch W, Yamane A, Kuo N, Li Z, et al. (2010) Regulation of
microRNA expression and abundance during lymphopoiesis. Immunity 32:828–839.
63. Enderle D, Beisel C, Stadler MB, Gerstung M, Athri P, et al. (2011) Polycomb
preferentially targets stalled promoters of coding and noncoding transcripts.Genome Res. doi:10.1101/gr.114348.110.
64. Zhao Y (2008) The role of local biosynthesis of auxin and cytokinin in plantdevelopment. Curr Opin Plant Biol 11: 16–22.
65. Zazimalova E, Murphy AS, Yang H, Hoyerova K, Hosek P (2010) Auxin
transporters—why so many? Cold Spring Harb Perspect Biol 2: a001552.66. Parry G, Calderon-Villalobos LI, Prigge M, Peret B, Dharmasiri S, et al. (2009)
Complex regulation of the TIR1/AFB family of auxin receptors. Proc Natl AcadSci U S A 106: 22540–22545.
67. Navarro L, Dunoyer P, Jay F, Arnold B, Dharmasiri N, et al. (2006) A plantmiRNA contributes to antibacterial resistance by repressing auxin signaling.
Science 312: 436–439.
68. Goda H, Sasaki E, Akiyama K, Maruyama-Nakashita A, Nakabayashi K, et al.(2008) The AtGenExpress hormone and chemical treatment data set:
experimental design, data evaluation, model data analysis and data access.Plant J 55: 526–542.
69. Rizzardi K, Landberg K, Nilsson L, Ljung K, Sundas-Larsson A (2010) TFL2/
LHP1 is involved in auxin biosynthesis through positive regulation of YUCCAgenes. Plant J DOI: 10.1111/j.1365-313X.2010.04470.x.
70. Kim SY, Zhu T, Sung ZR (2010) Epigenetic regulation of gene programs byEMF1 and EMF2 in Arabidopsis. Plant Physiol 152: 516–528.
71. Sung S, Amasino RM (2004) Vernalization in Arabidopsis thaliana is mediatedby the PHD finger protein VIN3. Nature 427: 159–164.
72. Bastow R, Mylne JS, Lister C, Lippman Z, Martienssen RA, et al. (2004)
Vernalization requires epigenetic silencing of FLC by histone methylation.Nature 427: 164–167.
73. Gentleman RC, Carey VJ, Bates DM, Bolstad B, Dettling M, et al. (2004)Bioconductor: open software development for computational biology and
bioinformatics. Genome Biol 5: R80.
74. Toedling J, Skylar O, Krueger T, Fischer JJ, Sperling S, et al. (2007) Ringo—anR/Bioconductor package for analyzing ChIP-chip readouts. BMC Bioinfor-
matics 8: 221.75. Perez-Rodriguez P, Riano-Pachon DM, Correa LG, Rensing SA, Kersten B,
et al. (2010) PlnTFDB: updated content and new features of the planttranscription factor database. Nucleic Acids Res 38: D822–D827.
76. Czechowski T, Stitt M, Altmann T, Udvardi MK, Scheible WR (2005) Genome-
wide identification and testing of superior reference genes for transcriptnormalization in Arabidopsis. Plant Physiol 139: 5–17.
77. Yan D, Zhang Y, Niu L, Yuan Y, Cao X (2007) Identification andcharacterization of two closely related histone H4 arginine 3 methyltransferases
in Arabidopsis thaliana. Biochem J 408: 113–121.
78. Colon-Carmona A, You R, Haimovitch-Gal T, Doerner P (1999) Technicaladvance: spatio-temporal analysis of mitotic activity with a labile cyclin-GUS
fusion protein. Plant J 20: 503–508.
Dynamic Regulation of H3K27me3 in Plants
PLoS Genetics | www.plosgenetics.org 20 April 2011 | Volume 7 | Issue 4 | e1002040