Dynamic performance of biomass based carbons for CO2/CH4 ... · Approximation to a PSA 3 ... 60...
37
1 Dynamic performance of biomass based carbons for 1 CO 2 /CH 4 separation. Approximation to a PSA 2 process for biogas upgrading. 3 Noelia Álvarez-Gutiérrez, Susana García † , María Victoria Gil, Fernando Rubiera, Covadonga 4 Pevida* 5 Instituto Nacional del Carbón, INCAR-CSIC. Apartado 73, 33080 Oviedo, Spain. 6 † currently at Centre for Innovation in Carbon Capture and Storage (CICCS), School of 7 Engineering and Physical Sciences, Heriot-Watt University, Edinburgh EH14 4AS, United 8 Kingdom 9 10 KEYWORDS. Adsorption; CO 2 /CH 4 separation; biomass based activated carbon; breakthrough 11 tests. 12 13 ABSTRACT 14 Physical adsorption based processes such as pressure swing adsorption (PSA) constitute 15 an alternative to selectively adsorb CO 2 from biogas streams. There is abundant work regarding 16 the equilibrium of adsorption of pure CH 4 and CO 2 on different adsorbents. However, to design 17
Transcript of Dynamic performance of biomass based carbons for CO2/CH4 ... · Approximation to a PSA 3 ... 60...
1
Dynamic performance of biomass based carbons for 1
CO2/CH4 separation. Approximation to a PSA 2
process for biogas upgrading. 3
Noelia Álvarez-Gutiérrez, Susana García†, María Victoria Gil, Fernando Rubiera, Covadonga 4
Pevida* 5
Instituto Nacional del Carbón, INCAR-CSIC. Apartado 73, 33080 Oviedo, Spain. 6
†currently at Centre for Innovation in Carbon Capture and Storage (CICCS), School of 7
Engineering and Physical Sciences, Heriot-Watt University, Edinburgh EH14 4AS, United 8
Kingdom 9
10
KEYWORDS. Adsorption; CO2/CH4 separation; biomass based activated carbon; breakthrough 11
tests. 12
13
ABSTRACT 14
Physical adsorption based processes such as pressure swing adsorption (PSA) constitute 15
an alternative to selectively adsorb CO2 from biogas streams. There is abundant work regarding 16
the equilibrium of adsorption of pure CH4 and CO2 on different adsorbents. However, to design 17
2
an adsorption process with a selected adsorbent it is very important to account for its dynamic 18
behavior in a packed-bed. Thus, the performance of two biomass based activated carbons (CS-19
CO2 and CS-H2O) previously prepared in our laboratory, to separate CO2/CH4 has been 20
evaluated. Full adsorption-desorption cycles were conducted at 30 ºC (isothermal conditions) and 21
different pressures (1, 3, 5, and 10 bar) feeding binary CO2/CH4 (50/50 vol. %) mixtures to a 22
purpose-built fixed-bed set-up. A commercial activated carbon, Calgon BPL, was also evaluated 23
for reference purposes. CO2 equilibrium uptakes were obtained from dynamic breakthrough 24
curves and proved to be maxima at 10 bar (5.14, 4.48 and 4.14 mol kg-1
for CS-CO2, CS-H2O 25
and Calgon BPL, respectively). However the CO2/CH4 separation efficiency, according to the 26
difference in breakthrough times between CH4 and CO2, is very limited at 10 bar. A combined 27
analysis of the productivity and purity of CH4 along with CO2 working capacity derived from 28
dynamic experiments indicates that our biomass based activated carbons would be better 29
candidate materials for the CO2/CH4 separation at a pressure of 5 bar than the commercial 30
activated carbon Calgon BPL. 31
32
INTRODUCTION 33
The European Union passed the Directive on Renewable Energy on December 9th
, 2009 34
as part of the EU-Climate Change and Energy Strategy. The directive establishes an overall 35
policy for the production and promotion of energy from renewable sources in the EU with the 36
aim of fulfilling at least 20% of its total energy needs with renewables by 2020. It specifies 37
national renewable energy targets for each country, taking into account its starting point and 38
overall potential for renewables. These targets range from values as low as 10% for Malta to 39
values as high as 49% for Sweden1. Therefore, biogas demand is expected to increase 40
3
continuously in the coming years because of its ability to produce lower CO2 emissions than 41
fossil fuels. In addition, the global capacity for power generation from commercial biogas 42
facilities will more than double over the next decade, from 14.5 GW in 2012 to 29.5 GW in 43
20222. 44
Since biogas contains significant amount of CO2 (30-65%) 3 its heating value is very low 45
compared to natural gas. Upon removal of water (vapor), hydrogen sulphide, siloxanes, 46
hydrocarbons, ammonia and dust particles, biogas calorific value and relative density need to be 47
adjusted in order to meet the specifications of the Wobbe Index 4, i.e., biogas upgrade to natural 48
gas quality. Towards that purpose and also to avoid pipeline and equipment corrosion, the CO2 49
content for pipeline grade bio-methane should be less than 2-3% 5. On the economical side, the 50
removal of CO2 is the most critical step in biogas upgrading. The upgrading of biogas takes 51
between 3-6% of the energy of biogas and may cost up to 10 €/GJ for small streams 6. 52
Currently, several methods are commercially available for the removal of carbon dioxide 53
and other gases from biogas. These methods include adsorption 7, absorption
8 , membranes
9, 54
and cryogenic separation 10
. Among these methods, pressure swing adsorption (PSA) processes 55
have become increasingly competitive. 56
Biogas is usually delivered at low pressure so it needs to be compressed to a pressure 57
between 4-10 bar before the PSA unit 11
. The main goal of the PSA process is to produce fuel 58
grade methane (methane purity ≥ 97%) 12
. It is however most likely that in the future more 59
stringent specifications will apply to the methane recovery given its high Global Warming 60
Potential 13, 14
. The PSA process relies on the fact that under pressure, gases tend to be attracted 61
to solid surfaces, or “adsorbed”. The higher the pressure, the more gas is adsorbed; when the 62
pressure is reduced, the gas is released, or desorbed. Despite the remarkable growth in practical 63
4
applications of adsorptive gas separation processes, their commercial design and optimization 64
still require a significant experimental effort. 65
After original work by Sircar in the late 1980s 15
, many studies have been performed on 66
PSA processes aimed at separating CO2 from gaseous streams containing CH4 16-21
. Most studies 67
have focused on zeolites 22-24
, metal-organic frameworks 14, 25-27
, and activated carbons 28-30
. 68
Knowledge of the dynamic fixed-bed behavior is an elemental tool to validate the model 69
used to describe the PSA performance 31
. Literature on the dynamic performance of adsorbent 70
beds for CO2/CH4 separation is scarce 32-34
and specific data on biomass based activated carbons 71
for biogas upgrading under similar operational conditions to those presented here is lacking. 72
Two biomass based activated carbons (CS-CO2 and CS-H2O) previously prepared in our 73
laboratory have shown great potential for the above application based on their CO2 and CH4 74
equilibrium capture capacities (static) at high pressures 35
. However, as previously mentioned, 75
the dynamic fixed-bed behavior is required to ascertain the extent to which the equilibrium 76
uptake may be translated into breakthrough capacity. In this work, the performance of these 77
biomass based materials has been evaluated under dynamic conditions. Hence, breakthrough 78
experiments were performed with a simulated binary gas stream consisting of CO2 and CH4 79
(50/50 vol. %) at 30 ºC and varying total pressures (1, 3, 5, and 10 bar). A commercial activated 80
carbon, Calgon BPL, was also evaluated for comparison purposes. 81
Finally, the performance of the tested adsorbents over consecutive adsorption-desorption 82
long cycles (120 to 300 min) has been used to evaluate a set of parameters for the design and 83
optimization of a PSA process applied to biogas upgrading. 84
85
5
MATERIALS AND METHODS 86
Materials 87
Two biomass-based activated carbon samples (CS-CO2 and CS-H2O) previously prepared 88
in our laboratory from cherry stones, a low cost biomass residue from the Spanish food industry, 89
have been evaluated as adsorbent materials. CS-CO2 and CS-H2O samples were activated in a 90
CO2 and H2O single-step process, respectively. A fully detailed chemical and textural 91
characterization of these carbons has been reported previously36
. Moreover, in this study, a 92
commercial activated carbon, Calgon BPL, was chosen for comparison purposes. Details on its 93
chemical and textural characterization can be found elsewhere 37
. All gases used in this work 94
were obtained from Air Products with purities higher than 99.995%. Table 1 summarizes the 95
main characteristics of the evaluated adsorbents. 96
Static measurements 97
CO2 and CH4 adsorption isotherms at 30 ºC and up to 10 bar were determined in a high 98
pressure magnetic suspension balance, Rubotherm-VTI. The initial mass of sample used for the 99
adsorption isotherms was approximately 0.5 g and the equilibrium criteria was set to 0.0050 wt% 100
change in 10 min. Prior to adsorption, the sample was dried in situ under vacuum at 100 ˚C for 101
120 min. The cell holding the sample is then cooled down to the measuring temperature, and 102
pressurization is attained with the desired adsorbate in a stepwise mode, so the change in the 103
weight of the adsorbent sample as well as pressure and temperature are measured and recorded 104
when equilibrium is reached. 105
Experiments with helium were carried out in order to determine the volume of the 106
adsorbent and cell system, enabling the effect of buoyancy on the measurements to be evaluated. 107
6
The absolute amount of CO2 and CH4 adsorbed over the pressure range tested were estimated 108
following the procedure described in a previous work 38
. 109
Dynamic column breakthrough measurements 110
Experimental set up. All experiments were conducted in a lab-scale fixed-bed reactor 111
packed with the adsorbent material. The main characteristics of the adsorbent beds are 112
summarized in Table 2. It is worth pointing out that almost double amount of BPL activated 113
carbon sample (7 g) was required for the experimental runs when compared to the biomass-based 114
samples (4.1 g of CS-CO2 and 4.8 g of CS-H2O), which was derived from targeting a similar bed 115
height in all the experiments. 116
The detailed description of the system can be found elsewhere 39
. The stainless steel 117
fixed-bed reactor is 13.3 cm in height, 1.3 cm in diameter and is equipped with a porous plate 118
located 4.7 cm from the base of the column. The gas manifold system consists of three lines 119
fitted with mass flow controllers from Bronkhorst High-Tech with flows ranging between 1 and 120
200 mL min-1
STP. The controllers have an accuracy of 1% full scale and a repeatability of 0.1% 121
full scale. One of the lines is used to feed in an inert gas, He, in order to dry the sample before 122
each experiment. The other two lines feed in CO2 and CH4. To monitor the column temperature a 123
K-type thermocouple with an accuracy of ±1.5 ºC was used, which is located at a height of 3.6 124
cm above the porous plate (exit end of the column). The mass flow rate of the effluent from the 125
adsorbent bed was measured using a mini CORI-FLOW meter from Bronkhorst. Effluent gas 126
analysis was performed by means of a dual channel micro-gas chromatograph, Varian CP-4900, 127
fitted with a thermal conductivity detector (TCD) in which He and Ar were used as the carrier 128
gases. 129
7
Breakthrough tests. Prior to each experiment, the TCD was calibrated employing 130
CO2/CH4/He mixtures of known compositions. The bed was packed with activated carbon in 131
order to measure the dynamics of the CO2 and CH4 in the column. A simulated biogas CO2/CH4 132
mixture (50/50 vol. %) was fed (30 mL min-1
STP) to the adsorption unit and the adsorption 133
performance of the samples was evaluated at a temperature of 30 ºC under isothermal conditions 134
and four different pressures (1, 3, 5, and 10 bar). For each sample six consecutive adsorption-135
desorption cycles were conducted to test the reproducibility of the system, where adsorption 136
proceeded until saturation and desorption was extended to full regeneration of the activated 137
carbon samples. 138
Each experimental run involved the following steps: (i) drying of the adsorbent before 139
each experiment by flowing He (50 mL min−1
STP) for 60 min at 180 ºC and atmospheric 140
pressure, (ii) pressurization and cooling down to the adsorption temperature (30 ºC) in a 141
preconditioning step of 20 min, where 50 mL min−1
(STP) of He was allowed to flow through the 142
system, (iii) feed gas switch to a CO2/CH4 gas mixture for a duration of 60 min (120-180 min for 143
the experiments at 10 bar) so adsorption takes place until complete saturation is achieved, and 144
(iv) depressurization of the unit and atmospheric pressure purge with 50 mL min−1
(STP) of He 145
at 180 ºC for 60 min (120 min for experiment at 10 bar) to fully desorb the adsorptive gases from 146
the column. During the adsorption stage the CO2 and CH4 concentrations in the column effluent 147
gas were continuously monitored as a function of time -breakthrough curve- and maximum or 148
equilibrium dynamic adsorption capacity of the adsorbents were calculated after the outlet CO2 149
concentration equaled that of the inlet stream. However, in a typical operation, the flow would be 150
stopped or diverted to a fresh adsorbent bed once the CO2 concentration reached that limit 40
. 151
8
The equilibrium CO2 adsorption capacity and breakthrough time, tb, or time it takes for 152
CO2 to be detected at the adsorption column outlet, were calculated as an average of values 153
obtained from six consecutive adsorption-desorption cycles. Also, as adsorbents were fully 154
regenerated, the repeatability of breakthrough curves could be assessed. Equilibrium adsorption 155
capacities were determined by applying a mass balance equation to the bed as well as accounting 156
for gas accumulated in intraparticle voids and dead space of the bed 37
. 157
Blank experiments were also conducted at 30 ºC and at the different pressures with a bed 158
packed with glass beads of approximately 3 mm diameter. With these experiments extra-column 159
effects (e.g., gas holdup) during the breakthrough tests at the different pressures could be 160
accounted for. 161
162
RESULTS AND DISCUSSION 163
Breakthrough curves from binary CO2/CH4 adsorption experiments 164
The CO2 and CH4 concentration at the outlet of the bed were measured for the adsorbents 165
at the selected adsorption pressures and C/C0 (ratio between the outlet CO2 or CH4 concentration 166
at a given time and that in the feed) was plotted versus time (Figure 1). The breakthrough times 167
were taken at a relative concentration (Ci,outlet/Ci,feed) of 0.05. 168
It is observed that after an initial period during which both components are fully 169
adsorbed, CH4 always breaks first and its breakthrough curve exhibits a so-called roll-up or roll-170
over, which means that the molar flow rate of CH4 in the effluent is temporarily higher than that 171
fed to the adsorption bed. The explanation for this phenomenon is that CH4 is first adsorbed and 172
thereby concentrated in the adsorbent, but then it is displaced by CO2 whose concentration front 173
advances slower through the column than that of CH4. The so-induced desorption of CH4 is 174
9
responsible for a CH4 flow rate rise above the feed flow rate. As time goes by, the concentration 175
of both components at the outlet evolves to feed concentration level, indicating that the column is 176
saturated. The preferential adsorption of CO2 over CH4 can be explained by the different 177
adsorption strength of the two molecules. The permanent quadrupole moment of CO2 (-1.4 x 10-
178
35 cm) leads to strong adsorption; CH4, in contrast, is not capable of similar interactions and is 179
therefore adsorbed less strongly 41
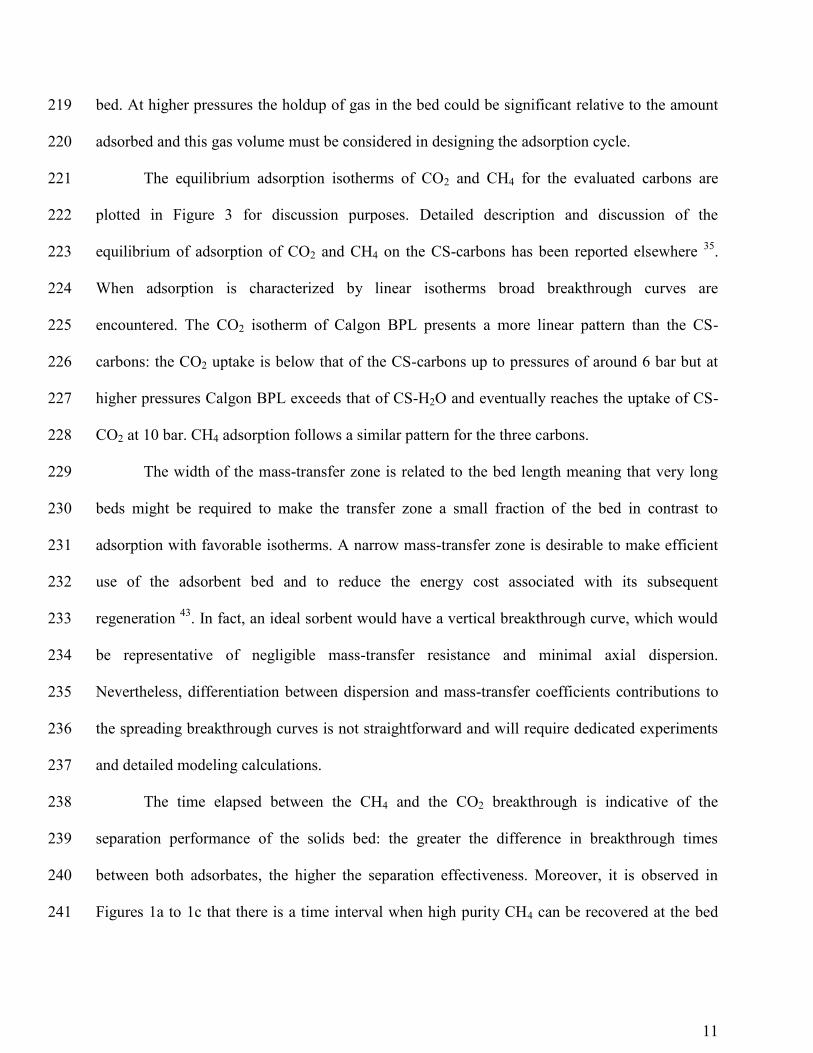
. The amplitude of the roll-up is a measure of the competition 180
between CO2 and CH4 for adsorption sites: it is high when a large amount of CH4 is rapidly 181
replaced by incoming CO2. An adsorbent may be selective because it intrinsically adsorbs very 182
little CH4 (early breakthrough of CH4, weak roll-up), strongly prefers CO2 over CH4, in spite of a 183
fairly strong interaction with CH4 (late breakthrough of CH4, strong roll-up), or by a combination 184
of both effects 42
. 185
As shown in Figures 1a to 1c, consecutive breakthrough curves (identified by the same 186
color and different symbols) practically overlap showing that adsorbents were fully regenerated 187
and samples remained stable after six consecutive adsorption-desorption cycles. Based on 188
observed CH4 and CO2 concentration fronts, CO2/CH4 separation might be feasible on CS-CO2 189
and CS-H2O samples as a clear difference in breakthrough time between CO2 and CH4 is 190
observed. However, the ability to separate CO2/CH4 is reduced for the commercial activated 191
carbon Calgon BPL (Figure 1c) given the closer breakthroughs of CO2 and CH4. This indicates 192
that Calgon BPL is less selective than our carbons. 193
It is well known that pressure affects the shape of the breakthrough curve as well as the 194
breakthrough time. Higher adsorption pressures (i.e., higher CO2 and CH4 partial pressures) lead 195
to increase adsorbed amounts and so the concentration front of each adsorptive takes more time 196
10
to reach the bed outlet. For instance, the CO2 adsorption front reaches the bed outlet after 197
approximately 9 min at 1 bar and after 25 min at 10 bar for carbon CS-CO2 (see Figure 1a). 198
In Figure 2 the CO2 and CH4 breakthrough curves for the activated carbons at each 199
pressure studied (1, 3, 5, and 10 bar) have been overlapped for comparison purposes. 200
The mass-transfer zone (between the break point and saturation) where most of the 201
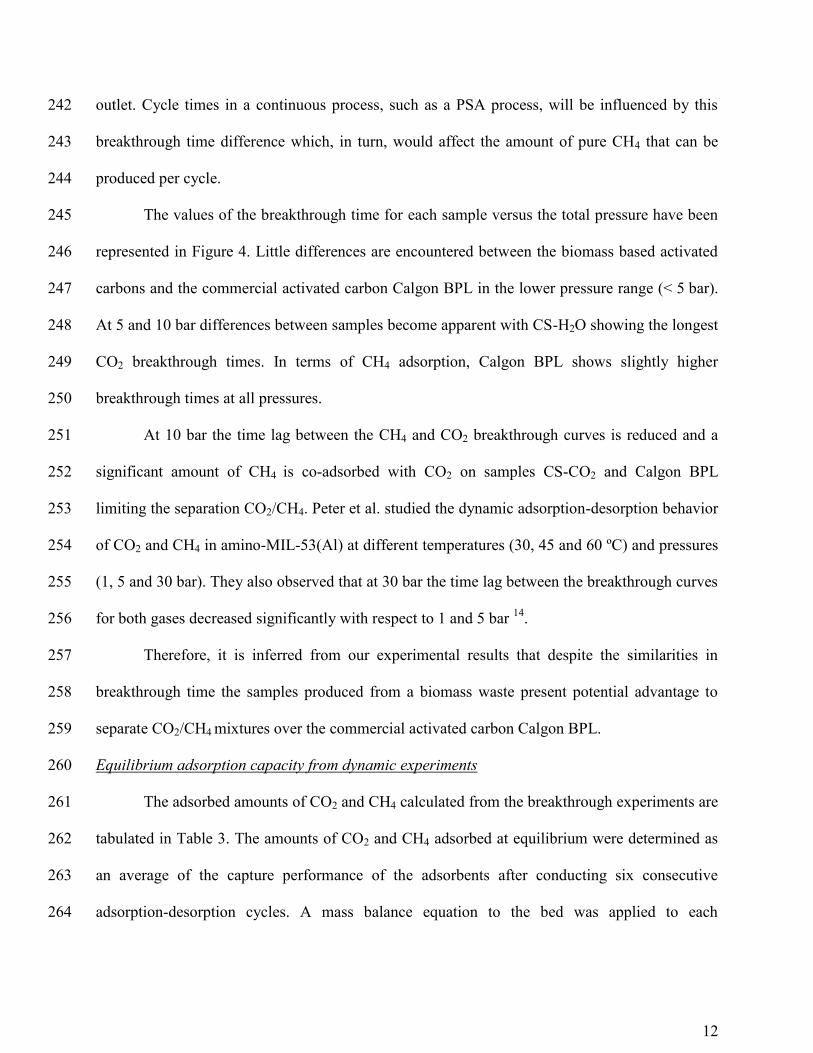
change in concentration occurs becomes wider with increasing pressure (see Figure 2). For the 202
cherry stones-based carbons this is remarkable only at 10 bar but in the case of Calgon BPL the 203
broadening of the breakthrough curves is also observed at lower pressures. The width and shape 204
of the mass-transfer zone depend on the mass-transfer rate, the flow rate and the shape of the 205
equilibrium adsorption isotherm. Breakthrough curves are usually S-shaped due to the role of 206
internal diffusion resistance that tends to increase when the solid becomes nearly saturated. 207
However, if pore diffusion is controlling the rate of adsorption the breakthrough curve has the 208
opposite shape. This could be the case for CO2 adsorption on Calgon BPL at 5 and 10 bar where 209
concave downwards curves are encountered. 210
In the case of CH4, the breakthrough curves at the different pressures present similar 211
slopes for the cherry stones activated carbons. It is observed that at 10 bar the height of the roll-212
up decreases but it becomes broader. Calgon BPL shows a different pattern in the CH4 213
breakthrough curves: at pressures ≥ 5 bar the slopes and the roll-up are remarkably different. 214
Blank experiments with glass beads (non-adsorbent solid) are also included in Figure 2d. 215
As expected breakthrough times are considerably reduced with respect to the adsorption 216
experiments and no roll-up is observed. It can be seen that the sharpness of the curves drastically 217
changes at 10 bar. This could be a result of the volume of gas accumulated in the voids of the 218
11
bed. At higher pressures the holdup of gas in the bed could be significant relative to the amount 219
adsorbed and this gas volume must be considered in designing the adsorption cycle. 220
The equilibrium adsorption isotherms of CO2 and CH4 for the evaluated carbons are 221
plotted in Figure 3 for discussion purposes. Detailed description and discussion of the 222
equilibrium of adsorption of CO2 and CH4 on the CS-carbons has been reported elsewhere 35
. 223
When adsorption is characterized by linear isotherms broad breakthrough curves are 224
encountered. The CO2 isotherm of Calgon BPL presents a more linear pattern than the CS-225
carbons: the CO2 uptake is below that of the CS-carbons up to pressures of around 6 bar but at 226
higher pressures Calgon BPL exceeds that of CS-H2O and eventually reaches the uptake of CS- 227
CO2 at 10 bar. CH4 adsorption follows a similar pattern for the three carbons. 228
The width of the mass-transfer zone is related to the bed length meaning that very long 229
beds might be required to make the transfer zone a small fraction of the bed in contrast to 230
adsorption with favorable isotherms. A narrow mass-transfer zone is desirable to make efficient 231
use of the adsorbent bed and to reduce the energy cost associated with its subsequent 232
regeneration 43
. In fact, an ideal sorbent would have a vertical breakthrough curve, which would 233
be representative of negligible mass-transfer resistance and minimal axial dispersion. 234
Nevertheless, differentiation between dispersion and mass-transfer coefficients contributions to 235
the spreading breakthrough curves is not straightforward and will require dedicated experiments 236
and detailed modeling calculations. 237
The time elapsed between the CH4 and the CO2 breakthrough is indicative of the 238
separation performance of the solids bed: the greater the difference in breakthrough times 239
between both adsorbates, the higher the separation effectiveness. Moreover, it is observed in 240
Figures 1a to 1c that there is a time interval when high purity CH4 can be recovered at the bed 241
12
outlet. Cycle times in a continuous process, such as a PSA process, will be influenced by this 242
breakthrough time difference which, in turn, would affect the amount of pure CH4 that can be 243
produced per cycle. 244
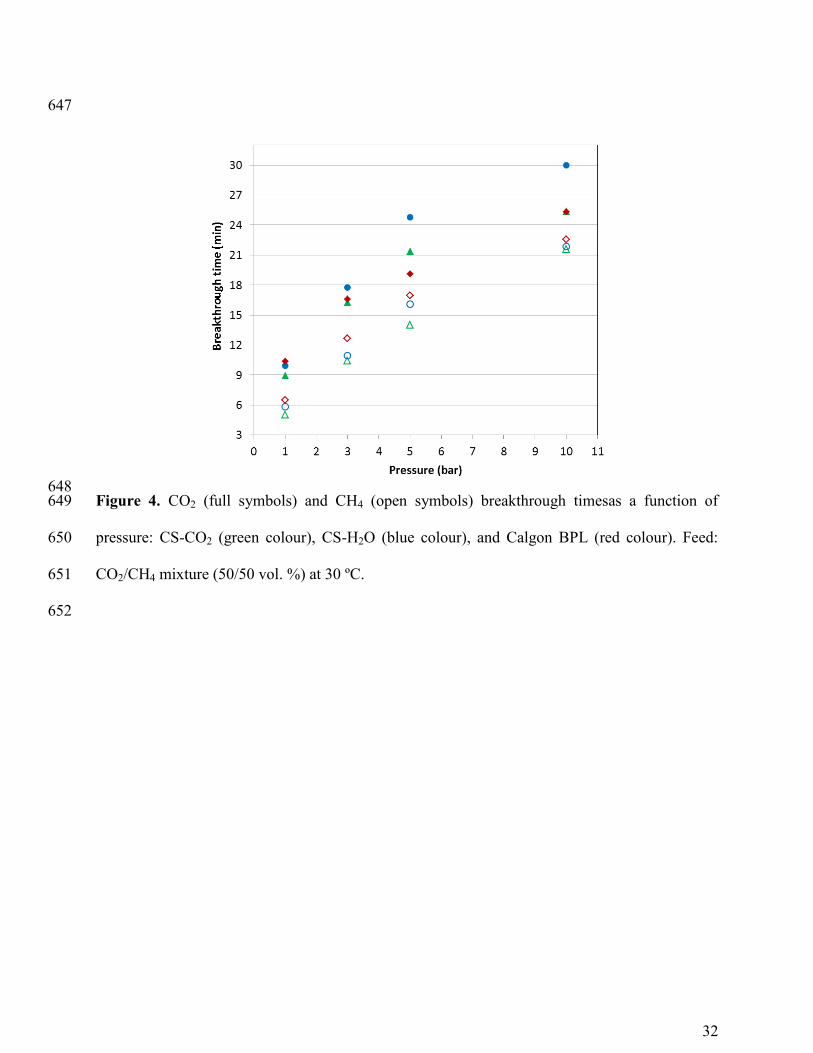
The values of the breakthrough time for each sample versus the total pressure have been 245
represented in Figure 4. Little differences are encountered between the biomass based activated 246
carbons and the commercial activated carbon Calgon BPL in the lower pressure range (< 5 bar). 247
At 5 and 10 bar differences between samples become apparent with CS-H2O showing the longest 248
CO2 breakthrough times. In terms of CH4 adsorption, Calgon BPL shows slightly higher 249
breakthrough times at all pressures. 250
At 10 bar the time lag between the CH4 and CO2 breakthrough curves is reduced and a 251
significant amount of CH4 is co-adsorbed with CO2 on samples CS-CO2 and Calgon BPL 252
limiting the separation CO2/CH4. Peter et al. studied the dynamic adsorption-desorption behavior 253
of CO2 and CH4 in amino-MIL-53(Al) at different temperatures (30, 45 and 60 ºC) and pressures 254
(1, 5 and 30 bar). They also observed that at 30 bar the time lag between the breakthrough curves 255
for both gases decreased significantly with respect to 1 and 5 bar 14
. 256
Therefore, it is inferred from our experimental results that despite the similarities in 257
breakthrough time the samples produced from a biomass waste present potential advantage to 258
separate CO2/CH4 mixtures over the commercial activated carbon Calgon BPL. 259
Equilibrium adsorption capacity from dynamic experiments 260
The adsorbed amounts of CO2 and CH4 calculated from the breakthrough experiments are 261
tabulated in Table 3. The amounts of CO2 and CH4 adsorbed at equilibrium were determined as 262
an average of the capture performance of the adsorbents after conducting six consecutive 263
adsorption-desorption cycles. A mass balance equation to the bed was applied to each 264
13
adsorption-desorption cycle, which considered the gas accumulated in the intraparticle voids and 265
dead spaces of the bed. More details about the calculation procedure can be found in Gil et al. 37,
266
39. 267
While adsorption capacities are usually reported in the literature on a mass basis (e.g. mol 268
of CO2 adsorbed per kg of adsorbent), the volumetric capacities (e.g. mol of CO2 adsorbed per 269
m3 of adsorbent) were also calculated, since both parameters are critical in designing adsorption 270
separation processes 44
. 271
The uptakes obtained from the breakthrough experiments indicate that, as expected, the 272
adsorption capacity of the activated carbons increased with pressure. For instance, the capacity 273
values obtained at 30 ºC for the CS-CO2 sample rose from 1.63 to 5.14 mol kg-1
adsorbent as the 274
pressure increased from 1 to 10 bar. 275
The CO2 adsorption capacity on a mass basis followed the order: CS-CO2 > CS-H2O > 276
Calgon BPL (Table 3). The greatest CO2 adsorption capacity (5.14 mol kg-1
) corresponds to the 277
biomass based activated carbon CS-CO2 at 10 bar. The CH4 adsorption capacity on a mass basis 278
showed similar trend although the difference among the uptakes of the adsorbents is less 279
noticeable than in the case of the CO2 adsorption capacity. The greatest CH4 uptake on a mass 280
basis (1.55 mol kg-1
) corresponds to CS-CO2 at 10 bar. 281
It has been previously reported that at high pressure, the total micropore volume, 282
determined by N2 adsorption isotherms at -196 ºC, is the textural parameter more directly related 283
to the CO2 adsorption capacity of the materials 45, 46
. In fact, Wiersum et al. observed that at high 284
pressure the solid with the largest pore volume also exhibited the highest uptakes while the solid 285
with the smallest pore volume adsorbed the least 47
. However, in this work we encounter the 286
opposite trend. Based on textural properties of the materials (Table 1), Calgon BPL is the sample 287
14
with largest micropore volume (0.46 cm3 g
-1) compared to CS-CO2 (0.40 cm
3 g
-1) and CS-H2O 288
(0.38 cm3 g
-1). This may be attributed to the significantly narrower average micropore width of 289
the biomass based carbons (Table 1) that also plays a significant role in high pressure adsorption 290
46. 291
Comparing the calculated capacities on a volumetric basis the previous trend is reversed. 292
The CO2 adsorption capacity follows the order: Calgon BPL > CS-H2O > CS-CO2 (Table 3). 293
This is mainly attributed to a different bed weight for breakthrough tests with Calgon BPL (see 294
bed density in Table 2) as a constant bed height was targeted for the experiments with three 295
different adsorbents. This is a disadvantage of the biomass based carbons that could be overcome 296
with tailored conformation during the production process. It should be noted however, that the 297
large CO2 adsorption capacity on a volumetric basis of Calgon BPL, is also accompanied by 298
significant CH4 adsorption that may lead to reduce adsorption selectivity. 299
Optimization of adsorption conditions 300
Generally, in a PSA process one of the feed components is preferably adsorbed in the bed 301
(in this case CO2), while the rest of them are weakly adsorbed and leave the bed forming the 302
raffinate. During subsequent regeneration, the CO2 retained is desorbed and it is recovered as 303
extract. Therefore, the target is to recover most, in this case CO2, as part of the extract and with 304
the highest possible purity. Nevertheless, in biogas upgrading both raffinate (CH4) and extract 305
(CO2) are valuable products that might be recovered at high purity. Therefore, the purity level of 306
the CH4 will be dictated primarily by the breakthrough of CO2 that is first eluted from the 307
adsorbent bed. 308
The dynamic experiments were conducted until saturation and complete regeneration of 309
the solids bed were reached in each cycle. In a real PSA process the feed step is normally 310
15
terminated before the most strongly adsorbed component breaks through the bed (saturation), 311
while the regeneration step is generally terminated before the bed is fully regenerated. 312
The analysis of transient breakthroughs has proved useful to evaluate the separation 313
performance of adsorbents 48
. By analyzing the performance of these long cycles we can identify 314
conditions that would be feasible in short cyclic experiments to be applied to a real PSA process 315
aimed for biogas upgrading. 316
Therefore, in this work, three different parameters have been selected to account for the 317
process performance. These are: CO2 working capacity, CH4 productivity and CH4 purity. The 318
last one is defined through the operating conditions of the process. As we have mentioned in the 319
Introduction, the present study does not intend to conduct a detailed design and/or optimization 320
of a PSA unit. 321
The working capacity is defined herein as the difference between the loading of the 322
component that needs to be preferentially adsorbed, expressed in moles per kilogram of 323
adsorbent, at the “adsorption” pressure and the corresponding loading at the “desorption”, or 324
purge, pressure, here assumed to be 1 bar. The higher the working capacity is, the larger the 325
amount of feed that can be treated with a given amount of adsorbent within a given period of 326
time 3, 49, 50
. 327
The amount produced per kg of material or productivity is relevant for grass-roots design 328
of PSA units; this metric is directly a reflection of the adsorbent cost 51
. 329
Maximum values of CO2 working capacity and productivity are desired as a smaller 330
adsorbent bed volume would be then required. Therefore, capital and operating costs would 331
decrease. 332
16
In order to determine the pressure level for the adsorption stage, one should keep in mind 333
that the larger the difference between the capacities of the competing adsorbates, the purer the 334
raffinate will be. For a given separation, the product purity is predetermined and the size of the 335
adsorbent bed is inversely proportional to the adsorbent productivity. It is important to keep in 336
mind that these parameters are interrelated for any given PSA process 17
. 337
Design parameters. Discussion and implication for biogas upgrading. As we previously 338
mentioned, one of the parameters that we have taken into account to compare our materials is the 339
working capacity. The experimental working capacity of CO2 was obtained by calculating the 340
difference between the adsorbed amounts of CO2 under adsorption and desorption conditions 341
(here assumed to be 1 bar). The calculated values assuming adsorption pressures of 3, 5 and 10 342
bar are represented in Figure 5. As might be expected working capacity increases with pressure 343
and the highest values for the three adsorbents are obtained at 10 bar. This is in agreement with 344
the equilibrium adsorption capacities from static single component adsorption isotherms (Figure 345
3) and dynamic binary breakthrough tests (Table 3). At 10 bar it was observed previously that 346
the efficiency of the CO2/CH4 separation decreases and a great amount of CH4 is also co-347
adsorbed with CO2. Thus, this may not be the pressure that best suits the adsorption step in this 348
process and it will be discarded in following analysis. On the other hand, it is observed in Figure 349
5 that the working capacity of Calgon BPL is lower than that of CS-CO2 and CS-H2O. 350
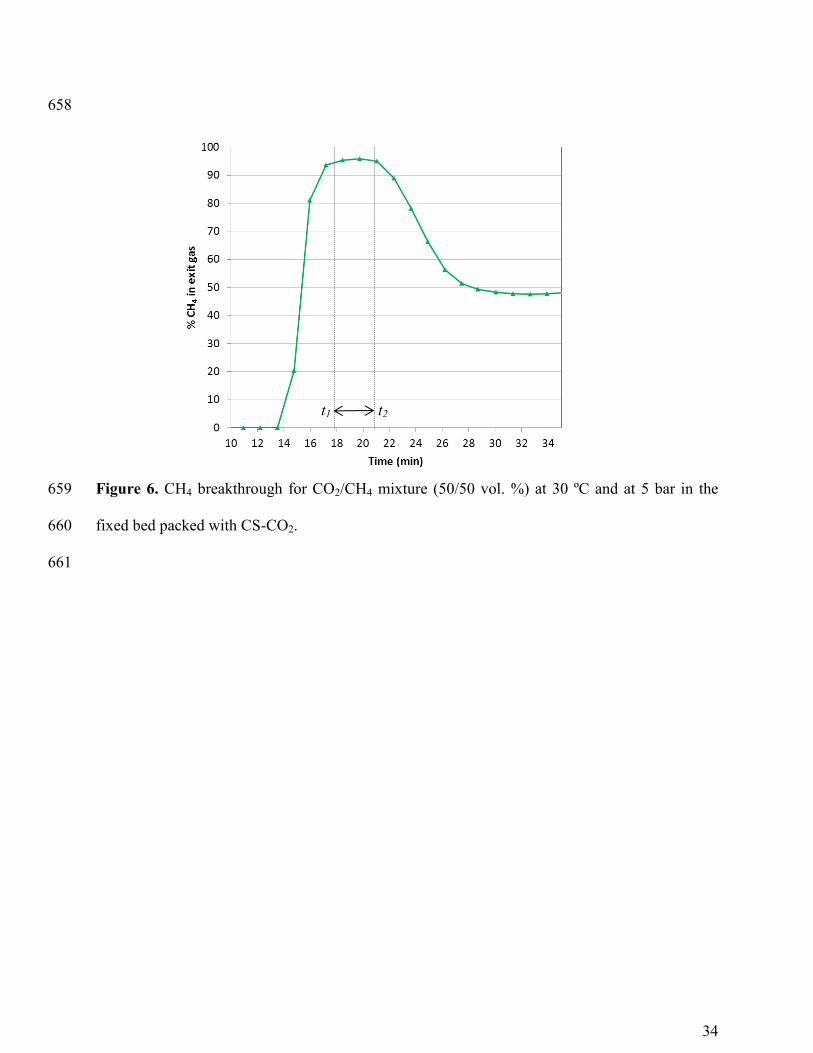
From the data presented in Figures 1a to 1c we can determine the amount of CH4 in the 351
exit gas stream. As illustration, Figure 6 shows the experimental breakthrough for CO2/CH4 352
mixture (50/50 vol. %) at 30 ºC and at 5 bar in the fixed bed packed with CS-CO2. The y-axis 353
represents the % CH4 in the exit gas stream. During the time interval between t1 and t2, CH4 can 354
be produced with a purity of approximately 95%. Thus the productivity of CH4, with the selected 355
17
95% purity level, can be estimated from a material balance by integrating the CH4 molar flow 356
rate profile in the outlet gas between the time interval t1 to t2, as follows: 357
𝐶𝐻4 𝑝𝑟𝑜𝑑𝑢𝑐𝑡𝑖𝑣𝑖𝑡𝑦 =1
𝑚𝑎𝑑𝑠 𝑡∫ 𝐹𝐶𝐻4,𝑒𝑥𝑖𝑡𝑑𝑡
𝑡2
𝑡1 (1) 358
where FCH4,exit is the molar flow rate of CH4 that exits the bed, mads is the mass of adsorbent 359
packed in the bed and t is the time interval (t2-t1) when CH4 leaves the bed at the selected purity 360
(~95%). Productivity, as estimated from Equation 1, is then reported in mol per kg of adsorbent 361
and unit of time. 362
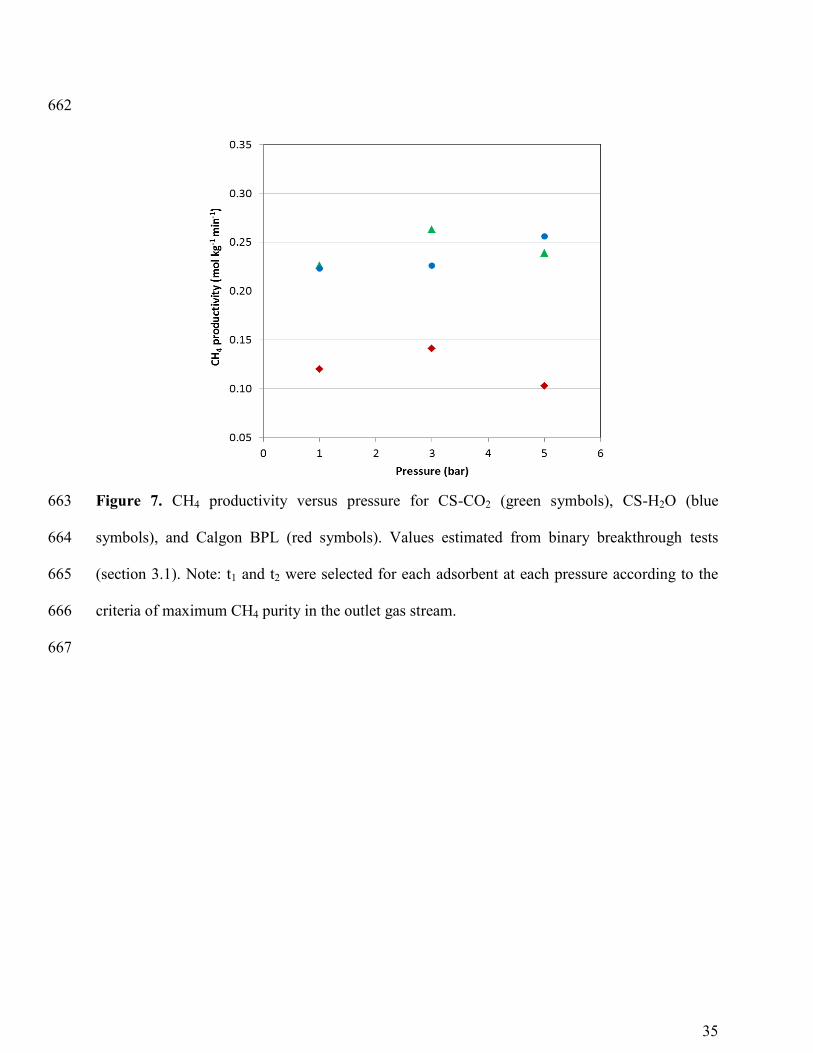
Figure 7 shows the amount of CH4 produced in the outlet stream, per kilogram of 363
adsorbent material and minute, versus pressure. There is not a direct correlation between the 364
productivity of CH4 and total pressure. However, it seems clear that Calgon BPL has 365
significantly lower productivities than our adsorbents. Maximum CH4 productivity of 0.26 mol 366
kg-1
min-1
is achieved for CS-CO2 and CS-H2O at 3 and 5 bar, respectively. 367
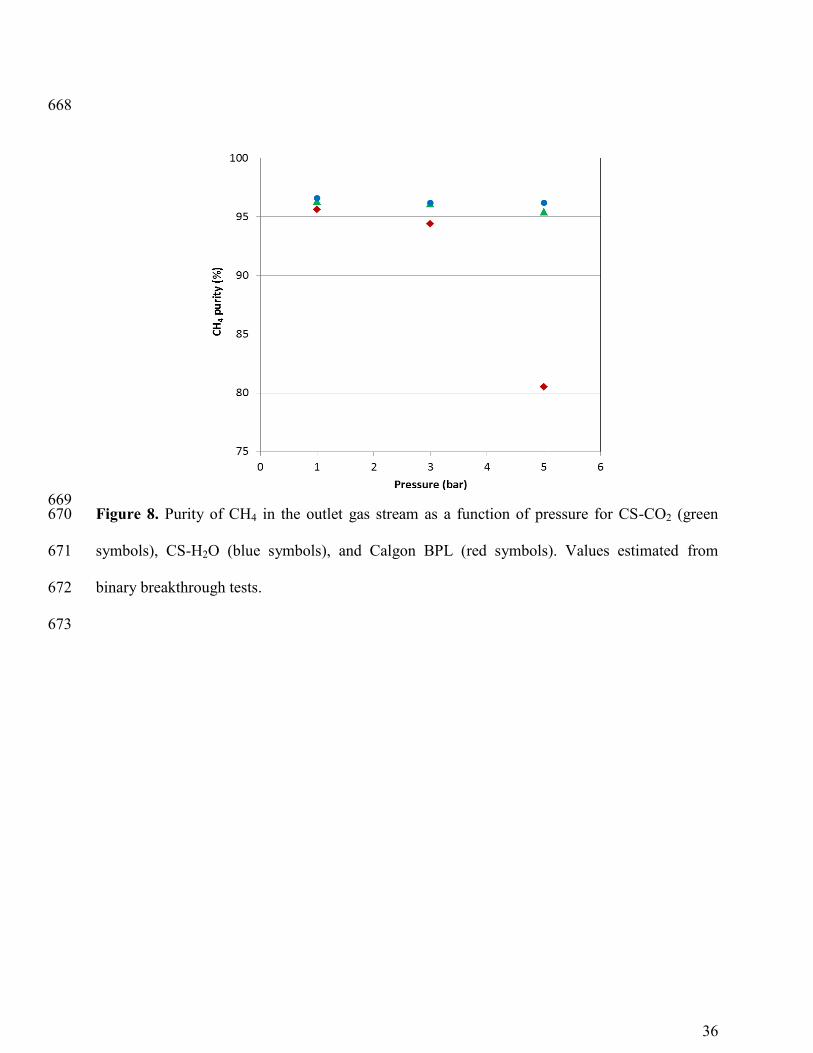
In Figure 8 the purity of CH4 in the outlet gas stream is presented as a function of the 368
total pressure in the breakthrough experiments for the three adsorbents. The concentration of 369
CH4 tends to decrease with increasing pressure and more remarkably for Calgon BPL, where the 370
concentration of CH4 is below 85% at 5 bar. However, the purity of CH4 in the outlet stream 371
remains practically constant (~ 95%) for carbon CS-H2O in the evaluated pressure range. 372
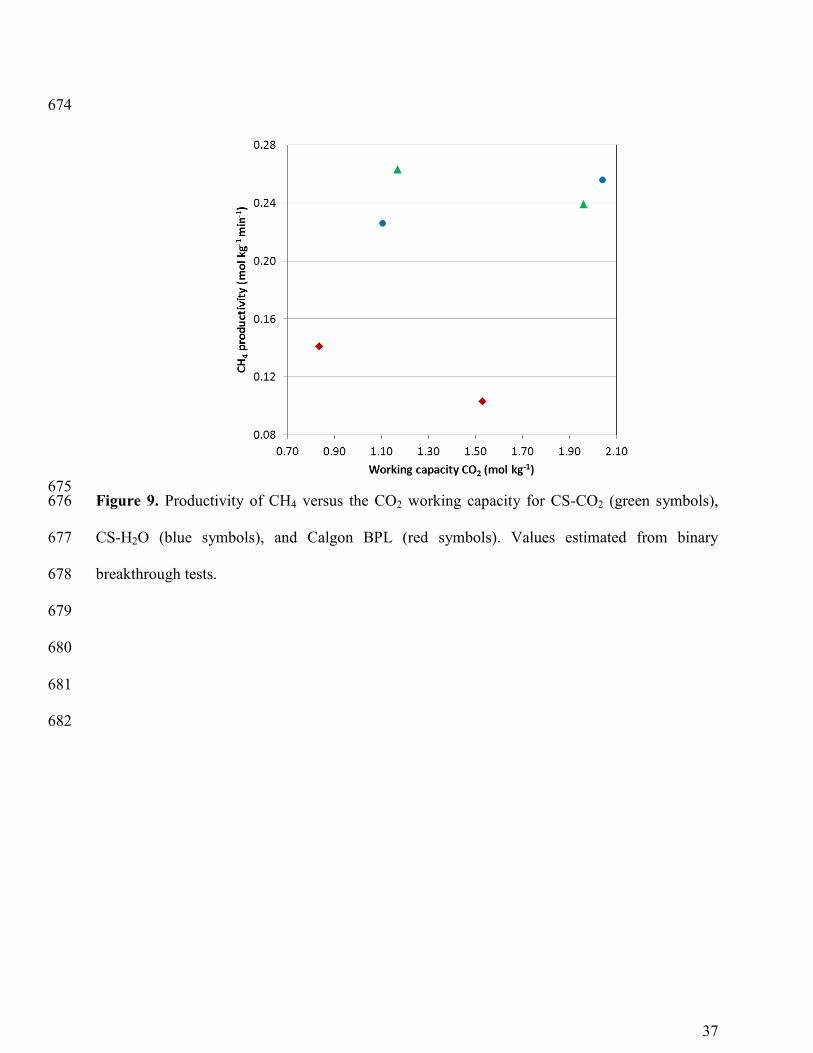
As mentioned above, maximum values of CO2 working capacity and CH4 productivity 373
must be sought since they are closely related to the size of the adsorber. Figure 9 shows CH4 374
productivity versus CO2 working capacity for the studied carbons. As can be observed, CH4 375
productivity slightly varies with CO2 working capacity for each carbon. Thus, maximum CO2 376
working capacity turns to be the prevailing criteria. For CS-CO2, and CS-H2O this condition is 377
achieved at the maximum pressure of 5 bar at which CO2/CH4 separation is still feasible. On the 378
18
other hand, Calgon BPL shows poor performance in terms of CH4 productivity and CO2 working 379
capacity when compared to our biomass based carbons. 380
The experimental results show that at a pressure of 5 bar the performance of CS-H2O is 381
slightly superior to that of CS-CO2. Despite the similar adsorption capacities on a mass basis of 382
both CS-carbons, CS-H2O shows slightly better breakthrough time, CO2 working capacity and 383
CH4 productivity and purity. Moreover, it shows enhanced adsorption capacity on a volumetric 384
basis which would allow reduced size of the required equipment. 385
In a previous work 35
we focused on the analysis of the equilibrium of adsorption of CO2 386
and CH4 from static gravimetric isotherms up to pressures of 10 bar. Despite the great 387
similarities of both CS-carbons in terms of adsorption capacities we identified CS-CO2 as 388
preferred adsorbent for the separation of CO2 from a CO2/CH4 mixture representative of a biogas 389
stream. That conclusion was based on the enhanced values of an adsorption performance 390
indicator that accounts for the selectivity, the working capacity and the isosteric heat of 391
adsorption of CO2. Herein, breakthrough tests were conducted under isothermal operation and so 392
heat effects on the adsorption performance of the adsorbents are deliberately avoided. Therefore, 393
comparison is not straightforward. However, in the aforementioned work it was also clearly 394
concluded that in terms of the selection parameter S (that accounts for the ratio of the working 395
capacities of the two gases and the equilibrium selectivity to CO2), CS-H2O was slightly superior 396
to CS-CO2. This is in good agreement with the isothermal breakthrough experiments carried out 397
in this work that also indicate that CS-H2O presents better performance for biogas upgrading at a 398
pressure of 5 bar. 399
400
19
CONCLUSIONS 401
Analysis of CO2 and CH4 co-adsorption on two biomass based activated carbon (CS-CO2 402
and CS-H2O) materials has been performed by means of dynamic breakthrough experiments in a 403
packed-bed. A commercial activated carbon Calgon BPL was also studied for comparison 404
purposes. 405
The evaluated adsorbents showed good cyclability and regenerability over consecutive 406
adsorption-desorption cycles. CO2/CH4 separation is feasible on CS-CO2 and CS-H2O according 407
to the difference in breakthrough time between CO2 and CH4. However, this ability is reduced 408
for Calgon BPL indicating that it is less selective than our carbons. 409
The adsorption pressure in a PSA process should be carefully chosen considering the 410
process performance. We have analyzed the purity and productivity of CH4 and the CO2 working 411
capacity from binary CO2/CH4 equimolar breakthrough tests conducted at 30ºC and varying 412
pressures. When adsorption pressure increases CO2 working capacities also increase. It is 413
observed that when adsorption pressure increases so does CO2 working capacity. However, at 10 414
bar the efficiency of the CO2/CH4 separation drastically decreases for the evaluated adsorbents. 415
CS-CO2 and CS-H2O have good adsorption capacities with measured CO2 working 416
capacities of 1.96 and 2.04 mol kg-1
for CS-CO2 and CS-H2O, respectively, when adsorbents are 417
cycled between 5 bar of adsorption pressure and 1 bar of regeneration pressure. Maximum CH4 418
productivities of 0.26 mol kg-1
min-1
are achieved for CS-CO2 and CS-H2O at 3 and 5 bar, 419
respectively. These values are higher than those of Calgon BPL (working capacity of CO2 in the 420
same conditions of 1.53 mol kg-1
and CH4 productivity of 0.15 mol kg-1
min-1
at 3 bar). On the 421
other hand, the purity of CH4 in the outlet stream for both biomass based activated carbons is 422
above 95%. whereas for Calgon BPL the purity of CH4 drastically decreases with pressure. 423
20
These values are higher than those of the commercial Calgon BPL. From the results presented it 424
can be concluded that our biomass based activated carbons, CS-CO2 and CS-H2O, are promising 425
adsorbents for CO2/CH4 separation operating at a pressure of 5 bar. 426
427
AUTHOR INFORMATION 428
Corresponding Author 429
*(C.P) Phone: +34 985 11 89 87 / 985 11 90 90 (Ext. 319). Fax: +34 985 29 76 62. Email: 430
[email protected]. 431
Author Contributions 432
The manuscript was written through contributions of all authors. All authors have given approval 433
to the final version of the manuscript. 434
Funding Sources 435
Project: ENE2011-23467 (Spanish MINECO) and GRUPIN14-079 Grant (Gobierno del 436
Principado de Asturias, Spain). 437
ACKNOWLEDGMENT 438
This work has received financial support from the Spanish MINECO (Project ENE2011-23467), 439
co-financed by the European Regional Development Fund (ERDF), and from the Gobierno del 440
Principado de Asturias (PCTI2013-2017, GRUPIN14-079). N.A-G. also acknowledges a 441
fellowship awarded by the Spanish MINECO (FPI program), and co-financed by the European 442
Social Fund. 443
444
445

21
REFERENCES 446
1. Commision, E., Directive 2009/28/EC of the European Parliament and of the Council of 447
23 April 2009 on the promotion of the use of energy from renewable sources and amending and 448
subsequently repealing Directives 2001/77/EC and 2003/30/EC. In Official Journal of the 449
European Union: 2009. 450
2. Research, P. Worldwide power generation capacity from biogas will double by 2022. . 451
http://www.businesswire.com/news/home/20121107005284/en/Worldwide-Power-Generation-452
Capacity-Biogas-Double-2022%20-.U3NpFViSwwk 453
3. Remy, T.; Gobechiya, E.; Danaci, D.; Peter, S. A.; Xiao, P.; Van Tendeloo, L.; Couck, S.; 454
Shang, J.; Kirschhock, C. E. A.; Singh, R. K.; Martens, J. A.; Baron, G. V.; Webley, P. A.; 455
Denayer, J. F. M., Biogas upgrading through kinetic separation of carbon dioxide and methane 456
over Rb- and Cs-ZK-5 zeolites. RSC Advances 2014, 4, (107), 62511-62524. 457
4. Ryckebosch, E.; Drouillon, M.; Vervaeren, H., Techniques for transformation of biogas 458
to biomethane. Biomass and Bioenergy 2011, 35, (5), 1633-1645. 459
5. Delgado, J. A.; Uguina, M. A.; Sotelo, J. L.; Ruíz, B.; Rosário, M., Carbon 460
Dioxide/Methane Separation by Adsorption on Sepiolite. Journal of Natural Gas Chemistry 461
2007, 16, (3), 235-243. 462
6. Petersson, A.; Welllinger, A. Biogas upgrading technologies-developments and 463
innovations; Task 37 - Energy from biogas and landfill gas: 2009. 464
7. Sarkar, S. C.; Bose, A., Role of activated carbon pellets in carbon dioxide removal. 465
Energy Conversion and Management 1997, 38, Supplement, S105-S110. 466
8. Horikawa, M. S.; Rossi, F.; Gimenes, M. L.; Costa, C. M. M.; Da Silva, M. G. C., 467
Chemical absorption of H2S for biogas purification. Brazilian Journal of Chemical Engineering 468
2004, 21, (3), 415-422. 469
9. Yeo, Z. Y.; Chew, T. L.; Zhu, P. W.; Mohamed, A. R.; Chai, S.-P., Conventional 470
processes and membrane technology for carbon dioxide removal from natural gas: A review. 471
Journal of Natural Gas Chemistry 2012, 21, (3), 282-298. 472
10. Tuinier, M. J.; van Sint Annaland, M., Biogas Purification Using Cryogenic Packed-Bed 473
Technology. Industrial & Engineering Chemistry Research 2012, 51, (15), 5552-5558. 474
11. Grande, C. A., Biogas Upgrading by Pressure Swing Adsorption In Biofuel's Engineering 475
Process Technology, Bernardes, M. A. D. S., Ed. InTech: 2011; pp 65-84. 476
12. Kim, S.; Kim, J.; Moon, I., Profit optimization for bio-gas upgrading PSA process based 477
on controlling step-time. In Computer Aided Chemical Engineering, 2013; Vol. 32, pp 397-402. 478
13. Grande, C. A.; Rodrigues, A. E., Layered vacuum pressure-swing adsorption for biogas 479
upgrading. Industrial and Engineering Chemistry Research 2007, 46, (23), 7844-7848. 480
14. Peter, S. A.; Baron, G. V.; Gascon, J.; Kapteijn, F.; Denayer, J. F. M., Dynamic 481
desorption of CO2 and CH4 from amino-MIL-53(Al) adsorbent. Adsorption 2013, 19, (6), 1235-482
1244. 483
15. Sircar, S., Separation of Methane and Carbon Dioxide Gas Mixtures by Pressure Swing 484
Adsorption. Separation Science and Technology 1988, 23, (6-7), 519-529. 485
16. Kim, M.-B.; Bae, Y.-S.; Choi, D.-K.; Lee, C.-H., Kinetic Separation of Landfill Gas by a 486
Two-Bed Pressure Swing Adsorption Process Packed with Carbon Molecular Sieve: 487
Nonisothermal Operation. Industrial & Engineering Chemistry Research 2006, 45, (14), 5050-488
5058. 489
22
17. Yanh, R. T., Adsorbents. Funtamentals and applications. . John Wiley & Sons: New 490
Jersey, 2003. 491
18. Cavenati, S.; Grande, C. A.; Rodrigues, A. E., Removal of carbon dioxide from natural 492
gas by vacuum pressure swing adsorption. Energy & Fuels 2006, 20, (6), 2648-2659. 493
19. Kapoor, A.; Yang, R. T., Kinetic separation of methane-carbon dioxide mixture by 494
adsorption on molecular sieve carbon. Chemical Engineering Science 1989, 44, (8), 1723-1733. 495
20. Alonso-Vicario, A.; Ochoa-Gómez, J. R.; Gil-Río, S.; Gómez-Jiménez-Aberasturi, O.; 496
Ramírez-López, C. A.; Torrecilla-Soria, J.; Domínguez, A., Purification and upgrading of biogas 497
by pressure swing adsorption on synthetic and natural zeolites. Microporous and Mesoporous 498
Materials 2010, 134, (1-3), 100-107. 499
21. Cavenati, S.; Grande, C. A.; Rodrigues, A. E., Upgrade of Methane from Landfill Gas by 500
Pressure Swing Adsorption. Energy & Fuels 2005, 19, (6), 2545-2555. 501
22. Cavenati, S.; Grande, C. A.; Rodrigues, A. E., Adsorption Equilibrium of Methane, 502
Carbon Dioxide, and Nitrogen on Zeolite 13X at High Pressures. Journal of Chemical and 503
Engineering Data 2004, 49, (4), 1095-1101. 504
23. Leyssale, J. M.; Papadopoulos, G. K.; Theodorou, D. N., Sorption thermodynamics of 505
CO2, CH4, and their mixtures in the ITQ-1 zeolite as revealed by molecular simulations. Journal 506
of Physical Chemistry B 2006, 110, (45), 22742-22753. 507
24. Babarao, R.; Hu, Z.; Jiang, J.; Chempath, S.; Sandler, S. I., Storage and separation of CO2 508
and CH4 in silicalite, C168 schwarzite, and IRMOF-1: A comparative study from Monte Carlo 509
simulation. Langmuir 2007, 23, (2), 659-666. 510
25. Bae, Y.-S.; Mulfort, K. L.; Frost, H.; Ryan, P.; Punnathanam, S.; Broadbelt, L. J.; Hupp, 511
J. T.; Snurr, R. Q., Separation of CO2 from CH4 Using Mixed-Ligand Metal−Organic 512
Frameworks. Langmuir 2008, 24, (16), 8592-8598. 513
26. Barcia, P. S.; Bastin, L.; Hurtado, E. J.; Silva, J. A. C.; Rodrigues, A. E.; Chen, B., Single 514
and multicomponent sorption of CO2, CH4 and N2 in a microporous metal-organic framework. 515
Separation Science and Technology 2008, 43, (13), 3494-3521. 516
27. Liang, Z.; Marshall, M.; Chaffee, A. L., CO2 Adsorption-Based Separation by Metal 517
Organic Framework (Cu-BTC) versus Zeolite (13X). Energy & Fuels 2009, 23, (5), 2785-2789. 518
28. Peng, X.; Wang, W. C.; Xue, R. S.; Shen, Z. M., Adsorption separation of CH4/CO2 on 519
mesocarbon microbeads: Experiment and modeling. AIChE Journal 2006, 52, (3), 994-1003. 520
29. Goetz, V.; Pupier, O.; Guillot, A., Carbon dioxide-methane mixture adsorption on 521
activated carbon. Adsorption 2006, 12, (1), 55-63. 522
30. Bazan, R. E.; Bastos-Neto, M.; Staudt, R.; Papp, H.; Azevedo, D. C. S.; Cavalcante Jr, C. 523
L., Adsorption equilibria of natural gas components on activated carbon: Pure and mixed gas 524
isotherms. Adsorption Science and Technology 2008, 26, (5), 323-332. 525
31. Santos, M. P. S.; Grande, C. A.; Rodrigues, A. E., Dynamic study of the pressure swing 526
adsorption process for biogas upgrading and its responses to feed disturbances. Industrial & 527
Engineering Chemistry Research 2013, 52, (15), 5445-5454. 528
32. Son, S.-J.; Choi, J.-S.; Choo, K.-Y.; Song, S.-D.; Vijayalakshmi, S.; Kim, T.-H., 529
Development of carbon dioxide adsorbents using carbon materials prepared from coconut shell. 530
Korean Journal of Chemical Engineering 22, (2), 291-297. 531
33. Sun, Y.; Webley, P. A., Preparation of activated carbons with large specific surface areas 532
from biomass corncob and their adsorption equilibrium for methane, carbon dioxide, nitrogen, 533
and hydrogen. Industrial & Engineering Chemistry Research 2011, 50, (15), 9286-9294. 534
23
34. Banisheykholeslami, F.; Ghoreyshi, A. A.; Mohammadi, M.; Pirzadeh, K., Synthesis of a 535
carbon molecular sieve from broom corn stalk via carbon deposition of methane for the selective 536
separation of a CO2/CH4 mixture. Clean - Soil, Air, Water 2015, 43, (7), 1084-1092. 537
35. Álvarez-Gutiérrez, N.; Gil, M. V.; Rubiera, F.; Pevida, C., Adsorption performance 538
indicators for the CO2/CH4 separation: Application to biomass-based activated carbons. Fuel 539
Processing Technology 2016, 142, 361-369. 540
36. Álvarez-Gutiérrez, N.; Gil, M. V.; Rubiera, F.; Pevida, C., Cherry-stones-based activated 541
carbons as potential adsorbents for CO2/CH4 separation: effect of the activation parameters. 542
Greenhouse Gases: Science and Technology 2015, 5, (6), 812-825. 543
37. Gil, M. V.; Álvarez-Gutiérrez, N.; Martínez, M.; Rubiera, F.; Pevida, C.; Morán, A., 544
Carbon adsorbents for CO2 capture from bio-hydrogen and biogas streams: Breakthrough 545
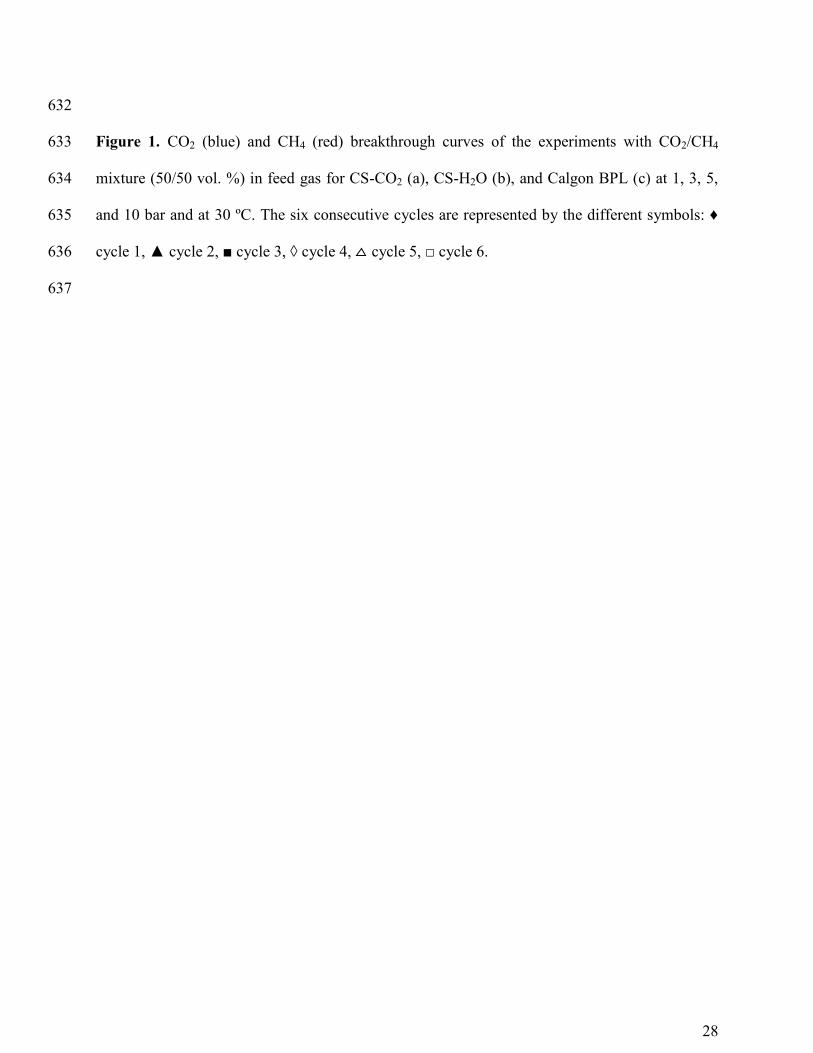
adsorption study. Chemical Engineering Journal 2015, 269, 148-158. 546
38. García, S.; Pis, J. J.; Rubiera, F.; Pevida, C., Predicting mixed-gas adsorption equilibria 547
on activated carbon for precombustion CO2 capture. Langmuir 2013, 29, (20), 6042-6052. 548
39. García, S.; Gil, M. V.; Martín, C. F.; Pis, J. J.; Rubiera, F.; Pevida, C., Breakthrough 549
adsorption study of a commercial activated carbon for pre-combustion CO2 capture. Chemical 550
Engineering Journal 2011, 171, (2), 549-556. 551
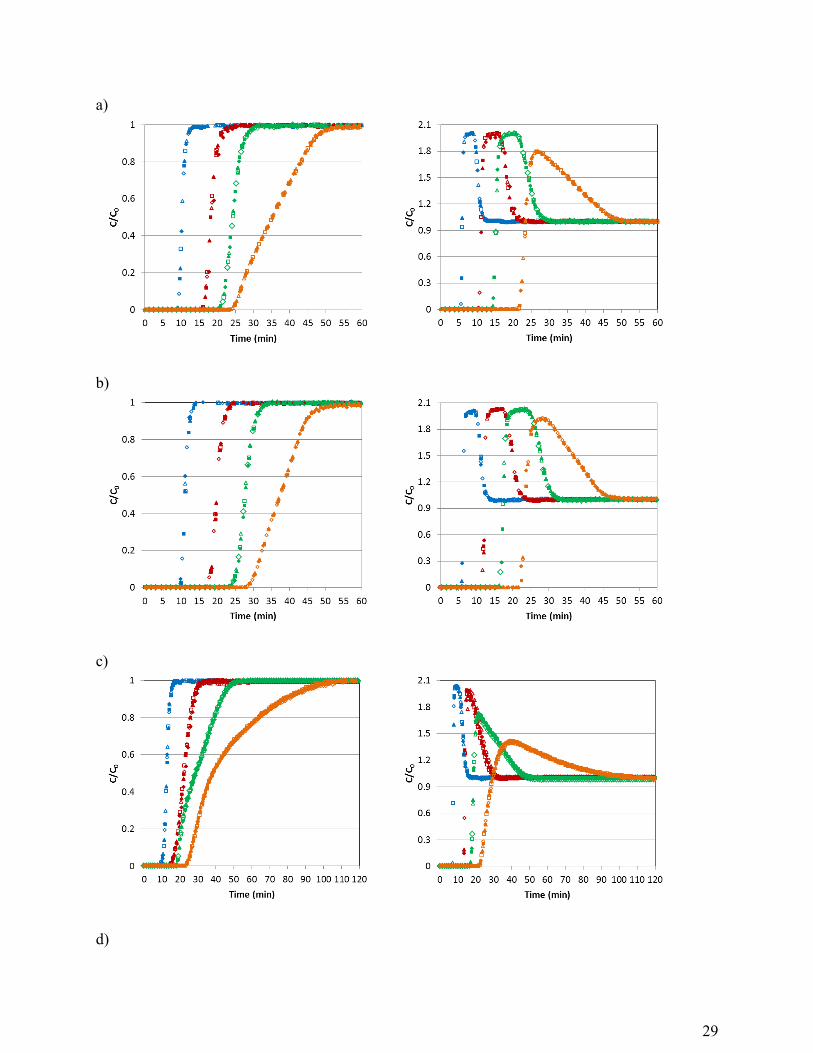
40. Ruthven, D. M.; Farooq, S.; Knaebel, K. S., Pressure Swing Adsorption. VCH 552
Publishers: New York, 1994. 553
41. Finsy, V.; Ma, L.; Alaerts, L.; De Vos, D. E.; Baron, G. V.; Denayer, J. F. M., Separation 554
of CO2/CH4 mixtures with the MIL-53(Al) metal–organic framework. Microporous and 555
Mesoporous Materials 2009, 120, (3), 221-227. 556
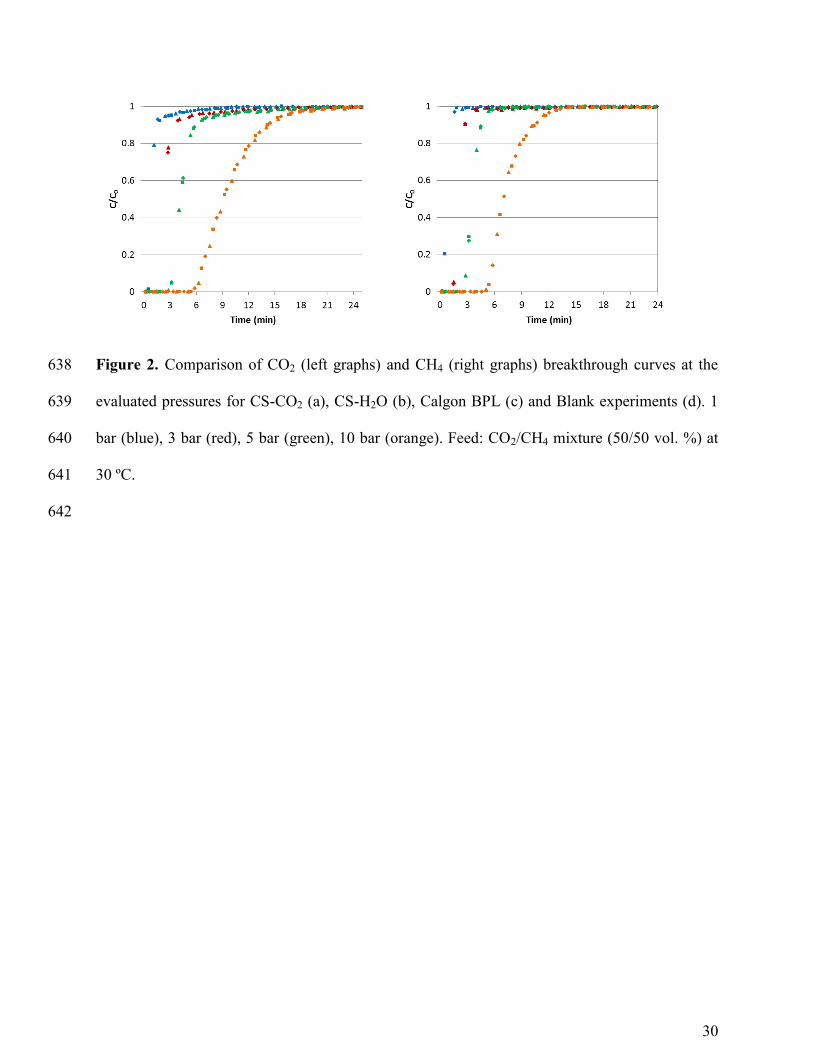
42. Pirngruber, G. D.; Hamon, L.; Bourrelly, S.; Llewellyn, P. L.; Lenoir, E.; Guillerm, V.; 557
Serre, C.; Devic, T., A method for screening the potential of MOFs as CO2 adsorbents in 558
pressure swing adsorption processes. ChemSusChem 2012, 5, (4), 762-776. 559
43. McCabe, W. L.; Smith, J. C.; Harriott, P., Unit operations of chemical engineering. 560
Seventh ed.; Mc Graw-Hill: 2005. 561
44. Martín, C. F.; García, S.; Beneroso, D.; Pis, J. J.; Rubiera, F.; Pevida, C., Precombustion 562
CO2 capture by means of phenol–formaldehyde resin-derived carbons: From equilibrium to 563
dynamic conditions. Separation and Purification Technology 2012, 98, 531-538. 564
45. Martín, C. F.; Stöckel, E.; Clowes, R.; Adams, D. J.; Cooper, A. I.; Pis, J. J.; Rubiera, F.; 565
Pevida, C., Hypercrosslinked organic polymer networks as potential adsorbents for pre-566
combustion CO2 capture. Journal of Materials Chemistry 2011, 21, (14), 5475-5483. 567
46. Martín, C. F.; Plaza, M. G.; Pis, J. J.; Rubiera, F.; Pevida, C.; Centeno, T. A., On the 568
limits of CO2 capture capacity of carbons. Separation and Purification Technology 2010, 74, (2), 569
225-229. 570
47. Wiersum, A. D.; Giovannangeli, C.; Vincent, D.; Bloch, E.; Reinsch, H.; Stock, N.; Lee, 571
J. S.; Chang, J. S.; Llewellyn, P. L., Experimental screening of porous materials for high pressure 572
gas adsorption and evaluation in gas separations: Application to MOFs (MIL-100 and CAU-10). 573
ACS Combinatorial Science 2013, 15, (2), 111-119. 574
48. Yu, H.; Wang, X.; Xu, C.; Chen, D. L.; Zhu, W.; Krishna, R., Utilizing transient 575
breakthroughs for evaluating the potential of Kureha carbon for CO2 capture. Chemical 576
Engineering Journal 2015, 269, 135-147. 577
49. Kumar, R., Pressure Swing Adsorption Process: Performance Optimum and Adsorbent 578
Selection. Industrial & Engineering Chemistry Research 1994, 33, (6), 1600-1605. 579
24
50. Krishna, R., Adsorptive separation of CO2/CH4/CO gas mixtures at high pressures. 580
Microporous and Mesoporous Materials 2012, 156, (0), 217-223. 581
51. Wu, H.; Yao, K.; Zhu, Y.; Li, B.; Shi, Z.; Krishna, R.; Li, J., Cu-TDPAT, an rht-type 582
dual-functional metal–organic framework Offering significant potential for use in H2 and natural 583
gas purification processes operating at high pressures. The Journal of Physical Chemistry C 584
2012, 116, (31), 16609-16618. 585
586
587
588
589
590
591
592
593
594
595
596
597
598
599
600
601
602
603
604
605
606
607
608
609
25
TABLES 610
Table 1. Physical properties of the activated carbons 611
Activated carbon
CS-CO2 CS-H2O Calgon BPL
BET surface area (m2 g
-1) 1045 998 1129
Total pore volume (cm3 g
-1) 0.48 0.53 0.50
Micropore volume (cm3 g
-1)a 0.40 0.38 0.46
Average micropore width (nm)b 0.93 0.89 1.40
Narrow Micropore volume (cm3 g
-1)a 0.35 0.33 0.22
Average narrow micropore width (nm)b 0.78 0.74 0.70
a Evaluated with the Dubinin-Radushkevich equation. 612
b Determined with the Stoeckli-Ballerini relation. 613
614
615
616
Table 2. Characteristics of the adsorbent beds 617
Activated carbon
CS-CO2 CS-H2O Calgon BPL
Mass of adsorbent (g) 4.10 4.80 7.00
Particle size (mm) 1-3 1-3 2-4.75
Total porosity, εT 0.86 0.84 0.79
Helium density (g cm-3
)a 1.98 1.99 2.10
Apparent density (g cm-3
)b 0.53 0.64 0.83
Bed diameter (cm) 1.30 1.30 1.30
Bed height (cm) 11.55 11.65 11.90
Bed density (g cm-3
) 0.27 0.31 0.44 a Determined by He pycnometry. 618
b Determined with Hg porosimetry at 1 bar. 619
620
621
622
26
623 Table 3. Adsorbed amounts for breakthrough measurements of a simulated biogas CO2/CH4 624
mixture (50/50 vol. %) at 30 ºC and different pressures on CS-CO2, CS-H2O, and Calgon BPL. 625
CO2 adsorption capacity CH4 adsorption capacity
Adsorbent (mol kg-1
) (mol m-3
) (mol kg-1
) (mol m-3
)
1 bar
CS-CO2 1.63 440.1 0.47 126.9
CS-H2O 1.49 461.9 0.37 114.7
Calgon BPL 1.18 519.2 0.33 145.2
3 bar
CS-CO2 2.80 756.0 0.67 180.9
CS-H2O 2.60 806.0 0.64 198.4
Calgon BPL 2.02 888.8 0.53 233.2
5 bar
CS-CO2 3.60 972.0 0.95 256.5
CS-H2O 3.53 1094.3 0.76 235.6
Calgon BPL 2.70 1188.0 0.81 356.4
10 bar
CS-CO2 5.14 1387.8 1.55 418.5
CS-H2O 4.48 1388.8 1.05 325.5
Calgon BPL 4.14 1821.6 1.30 572.0
626
627
628
629
630
27
FIGURES 631
a)
b)
c)
1 bar 1 bar 1 bar
3 bar 3 bar 3 bar
5 bar 5 bar 5 bar
10 bar 10 bar 10 bar
28
632
Figure 1. CO2 (blue) and CH4 (red) breakthrough curves of the experiments with CO2/CH4 633
mixture (50/50 vol. %) in feed gas for CS-CO2 (a), CS-H2O (b), and Calgon BPL (c) at 1, 3, 5, 634
and 10 bar and at 30 ºC. The six consecutive cycles are represented by the different symbols: ♦ 635
cycle 1, ▲ cycle 2, ■ cycle 3, ◊ cycle 4, cycle 5, □ cycle 6. 636
637
29
a)
b)
c)
d)
30
Figure 2. Comparison of CO2 (left graphs) and CH4 (right graphs) breakthrough curves at the 638
evaluated pressures for CS-CO2 (a), CS-H2O (b), Calgon BPL (c) and Blank experiments (d). 1 639
bar (blue), 3 bar (red), 5 bar (green), 10 bar (orange). Feed: CO2/CH4 mixture (50/50 vol. %) at 640
30 ºC. 641
642
31
643
a)
b)
Figure 3. Adsorption isotherms at 30 ºC and up to 10 bar of CO2 (a) and CH4 (b) on CS-CO2 644
(green colour), CS-H2O (blue colour), and Calgon-BPL (red colour). 645
646
32
647
648 Figure 4. CO2 (full symbols) and CH4 (open symbols) breakthrough timesas a function of 649
pressure: CS-CO2 (green colour), CS-H2O (blue colour), and Calgon BPL (red colour). Feed: 650
CO2/CH4 mixture (50/50 vol. %) at 30 ºC. 651
652
33
653
Figure 5. Working capacity of CO2 as a function of pressure for CS-CO2 (green colour), CS-654
H2O (blue colour), and Calgon BPL (red colour). Values estimated from binary breakthrough 655
tests. 656
657
34
658
Figure 6. CH4 breakthrough for CO2/CH4 mixture (50/50 vol. %) at 30 ºC and at 5 bar in the 659
fixed bed packed with CS-CO2. 660
661
t1 t2
35
662
Figure 7. CH4 productivity versus pressure for CS-CO2 (green symbols), CS-H2O (blue 663
symbols), and Calgon BPL (red symbols). Values estimated from binary breakthrough tests 664
(section 3.1). Note: t1 and t2 were selected for each adsorbent at each pressure according to the 665
criteria of maximum CH4 purity in the outlet gas stream. 666
667
36
668
669 Figure 8. Purity of CH4 in the outlet gas stream as a function of pressure for CS-CO2 (green 670
symbols), CS-H2O (blue symbols), and Calgon BPL (red symbols). Values estimated from 671
binary breakthrough tests. 672
673
37
674
675 Figure 9. Productivity of CH4 versus the CO2 working capacity for CS-CO2 (green symbols), 676
CS-H2O (blue symbols), and Calgon BPL (red symbols). Values estimated from binary 677
breakthrough tests. 678
679
680
681
682