Dynamic Overturning Loads on Drilled Shaft Footings · PDF fileDYNAMIC OVERTURNING LOADS ON...
56
DYNAMIC OVERTURNING LOADS ON DRILLED SHAFT FOOTINGS USED FOR MINOR SERVICE STRUCTURES By Harry L. Smith Wayne A. Dunlap and Don L. Ivey Research Report Number 105-4 Design of Footings for Minor Service Structures Research Study Number 2-5-67-105 Sponsored by THE TEXAS HIGHWAY DEPARTMENT in cooperation with The U.S. Department of Transportation Federal Highway Administration Bureau of Public Roads January 1970 TEXAS TRANSPORTATION INSTITUTE Texas A&M University College Station, Texas
Transcript of Dynamic Overturning Loads on Drilled Shaft Footings · PDF fileDYNAMIC OVERTURNING LOADS ON...

DYNAMIC OVERTURNING LOADS ON DRILLED SHAFT FOOTINGS
USED FOR MINOR SERVICE STRUCTURES
By
Harry L. Smith
Wayne A. Dunlap
and
Don L. Ivey
Research Report Number 105-4
Design of Footings for Minor Service Structures
Research Study Number 2-5-67-105
Sponsored by
THE TEXAS HIGHWAY DEPARTMENT
in cooperation with
The U.S. Department of Transportation
Federal Highway Administration
Bureau of Public Roads
January 1970
TEXAS TRANSPORTATION INSTITUTE
Texas A&M University
College Station, Texas


ACKNOWLEDGEMENTS
The research was conducted under an interagency contract between
the Texas Transportation Institute and the Texas Highway Department.
Joint sponsorship was held by the Texas Highway Department and the
Bureau of Public Roads. Liaison was maintained through Mr. D. L. Hawkins
and Mr. H. D. Butler, contact representatives for the Texas Highway
Department, and through Mr~ Robert T. Prochaska of the Bureau of Public
Roads.
The opinions, findings, and conclusions expressed in this report
are those of the authors and not necessarily those of the Bureau of
Public Roads.
ii


SUMMARY
A theory which will predict the ultimate resistance of a drilled
shaft footing to overturning loads was presented in Research Report
105-1 and was correlated with model tests as reported in Research Report
105-2. In Research Report 105-3, the results of full-scale tests on
drilled shaft footings were presented and compared to a "Tentative
Design Procedure" based on the previously published theory. Design
curves which allow easy application of the theory were given as a part
of the design procedure.
This paper gives the results of ten model tests of drilled shaft
footings subjected to dynamic loads. These tests show that the footing
rotations to be expected from dynamic loads are less than the rotations
resulting from static loads of the same value. Footing rotations due
to repeated dynamic loads did not exceed one degree for load intensities*
of less than 50% of the maximum static pullover load for less than
10,000 repetitions of load.
* The ratio of the dynamic repeated load to the 5° rotation static load, expressed as a percentage.
iii


ABSTRACT
Ten model tests of drilled shaft footings subjected to dynamic
overturning loads were performed. Compared to the average size footing
used for minor service structures in Texas, the model footings were
reduced by a factor of six. The footing reactions were investigated
in a cohesionless sand, a laboratory sandy clay, and a laboratory
clayey sand.
The results of the dynamic model footing tests were compared with
the results obtained from the theory developed earlier in this study
for determining static pullover loads. It was found that the footing
resistance to single dynamic loads exceeded the static pullover resis
tance predicted by the theory. Footing rotations due to repeated
dynamic loads-did not exceed 1° degree for 10,000 repetitions of dynamic
load, with the further limitation that the repeated load was less than
50% of the static pullover load.
IMPLEMENTATION
An implementation statement for this research is included in
Research Report 105-3, "Design Procedure Compared to Full-Scale Tests
of Drilled Shaft Footings."
iv

TABLE OF CONTENTS
INTRODUCTION
EQUIPMENT AND INSTRUMENTATION
General •
Loading System
Dynamic Load Measurement
Rotation Measurement
PLACEMENT OF FOOTINGS AND SOIL CONDITIONS
Ottawa Sand
Laboratory Sand-Clay Mixtures
TESTING PROGRAM
Sand Tests
Sand-Clay Mixtures
Sand-Clay Mixtures, Rapid Pullover Tests
TESTING RESULTS AND DISCUSSION •
CONCLUSION
SELECTED REFERENCES
APPENDIX A •
APPENDIX B
v
Page
1
3
3
3
5
5
5
5
6
9
11
11
11
14
22
23
24
31

INTRODUCTION
The objective of this study was to develop design procedures for
the foundations of structures such as sign boards, strain poles, and
lighting supports with factors of safety appropriate to the relative
importance of the structure. A series of reports on individual phases
1* of this study have already been published. The first report, 105-1 ,
"Theory, Resistance of a Drilled Shaft Footing to Overturning Loads,"
disclosed in detail the theoretical development of the new load predic
tion equations. Research Report 105-22
, "Resistance of a Drilled
Shaft Footing to Overturning Loads, Model Tests and Correlation with
Theory," showed that the conventional methods of predicting ultimate
overturning loads were conservative by as much as 500% for cohesionless
sands to 20% for clays. The most recent publication, "Design Procedure
Compared to Full-Scale Tests of Drilled Shaft Footings,"3 gave the
necessary design curves to apply the new design procedure.
Current design procedures for footings of minor service structures
do not treat dynamic forces separately, thus implying that the effect
of these forces is the same as the effect of static forces. Until
this study, testing to support the above assumption had not been per-
formed. The soils used in this dynamic testing. phase are a cohesionless
sand, a laboratory sandy clay, and a laboratory clayey sand. These
tests on 4-inch diameter by 12-inch deep model footings show the footing
* Superscript numbers refer to corresponding number in Selected References.
1

rotations that may be expected under repeated dynamic loads and that
footing movements due to single dynamic loads are less than the movements
under static loads of the same magnitude.
2

EQUIPMENT AND INSTRUMENTATION
GeneraZ
Dynamic load testing of model footings required systems capable
of (1) dynamic load application, (2) dynamic load measurement at
desired intervals, and (3) measurement of rotations.
Loading System
The dynamic testing program was accomplished using a Gilmore servo-
actuated testing machine. Placed in a horizontal position, the loading
frame of the testing machine was positioned to apply a horizontal load
to the model footings as shown in Figure 1. On one end of the Gilmore
loading frame was a hydraulic actuator shaft extending to the inside
of the frame. The shaft applied a cyclic loading which was set on the
Gilmore controls. A Gilmore load transducer which controlled the load
on the footing servomechanically was attached to the end of the shaft.
A second independent load transducer (Instron CT) was attached to, and
in series with, the Gilmore load transducer to measure the actual load.
A cable was connected between the Instron load transducer and the steel
pipe which projected from the top of the footing. The cable connected
to the pipe at a point 24 inches above the surface of the soil.
* The frequency of the load cycle was 0.1, 0.5, 1, and 2 Hertz for
the Ottawa sand tests and 1 Hertz under various load conditions for the
laboratory sand-clay mixtures.
* Cycles per second.
3

LOADING CABLE
SOIL BIN
Figure 1. Dynamic Testing System.
Figure 2. Dynamic Test Recording Equipment.
4

V yna.m.<..c. Loa.d M e.M Wteme.nt
The Instron load transducer was calibrated for ranges from 0-100
lbs.and 0-200 lbs. tensile load, depending on the maximum load expected
for a given test. The output voltage of the load transducer was amplified
and recorded on a Honeywell Visicorder, giving a visual record of the
load pattern that was applied to the model.
Ro.ta;Uon Me.Mwr.eme.n.t
The positions of the model footings during the dynamic load appli-
cations were measured by recording the displacement of the steel pipe
attached to the top of each footing. The pipe was screwed onto a 3/4-
inch diameter threaded rod extending from the top of the concrete foot-
ings. Linear displacement transducers were connected to the pipe 24
5/16 inches and 3 1/2 inches above the top of the footings, respectively.
The output voltages from the linear displacement transducers were
amplified and recorded on the Visicorder (see Figure 2).
PLACEMENT OF FOOTINGS AND SOIL CONDITIONS
O.t.ta.v.x:t Sa.nd
To conduct tests in a soil in which zero cohesion existed, 20-30
mesh Ottawa sand was used. The test apparatus included a reinforced
concrete bin, 24 inches wide by 36 inches long, having an inside depth
of 18 inches. This bin was placed inside the Gilmore loading frame and
secured to the loading frame. The sand was then placed in the hin
2 according to the procedure described in Research Report 105-2 and the
5

dense condition (e = 0.51) obtained by use of a portable concrete vibrator.
Sand parameters were taken from Research Report Number 105-2 as 37° for
the angle of internal friction and 109 pcf unit weight.
La.bo!Wvtotr..y Sa.n.d-C.ta.y M-i.x.twteo
To provide a basis for correlation with previous tests, laboratory
sand-clay mixtures were constructed using the same procedures as described
in Research Report 105-2. Trinity Clay in powdered form was mixed in a
counter current mixer with a concrete sand. Water was added giving the
soil properties shown in Table 1.
Four of the reinforced concrete bins were constructed. The insides
\vere sprayed with an acrylic plastic to prevent loss of moisture through
the concrete walls. The clay mixtures were placed in 4-inch-thick loose
layers in the bins and a uniform compactive effort was applied to each
layer by a pneumatic hammer as described in Research Report 105-2.
After each compacted bin was completed, the exposed soil surface
was covered with a thin layer of grease and overlaid with a thin sheet
of plastic to prevent loss of soil moisture. With the clay mixtures
in place and airtight covers applied, the bins were allowed to stand
0 for 14 days in a constant humidity environment at 72 F. During this
4-6 time, the soil was expected to gain in strength due to thixotropy.
Thixotropy may be simply described as an aging process in remolded
soil at a constant volume-water content, resulting in an increase in strength.
To install the footings, 4-inch diameter holes were drilled with a
2 special flat-bottomed auger. The cavities were right circular cylinders,
6

TABLE 1
COMPOSITION OF SAND CLAY MIXTURES
In Place
Test % Sand % Clay Water Content Unit Weight
Number by Weight by Weight (%) (pcf)
7 67 33 12.6 138.9
8 67 33 12.6 137.9
9 33 67 16.1 132.1
10 33 67 15.7 134.5
7

TABLE 2
ENGINEERING PROPERTIES OF SAND CLAY MIXTURES
Angle of Internal
Test Cohesion Friction
Number (psf) (degrees)
7 390 2.7
8 580 0
9 1600 0.75
10 1790 2.7
8

12 inches deep. Steel re-bar cages were attached to the 3/4-inch threaded
bolt and placed in the holes. After filling the holes with cement mortar
made from Type III cement and 20-30 Ottawa sand, the steel cages were
vibrated with a portable vibrator to eliminate air bubbles and voids.
An additional 14 days were allowed to elapse before -th~ fu-<Jt-tn.gs were- -
tested, in order to provide sufficient time for the mortar to cure.
After the footings were tested, as described below, several soil
samples were taken from each bin with a thin-walled core cutter. The
core cutter was pushed into the soil by hand and then trimmed out with
a knife, producing samples 1.425 inches in diameter and 3.0 inches long.
After extruding the specimens from the cutter, unconsolidated, undrained
triaxial compression tests were performed yielding the soil parameters
shown in Table 2.
It should be noted at this point that while only one bin of each
mixture was necessary for the testing program, replicate bin specimens
were made in case of machine malfunction or other difficulties which
might make a particular test questionable. Since no difficulties were
encountered in the repetitive load tests, the two additional samples
were used for rapid pullover tests. The results of these tests are
included in this report.
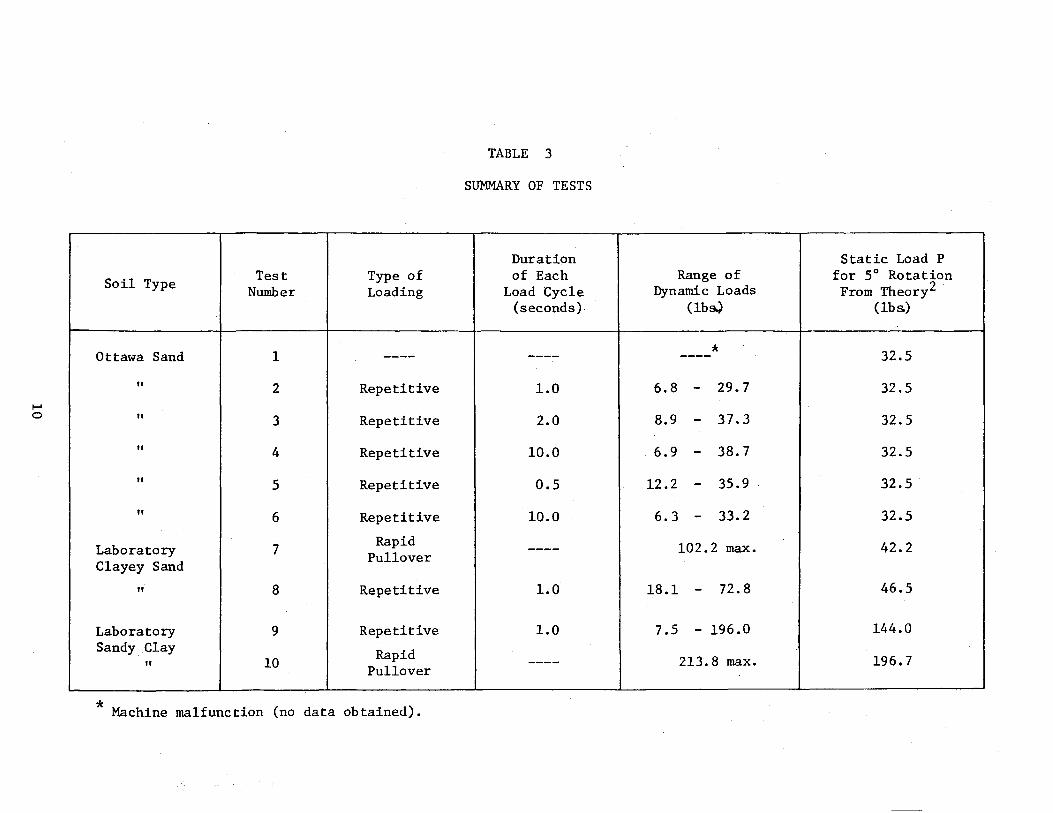
TESTING PROGIW1
The model footing tests which were conducted in sand and sand-clay
mixtures are summarized by Table 3. The duration of each load cycle
was held constant for each individual test, but was varied from 1/2 to
10 seconds in the five test series. This was done to determine the
9
"'""' 0
-
Soil Type Test Type of Number Loading
Ottawa Sand 1 ----
" 2 Repetitive
II 3 Repetitive
II 4 Repetitive
II 5 Repetitive
II 6 Repetitive
Laboratory 7 Rapid
Clayey Sand Pullover
II 8 Repetitive
Laboratory 9 Repetitive Sandy Clay Rapid
II 10 Pullover -------
* Machine malfunction (no data obtained).
TABLE 3
SUMMARY OF TESTS
Duration of Each
Load Cycle (seconds).
----
1.0
2.0
10.0
0.5
10.0
----
1.0
1.0
----
Static Load P Range of for 5° Rotation
Dynamic Loads From Theory2
(lb~ (lbs.)
* 32.5 ----
6.8 - 29.7 32.5
8.9 - 37.3 32.5
6.9 - 38.7 32.5
12.2 - 35.9 32.5
6.3 - 33.2 32.5
102.2 max. 42.2
18.1 - 72.8 46.5
7.5 - 196.0 144.0
213.8 max. 196.7

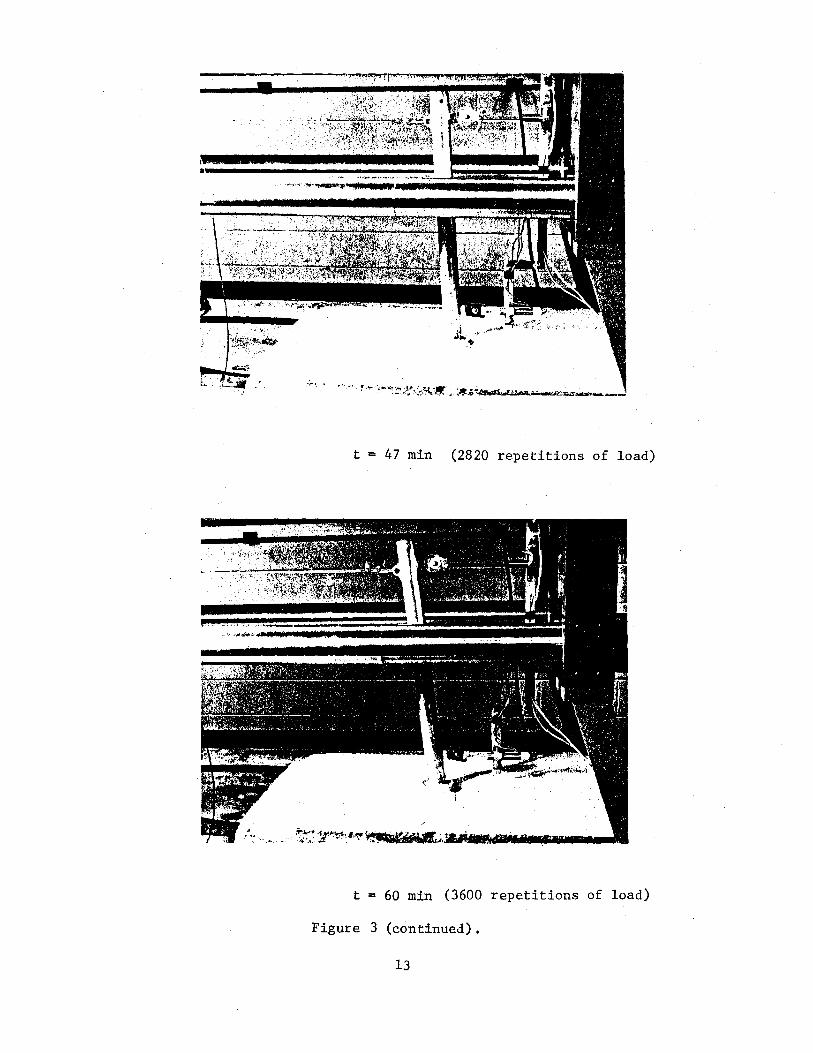
effect, if any, of changes in the load cycle rate. In each test, the
0 load was increased in increments until a footing rotation of over 5 was
observed. The progressive rotation of a model footing under repeated
loads is shown in Figure 3.
Sa.nd T v.d.6
The shaft on the Gilmore load actuator was positioned to allow
maximum footing movement before resetting. A cable from the Instron ·
load transducer was attached to the pipe extending from the model
footing to give a height of pull 24 inches above the footing. The
slack in the load cable was then taken up with an initial horizontal
load of 5 lbs. The Gilmore machine was set to provide a sinusoidal
loading function and tests were conducted at frequencies of 0.1, 0.5,
1 and 2 Hertz. At each frequency, an initial nominal load of 5 lbs.
was applied, and the load was increased incrementally after each 10
minutes of cyclic loading.
Sa.nd- CR.a.y W.xtwr.u
The preparation of the Gilmore testing machine was identical to
that for the sand tests, as was the general testing procedure. The
progressively increasing loads were applied at frequencies of 1 Hertz
only (1 cycle per second), however, as in the sand tests, the load
0 was increased in steps until 5 of footing rotation was observed.
Sa.nd-C.ta.y W.xtwr.u, Ra.p-<..d PuU..oveJt Tuu
Again, the preparation of the Gilmore testing machine was similar
to that used for the sand tests. The only major difference was that
11

• i ., . '
Hlllll .. "'"'; ti
'7~:: ~~·~-~·~~.:,~~::-:-?· ·_,_·_:~·;;.;_~;;: :--:
Test Footing Prior to Loading
t = 0 min
---~
.. .,.. .... ~ '"'L ' .•• • .. .- ~
t = 30 min (1800 repetitions of load)
Figure 3. Typical Dynamic Model Test Load Duration, One Second Per Cycle.
12
t = 47 min (2820 repetitions of load)
t = 60 min (3600 repetitions of load)
Figure 3 (continued).
13

the actuator shaft was initially positioned to limit its total travel
to 5 inches to prevent damage,to the top linear displacement transducer.
The load was applied in a single 5-inch stroke which took place in
approximately 1/2 second.
TESTING RESULTS AND DISCUSSION
The major results of this study are exemplified by Figures 4, 5,
and 6, which are plots of footing rotation versus load repetitions for
the Ottawa sand, the sandy clay, and the clayey sand, respectively.
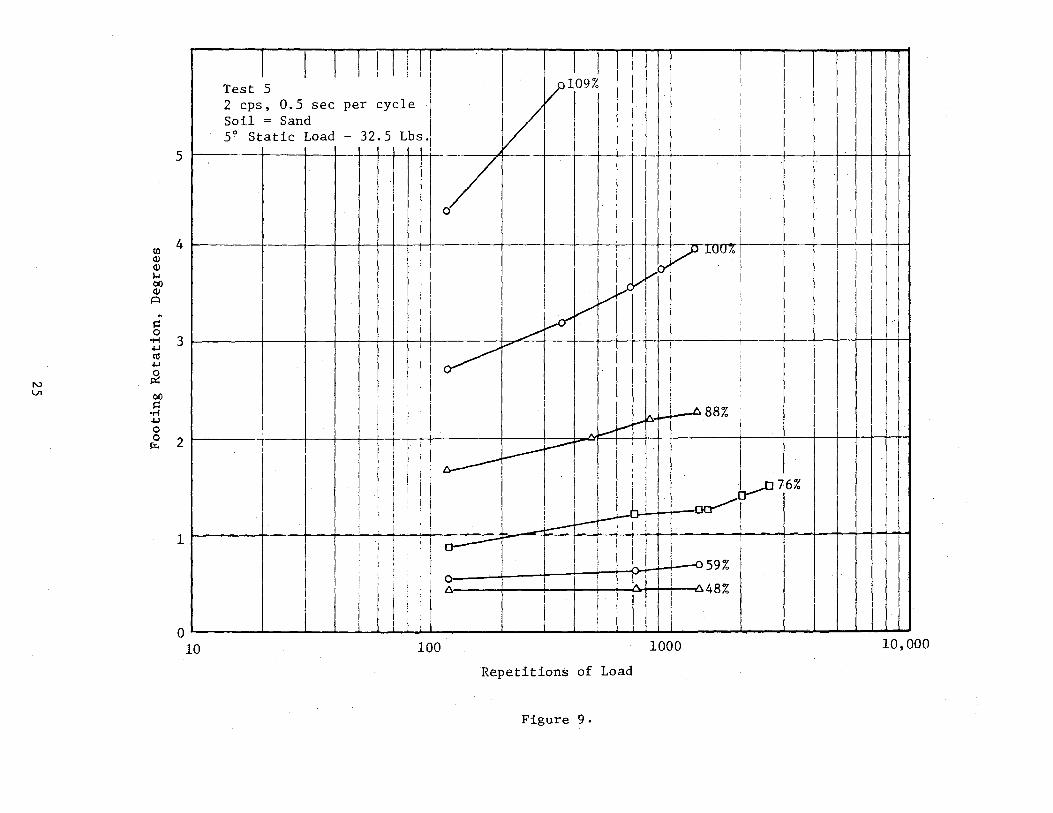
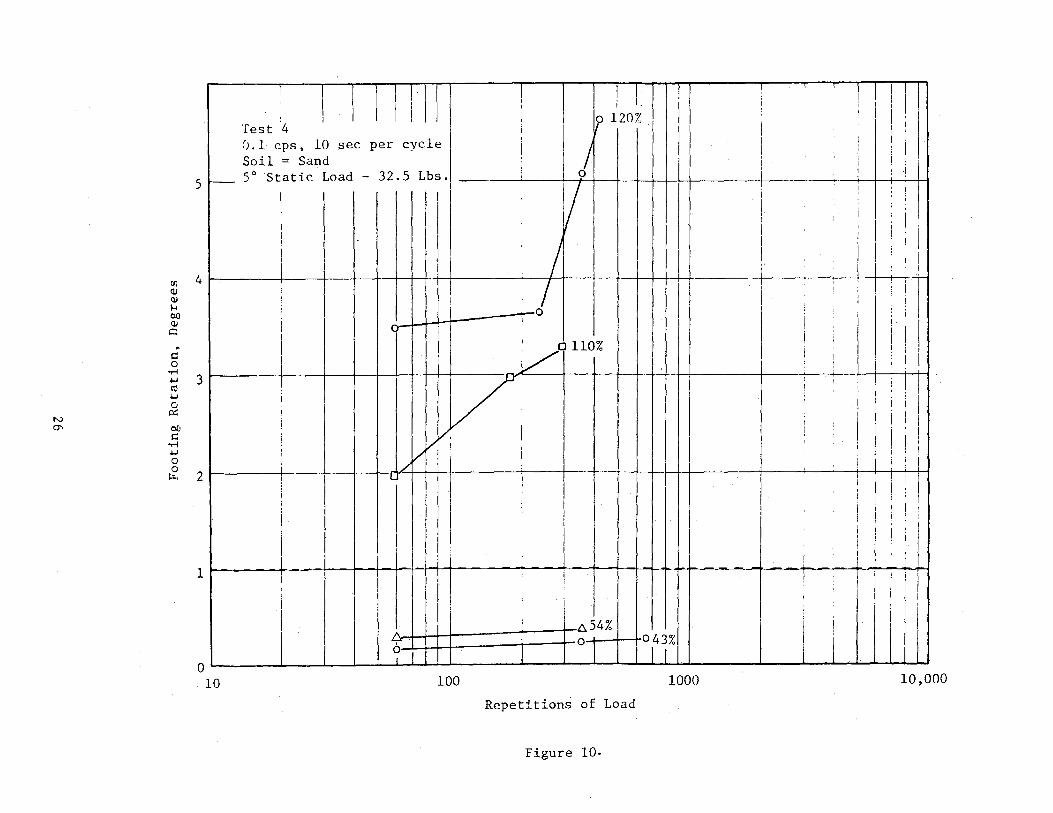
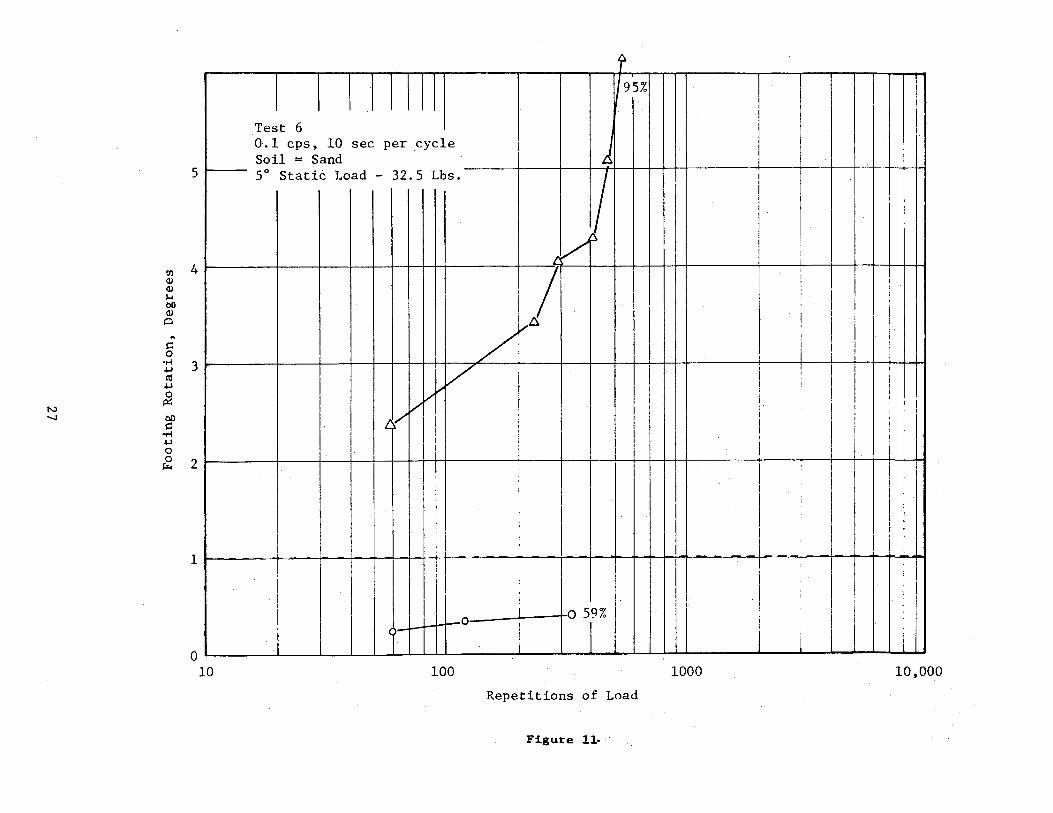
In the Ottawa sand test, Figure 4 shows that, at load intensities
0 . up to at least 62% of the 5 static pullover load*, the footing is
stable. Stable is here defined to mean that at a particular load inten-
sity the footing can sustain over 10,000 cycles of load before a rotation
of one degree is reached. (This determination is based on the linear
extrapolation of the test data on a semi-log plot.) This critical load
intensity of 62% was obtained for a load cycling rate of one cycle
per second, and it is reinforced by the stability determinations at the
other cycling rates. (Test 5-59%, Test 4-54%, Test 6-59%, and Test 3-63%.)**
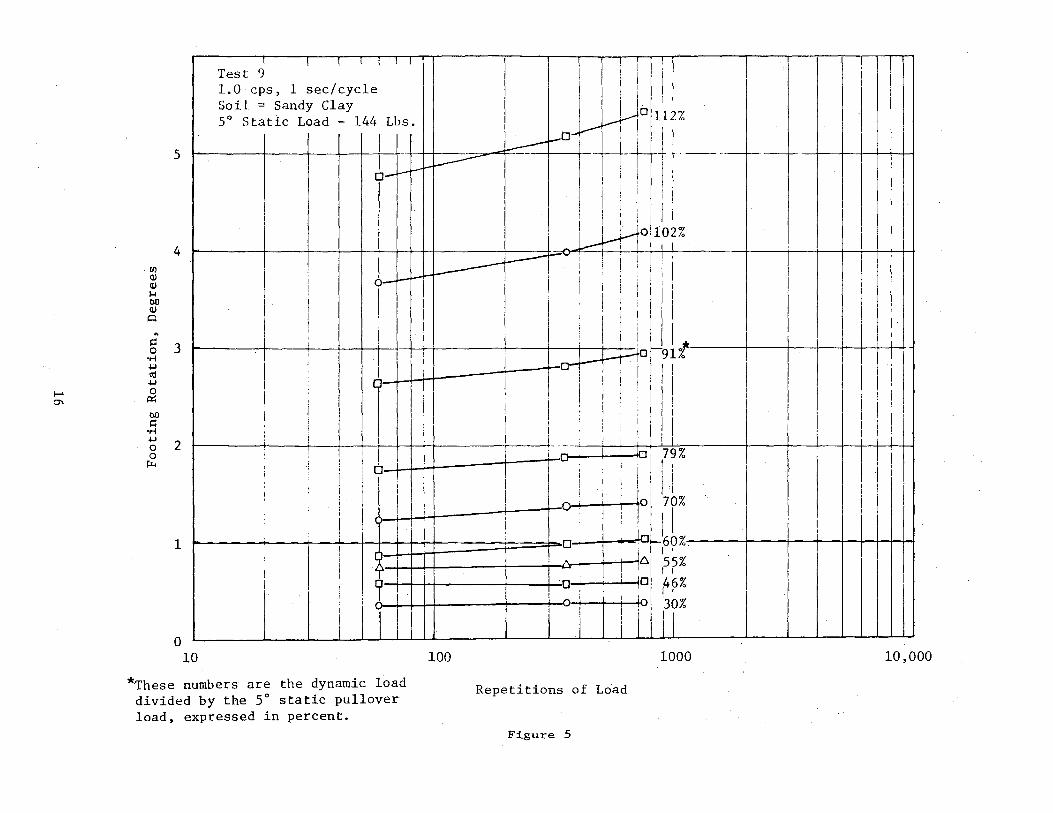
In the two tests of the sand-clay mixtures, shown in Figures 5 and
0 6, the sandy clay shows stability at 55% of the 5 static pullover load,
while the clayey sand (with a very low cohesion and no apparent angle of
shear resistance) does not meet the stability criterion established above.
* The maximum load the footing would withstand under a gradually increasing static load was found to occur at a rotation of approximately 5° in Research Report 105-2.
** Figures 9 through 12 in Appendix A.
14

I-' U'1
(I) Cl) Q; ,... 0£. Cl)
c ~
t: 0
.,.; 4-J C'O 4-J 0
p:;;
bt t:
..,..; 4-J 0 0 ~
I 1.···! II! V
i I q 1% I [:([ . I II,/ J 1'~11!
' I VIlli I Test 2 1.6 cps, 1 sec/cycle Soil = Sand
I I
I I i I I I I I ,
5 r- 5° Static Load - 32.5 Lbs~ ++-·
I I I 1 ! I lll . I • I I
I I j \ ! Ro% II 1i V 4
I j !
I i I
3 1----~~ I I I :
I I i ! 1 . . : I
2
1
l)
10
I I I I 1
+fH' !1 J_ - I I ··-. I I I i ' • I I
I i I I I I I ; ' , I i i I
I I I i I I
T ! z:;;;:r
I II 11111 I j ~162% I 1 Li :J __ j _ :=:rrD~!~
100 1000
i I I
*These numbers are the dynamic load divided by the 5° static pullover load, expressed in percent.
RePetitions of Load
Figure 4
I I
I i i
I I l
I
II
10,000
..... "'
1:1) <I) <I) ~ bO <I) Q
.. ~ 0 ..... ~ CIS +-J 0
p::;
bO ~ ..... +-J 0 0 ~
5
I
Test 9 I --r-·1-~fl
1.0 cps, 1 sec/cycle Soil = Sandy Clay 5° Static Load - 144 Lbs.
I f-0=
n-l t i 0 I i IJD 1
112%
-=-~ ±1IJ +-----+--+- ·I I I II
l !
i I I j ! l
I I I l I I ·~01102%
1---------+---l--+----l-+++++----t---::::;:l:i 1 : : l--l-l-11--~--1---1~~1 -+-1---+1-+-1-l-' t-HII'
I ! i i 111 I
4
I I
3
2 I
1
0 10
I I
I i :
. i I I ~. --+--+-----+---+-lo ~91{
,_LLU--~Ir-io I I I I I I i : I ! ! ' I I i
I - : i : I ! 1. I I I II I I I· --+-~-u-w:-=-~---_-t-r----_r-· 0 . I I bl ?9%
I
I i ----r----l--1-
! : · il ill 0 ! ! o~· 17r
~ttt:tt======f===jD 1
: 160% I I + I I I I 1 I
I, • I '
'1' -i--+++-----+--f-Lr--n--:61
ss% D.· ' I I
--1--1--1-+----1--~0 i 01 ,4p% -+-0 i 1 l iol ·30%
j I I i IJ 11 I 100 1000 10,000
*These numbers are the dynamic load divided by the 5° static pullover load, expressed in percent.
Repetitions of Load
Figure 5

1-' -..1
T----~---~-1 I l I r Test 8 i 1.0 cps, 1 sec/cycle Soil = Clayey Sand 5° Static Load - 46.5 Lbs.
5 --
1 I . I !
I
1:1: Cl.l Cl.l ,..
4 I Ylj i I I I :
. I l i i ;I :
lfr I I j 1 o 1an*
01) Cl.l
0 ~
~ 3 0
..-i 4J t1l 4J 0
r::G
CD s::
..-i 4J 2 .0 0
[.:t..
1
0 10
*These numbers are the dynamic load divided by the 5° static pullover load, expressed in percent.
I 0
: I
100 1000
Repetitions of Load
Figure 6
I
I I
'
i j_
I i
' I I
i I
i !
i
' I
I
I I
L
i
10,000
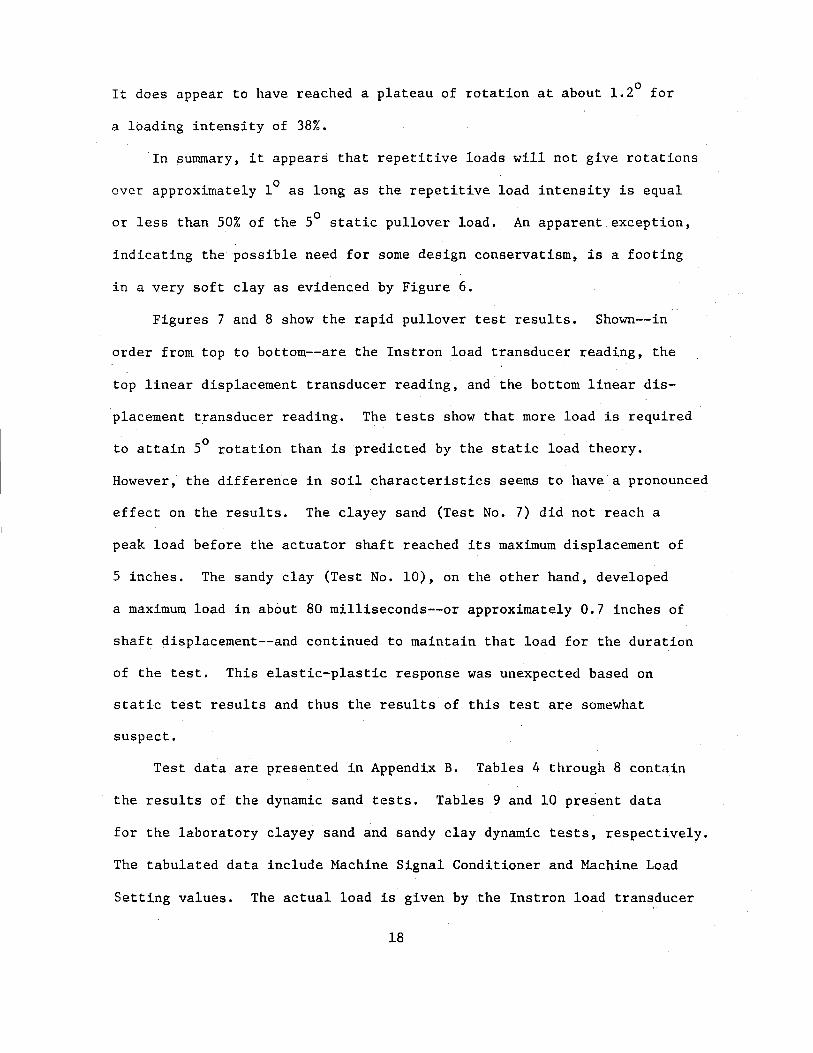
0 It does appear to have reached a plateau of rotation at about 1.2 for
a loading intensity of 38%.
In summary, it appears that repetitive loads will not give rotations
over approximately 1° as long as the repetitive load intensity is equal
or less than 50% of the 5° static pullover load. An apparent exception,
indicating the possible need for some design conservatism, is a footing
in a very soft clay as evidenced by Figure 6.
Figures 7 and 8 show the rapid pullover test results. Shown--in
order from top to bottom--are the Instron load transducer reading, the
top linear displacement transducer reading, and the bottom linear dis-
placement transducer reading. The tests show that more load is required
to attain 5° rotation than is predicted by the static load theory.
However, the difference in soil characteristics seems to have a pronounced
effect on the results. The clayey sand (Test No. 7) did not reach a
peak load before the actuator shaft reached its maximum displacement of
5 inches. The sandy clay (Test No. 10), on the other hand, developed
a maximum load in about 80 milliseconds--or approximately 0.7 inches of
shaft displacement--and continued to maintain that load for the duration
of the test. This elastic-plastic response was unexpected based on
static test results and thus the results of this test are somewhat
suspect.
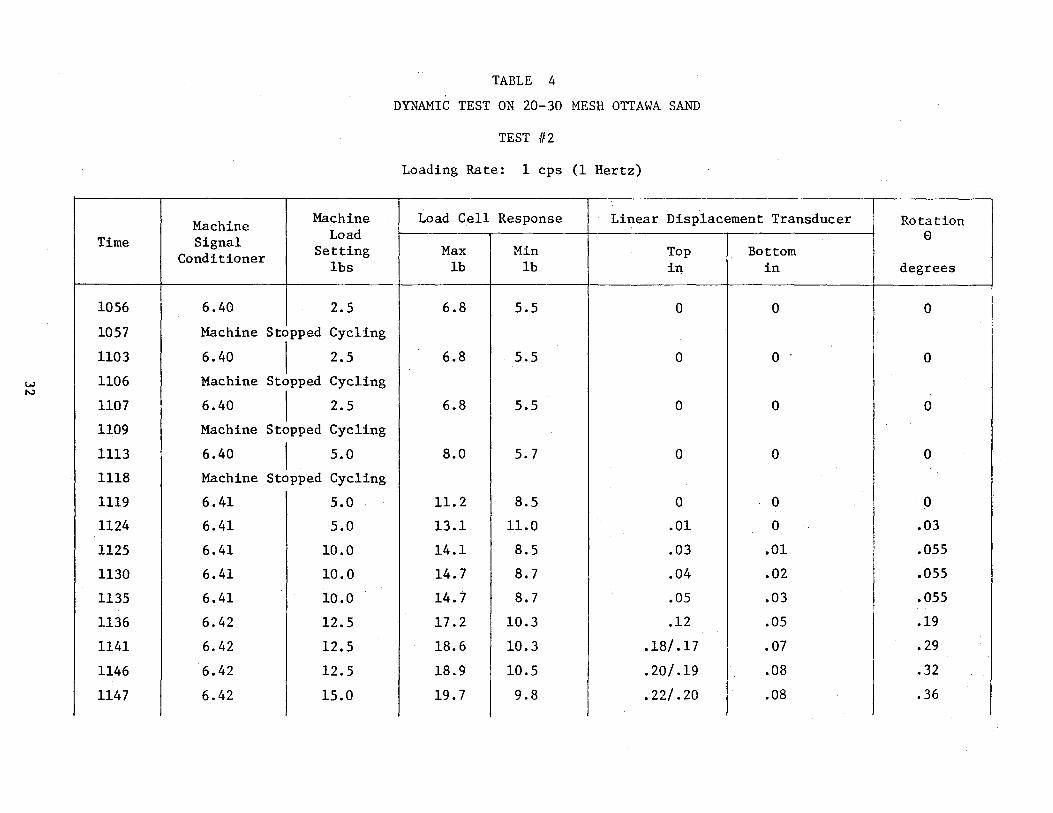
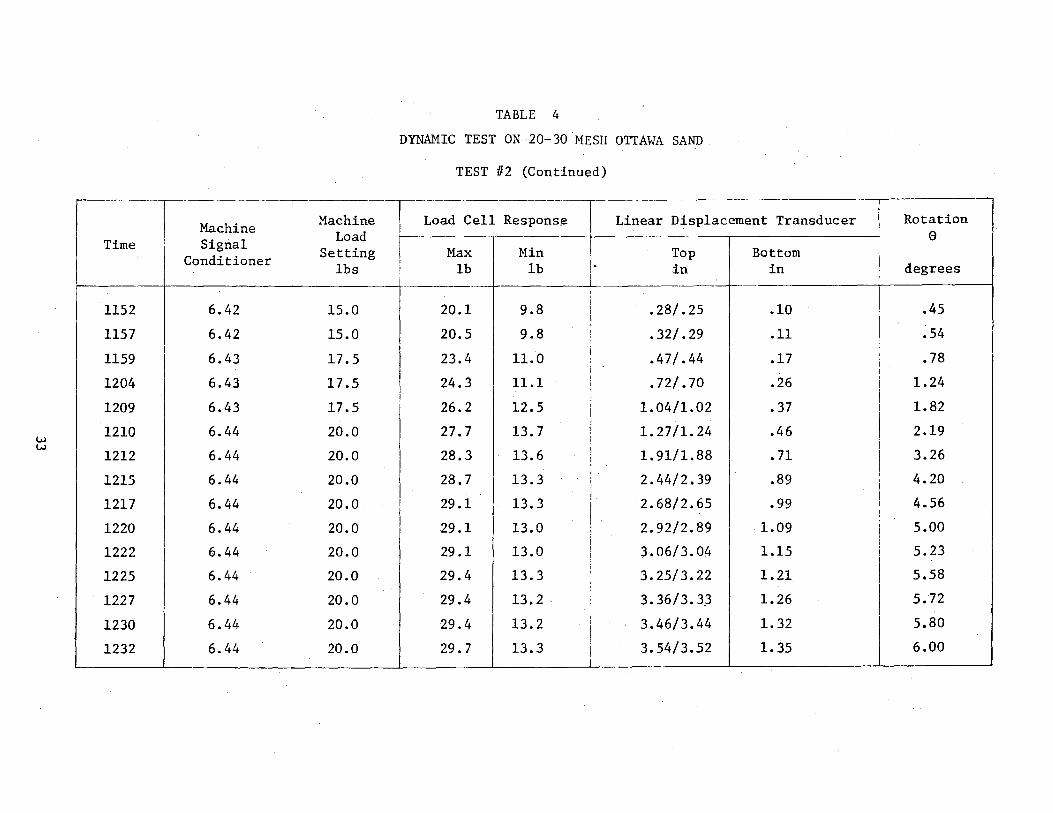
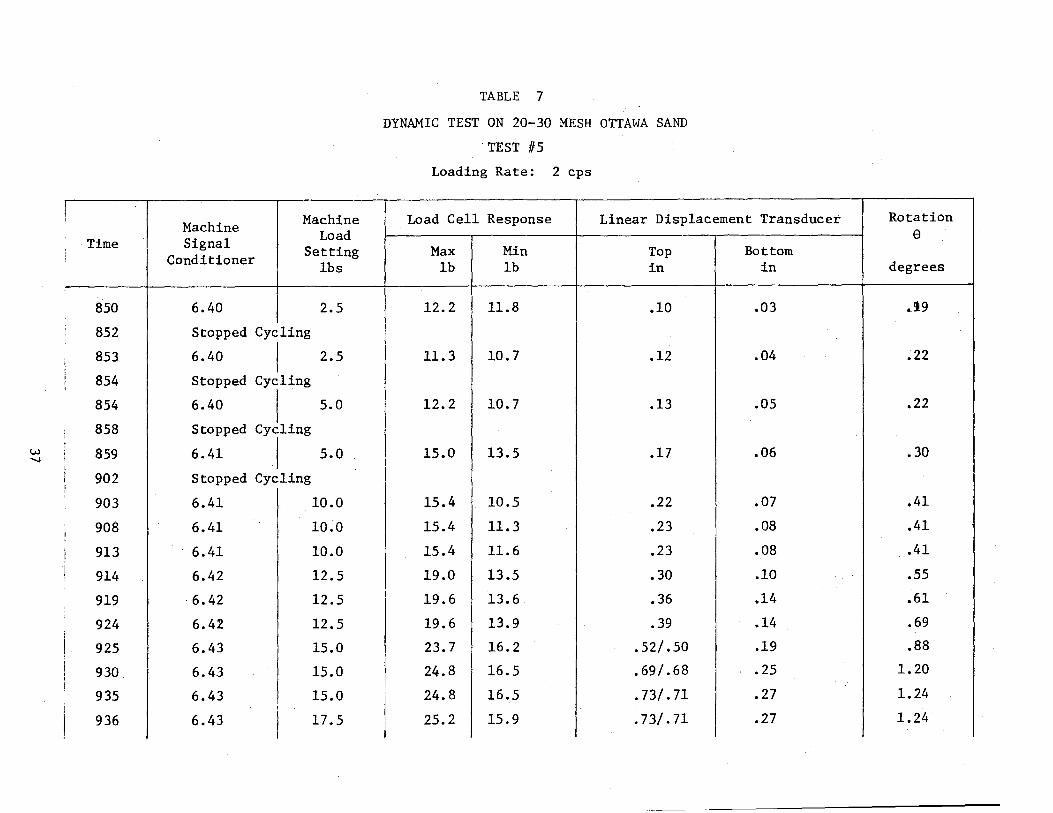
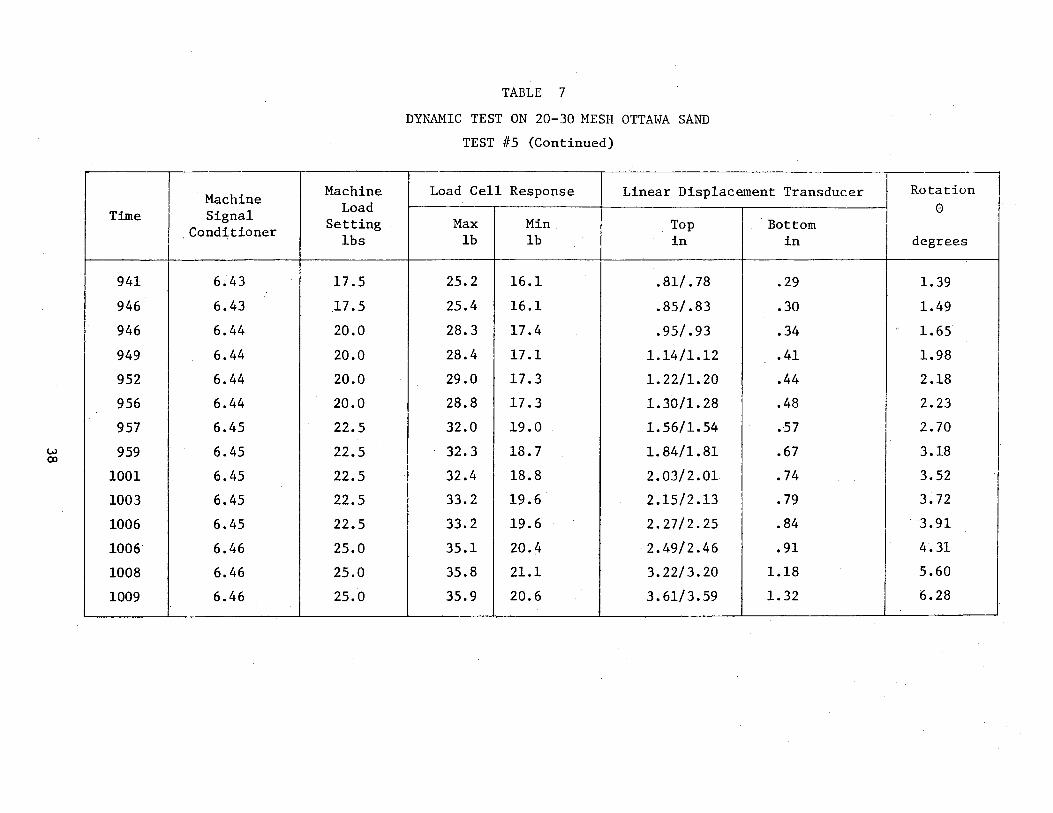
Test data are presented in Appendix B. Tables 4 through 8 contain
the results of the dynamic sand tests. Tables 9 and 10 present data
for the laboratory clayey sand and sandy clay dynamic tests, respectively.
The tabulated data include Machine Signal Conditioner and Machine Load
Setting values. The actual load is given by the Instron load transducer
18

and is listed under Load Cell Response. This column shows a maximum
. and minimum load corresponding to the extremes of the loading cycle.
The Linear Displacement Transducer column shows displacement at the top
and bottom of the metal pipe attached to the footing. When two values
are given for a displacement, the first reflects displacement during
the maximum load value of the cycle and the second is displacement at
the minimum load value. Differences in these maximum and minimum
values reflect soil elasticity. The last values listed are the rotations
of the footings at the listed times.
19

5° Static Pullover Load= 42.2 lb.
~ loAJJ CELL
+0~ ~u
N 0
+ .06"
0"
0
BOTTOM L D T
100
TOP L D T
200 300 400
TIME IN MILLISECONDS
TEST 117 RAPID PULLOVER TEST ON 67% SAND, 33% CLAY \,ILMORE UNIVERSAL TESTING :11\CiliNE
-Machine Settings
LOAD 500 LR. DYNAMT C AMPL . :. 100% RANGE: 20% LSC: 1n
500 600 700
Figure 7. Rapid Pullover Test, Clayey Sand.

N 1--'
so
TEST 1110 RAPID PULLOVER TF.ST ON 33% SAND, 67% CLAY CILMORE UNIVERSAL TESTING MACHINE.
/-
Static p Load - ull.over - 196. 7 lb.
+ 5/R lb.------'
TOP L D T
+ • 05 II --------./ BOTTOM L D T
0"
I 0 100 200 300
TIME IN 11ILLISECONDS
Figure s. Rapid Pullover Test, Sandy Clay.
Machine Settings
LOAD: 500 I B. RANG F.: 20%
400 500
DYNh~IC AMPL.: 100~
LSC: 10
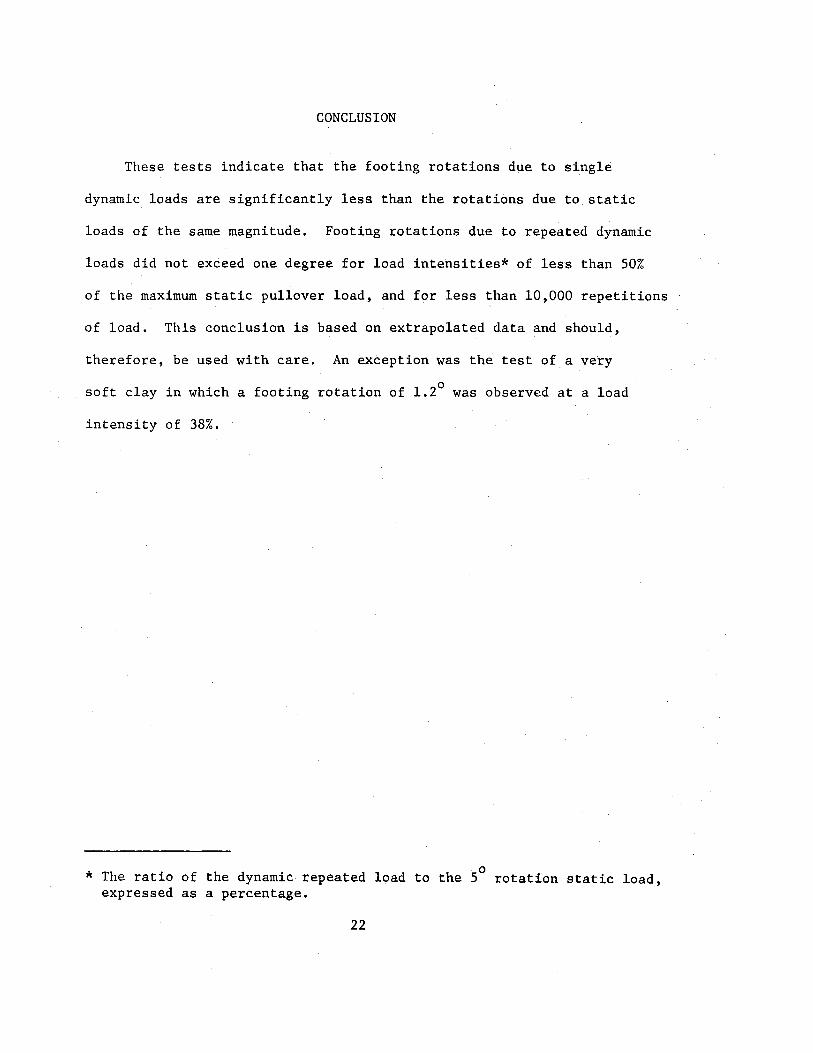
CONCLUSION
These tests indicate that the footing rotations due to single
dynamic loads are significantly less than the rotations due to static
loads of the same magnitude. Footing rotations due to repeated dynamic
loads did not exceed one degree for load intensities* of less than 50%
of the maximum static pullover load, and for less than 10,000 repetitions
of load. This conclusion is based on extrapolated data and should,
therefore, be used with care. An exception was the test of a very
soft clay in which a footing rotation of 1.2° was observed at a load
intensity of 38%.
0 * The ratio of the dynamic repeated load to the 5 rotation static load,
expressed as a percentage.
22
SELECTED REFERENCES
1. Ivey, Don L., "Theory, Resistance of a Drilled Shaft Footing to Overturning Loads," Research Report 105-1, Texas Transportation Institute, August 1967.
2. Ivey, Don L., Koch, Kenneth J., and Raba, Carl F., Jr., "Resistance of a Drilled Shaft Footing to Overturning Loads, Model Tests and Correlation with Theory," Research Report 105-2, Texas Transportation Institute, July 1968.
3. Ivey, Don L. and Dunlap, Wayne A., "Design Procedure Compared to Full-Scale Tests of Drilled Shaft Footings," Research Report 105-3, Texas Transportation Institute, May 1969.
4. Seed, H. B. and Chan, C. K., "Thixotropic Characteristics of Compacted Clay," P:roaeedings3 ASCE, Vol. 83, S.M. 4, November 1957.
5. Mitchell, J. K., "Fundamental Aspects of Thixotropy in Soils," Proceedings, ASCE, Vol. 86, S.M. 3, June 1960.
6. Moretto, 0., "Effects of Natural Hardening on the Unconfined Compression Strength of Remolded Clays," Second International Conference on Soil Mechanics and Foundation Engineering, Rotterdam, Vol. 1, 1948.
23

APPENDIX A
24
tl) 0.1 0.1 ~ 00 0.1 A ~
J:: 0
"r't .j.J
ctl .j.J
N ~ VI 00
~ •r-i .j.J
0 0 ~
5
4
3
2
1
0 10
I I 1 1 Ill f 1 I I I val09%
I Test 5 I 2 cps, 0.5 sec per cycle v I I
I I
Soil = Sand :
5° Static Load - 32.5 Lbs.
~-r i
~r~ _j I i
~~/ --
!
i
I i I I
.0' v lUU7o ~
I I v I
! L.JV I I I
La--v v )
I : I ../'
~ !--"' !
I I '
i I '
I ' I '
I I
i I ..t:. 88% I ' ~-I I I"""
i !.-- ..... i A J.......- '
I : I I , ~
I I
II~ J.--- I I I ! I I I _....o 76% I i
i I 0 i i ' ,L., ! i ! l
I I I--~--~ I i ' ! _...k---
: I :1~ i ! I I I l ~s9% I I
I i I I I I I I I I I I :....
I ! I ,
fA I
! i ! .., I
i I 6. I 48% I
I ll I
I ! • I I
! I
l l ' I i ' i i I
100 1000 10,000
Repetitions of Load
Figure 9.
UJ Q) Q)
'"' 00 Q)
Q
~
c 0
•.-1 +-1 Cll +-1 0
p::: N 0\ O(J
c ·.-1 +-1 0 0 ~
I I I I T I I I I 1 ! T l I : I I I I I I : I a i ! I '[ 4 I 19 120/, , est u · 1 1
4
3
2
5
(). 1 cps, 10 sec per cycle j i I Soil = Sand ! i
~5° Static Load - 32.5 Lbs. o I : ; \ i ! v -- -1 ! :
I I ! i I I I I , 1 I : I i I ' : ,. il I ' I
t-----t---+--+-- I : i ! 1 j J 1 I I I ! I I I
· Lo 1 I I ( I I I i /( 110% I : i v I il
! 7' :~~1, I . I I
1 , : I
' ! I ! I I I
I vY· ! '
' _ _ /vi I I 1 lr 1-----+-- t-· -L ---- ---- - I ' '
! ! I' I \ I I I I i ' ~ I ! I i ! :
I : I i I i I : I I
r------r---r--~+-~-r~~~---~·~~---4-~-~~~ 1 l · i I I ! I l I , , I . ' I I ' i i I I I ! ~ I I
1
0 10
II i ~54% i I I
r- l 0 ot~% l I I 100 1000 10,000
Repetitions of Load
Figure 10·
(Jl <I) <I) ,_. 00 <I)
0 .. ~ 0 -~ ~ (1! ~
~ N -..J 00
~ -~ ~
0 0 ~
5
4
3
2
1
0 10
I I I I l Ill Test 6 0.1 cps, 10 sec per cycle Soil = Sand 5° Static Load - 32.5 Lbs.
/ I /""
/ I / L.
I I
I I
I I
I !
l
,~o 100
~
95% I
I 4
,/1 I- -
i
7 I
I I I
I
I i I I
i I ,_,. I
I I / I
I l I
! I ; I I I ' ' I i I I
I I ' I I :
I I
I I
I i
I I I I i ! I
I I I I
i I !
! I I
0 59% i I 1
I I l I
1000 10,000
Repetitions of Load
Fi.gure 11·

en <IJ <IJ
'"' 00 <IJ
0
~
~ 0
•r-1 .... ctl .... 0
p:::
N 00 00 ~
·r-1 .... 0 0 ~
Figure 11•
f T I I I ---
••• cycle I , I I : I !
I lllffil Test 3 n.s cps, 2 sec S0il = Sand I
TTTTT I ] : I I
i i ~ I I f : I
I ~ I ,
I I I ~ i '
; i I 5 r--- 5° Static Load -I I ! I
4
___ ... - I I
-I ' '
' ! i
I
3
2
I I I I I
' I+' / 106% I I I I I ! I I I I I I '
i I I I I I : I ; I
J I • I
I I I . . ' i I ! -
1 __ t + I U{tJ_ -1
. . ~ ----r -t I I ! i i I .
~. 96%!! 'I ,I 0 I I : : I
' . I 'V . : l I ! I . i : i
··~!I ~oY%1 II j -~ -~1liJJ 11~:-
v
~1111 I· "" I I I I I I I "..:.----+"'
79% j
1
Tl Tf] ' I ' I I I : I )---t-1 ---il I I I I I 0 ; . 0 63% I I I' I I
I . I I I I i I - - j l I I
100 1000 10,000
Repetitions of Load
Figure 12·


VlO
160
140
120
u: 0:: ....:1
~
H
c; 100 < 0 ....:1
z §': H :><: ;;! so
60
40
20
0 0 2 4
TEST# 9, Sandy Clay 33% SAND, 67% CLAY
Figure 14. HAXIMUH LOAD PER 10 MIN. CYCLING INTERVALS VS. ROTATION IN DEGREES FOR LABORATORY SANDY CLAY AND LABORATORY CLAYEY SAND
6 R
ROTATIO~ I~ DEGREES
TEST #8, Clayey Sand 67% SAND, 33% CLAY
10 12
Figure 14. Haximum Load Per 10 Min. Cycling Intervals Vs. Rotation in Degrees for Laboratory Sandy Clay and Laboratory Clayey Sand.
30
14

A P P E N D I X B
31
\.1.)
N
Time
1056
1057
1103
1106
1107
1109
1113
1118
1119
1124
1125
1130
1135
1136
1141
1146
1147
Machine Machine
Signal Load
Conditioner Setting lbs
6.40 2.5
Machine Stopped Cycling
6.40 I 2.5
Machine Stopped Cycling
6.40 I 2.5
Machine Stopped Cycling
6.40 I 5.0
Machine Stopped Cycling
6.41 5.0
6.41 5.0
6.41 10.0
6.41 10.0
6.41 10.0
6.42 12.5
6.42 12.5
6.42 12.5
6.42 15.0
TABLE 4
DYNAMIC TEST ON 20-30 MESH OTTAWA SAND
TEST //2
Loading Rate: 1 cps (1 Hertz)
Load Cell Response Linear Displacement Transducer Rotation e
Max Min Top Bottom lb lb in in degrees
6.8 5.5 0 0 0
6.8 5.5 0 0 ' 0
6.8 5.5 0 0 0
8.0 5.7 0 0 0
11.2 8.5 0 0 0
13.1 11.0 .01 0 .03
14.1 8.5 .03 .01 .055
14.7 8.7 .04 .02 .055
14.7 8.7 .05 .03 .055 I
17.2 10.3 .12 .05 .19
18.6 10.3 . .18/.17 .07 • 29
18.9 10.5 .20/.19 .08 .32
19.7 9.8 .22/.20 .08 .36 I
w w
--T- Machine
Time ' Signal I
Conditioner
1152 6.42
1157 6.42 I
1159 I
6.43
1204 I 6.43
1209 6.43
1210 6.44
1212 6.44
1215 6.44
1217 6.44
1220 6.44
1222 6.44
1225 6.44
1227 6.44
1230 6.44
1232 6.44
TABLE 4
DYNAMIC TEST ON 20-30.MESH OTTAWA SAND
TEST #2 (Continued)
r------ -------·:-r--------------------- ---Machine Load Cell Respons~ , Linear Displacement Transducer Rotation
Load I
e Setting Max Min I Top Bottom I
lbs I lb lb I· in in
I
degrees I I
1~ ·----
20.1 9.8 .28/.25 .10 .45
15.0 20.5 9.8 .32/.29 .11 I .54 I
17.5 23.4 11.0 I .47/.44 .17 .78
17.5 24.3 11.1 .72/.70 .26 1.24 I
17.5 26.2 12.5 1.04/1.02 .37 1.82
20.0 27.7 13.7 1. 27/1.24 .46 2.19
20.0 28.3 13.6 I
1.91/1.88 .71 3.26 ! 20.0 28.7 13.3
I
2.44/2.39 .89 I 4.20
I i
20.0 I 29.1 13.3 2.68/2.65 .99 I 4.56 I
\
20.0 29.1 13.0 2.92/2.89 1.09 5.00
20.0 29.1 13.0 3.06/3.04 1.15 5.23 I
20.0 29.4 13.3 3.25/3.22 1.21 5.58 I '
20.0 29.4 13.2 3. 36/3.33 1.26 5. 72
20.0 29.4 13.2 I
3.46/3.44 1. 32 5.80 I
I 20.0 29.7 13.3 i 3.54/3.52 1.35 6.00
_1

w ~
Time
223
224
225
226
230
231
234
235
240
244
245
250
255
256
301
306
307
312
i
I
l
TABL£ 5
DYNAMIC TEST ON 20-30 MESH OTTAWA SAND
TEST 113
Loading Rate: .5 cps (.-5 Hertz)
Machine Machine Load Cell Response Linear Displacement Transducer· Rotation
Signal Load e Conditioner Setting
I Max Min Top Bottom
lbs lb lb in in degrees
6.42 2.5 8.9 8.7 . .03 .01 .055
Machine Stopped Cycling
6.43 I 5.0 12.5 12.5 .05 .01 .110
Machine Stopped Cycling
I I
Established New Zeros
I I
6.40 2.5 10.1 8.3 .01 I 0 .0"3 I
Machine Stopped Cycling I
! 6.41 5.0 15.2 9.6 .02 0 .055
6.41 5.0 15.2 9.6 .03 0 .083
Machine Stopped Cycling i
6.42 10.0 19.7 10.4 .13/.11 .03 .230
6.42 10.0 21.2 11.0 .19 .05 .385
6.42 10.0 21.2 10.8 .21/.20 .07 .385
6.43 .12. 5 25.4 11.9 .30/.28 .10 .523
6.43 12.5 25.6 12.0 .40/.38 .14 .688
6.43 12.5 25.9 12.2 .46/.43 .16 .785
6.43 15.0 28.3 11.9 .49/.46 .17 .840
6.43 15.0 28.8 12.0 .65/.63 .22 1.16

w IJ1
I I
Time
317
318
323
328
329
331
332
334
336
339
342
345
348
351
354
358
400
403
406
__ .. _- ---T
I Machine Signal I
Conditioner ! I
6.43
6.43
6.43
6.43
6.44
6.44
6.44
6.44
6.44
6.44
6.44
6.44
6.44
6.44
6.44 i i
6.44 !
6.44 I i
6.44
6.44
------
Machine Load
Setting 1bs
15.0
17.5
17.5
17.5
20.0
20.0
20.0
20.0
20.0
20.0
20.0
20.0
20.0
20.0
20.0
20.0
20.0
20.0
20.0
--------·=·-~~~~~-· ...... -.... , ......... & ...... ,.;·~ - ~.:1...-.,..;........,.
TABLE 5
DYNAMIC TEST ON 20-30 MESH OTTAWA SAND
TEST #3 (Continued)
L< r------
oad Cell Response
Max I
Min lb lb
Linear_ Dis~1acement Transduce~ Rotation 8·
Top Bottom in in degrees
---
I 29.1 !
11.9 I
30.4 i 11.1 I
.72/.69 .25 1.25 • 74/.72 .26 1.24
30.6 I 11.1 .90/.86 • 31 1.49 31.2 11.1 .99/.96 .35 1. 72
I 33.9 11.7
34.6 12.0 1.07/1.03 .37 1.87 1.40/1.36 .so 2.42
34.9 11.9 1.50/1.45 .53 2.60 34.9 11.4 1. 68/1.64 .60 2.92
i I
I 35.4 11.9
35.8 I 11.9 I
1. 84/1.80 .66 3.20 2.05/2.01 • 74 3.58
35.8 11.9 2.21/2.17 i .80 3.83
36.1 11.9 2.36/2.32 I .86 4.08 I 36.3 12.2 2.48/2.44 I .90 4.30 i
36.3 12.0
36.4 i 12.0
! 36.7 12.0
36.7 I 12.3
36.7 I
12.3 I I
37.3 _j 12.9 --· --------
I
2.59/2.55 i .95 4.46
2.70/2.66 .99 4.60 I 2.83/2.79 I 1.04 4.88 I 2.91/2.87 I 1.07 5.01 i l I 3.00/2.97 I l.ll 5.16 J I
I
3.10/3.06 I 1.15 5.32 j

w 0\
Time
229
234
236
238
243
248
249
254
259
302
306
316
318
320
322
~25
,327
TABLE 6
DYNAMIC TEST ON 20-30 MESH OTTAWA SAND
TEST //4
Loading Rate: .1 cps (.1 Hertz)
Machine Machine--1-~oad Cell Re~ponse Linear Displacement Transducer
Signal Load Setting Max Min Top Bottom Conditioner lbs lb lb irt in
. 6.37 5.0 6.9 3.4 .02 0
6.37 5.0 7.8 4.0 .03 0
Stopped Cycling
6.37 10.0 13.3 3.2 .07 .01
6.37 10.0 14.4 3.4 .11 .03
6.37 10.0 14.8 3.7 .13 .03
6.37 12.5 16.4 3.5 .13 .03 I 6.37 I 12.5 17.6 3.8 .16 .04
Stopped Cycling
6.38 I 15.0 21.7 8.9 .30/.26 .08
Stopped Cycling
6.39 I 15.0 24.8 8.7 .39/.35 .11
Stopped Cycling
6.42 I 17.5 35.6 9.2 1. 27/1.22 .54 I
I 6.42
I 17.5 37.6 11.2 1.68/1.63 .58
6.42 17.5 36.2 12.7 1.85/1.81 .64 i Stopped Cycling
6.43 20.0 38.4 14.4 1.97/1.92 .68
6.43 20.0 36.4 15.9 2.08/2.04 .73
6.43 20.0 39.1 11.3 2.88/2.84 1.03/.99 Stopped Cycling
I 2.0..<l 18.1 "l4.1 1._ 2li~L17. . .. - ... J ..• 1.5 - -·- -------
Rotation e
degrees
.055
.083
,•
.165
• 22
.275
.275 I
.33
.55
.72
1.94
2.96
3.24
3.48
3.62 i
I 5.07
! 5.62 :
w .......
I i
:
j
i I I i
i
!
i I
I
Time
850
852
853
854
854
858
859
902
903
908
913
914
919
924
925
930
935
936
Machine Machine
Signal Load
Conditioner Setting lbs
6.40 2.5
Stopped Cycling
6.40 I 2.5
Stopped Cycling
6.40 I 5.0
Stopped Cycling
6.41 I 5.0
Stopped Cycling
6.41 10.0
6.41 10.0
6.41 10.0
6.42 12.5
. 6. 42 12.5
6.42 12.5
6.43 15.0
6.43 15.0
6.43 15.0
6.43 l 17.5
TABLE 7
DYNAMIC TEST ON 20-30 MESH OTTAWA SAND
. TEST 115
Loading Rate: 2 cps
Load Cell Response Linear Displacement Transducer
Max Min Top Bottom lb lb in in
12.2 11.8 .10 .03
11.3 10.7 .12 .04
12.2 10.7 .13 .05
15.0 13.5 .17 .06
15.4 10.5 .22 .07
15.4 11.3 .23 .08
15.4 11.6 .23 .08
19.0 13.5 .30 .10
19.6 13.6 .36 .14
19.6 13.9 . 39 .14
23.7 16.2 .52/.50 .19
24.8 16.5 .69/.68 .25
I 24.8 16.5 • 73/. 71 .27
25.2 15.9 .73/.71 .27 j
Rotation e
degrees
.. 19
.22
.22
• 30
.41
.41
.41
.55
.61
.69
.88
1.20
1.24
1.24
w 00
Time
941
946
946
949
952
956
957
959
1001
1003
1006
1006
1008
1009
-
Machine Signal
Cond:f,tioner
6.43
6.43
6.44
6.44
6.44
6.44
6.45
6.45
6.45
6.45
6.45
6.46
6.46
6.46
Machine Load
Setting lbs
17.5
_17 .5
20.0
20.0
20.0
20.0
22.5
22.5
22.5
22.5
22.5
25.0
25.0
25.0
TABLE 7
DYNAMIC TEST ON 20-30 MESH OTTAWA SAND
TEST #5 (Continued)
Load Cell Response Linear Displacement Transducer
Max Min Top Bottom lb lb in in
25.2 16.1 .81/.78 .29
25.4 16.1 .85/.83 .30
28.3 17.4 .95/.93 • 34
28.4 17.1 1.14/1.12 .41
29.0 17.3 1. 22/1.20 .44
28.8 17.3 1.30/1.28 .48
32.0 19.0 1.56/1.54 .57
32.3 18.7 1. 84/1.81 .67
32.4 18.8 2.03/2.01 .74
33.2 19.6 2.15/2.13 .79
33.2 19.6 2.27/2.25 .84
35.1 20.4 2.49/2.46 .91
35.8 21.1 3.22/3.20 1.18
35.9 20.6 3.61/3.59 1.32 -
Rotation 0
degrees
1.39
1.49
1.65
1.98
2.18
2.23 !
2.70
3.18
3.52
3. 72
3.91
4.31
5.60
6.28

Time
1023 I I
i 1028
1033
1034
1039 w 1043 \0
1044
1045
1049
1052
1054
1055
1055.5
1059
1104
1108
TABLE 8
DYNAMIC TEST ON 20-30 MESH OTTAWA SAND
TEST 116
Loading Rate: .1 cps (.1 Hertz)
Machine Signal
Conditioner
Machin:-T Load
Setting lbs
Load Cell Response Linear Displacement Transducer
; I Max Min Top Bottom I 1b lb in in i i
6.39 5.0
6.39 5.0
Stopped Cyclj.ng
I 6.3 3.1 0 0
6.4 3.2 0 0 I
6.40 7.5 13.0 4.9 .02 0
6.40 7.5 12.1 5.5 .04 0
Stopped Cycling ! 6.41 10.0 19.1 6.1 .13 .04
6.41 10.0 19.9 6.1 .19/.17 I .05
6.41 10.0 17.7 6.9 .20/.18 .06
Stopped Cycling
6.41 10.0 i I
16.5 8.3 .21/.19 .07
6.42 I
12.5 22.5 8.9 .26/.23 .09
6.42 I 12.5 23.2 8.4 .31/.28 .10
Stopped Cycling
6.43 I 12.5 27.8 11.6 .67/.64 .22
Stopped Cycling j
I I
Rotation
1 a
degrees
.055
.110
.230
.34
.40
• 34
.40
.52
1.20

.j::-0
I
I
Time
1109
1114
1116
1117
1120
1121
1123
1124
1125
1126
1127
Machine Machine
Signal Load
Conditioner Setting lbs
6.43 15.0
6.43 15.0
Stopped Cycling
6.44 15.0
6.44 17.5
6.44 17.5
6.44 17.5
Stopped Cycling
6.45 20.0
6.45 20.0
6.45 20.0
TABLE 8
DYNAMIC TEST ON 20-30 MESH OTTAWA SAND
TEST #6 (Continued)
Load Cell Response Linear Displacement Transducer
Max Min Top Bottom lb lb in in
30.0 9.8 .87/.81 .28
28.1 11.3 1.07/1.05 .36
30.9 12.2 1. 32/1.29 .45
32.9 10.9 1.95/1.91 .68
32.9 13.2 2.32/2.25 .80
31.5 14.7 2.42/2.39 .85
33.2 12.8 2.97/2.71 1.00
32.4 14.2 3.53/3.50 1.26
31.6 14.5 4.07/3.93 1.44 . --- ~
Rotation e
degrees
1.54
1.95
2.35
3.43
4.06
4.29
5.09
6.19
7.05

TABLE 9
DYNAMIC TEST ON 67% SAND, 33% CLAY
TEST 118
Loading Rate: 1 cps (1 Hertz)
------·-·· ~-- r·------ ------- ··-- ------·-· Ma h. Machine Load Cell Response Linear Displacement Transducer
I Rotation
c 1ne 1 e Time I Signal ! Load l
C dit" I Setting+ Max Min Top I
Bottom on wner . lbs lb I lb in in I degrees
I -----r-·------1043 6.22 1 · 5.o 18.1 15.1 .61/.60 .18 .. 1.18
1048 6.22 I
5.0 17.6 14.1 .65/.64 .19 1.27
1053 6.22 ! 5.0 17.1 14.6 .65/.64 .20 1.23
1055 6.24 i 7.5 22.6 I
19.1 .73/.72 I .23 1.38
1100 6.24 7.5 22.6 18.6 .88/.87 .29 1.62 ~ I 1-' 1105 6.24 7.5 23.1 18.6 .9]/.90 .30 1.68
i 1.10/1.08
I 1106 6.26 10.0
I 30.6 I 22.6 .37 2.02
1111 6.26 10.0 31.2 22.6 1.40/1.38 • 50 2.48
1116 6.26 l 10.0 31.2 24.1 1.47/1.45 .52 I 2.62 I
1117 6.28 I 12.5 37.7 27.6 1. 56/1.53 .55 2.78 !
1122 6.28 12.5 38.7 27.6 1. 92/1.89 .68 3.42
1127 6.28 12.5 38.7 27.1 2.03/2.00 .73 3.58
1128 6.30 15.0 46.2 32.7 2.10/2.07 I .75 3. 72
1133 6.30 15.0 51.2 36.7 2.91/2.88 I 1.06 5.08
1138 6.30 15.0 50.8 35.7 3.03/3.00 1.13 5.22
1139 6.32 17.5 57.3 39.2 3.20/3.16 1.16 5.60
1144 6.32 17.5 57.8 39.2 3. 75/3.71 1.35 6.68

::N
Time
1149
1150
1155
1200
1201
1203
1205
1206
I I
I I I
i i I I I
Machine Signal
Conditioner
6.32
6.34
6.34
6.34
6.36
------
Machine Load
I
Setting lbs
17.5
20.0
20.0
20.0
22.5
TABLE 9
DYNAMIC TEST ON 67% SAND, 33% CLAY
TEST #8 (Continued)
Load Cell Response Linear Displacement Transducer
Max Min Top Bottom lb lb in in
58.3 39.2 3.99/3.94 1.43
65.3 43.2 4.09/4.05 1.47
65.8 43.2 4.67/4.62 1.68
.65.8 43.2 4.95/4.90 1.80
72.8 47.7 5.00/4.95 1.82
Exceeded limits of system I I
Full load sine wave is no longer obtained
I I I
Rotation El
degrees
7.02
7.18
8.18
8.62
8.70

-1:'l.U
Time
916
923
926
928
929
930
932
933
938
943
944
949
954
955
1000
1005
1006
1011
1016
: Machine Machine Signal Load
Conditioner Setting
lbs
6.16 5.0
6.16 I 5.0
6.16 I 5.0 i
6.22 ! 5.0
Stopped Cycling
6.22 ! 5.0
Stopped Cycling · i
6.24 I 7.5 !
6.24 7.5
6.24 7.5
6.26 10.0
6.26 10.0
6.26 10.0
6.28 12.5
6.28 12.5
6.28 12.5
6.30 15.0
6.30 15.0
6.30 ' 15.0
TABLE 10
DYNAMIC TEST ON 67% CLAY, 33% SAND
TEST /19
Loading Rate: 1 cps (1 Hertz)
Load Cell Response Linear Displacement Transducer ----------.----
Max Min Top Bottom lb lb in in
7.5 .03 0
8.0 .04 0
8.0 .04 0
28.9 26.4 .08 0 I
26.4 23.4 .08 0
36.3 29.9 .10 0
36.3 30.3 .12/.10 .01
35.8 31.8 I .11/.10 0 I
.13/.12 43.3 36.3 I 0
43.3 36.3 .14/.12 0
43.3 36.3 i .14/.13 0 I
.16/.14 49.8 39.8 0
51.2 38.8 .16/.14 .01
50.3 37.8 .16/.14 .01
58.7 41.3 .19/.16 .01
58.7 41.3 .20/.17 .01
58.7 41.3 i
.20/.18 l
.01
Rotation e
degrees
.083
.117
.117
.217
.217
.275
.300
.300
.358
.383
.383
.450
.442
.442
.500
.517
.517 I

.t:
.t:-
I
Time
1017
1022
1027
1028
1033
1038
1039
1044
1049
1050
1055
1100
1101
1106
1111
1112
1117
1122
1123
1128
Machine Signal
Conditioner
6.32
6.32
6.32
6 • .34
6.34
6.34
6.36
6.36
6.36
6.38
6.38
6.38
6.40
6.40
6.40
6.42
6.42
6.42
6.44
6.44
I Machine I Load I Setting
1bs
17.5
! 17.5
I 17.5 I
I 20.0
20.0 I 20.0
22.5
I 22.5
I 22.5
I 25.0 I
I 25.0
25.0
j 27.5 I i 27.5 I
I 27.5 i
i 30.0
30.0
30.0
32.5 i I 32.5 I I
TABLE 10
DYNAMIC TEST ON 67% CLAY, 33% SAND
TEST #9 (Continued)
--r--------------· -·-- ------------------·---------
Load Cell Response Linear Displacement Transducer
Max Min Top Bottom 1b 1b in in
--
65.2 45.3 .22/.19 .01
66.2 45.3 ~23/.20 .02
65.7 45.8 .24/.20 .02
73.1 49.2 .26/.22 .03
73.1 49.2 .27/.24 .03
72.6 49.2 .28/.24 .03
78.1 50.7 .30/.26 .04
79.6 51.7 .32/.27 .04
79.1 52.3 • 34/. 29 .05
84.6 54.7 .36/.31 .05
85.6 54.7 .43/.38 .07
85.6 54.2 .45/.40 .08
91.6 .47/.41
I 56.7 .09
92.0 56.7 .52/ • .47 .10
92.0 56.7 .55/.49 .11
99.5 61.7 .58/.52 .13
100.4 61.2 .66/.60 .16/.15
100.4 61.2 .68/.62 .17/.16
107.5 65.2 .72/.65 .18/.17
107.0 64.7 .79/.72 .20/.20
Rotation e
degrees
.575
.515 I
.600
.633
.667
.683
.717
.767
.800
.850
I .992
1.02 I 1.05
i
I 1.16 I I
1.22 I
I 1.23 ! 1.38 I 1.40 ! 1.48
1.63 I ! i

""' \.11
I '
I I
I
Time
1133
1134
1139
1144
1145
1150
1155
1156
1201
1206
1207
1212
1217
1218
1218
1223
1228
1229
1234
1239
Machine Machine
Signal Load Setting Conditioner lbs
6.44 I 32.5 j
6.46 35.0
6.46 35.0
6.46 35.0
6.48 37.5
6.48 37.5
6.48 37.5
6.50 40.0
6.50 40.0
6.50 40.0
6.52 42.5
6.52 42.5
6.52 42.5
6.54 45.0
Gain cut in half
6.54 45.0
6.54 45.0
6.56 47.5
6.56 47.5
6.56 47.5
TABLE 10
DYNAMIC TEST ON 67% CLAY, 33% SAND
TEST #9 (Continued)
Load Cell Response ·Linear Displac.ement Transducer
Max Min Top Bottom lb lb in in
107.5 65.2 .83/.75 .22/.21 I ' 112.5 i 68.6 .85/.78 .22/.21 !
113.0 68.1 .93/.85 .25/.24
113.0 68.1 .96/.88 .27/.26
119.4 72.1 .99/.90 .27/.26
119.4 72.1 1.08/1.00 .31/.30
119.9 72.1 1.13/1.05 .33/.32
I 125.3 75.1 1.15/1.07 .33/.32
I 124.8 75.6 1.28/1.17 .36/.35
125.3 75.1 1. 30/1.21 .38/.37
130.8 79.1 1. 34/1.24 .39/.38
130.8 79.1 1. 45/1.35 .43/.42
131.3 79.6 1.53/1.42 .46/.45
136.3 83.6 1.58/1.48 .48/.47
139.5 85.6 1.60/1.50 .49/.47
139.5 85.6 1. 79/1.70 .55/.53
139.5 85.6 1.90/1.80 .59/.58
147.0 89.6 1. 94/1.84 .60/.59
147.0 89.6 2.11/2.02 .66/.65
147.0 89.6 2.21/2.10 .69/.68
Rotation e
degrees
1.68
1.73
1.88
1.90
1.98
2.12
2.20
2.26
2.53
2.53
2.62
2.80 '
2.93
3.03
3.05
3.42
3.60
3.68
3.99
4.20

""'" (j\
I I I Time l ! I ~-J I 1240 ;I
. 1245
12so 1
12s1 1
12s6 I I
1302 I
! 1307
1312
1313 !
1318 I
1323
1324
1329
1334
1334
1339
1344
1344
1347
1348.5
Machine Signal
Conditioner
6.58
6.58
6.58
6.60
6.60
6.60
6.62
6.62
6.62
6.64
6.64
6.64
6.66
6.66
6.66
6.68
6.68
6.68
6.70
67.0
67.0
Machine
I Load
Setting lbs
I 50.0
50.0 ' 50.0
I 52.5
52.5
52.5
55.0
55.0
55.0
57.5
57.5
57.5
60.0
60.0
60.0
62.5
62.5
62.5
65.0
65.0
65.0
TABLE 10
DYNAMIC TEST ON 67% CLAY, 33% SAND
TEST #9 (Continued)
Load Cell Response I Linear Displacement Transducer I
I I Max Min Top Bottom lb lb in in 1
-.7~ 153.3 93.6 2.25/2.14
153.3 93.6 2.43/2.33 . 78/.77 i 153.3 93.6 2.54/2.43 .82/.81
161.0 98.5 2.57/2.46
I .83/.82
161.0 97.5 2.79/2.67 .91/.89 I
161.0 I 97.5
I 2.91/2.79 .94/.93 I
167.5 101.5 2.94/2.83 .96/.94
168.4 101.5 3.15/3.03 1.03/1.02
169.4 101.5 3.30/3.18 1.09/1.08
175.8 105.4 3.36/3.23 1.10/1.09
176.8 104.4 3.64/3.50 1. 20/1.19
175.8 105.4 3.80/3.66 1.26/1.24
183.2 109.4 3.86/3.72 1.27/1.26
182.3 108.4 4.13/3.99 1. 36/1.35 I I
183.2 108.4 4.29/4.15 1. 38/1.37 I
188.7 111.4 4.32/4.18 1. 39/1.37
188.7 111.4 4.59/4.44 1.46/1.44
188.7 111.4 4.79/4.64 1.53/1.53
196.0 116.3 4.83/4.67 1.53/1.53
196.0 115.3 5.02/4.86 1. 60/1.58
196.0 115.3 5.09/4.94 1.62/1.60
Rotation 8
degrees
4.25
4.53
4.73
4.78
5.17
5.41
5.44
5.82
6.07
6.20
6.68
6.97
7.10
7.58
7.97
8.03
8.55
8.92
9.02
9.28
9.47