Dynamic Modelling of Interstitial Laser Photocoagulation ...
213
DYNAMIC MODELLING OF iNTERSTITIAL LASER PHOTOCOAGULATION IN SOFT TISSUES By WILLIAM M. WHELAN, B.SC., M.SC. A Thesis Submitted to the School of Graduate Studies in Partial Fulfilment of the Requirements for the Degree Doctor of Philosophy McMaster University If) Copyright by William M. Whelan, September 1996 "
Transcript of Dynamic Modelling of Interstitial Laser Photocoagulation ...

DYNAMIC MODELLING OF iNTERSTITIAL LASER PHOTOCOAGULATION
IN SOFT TISSUES
By
WILLIAM M. WHELAN, B.SC., M.SC.
A Thesis
Submitted to the School of Graduate Studies
in Partial Fulfilment of the Requirements
for the Degree
Doctor of Philosophy
McMaster University
If) Copyright by William M. Whelan, September 1996
"

"
INTERSTITIAL LASER PHOTOCOAGULATION
"
'1

DOCTOR OF PHILOSOPHY (1996)(Physics)
Mdvt.lstl'r Uniwl'sit\'Hamilh'n. Ontario
"
TITLE: Dynamic Modelling of Interstitial Laser Photocoagulation in SOlt TissUl'S.
AUTI-IOR: William M. Whelan, B.Se. (Univ~rsity of Prince Edward Isl.lnli). M.St:.
(McMaster University)
SUPERVISOR: Douglas R Wyman, Ph.D., F.C.C.P.M.
NUMBER OF PAGES: xiv, 198
ii
ABSTRACT
Interstitial Laser Photocoagulation ULP) is a minimally invasive cancer
treatment technique whereby optical energy from an implanted optical fiber is
used to destroy small. solid tumours. In this work. an optical diffusion
...pproximation and heat transfer equations were used to develop dyn3mic models
of interstitial laser heating. Modifications in the thennophysical and optical
properties due to tissue coagulation IT ~ 60°0 and vaporization of tissue water
rr ~ 100°0 were incorporated into the physical description. In addition, the effect
of different blood perfusion approximations on temperature distributions for an
ill vivo liver model was explored. The calculational results presented indicate the
necessity to include dynamic modifications in the tissue biophysical ~nd blood
perfusion properties in future parametric investigations of the potential of ILP in
various tissues. A quasi-linear model of tissue charring during single fiber ILP
was derived. The increase in optic'll absorption at the fiber tip due to the
browning/charring process was modelJed as a linear continuous shift in energy
deposition from a point optical source to a point heat source. The tissue charring
temperature was estimated by placing experimentally measured charring
dimensions on calcul'lted temperature profiles. The potential for combining on
line thennometry with dynamic thennal modelling to reconstruct complete tissue
temperature distributions during ILP waS also investigated. Features of an on-line
temperature reconstruction system have been identified and the physical and
technical limitations explored.
iii.•.\,~,

ACKNOWLEDGEMENTS
I am sincerely grateful to my supervisor and mentor, Dr. Douglas W"Tn.ln.
for his support and guidance dUring my grJduate studies at McM.\stl'r Uniwrsity.
He is an exceptional person and an assN to the University community. 111.lllks
Doug.
Special thanks to my friends and colleagues in the Physics Dep'\l tml'nt5
at McMaster University and the Hamilton Regional Cancer Centre. Spl..'dfk\llly.
I acknowledge Ms. Wendy Malarek, Ms. Donna Laking, Ms. Ruth Ah~xander.Ms.
Karen Dougherty, Mr. John Blenkey and Mr. Alan Hazelhurst for their technical
support, and Dr. Mike Patterson, Dr. Tom Farreil, Dr. David Chettlc, Dr. Brian
Pogue and Dr. Alex Vitkin for their enlightening scientific discussions.
I would also like to acknowledge the financial support from McMaster
University and the Ontario Laser and Lightwave Research Centn>.
Most importantly, I thank my wife Michelle for her love and support,
which gave me strength during the difficult years. Finally, my daughter Hayley
deserves a BIG KISS. While writing this dissertation, I WllS II stlly-at-home tt<'ld,
playing with Hayley by day and typing by night-From age 6 months to 2 yellrs,
she accompanied me to colloquia, meetings and international conferences and "'<'IS
a proper little lady. Thanks munchkin!
iv

TABLE Of CONTENTS
Chapter 1. Introduction
1.1 Interstitial Laser Henting
1.2 Photothermal Injury
1.3 Controlling the Extent of Photothermal Injury
1.3.1 Prnctical Considerations
1.3.2 Optimiz..1tion of IrrJ.diation Parameters
1.3.3 lllermal Modelling
1.3.4 On-Line Tempernture Monitoring
1.3.5 On-Line Lesion Imaging
1.3.6 Temperature Reconstruction by Parameter Estimation
1.4 Scope of the Thesis
Chnpter 2. Bnckground Theory
2.1 Optical Propagation in Tissue
2.2 Bent Transfer in Tissue
2.3 l1lcl"!'"l1 Damage Prediction
2.4 Pammeter Estinmtion Formalism
Chnpter 3. Materials and Methods
3.1 Ex Vivo Bovine Muscle Heating ;xperiments ."
v
1
3
7
7
8
10
12
14
15
16
19
25
33
35
43

3.2 Solutions to HeJt TrJnsfer and Optic.ll Propagation Equations -1:->
3.2.1 I-D Homogeneous Tissues <QuJsi-An.llytk'al Solution) -IS
3.2.2 I-D Inhomogeneous Tissues <finite Difference Solution) -Ill
3.2.3 2-D Inhomogeneous Tissues (Finite Element Solution) 5.1
3.3 Modelling of Phase Changes during lnterstithl Laser
Photocoagulation 61
3.4 Modelling 11/ Villo ILP in Liver 63
3.5 Modelling Tissue Charring/Browning: Estimating Charring
Temperature 64
3.6 Temperature Reconstruction Algorithm 68
Chapter 4. Results
4.1 I" Vivo ILP Simulations in Liver 73
4.2 Estimation of Tissue Charring Temperature Ex vivo 96
4.3 Photocoagulation in Bovine Muscle Ex vivo <It SOD nm <lnd 1064 nm 110
4.4 Temperature Reconstruction during Simulated ILP 115
4.4.1 1-D Homogeneous Test Cnses 115
4.4.1.1 OptimiZiltion of Temperature Acquisition Pnr<lmetcrs 117
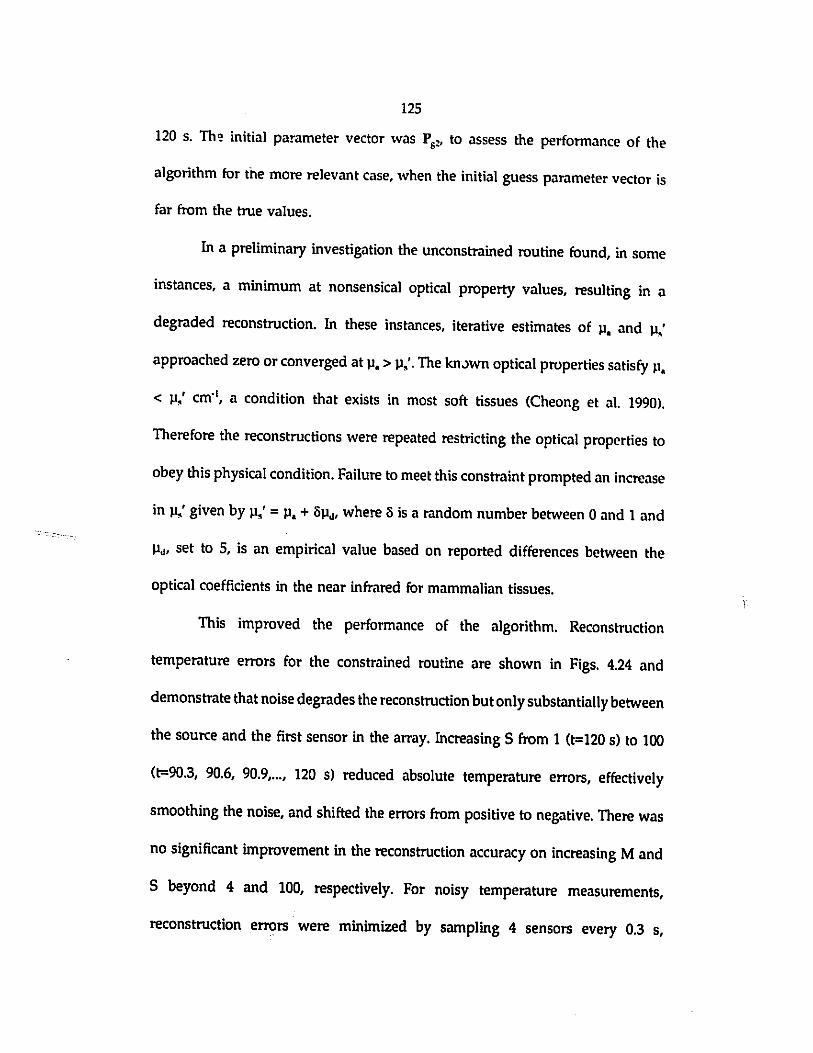
4.4.1.2 Transient Sampling and Random Noise 124
4.4.1.3 Accuracy of Parameter Estimates 127
4.4.1.4' Sensor Placement Errors 133
4.4.1.5 Random Tissue Parameter Sets 135
4.4.2'1-0 Inhomogeneous Test Cases 136
4.4.2.1 Static Tissue Discretization 136
vi

4.4.2.2 Dynamic Tissue Discretization 146
4.4.J 2-D Inhomogeneous Test Cases 163
4.5 Temperature Reconstruction Durin& iU' in Bovine Muscle Ex vivLl 168
ChLlptcr 5. Conclusions LInd Future Considerations 176
5.1 Dynamic Models of ILl' 176
5.2 Estimating Tissue Chilrring Temperature 179
5.3 Temperature Reconstruction 180
Appendix 185
RefNcnCe$ 1S7
vii

\'
LIST OF FIGURES
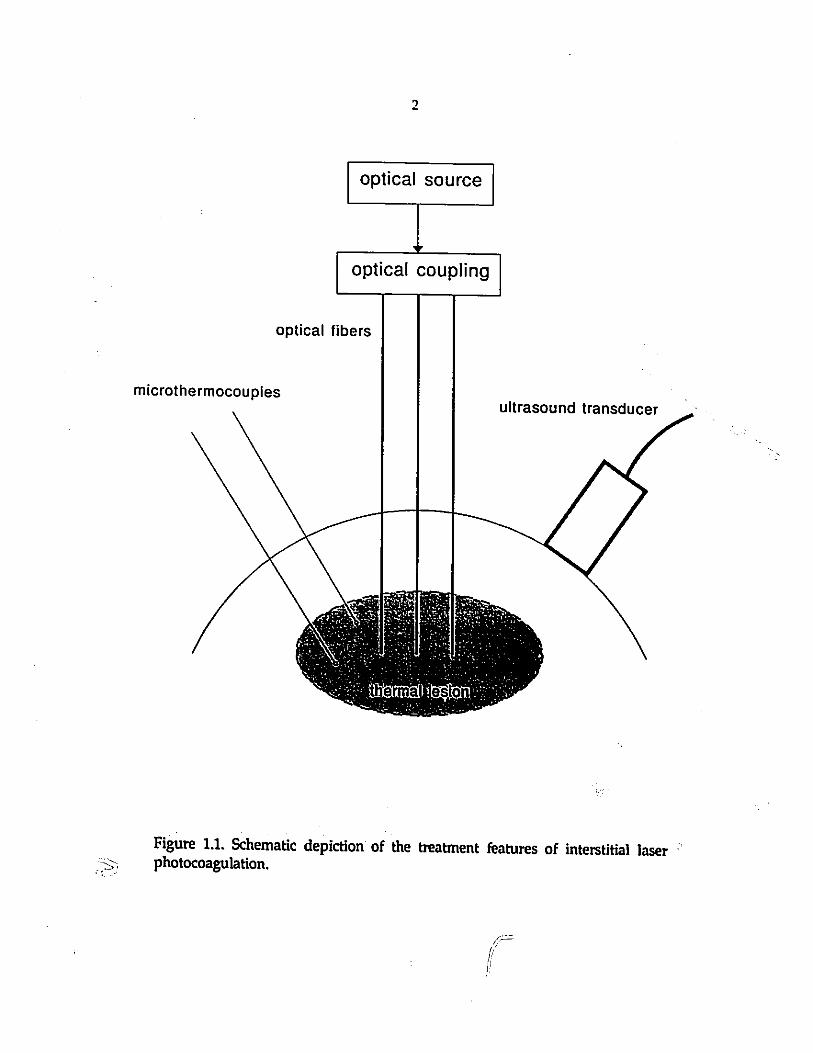
Figure 1.1. Schematic depiction of the treatment features ofinterstitial laser photocoagulation.
Figure 1.2. Diagrammatic representation of a typical thermal lesion incross-section.
Figure 2.1. The absorption spectrum for \'ariou~ biological substances.
Figure 3.1. Apparatus for ex l'izro heating experiments in bovine muscle.
Figure 3.2. Optical fiber and microthermocouple <lTray geometry forex vivo heating experiments in bovine muscle.
Figure 3.3. Finite differencing scheme.
Figure 3.4. Triangular element, (e), and associated shape functions.
Figure 3.5. 2-D square grid mesh used to generate finite clementsolutions.
Figure 3.6. Iterntive temperature reconstruction algorithm.
Figure 3.7. Transient temperature reconstruction sdleme.
Figure 4.1. Analytical and finite difference temperature calculations for ahomogeneous sphere.
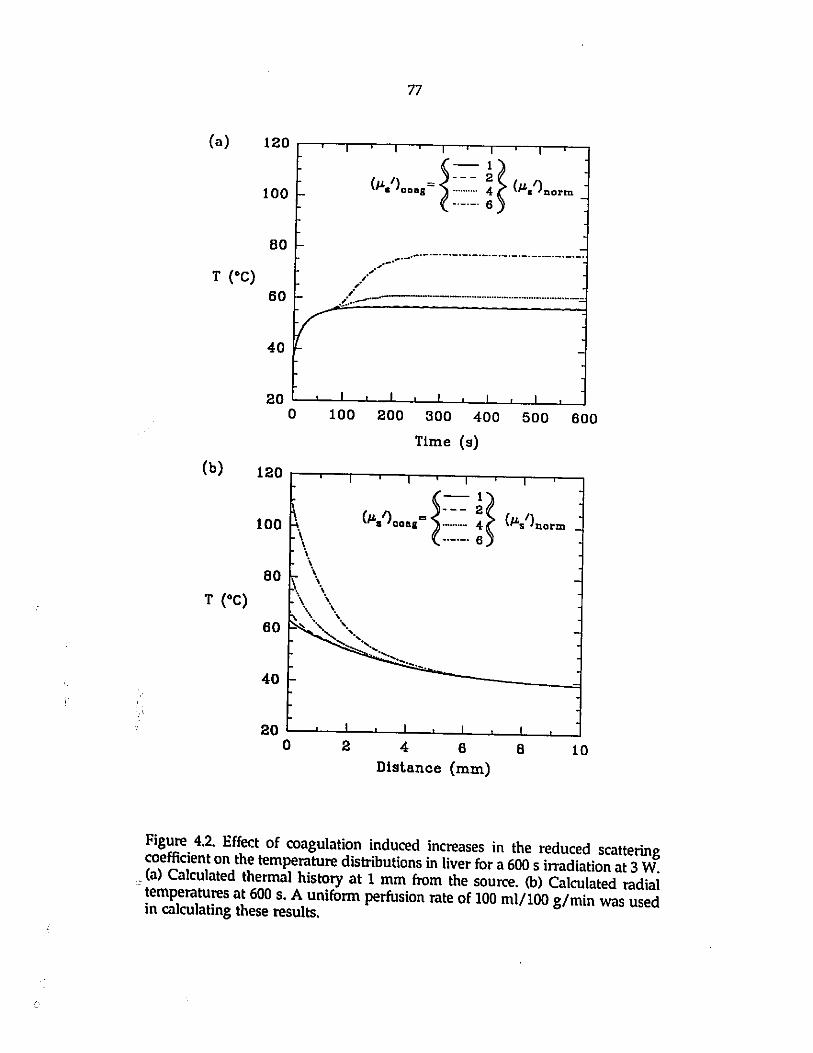
Figure 4.2. Effect of coagulation-induced increases in the reducedscattering coefficient on the temperature distributions in liver.
Figure 4.3. Predicted coagulation diameter and energy deposition ratein liver.
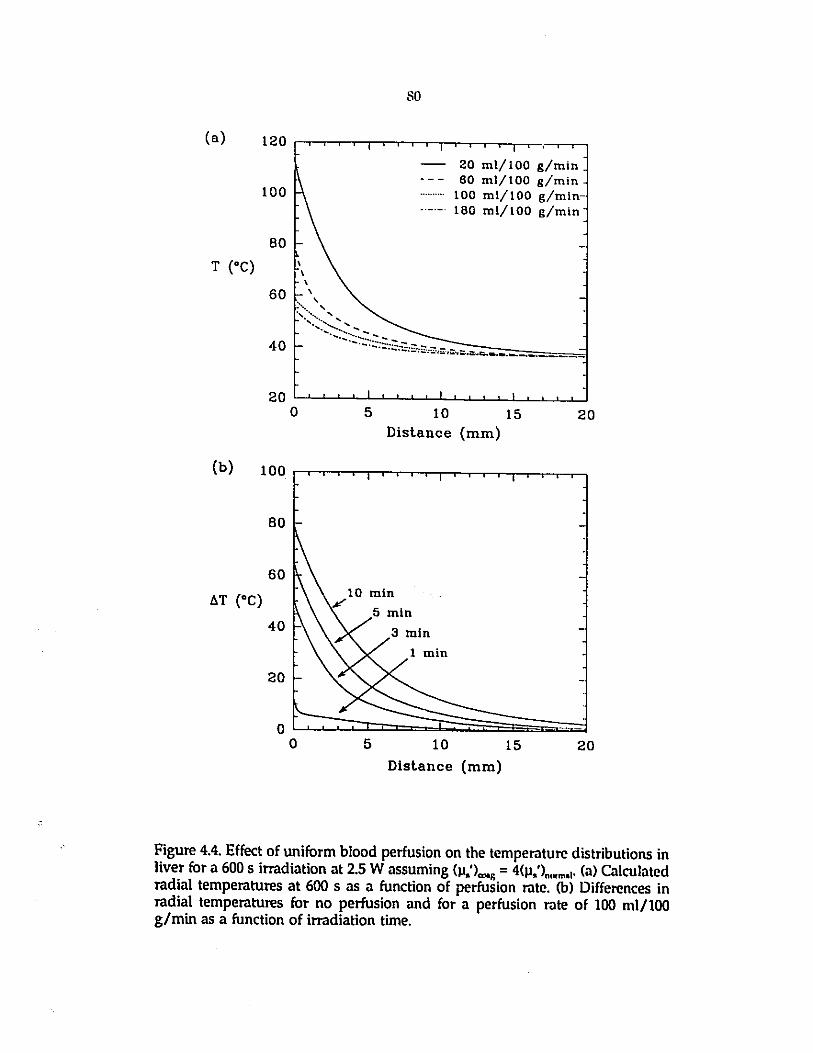
Figure 4.4. Effect of uniform blood perfusion on the temperaturedistributions in liver.
Figure 4.5. Static and dynamic approximations for blood perfusionpatterns.
--.:
viii
p'l&l'
")
:;
-23
44
47
51
56
62
70
72
75
77..,>
78
80
82-~,
' ..., .\

Figure 4.6. Effect of perfusion patterns on temperature distributions inIiwr.
Figure 4.7. Prctlicted thermal damage dimensions in liver.
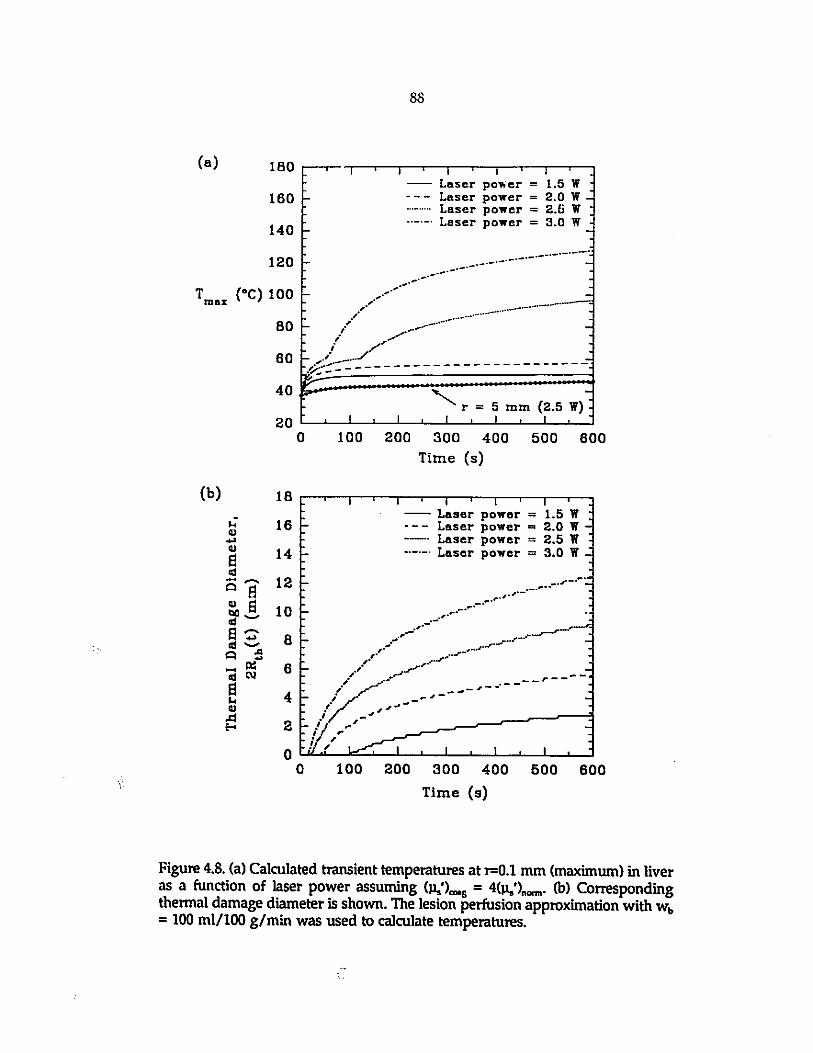
Figure 4.8, Calculated transient temperatures and thermal damagediml'nsions in liver as a function of laser power.
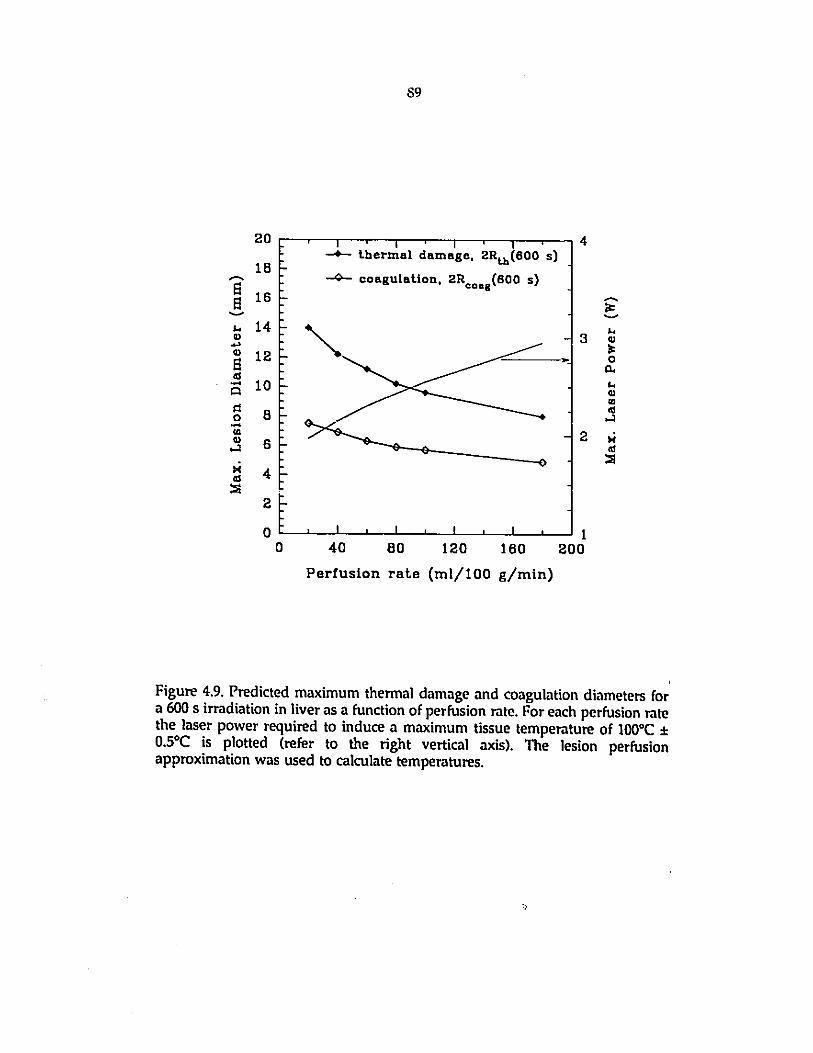
Figure 4.9. Predicted maximum thermal damage and coagulation diametersin liver.
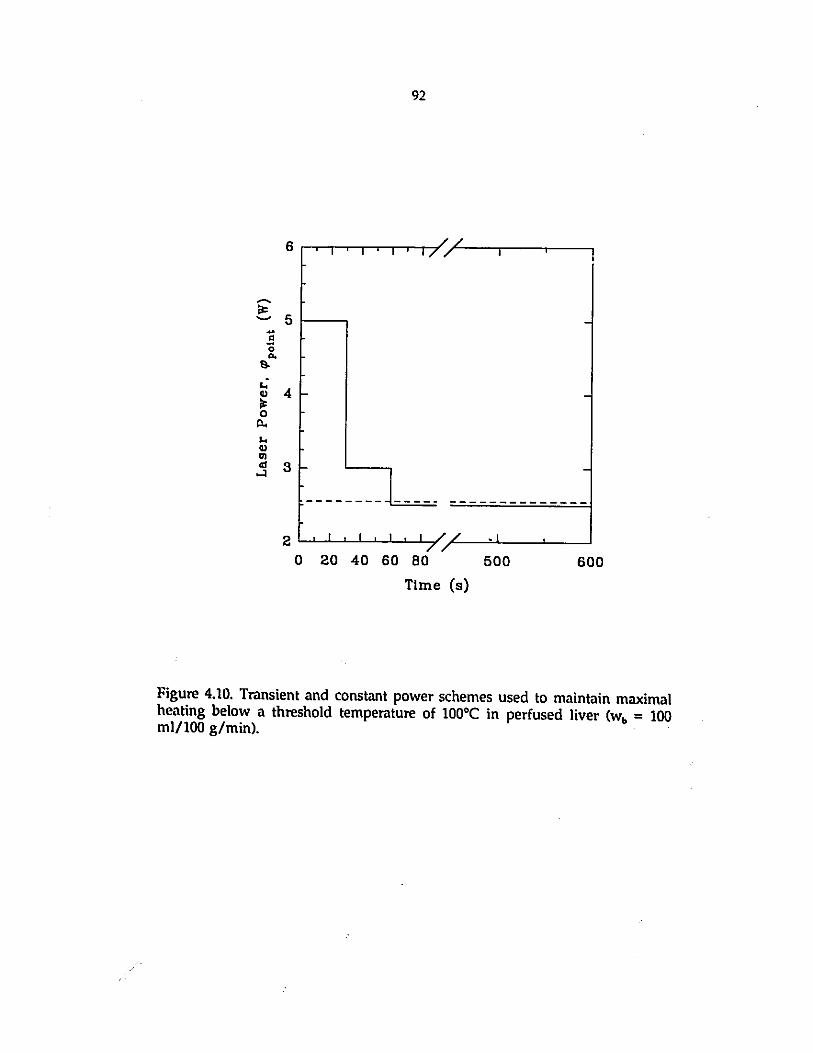
Figute 4.10. Trunsient and constant laser power sche~nes.
Fi~url' 4.11. Maximum tissue temperature histories and correspondingthermal damage diameters in liver.
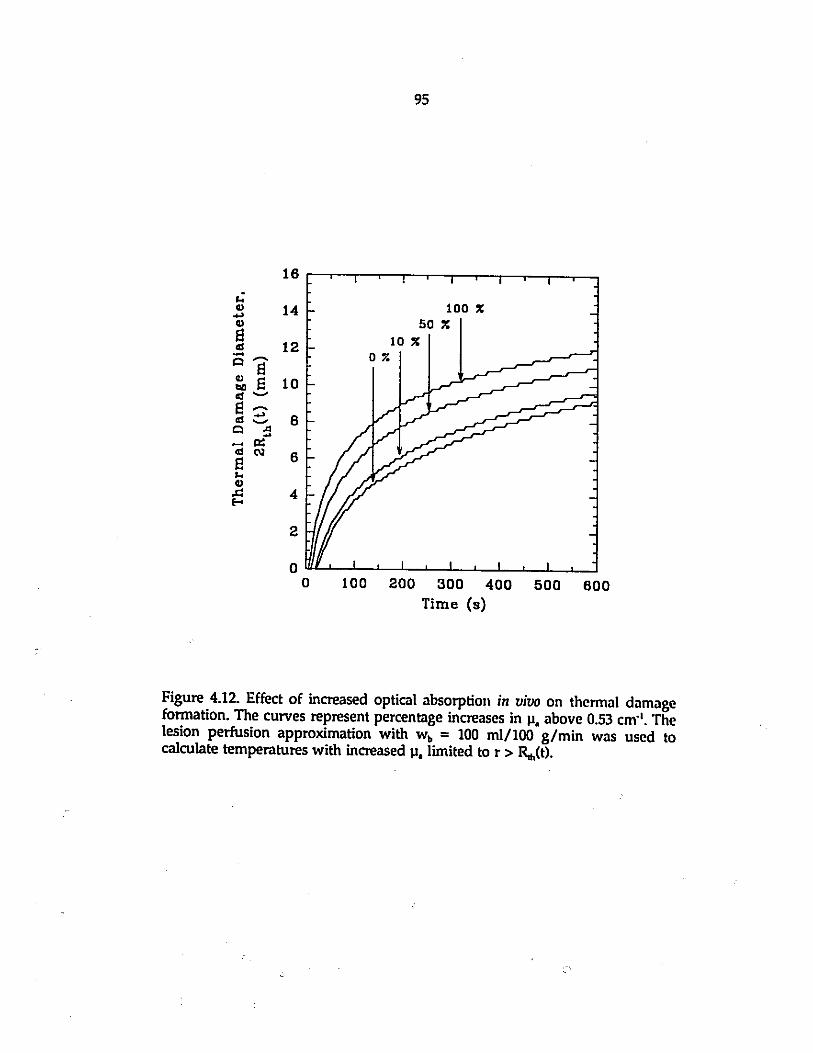
Fi~url' 4.12. Effect of increased optical absorption in vivo. due to blood.on tlll'rmal damage fomlation in liver.
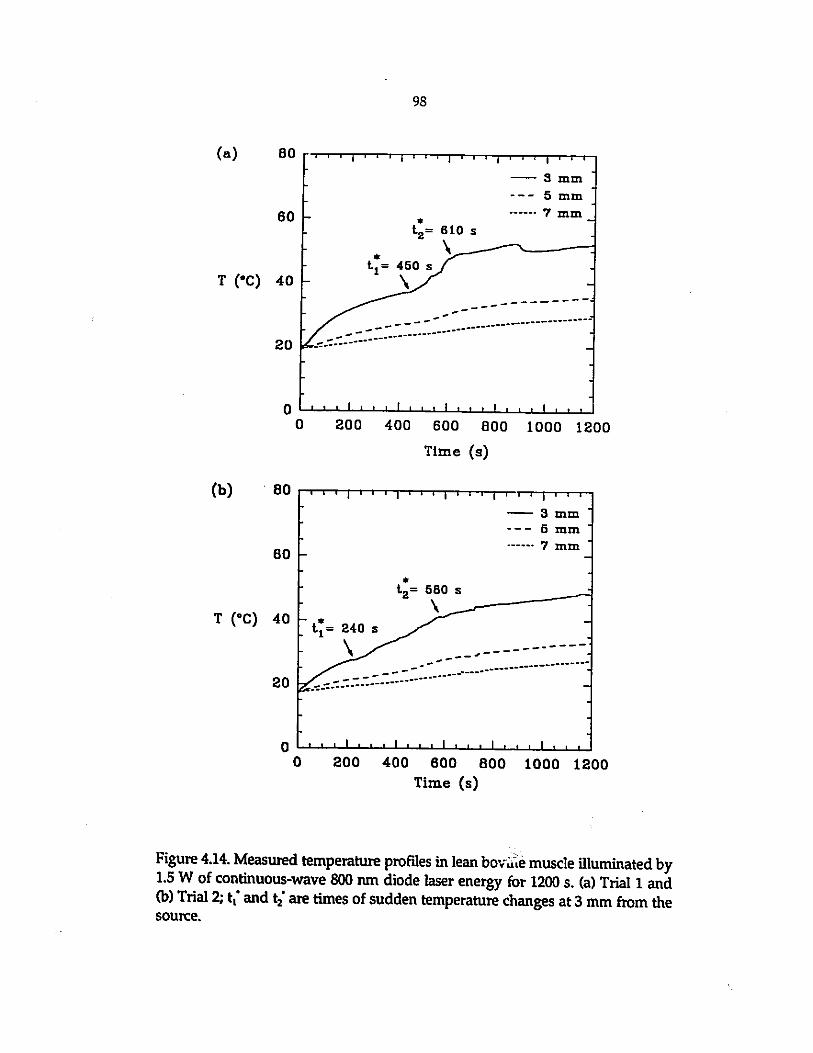
Figure 4.13. MCllSUrcd temperature profiles in lean bovine muscleat 1064 nm.
Figure 4.14. Measured temperature profiles in lean bovine muscleat SOD nm.
Figure 4.15. Calculated themlal history at r = 1 mm for theto64 nm illuminations.
Figure 4.16. Cllculated thermal history at r =3 mm for the1064 nm illuminations.
Figure 4.17. Calculated Tdoat using the tissue browning model for the1064 nm illumination.
Figure 4.18. Single fiber ILP 'lesions in bovine muscle ex vivo.
Figure 4.19. Calculated energy deposition rates in bovine muscle for810 nm and 1064 nm optical energy.
Figure 4.20. Success in reconstructing a simulated ILP test case.
Figure 4.2'1. Success rotes detennined for each investigated choice<tcquisition p<trameter.
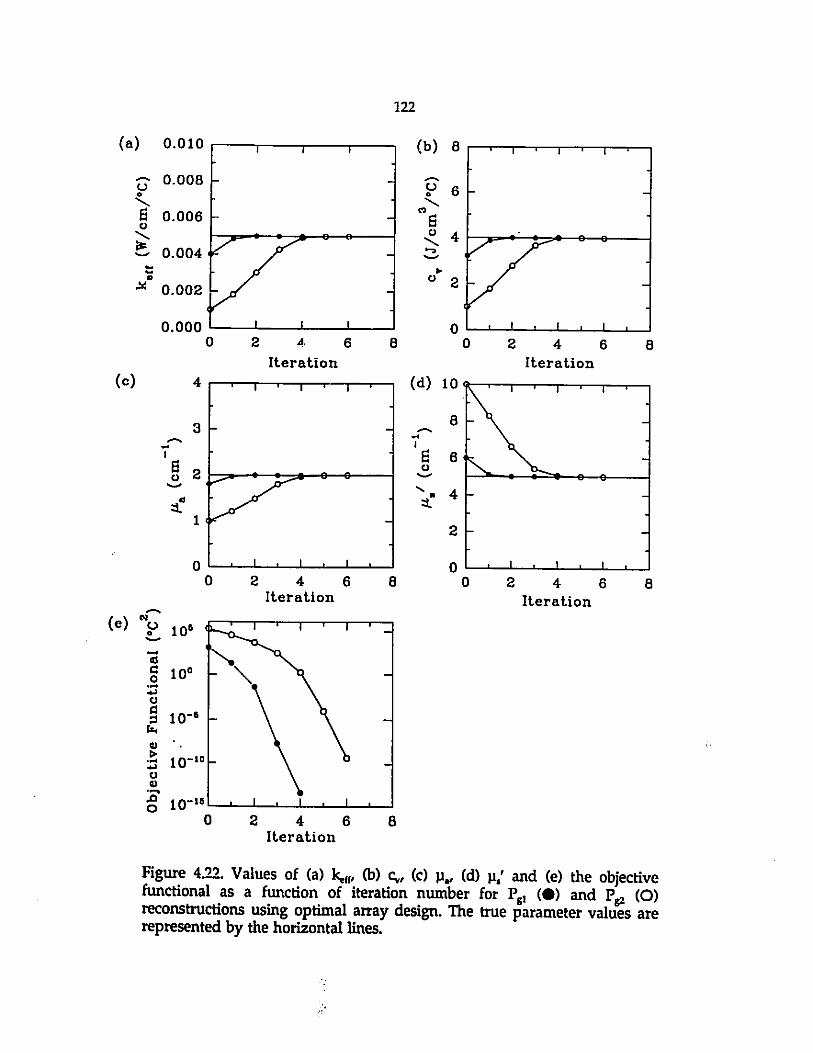
Figure 4.22. Values of the thennophysical and optical properties andobjective functional as a function of iteration number.
ix
84
85
88
89
92
93
95
97
98
102
103
108
111
114
119
120
122
Ii
Ii

Figure 4.23. Radial temperature errors for reconstntctions of .1
simulated lLP test case. 12:1
Figure 4.24. True temperature profile and radial temper.1ture errorsfor reconstructions of a simulated ILP test case with noise addedto measured temperature data. 126
Figure 4.25. Parameter estimates. 128
Figure 4.26. Values of the themlophysical and optical properties andobjective functional as a function of iteration number. 130
Figure 4.27. Relative mdial parameter sensitivities. 132
Figure 4.28. Radial temperature errors for reconstructions of asimulated ILP test case with sensor placement errors. 134
Figure 4.29. Static tissue discretization scheme. 1:18
Figure 4.30. True radial temperature profiles aud reconstructedradial temperature errors for a simulated ILP test case. 139
Figure 4.31. Values of the thennophysical and optical prop~rties. 141
Figure 4.32. Values of the thermophysical properties as a functionof array-source distance. 142
Figure 4.33. Relati'le radial parameter sensitivities. 144
Figure 4.34. Dynamic tissup. discretization scheme. 147
Figure 4.35. Predicted coagulation radius in bovine muscle t'X vivo. ISO
Figure 4.36. Vi:.lues of F" as a function of sensor sampling for asimulated ILP test case. 152
Figure 4.37. Reconstructed radial temperature error~.-(lS a functionof At..'C. 154
Figure 4.38. Reconstructed radial temperature errors as a functionof sensor sampling for a simulated ILP test case. 156
Figure 4.39. Algorithm-predicted R-.s(t) for a simulated ILP testcase as a function of sensor sampling. . 158
Figure 4.40. Reconstructions of a simulated ILP test case for dynamic2 zone parameter estimation as a function of random noise level. 159
x

c
Figure 4.41. Reconstructions of the simulated ILP test case withp<lrameter estim<ltes constrained. 161
figure 4.42. Analytical and finite element temperature calculationsfor an infinite line source. 164
Figure 4.43. Source-sensor array geometries used to reconstructtemperatures during simulated ILP in liver ex vivo. 166
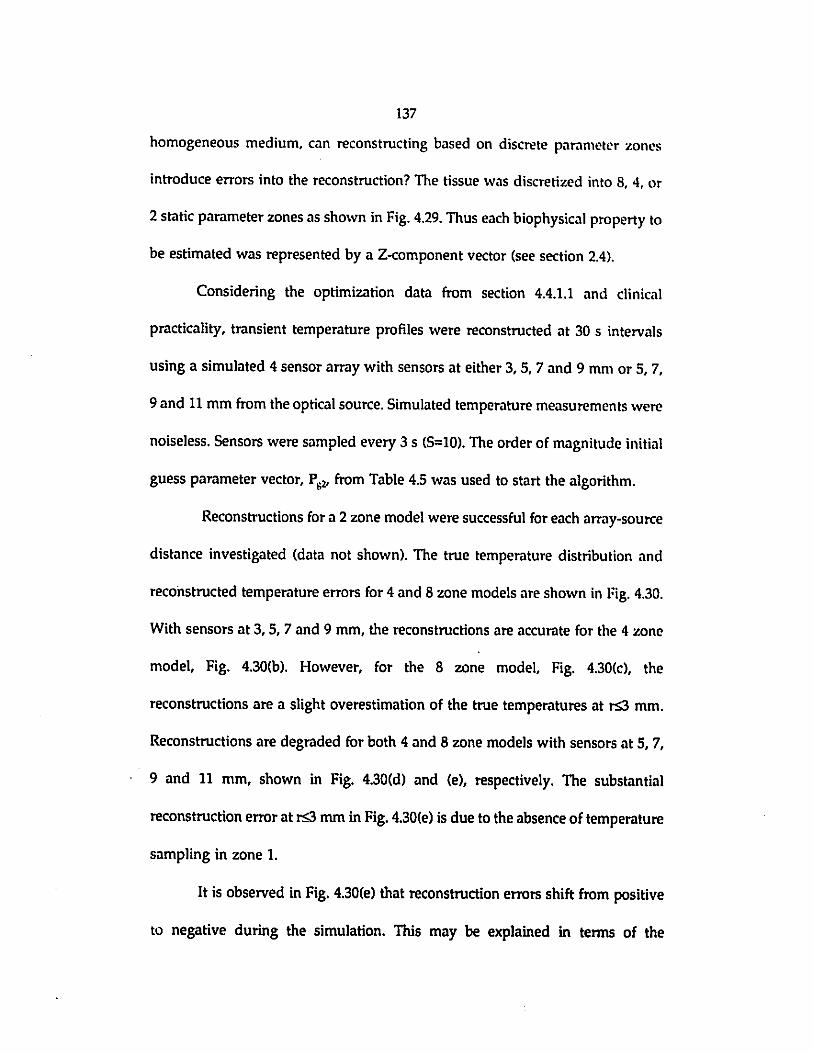
Figure 4.44. Reconstructions of simulated ILP in liver ex vivo as afunction of source-sensor geometry.
figure 4.45. 2-D tissue parameter distributions. 169
figure 4.46. True temperature distributions and temperature differencesbetween homogeneous and inhomogeneous parameter distributions. 170
Figure 4.47. Measured ex vivo transient temperature profiles in bovinemuscle and reconstructed temperatures for dynamic 3 zoneparameter estimation. 172
Figure 4.48. Measured ex uiuo transient temperature profiles in bovinemuscle and reconstructed temperatures for dynamic 3 zoneparameter estimation. 174
,.
xi

TABLES
Table 2.1. Thermal penetration depths in various soft tissues. 32
Table 4.1. Thennophysical and blood perfusion properties ..nd optic..1properties of liver. 74
Table 4.2. Optical and thermophysical properties of ex vivo bovinemuscle. 101
Table 4.3. Estimates of tissue charring temperature. 106
Table 4.4. Measured coagulation widths for ILP in bovine muscle ..t800 nm and 1064 nm. 112
Table 4.5. True and 2 sets of initial guess parameter vectors. 116
Table 4.6. True and 2 sets of initial guess parameter vectors. 149
xii

NOMENCLATURE

R.:...~(t) Tissue coagulation radius (mm).
R.'.rr~t) Tissue water vapori7..ation radius (mm).
. ~(t) Thermal damage radius (mm).
"~.'~. '<:
'-.. "
5
t
Number of sensor samples.
Time (s).
Reconstruction time interval (sl.
'. <,
Ten•r Tissue charring temperature (0C).
T~'fr Reconstruction temperature error (Oe).
Tm.... Measured tissue temperature (0C).
Tl'fi'\l Predicted tissue temperature (Oe).
J Jacobian matrix.
Z Number of spatial parameter zones.
~J"'lnt Total power from a point optical source (W).
~linl! Total power from a line optical source (W).
Optical irradiance (W Icm2).
).1. . Absorption coefficient (em· I).
~' Reduced scattering coefficient (cm· I).
Ptr Total transport coefficient (em·I ).
P',P Optical interaction coefficients (cm· I).
Regularization parameter.
".:..-
p
a
Density of tissue (g/cm3).
Linear interpolation function.
Cl> Weighting function.
xiv