Dynamic Modeling and Control of a Hybrid Hydronic Heating ...
115
Dynamic Modeling and Control of a Hybrid Hydronic Heating System YiTeng, Ma A thesis in Department of Building, Civil and Environmental Engineering Presented in Partial Fulfillment of the Requirements For the Degree of Master of Applied Science (Building Engineering) at Concordia University Montreal, Quebec, Canada © YiTeng Ma, 2013
Transcript of Dynamic Modeling and Control of a Hybrid Hydronic Heating ...

Dynamic Modeling and Control of a Hybrid Hydronic
Heating System
YiTeng, Ma
A thesis in
Department of Building, Civil and Environmental Engineering
Presented in Partial Fulfillment of the Requirements For the Degree of Master of Applied Science (Building Engineering) at
Concordia University Montreal, Quebec, Canada
© YiTeng Ma, 2013

ii
CONCORDIA UNIVERSITY
School of Graduate Studies
This is to certify that the thesis prepared by
By: Yi Teng Ma
Entitled: Dynamic Modeling and Control of a Hybrid Hydronic Heating System
and submitted in partial fulfillment of the requirements for the degree of
Master of Applied Science (Building Engineering)
complies with the regulations of the University and meets the accepted standards with
respect to originality and quality.
Signed by the final examining committee:
____________________________________Chair Dr.S.Li
____________________________________Supervisor Dr.M.Zaheeruddin
____________________________________Examiner External (to program) Dr.M.Y.Chen
____________________________________ Examiner Dr.S.Li
____________________________________ Examiner Dr.L.Wang
Approved by ____________________________________ Dr. M. Elektorowicz, GPD Department of Building, Civil and Environmental Engineering
____________________________________ Dr. C. W. Trueman, Interim Dean Faculty of Engineering and Computer Science Date ____________________________________

iii
ABSTRACT
Dynamic Modeling and Control of a Hybrid Hydronic Heating
System
Yiteng Ma
A dynamic model of a hybrid hydronic heating system has been developed. Simulations
of the control strategies and the model-based energy analysis for the overall system have
been presented in this thesis. The hybrid hydronic system is composed of a conventional
natural gas fired boiler hot water heating and a ground source heat pump system. The
overall system consists of several components such as a boiler, a heat exchanger, a
ground loop heat pump, a ground loop heat exchanger, baseboard heaters, and radiant
floor hydraulic piping systems. The system model was described by nonlinear differential
equations, which were programmed and solved using MATLAB.
Two control strategies for improving the overall system performance were explored: (i) a
conventional PI control, and (ii) an adaptive gain control. The simulation results subject
to set-point changes showed that the performance of the adaptive controller is better than
the fixed gain PI controller in disturbance rejection and stability.
Energy simulations under three different operating strategies were conducted: (i) a
conventional fixed set-point PI control, (ii) an outdoor air temperature reset control, and
(iii) an optimal set-point PI control. It was shown that the outdoor temperature reset
strategy can save 4.5% and 19.9% energy under cold day and mild day conditions
compared to the conventional fixed set-point PI control strategy. In addition, the

iv
implementation of the optimal PI control strategy result in higher energy savings 6.6%
and 22% as compared to the base case under cold and mild day conditions, respectively.
ACKNOWLEDGEMENTS
I would like to express my sincere gratitude to Dr. M. Zaheer-Uddin for his
invaluable and constant guidance, help, encouragement, sustained interest, and financial
support throughout the whole span of this thesis.
My thanks are also to my colleagues, Lianzhong Li, Min Ning and Songchun Li, for
their assistance and guidance in my study. I also express my sincere appreciations to the
staff in BCEE department.
I would like to dedicate this thesis to my parents, Yanlong Ma, and Xuegang Li, as
well as my girl friend, Huirong Lu, for their patience, understanding and support during
my whole studies.

v
TABLE OF CONTENTS
List of Figures……………………………………………………….………x
List of Tables……………………………………………………….……...xii
Nomenclature………………………………………..……………….……xiii

vi
Chapter 1 Introduction ................................................................................... 1
1.1 Introduction ............................................................................................ 1
1.2 The scope and objectives ....................................................................... 2
1.3 The thesis organization .......................................................................... 3
Chapter 2 Literature Review .......................................................................... 4
2.1 Introduction ............................................................................................ 4
2.2 Steady state and dynamic models of hydronic heating systems ............ 4
2.2.1 Boiler and heater models.......................................................................... 4
2.2.2 Heat pump models ................................................................................... 5
2.2.3 Ground-coupled heat exchanger models .................................................. 8
2.2.4 Radiant floor heating system models ..................................................... 10
2.3 A review of control strategies for hydronic heating systems ............... 13
Chapter 3 Dynamic Models of Hybrid Hydronic Heating System .............. 15
3.1 Introduction .......................................................................................... 15
3.2 Physical model of the system ............................................................... 15
3.3 The formulation of dynamic model ..................................................... 18

vii
3.3.1 Commercial zone model ........................................................................ 18
3.3.2 Building enclosure model ...................................................................... 20
3.3.3 Baseboard heater model ......................................................................... 22
3.3.4 Residential zone model .......................................................................... 23
3.3.5 Floor slab model ..................................................................................... 25
3.3.6 Ground loop heat exchanger model ....................................................... 32
3.3.7 Heat pump model ................................................................................... 39
3.3.8 Heat exchanger model ............................................................................ 40
3.3.9 Boiler model ........................................................................................... 41
3.3.10 Heat losses from the water distribution pipe network ......................... 41
3.4 Open loop simulations of the system ................................................... 42
Chapter 4 Proportional-Integral and Adaptive Control of Hybrid Source
Hydronic Heating System .............................................................................. 48
4.1 Introduction .......................................................................................... 48
4.2 The effects of load disturbances on the residential and commerdcial
zones ........................................................................................................... 52
4.3 Fixed gain PI control of zone air temperatures .................................... 54

viii
4.4 Simulation results for the adaptive PI control ...................................... 56
Chapter 5 Control Strategies for Improved Energy Efficiency of Hybrid
Hydronic Heating System .............................................................................. 63
5.1 Introduction .......................................................................................... 63
5.2 Conventional fixed set-point control strategy ...................................... 63
5.3 Outside air temperature reset control strategy ..................................... 65
5.4 Optimal set-point control strategy ........................................................ 68
5.5 Energy consumption ............................................................................. 74
5.6 Summary .............................................................................................. 77
Chapter 6 Contributions, Conclusions, and Recommendations for Future
Research ......................................................................................................... 79
6.1 Conclusions and contributions ............................................................. 79
6.1.1 Dynamic modeling of the hybrid source hydronic heating system ....... 79
6.1.2 Adaptive control of hybrid hydronic system ......................................... 80
6.1.3 Energy simulation under three different control strategies .................... 80
6.2 Recommendations for future research ................................................. 81

ix
References ...................................................................................................... 82
Appendices .................................................................................................... 86

x
LIST OF FIGURES Figure 3.2.1 Commercial and residential floor layout ...................................................... 16 Figure 3.2.2 All boiler heating system layout ................................................................... 17 Figure 3.2.3 Hybrid source hydronic heating system layout ............................................ 18 Figure 3.3.1 Schematic diagram of the reversed return hot water system loop ................ 19 Figure 3.3.2 Structure of exterior wall .............................................................................. 21 Figure 3.3.3 Schematic diagram of the radiant floor heating system loop ....................... 23 Figure 3.3.4 Plan view of embeded tube........................................................................... 25 Figure 3.3.5 Structure of floor slab ................................................................................... 26 Figure 3.3.6 Thermal network analysis for the ground loop heat exchanger describing heat and mass transport processes in a vertical direction ....................................................... 33
Figure 3.3.7 Horizontal cross-section view of the single U-tube ..................................... 33 Figure 3.4.1 System open loop test at design condition (-15 o C outside air temperature)43 Figure 3.4.2 System open loop test for the heat pump temperature responses at design
condition (-15 o C outside air temperature)............................................................... 44 Figure 3.4.3 Supply water temperature of boiler and heat exchanger under different
outside air temperature .............................................................................................. 46 Figure 3.4.4 Effect of entering source temperature on COP............................................. 47 Figure 4.1.1 Schematic diagram of hybrid source hydronic heating system control loop
for space heating ....................................................................................................... 49 Figure 4.1.2 Boiler control loop ........................................................................................ 49 Figure 4.1.3 Heat exchanger control loop ......................................................................... 50 Figure 4.1.4 Heat pump control loop ................................................................................ 50 Figure 4.1.5 Commercial zone control loop ..................................................................... 51 Figure 4.1.6 Residential zone control loop ....................................................................... 51 Figure 4.2.1 Outdoor air temperature profile .................................................................... 53 Figure 4.2.2 Residential and commercial zone air temperature responses with no control
................................................................................................................................... 53 Figure 4.3.1 Validation of the constant gain values of PI controllers for the residential and
commercial zone temperature control ............................................................................. 55 Figure 4.4.1 Validation of the adaptive PI controllers for the residential and commercial
zone temperature control........................................................................................... 58 Figure 4.4.2 Comparison of controller responses with adaptive control (a-b) and fixed gain
control (c-d) for the residential zone subject to step change in 2 o C and a outside air temperature profile from -15 o C to -5 o C ................................................................ 59

xi
Figure 4.4.3 Comparison of controller responses with adaptive control (a-b) and fixed gain control (c-d) for the residential zone subject to step change in 2 o C and a outside air temperature profile from -5 o C to 5 o C.................................................................... 60
Figure 4.4.4 Temperature responses of the boiler, heat exchanger, and heat pump control loops for adaptive control ......................................................................................... 62
Figure 5.2.1 Output responses of residential and commercial zone (fixed set-point control strategy)........................................................................................................................... 64
Figure 5.2.2 Output responses of boiler and heat exchanger (fixed set-point control strategy)..................................................................................................................... 65
Figure 5.3.1 Outside temperature reset profile for boiler, heat exchanger and heat pump 66 Figure 5.3.2 Output responses of residential and commercial zone (outside air
temperature reset strategy) ........................................................................................ 67 Figure 5.3.3 Output responses of boiler and heat exchanger (outside air temperature reset
strategy)........................................................................................................................... 67 Figure 5.4.1 Comparison between the simplified aggregated model and the detailed full
order model ..................................................................................................................... 71 Figure 5.4.2 Optimal set-point temperature profile for boiler, heat exchanger and heat
pump ....................................................................................................................... 72 Figure 5.4.3 Output responses of residential and commercial zone (optimal control
strategy)..................................................................................................................... 73 Figure 5.4.4 Output responses of boiler and heat exchanger (optimal control strategy) .. 74

xii
LIST OF TABLES Table 3.1 Physical properties and operating conditions of the radiant flor heating system
................................................................................................................................... 32 Table 3.2 Geometrical data, physical properties and operating conditions of the ground
loop heat exchanger .................................................................................................. 39 Table 5.1 Energy comparison of different operating methods (system based) under high
heating low demand and low heating load demand conditions ................................ 76 Table 5.2 Energy comparison of different operating methods (system based) under high
heating low demand and low heating load demand conditions ................................ 77

xiii
NOMENCLATURE multiplier of the adaptive controller proportional term A1 slab area on top of each RFH tube node (m2) A2 slab area on top of each RFH concrete node (m2) Aex heat transfer area of the heat exchanger (m2) Af net cross-sectional area of the ground loop water node (m2) Ag net cross-sectional area of the grout node (m2) Asi net cross-sectional area of the soil node (m2) Awinci window area of commercial zone i (m2) Awinri window area of residential zone i (m2) Awnci net wall area of commercial zone i (m2) Awnri net wall area of residential zone i (m2) az zone heat loss coefficient cair specific heat of air (J/kg℃) Cb thermal capacity of boiler (J/℃) Cc thermal capacity of the water stored in the heat pump condenser (J/℃) Ccc1 thermal capacity of the RFH concrete node horizontally from the tube for
each control volume (J/℃) Ccc2 thermal capacity of the RFH concrete node vertically from the tube for each
control volume (J/℃) Ccc3 thermal capacity of the RFH concrete node one top of each concrete node in
the tube layer for each control volume (J/℃) ccon specific heat of slab concrete (J/kg℃) Ce thermal capacity of the water stored in the heat pump evaporator (J/℃) cflo specific heat of floor covering material (J/kg℃) Cflo1 thermal capacity of the floor covering node on top of the tube for each
control volume (J/℃) Cflo2 thermal capacity of the floor covering node on top of the concrete node for
each control volume (J/℃) Cfluid thermal capacity of the water inside the ground loop for each control volume
(J/℃) cg specific heat of grout (J/kg℃) Cgrout thermal capacity of the grout (J/℃) Ch1 thermal capacity of the water stored in primary side of the heat exchanger
(J/℃) Ch2 thermal capacity of the water stored in secondary side of the heat exchanger
(J/℃) Chtri thermal capacity of the baseboard heater i (J/℃) cs specific heat of soil (J/kg℃) Csoili thermal capacity of the soil layer i (J/℃)

xiv
cw specific heat of water (J/kg℃) Cw thermal capacity of the water inside the radiant floor piping for each control
volume (J/℃) Cwl thermal capacity of exterior wall brick layer (J/℃) Czci thermal capacity of commercial zone i (J/℃) Czri thermal capacity of residential zone j (J/℃) dair density of air (kg/m3) dbore borehole diameter (m) dcon density of slab concrete (kg/m3) dflo density of floor covering material (kg/m3) dg density of grout (kg/m3) di,g inner diameter of the ground loop tube (m) di,r inner diameter of the RFH tube (m) do,g outer diameter of the ground loop tube (m) do,r outer diameter of the RFH tube (m) dpbore borehole depth (m) ds density of soil (kg/m3) dw density of water (kg/m3) e error eb boiler efficiency (%) Ecom heat pump compressor power (w) Fen-p Radiation angle factor between the surface node and enclosure hv heating value of fuel (J/kg) hw convection heat transfer coefficient of water inside pipe (w/m2℃) kai adaptive integral gain kap adaptive proportional gain kf thermal conductivity of the ground loop fluid (w/m℃) kg thermal conductivity of the grout (w/m℃) ki integral gain ko predictive gain of the outside air temperature kp proportional gain kpipe thermal conductivity of the ground loop piping (w/m℃) ks thermal conductivity of the soil (w/m℃) kt thermal conductivity of the RFH tube (w/m℃) kw thermal conductivity of the water (w/m℃) Lbore center to center distance between two boreholes (m) Li length of RFH pipe segment (m) LMTD logarithmic mean temperature difference (℃) LMTDd logarithmic mean temperature difference of heat exchanger at design
condition (℃) LMTDex logarithmic mean temperature difference of heat exchanger (℃)

xv
mfmax maximum flow rate of fuel (kg/s) mw water flow rate (kg/s) n factor identified based on heater heat transfer test N1 number of bores in each series circuit N2 number of bores in each parallel circuit Qbd boiler capacity (w) Qhc total design heating load of commercial zone (w) Qhczi design heating load of commercial zone i (w) Qhr total design heating load of residential zone (w) Qhrzi design heating load of residential zone i (w) Qintci internal heat gain for commercial zone i (w) Qrad,conv,i radiative/convective heat transfer from radiant floor slab of zone i (w) Qsolci transmitted solar radiation for commercial zone i (w) Qsolri transmitted solar radiation for residential zone i (w) s shank space between two tubes of ground loop (m) St interval between RFH tubes (m) Tb supply water temperature of boiler (℃) tc Thickness of the floor slab covering layer (m) Tc1i concrete node temperature of RFH in the tube layer (℃) Tc2i concrete node temperature of RFH in the concrete layer on top of each tube
(℃) Tc3i concrete node temperature of RFH in the concrete layer on top of the
concrete node in the tube layer (℃) Tcred commercial zone design return water temperature (℃) Tcspd commercial zone design supply water temperature (℃) Ten area-average interior surface temperature, excluding the slab surface
temperature (℃) Texred primary side return water temperature from the heat exchanger at design
condition (℃) Texsp supply water temperature to the heat exchanger (℃) Texspd primary side supply water temperature to the heat exchanger at design
condition (℃) Tflo1i floor covering node temperature on top of each concrete node on top of each
tube (℃) Tflo2i floor covering node temperature on top of each concrete node (℃) Tgbi grout wall temperature of ground loop of segment i (℃) Tgr1i grout temperature of ground loop on the down pipe side of segment i (℃) Tgr2i grout temperature of ground loop on the up pipe side of segment i (℃) Thtri outlet water temperature of baseboard heater i (℃) Tmix mix water s temperature to the heat exchanger (℃) To outside air temperature at operating condition (℃)
xvi
Tod outside air temperature at design condition (℃) Tom mean outside air temperature (℃) tp thickness of the floor slab concrete layer (m) Tr1 mixed return water temperature from commercial zone 1 & 2 (℃) Tr2 mixed return water temperature from commercial zone 1 & 2 & 3(℃) Trb return water temperature of boiler (℃) Trc return water temperature from the commercial zone (℃) Tre1 return water temperature from the heat exchanger primary side (℃) Trg return water temperature from the ground loop (℃) Trl return water temperature from the heat pump (℃) Trr return water temperature from the residential zone (℃) Trred residential zone design return water temperature (℃) Trs supply water temperature to the ground loop (℃) Trspd residential zone design supply water temperature (℃) Ts1i floor surface temperature on top of each tube (℃) Ts2i floor surface temperature on top of concrete node (℃) Tspc supply water temperature to the commercial zone (℃) Tspr supply water temperature to the residential zone (℃) Twg1i down pipe water temperature of ground loop segment i (℃) Twg2i up pipe water temperature of ground loop segment i (℃) Twi water node temperature of RFH at section i (℃) Twlci exterior wall nodal temperature of commercial zone i (℃) Twlri exterior wall nodal temperature of residential zone i (℃) Twlsi exterior wall surface temperature of zone i (℃) Tzcd commercial zone air temperature at design condition (℃) Tzci zone air temperature at commercial zone i (℃) Tzrd residential zone air temperature at design condition (℃) Tzri zone air temperature at residential zone i (℃) Ubsi thermal conductance between the soil node and the grout wall (w/m℃) Ucom control signal of heat pump compressor Ucond,cc,h thermal conductance between the concrete node in the tube layer and the
concrete node in the concrete layer (horizontally) (w/℃) Ucond,cc,v thermal conductance between the concrete node in the tube layer and the
concrete node in the concrete layer (vertically) (w/℃) Ucond,cflo1,v thermal conductance between the concrete node on top of the tube node and
the floor covering node (w/℃) Ucond,cflo2,v thermal conductance between the concrete node on top of each concrete node
in the tube layer and the floor covering node (w/℃) Ucond,flo1,v thermal conductance between the floor covering node in the tube layer and
the floor surface node (w/℃) Ucond,flo2,v thermal conductance between the floor covering node on top of the concrete

xvii
node and the floor surface node (w/℃) Ucond,wc,h thermal conductance between the water and the concrete node horizontally
from the water node (w/℃) Ucond,wc,v thermal conductance between the water and the concrete node vertically from
the water node (w/℃) Uex heat transfer coefficient of heat exchanger (w/m2℃) Uf control signal of gas combustion rate Ufg thermal conductance between the fluid in the ground loop piping and the
grout zones (w/m℃) Uflo,h thermal conductance between the floor covering nodes (w/℃) Ugb thermal conductance between the grout wall the grout zones (w/m℃) Ugg thermal conductance between the grout zones (w/m℃) Uhtri thermal conductance of the baseboard heat i (w/℃) Ussi thermal conductance between two connected soil nodes (w/m℃) Uw1 thermal conductance between the wall interior surface and the brick layer
node (w/℃) Uw2 thermal conductance between the brick layer node and the exterior surface
(w/℃) uwci control signal of commercial zone i water flow rate uwri control signal of residential zone i water flow rate Uwin thermal conductance of window (w/℃) z1 distance between vertical nodes of ground loop heat exchanger (z<10m) (m) z2 distance between vertical nodes of ground loop heat exchanger
(10m<z<75m) (m) β multiplier of the adaptive controller integral term γ
weighting factor of the residential zone thermal comfort to the energy consumption
φ
weighting factor of the commercial zone thermal comfort to the energy consumption
Subscripts agg referring to aggregated air referring to air b referring to boiler or building c referring to commercial, concrete or condenser com referring to compressor conv referring to convective cond referring to conductive d referring to design condition e referring to evaporator
xviii
eq, equ referring to equality constraint ex referring to heat exchanger f referring to fuel or fluid flo referring to floor g referring to grout h referring to horizontal htr referring to terminal heater i referring to sequent number or number of heated zones inci referring to incident solar radiation ins referring to insulation int referring to internal load pv referring to present value r referring to residential rad referring to radiative re referring to return s referring to surface s, soil referring to soil sol referring to solar sp, set referring to supply, set-point t referring to tube v referring to vertical Vol referring to volume w referring to water win referring to window wls referring to wall surface wn, wl referring to wall
Abbreviations ACH air change per hour ASHRAE American society of heating, refrigerating and air-conditioning
engineers COP coefficient of performance HVAC heating, ventilating, and air conditioning OLT open loop test PI proportional plus integral controller

1
Chapter 1 Introduction
1.1 Introduction
In recent days, energy efficiency and sustainability have dominated the research in the
field of design and operation of HVAC systems. To this end, there is a growing
awareness of the influence the building HVAC system operation on the energy
consumption. Most of the heating, cooling, and ventilation systems have optimal range
for satisfactory and economical operation subject to their capacity constraints. To a large
extent, a single HVAC system may not be adequate to meet all requirements of a
multi-functional building to perform in the most efficient and economical manner.
Therefore, it is more appealing to use a decentralized hybrid system approach such that
the overall integrated system can operate in a more efficiency way.
In the past few decades, more environmental friendly way to achieve heating, cooling,
and ventilation has been explored and emphasized in practical applications. Hence,
systems that utilize geothermal, solar, wind, or other means of green energy, are
increasingly popular in the context of broader awareness of sustainable building energy
technologies.
To this end, a hybrid hydronic space heating system for a multi-functional building is
proposed in this thesis to maintain desired zone air temperatures, while minimizing the
energy consumption. A ground loop heat pump system is integrated into an existing
conventional hot water heating natural gas fired boiler system. As such, hot water can be

2
partially or completely supplied by the ground source heat pump system so that the boiler
energy consumption can be minimized. The interactions of combined systems are
examined and evaluated in terms of system performance and temperature control.
1.2 The scope and objectives
The main focus of this thesis is to develop dynamic models of a hybrid hydronic heating
system, so that the system operation and control can be performed in a realistic and
energy-efficient manner.
The main objectives of the study are as follows:
1) To design a hybrid hydronic heating system for a multi-functional building based on
practical guidelines and steady state methods.
2) To develop dynamic models for each system component, including a boiler, a heat
exchanger, a ground loop heat pump, a ground loop heat exchanger, baseboard
heaters, and radiant floor hydraulic piping systems. The dynamic models are used to
analyze and simulate the system responses, under various operating conditions.
3) To develop control strategies to maintain desired zone air temperatures, while
improving the overall energy efficiency of the system.
4) To obtain optimal set-points of the system by formulating and solving a
multi-variable constraint optimization problem to minimize energy consumption.
5) Conduct several energy simulations of the system under different control strategies to
evaluate the potential energy savings.

3
1.3 The thesis organization
The thesis is organized into several chapters. In Chapter 2, a literature review is presented.
In Chapter 3, the dynamic models of hybrid hybronic heating system are developed and
the open loop simulation results are presented. In Chapter 4, control strategies, including
a conventional PI control and an adaptive PI control, are developed. Simulation results
are presented to show the performance and control strategies under variable load
conditions. In Chapter 5, an energy based analysis for each operating strategy is
presented. Conclusions are given in Chapter 6.

4
Chapter 2 Literature Review
2.1 Introduction
A hybrid hydronic heating system consists of several components, such as a boiler, a heat
exchanger, a ground loop heat pump, a ground loop heat exchanger, baseboard heaters,
and piping systems. The modeling aspects of the system were studied by many
researchers. A literature review of steady state and dynamic models will be given first.
Also, the hydronic heating system operation, control strategies and controller design
methods published in the literature are reviewed and presented in the following sections.
2.2 Steady state and dynamic models of hybronic heating system
2.2.1 Boiler and heater models
Zaheer-uddin and Monastiriakos (1998) proposed a hydronic heating system model,
which consisted of models for a boiler, baseboard terminal units, a domestic hot water
heat exchanger and an environmental zone. Nonlinear coupled differential equations were
utilized to develop the model. Simulation results were compared with the field measured
data. It was shown that the designed controllers are able to maintain the boiler, zone and
DHW temperatures close to their respective set-points when the space heating and DHW
loads are subjected to step changes. A load tracking set-point control strategy was
developed and validated and it was shown that the boiler temperature when regulated as a
function of outdoor air temperature result in better zone temperature control.
5
Liao and Parand (2002) developed a dynamic model of commercial hot water boilers that
was integrated with other heating system component models for optimization of boiler
control in central heating systems. The mathematical model included of six major
components, a burner, a flame tunnel, an inner shell separating the flame and the water
mass, a water channel where water is heated, an outer shell wrapped with an insulation
layer. The dynamics of the inner shell, water node, outer shell, and the insulation layer
were modeled and evaluated by the thermodynamic equations and energy conservation
law. The results showed that the model can accurately simulate the dynamic performance
of the targeted boilers.
Li and Zaheer-uddin (2010) proposed a dynamic model of an indirect district heating
(IDH) system. The dynamic model consists of sub-system models such as a boiler, a pipe
network, a heat exchanger, terminal heaters and a zone model. The simulation results
showed that the overall efficiency of the IDH system is 78.7% and it was also shown that
the two highest heat loss components were the boiler heat losses (8.7%) and the
secondary water makeup loss (6.1%) in the system.
2.2.2 Heat pump models
A number of heat pump models have been proposed by researchers over the years
ranging from detailed deterministic models to simple curve-fit models. The detailed
deterministic model usually requires numerous unavailable and uncertain inputs and a
detailed analysis based on thermodynamic laws and heat transfer relations applied to

6
individual components. On the other hand, a curve-fit model treats the heat pump as a
black box and the system performance curve is predicted by fitting a polynomial function
to the performance data extracted from the manufactures’ catalog.
Cecchini and Marchal (1991) proposed a computer program for simulating refrigeration
and air-conditioning equipment performance. The simulation model was based on
thermodynamic cycles and experimental data from equipment testing. Some of the
parameters, such as saturation pressures in evaporator and condenser, superheating and
subcooling, which are usually not available in manufactures’ catalogs, were also used
from experimental data.
Stefanuk et al. (1992) developed a superheat-controlled water-to-water heat pump model,
which was derived from mass, energy, momentum balance as well as fundamental
correlations of heat transfer. Parameters that describe the behavior of the individual
components were assumed to be available for model prediction, such as the relationship
among mass flow rate, input electrical power, evaporation temperature and the
compressor discharge pressure, which are normally not available in the heat pump
manufacturers’ catalogs. Results for the evaporating and condensing pressures, the heat
transfer rates in the evaporator and the condenser, and the COP of the heat pump from the
model predictions were compared with experimental measurements. Except for a few
points with errors beyond ±10%, most of the results were in an acceptable range.
7
Jin and Spitler (2002) developed a parameter estimation based model for a water-to-water
reciprocating vapor compression heat pump. The model was developed from the basic
thermodynamic principles and heat transfer relations and it is suitable for use in building
energy analysis and HVAC simulation programs. The model included several parameters
that were estimated from manufactures’ catalog by applying a multi-variable curve-fit
algorithm. The modeling and validation results showed that the physically based model
representation of the heat pump aids in achieving a better match of the catalog data and as
well as lends itself to some extrapolation beyond the catalog data. As compared to more
detailed deterministic models, the estimated models do not require internally measured
data which are usually unavailable.
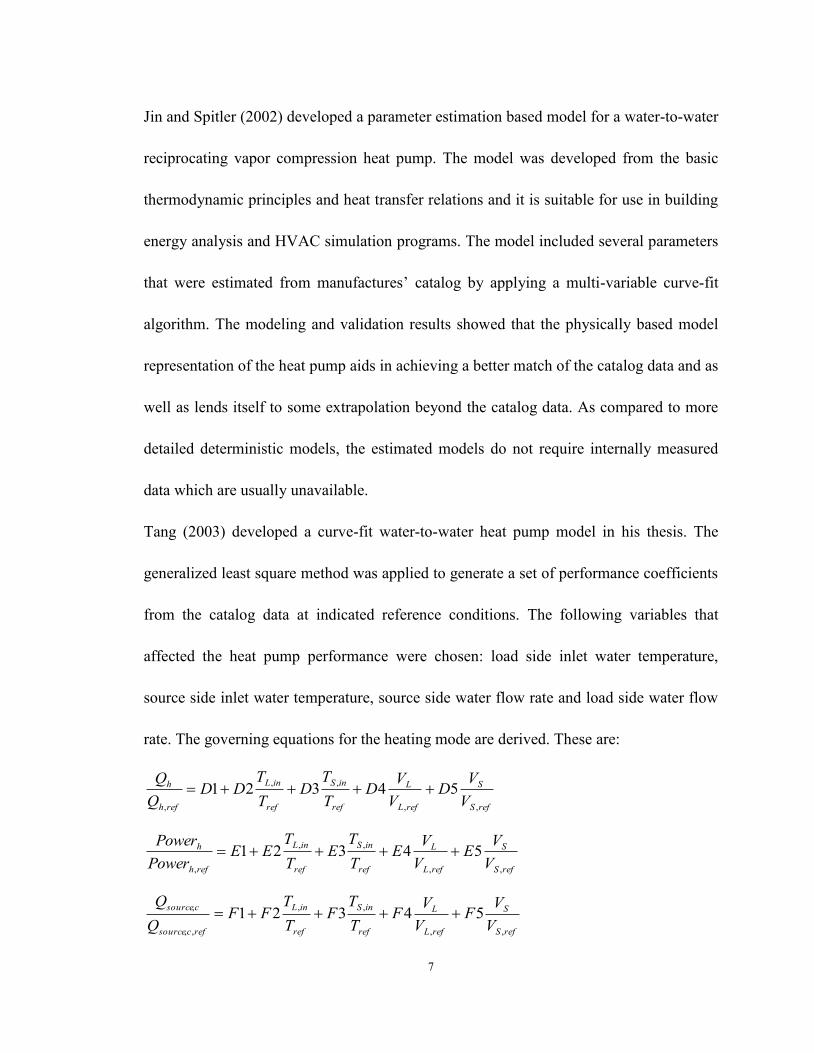
Tang (2003) developed a curve-fit water-to-water heat pump model in his thesis. The
generalized least square method was applied to generate a set of performance coefficients
from the catalog data at indicated reference conditions. The following variables that
affected the heat pump performance were chosen: load side inlet water temperature,
source side inlet water temperature, source side water flow rate and load side water flow
rate. The governing equations for the heating mode are derived. These are:
refS
S
refL
L
ref
inS
ref
inL
refh
h
VV
DVVD
TT
DTT
DDQQ
,,
,,
,
54321
refS
S
refL
L
ref
inS
ref
inL
refh
h
VV
EVVE
TT
ETT
EEPowerPower
,,
,,
,
54321
refS
S
refL
L
ref
inS
ref
inL
refcsource
csource
VV
FVVF
TT
FTT
FFQQ
,,
,,
,,
, 54321

8
The validation results showed that the curve-fit water-to-water heat pump model
performs adequately well compared to the catalog data with RMS error less than 7%, and
it is more robust and requires less computation time than the parameter estimation model.
2.2.3 Ground-coupled heat exchanger models
The design and modeling of ground heat exchangers are complicated by a variety of
factors such as geological formations and properties that affect thermal performance.
The earliest approach to calculating the thermal transport around a heat exchange pipe in
the ground is the Kelvin’s line-source theory (1882). It assumed that the ground is an
infinite medium, and heat conduction process is one-dimensional because the length of
the vertical ground heat exchanger is much greater than its diameter.
Carslaw and Jaeger (1947) developed a cylindrical heat source solution for a constant
heat transfer rate. In the cylindrical source model, the borehole is assumed as an infinite
cylinder surrounded by homogeneous medium with constant properties.
Ingersoll and Zobel (1954) proposed a steady-state heat transfer equation to predict the
shorter term variations. The model is also referred to as a line source model, which
assumes that heat transfer takes place from an infinite long line source or sink in an
infinite medium. Kavanaugh (1985) adjusted the method to account for the U-bend
arrangement and hourly heat rate variations. Other design modeling alternatives were
described by Eskilson (1987), Morrison (1997), and Spitler (2000).

9
Bernier et al. (2004) proposed a cylindrical heat source model for the vertical ground
loop heat exchanger that aggregates heating or/and cooling loads and takes into account
the thermal interactions among surrounding boreholes. This model was also referred to as
multiple-load aggregation algorithm (MLAA).
Daniel E. Fisher et al (2005) presented a ground source heat pump system model that is
implemented in the whole building annual energy simulation program EnergyPlus.
Simplified models of heat exchanger and expansion device components and a more
detailed compressor model were proposed and validated. Multi-variable parameter
estimation methods have been used to find model parameter values from manufacturers’
catalogue data. The results showed that the model is able to reproduce the manufactures’
catalogue data within a +/-10% error bound. Compared to deterministic and curve-fit
models, it has the advantage that no detailed component data or measurements are
required and the extrapolation over a wide range of operating conditions is feasible.
Georgios Florides and Soteris Kalogirou (2007) did a review on ground heat exchangers
regarding systems, models and their applications. Various system types were described
and compared for their efficiencies, performance under different operating conditions, as
well as the modeling metrologies.
Yujin Nam, Ryozo Ooka, and Suckho Hwang (2008) developed a numerical model that
combines a heat transport model with ground water flow and a heat exchanger model.
The proposed model was used to predict the heat exchange rate for an actual office
10
building in Japan. Simulation results using the developed prediction model were
compared with the experimental results, and a good match was reported.
Bauer, Heidemann, and Diersch (2011) proposed a transient 3D analysis of a borehole
heat exchanger model. The model was based on thermal resistance and capacity
approaches, considering the transient effects of heat and mass transports inside the
borehole. The model was used to conduct a three-dimensional numerical simulation of
U-tube borehole heat exchangers. The results showed that the proposed model can
provide accurate results while substantially reducing the number of nodes and the
computation time.
2.2.4 Radiant floor heating system models
Radiant floor heating systems use pipes that are embedded into a concrete floor and thus
the circulating hot water inside the pipes warms up the surrounding concrete structure,
which, in turn, directly radiates heat into the space. Several benefits of radiant floor
heating systems have been shown. Such systems give better thermal comfort, produce
less noise, can operate with low-temperature water, and often use less energy than other
types of heating systems. Furthermore, dust accumulation and stratification problems that
may occur with air handling system and baseboard heating system are not problems with
radiant floor heating.
Due to the significant advantage over conventional heating systems, several researchers
have studied on radiant floor heating systems. Cho and Zaheer-uddin (1999) conducted

11
an experimental study to comparatively evaluate the performances of two different
control schemes for the radiant floor heating systems. Those two control schemes are
conventional on-off control and two parameter switching control (TPSC). The TPSC
showed a better performance in controlling the indoor air temperature.
Zaheer-uddin and Zhang (2002) developed a dynamic model and proposed two control
strategies: a multistage on-off control and an augmented constant gain control (ACGC)
for improving the temperature regulation of a radiant floor heating system. Simulation
results showed that by staging the control action in multiple steps, the temperature
regulation of RFH systems was significantly improved compared to the on-off control.
The ACGC strategy eliminates the use of floor slab temperature sensor. Also, ACGC
strategy showed better zone temperature control and robustness compared to the
conventional proportional control.
Sattari and Farhanieh (2006) presented a parametric study on radiant floor heating system
performance. In their paper, the effects of design parameters, such as type of pipe,
diameter, material, number of pipes, thickness, and the floor covering on performance of
a typical radiant floor heating system were investigated using finite element modeling
method. The simulation results showed that the type and thickness of the floor cover play
a more crucial role than the number, type and diameter of pipes on the thermal
performance of the floor heating system.

12
Li (2010) developed a dynamic model for a radiant floor heating system which predicted
the mean zone air temperature, the water temperature distribution, the temperature
distribution in floor slab and slab surface temperature under design and off design
conditions. By applying single zone and multi-zone analysis, the simulation results were
presented to show that the maximum surface temperature difference in RFH system is
about 4 o C, and, the maximum variation in air temperature in the zone can reach as much
as 1.6 o C. The simulation results from the multi-zone model also showed that increasing
the number of water tubes and increasing the water mass flow rate can compensate for
the high heat loss rate in the zone. Different control strategies, such as conventional PI
control, predictive control, and optimal control were developed and compared for
improving the performance of RFH systems. The simulation results showed that the
optimal PI control strategy not only has the best zone air temperature regulation, but also
it has the greatest energy efficiency. It was showed that the predictive control strategy is
easier to implement compared to optimal control strategy.
Chae et al. (2011) investigated the thermal performance enhancement of the hydronic
radiant floor heating system by exploring tube shape improvement. Both analytical and
detailed CFD simulations were conducted to assess the impact of each tube design
parameter. Other performance indicators, such as the floor surface temperature
distribution, the return hot water temperature, and the actual heating supply requirement
of the radiant floor system were also investigated under both steady-state and transient

13
conditions. The conclusions drawn by the authors stated that radiant floor tube fin
thickness, the number of fins, and the tube thermal conductivity refinements have
significant influence on thermal performance enhancement. The heating energy
consumption was significantly reduced by selecting suitable tube shape geometry.
2.3 A review of control strategies for hydronic heating systems
Zaheer-uddin (1993) proposed an adaptive control method for the design of temperature
controllers for intelligent buildings. The linear models of the systems were used to design
controllers for VAV-HVAC systems. It was shown that by a proper choice of the
adaptation rate, the output response of the VAV system can be improved.
Chen (2002) described an improved algorithm for generalized predictive control (GPC)
and applied it to a radiant floor heating system in a full-scale outdoor test-room. The
performance of the floor heating system controlled by on-off and PI controllers was also
evaluated and compared with GPC control through computer simulations. The results
demonstrated that the GPC controller was superior to the other two in terms of response
speed, minimum offset and on-off cycling frequency.
Singh et al (2000) proposed an adaptive control strategy for multivariable thermal
processes in HVAC systems. A two zone fan-coil heating system is considered and
simulated by using a nonlinear model. A multivariable adaptive controller based on linear
quadratic regulator theory was designed. The simulation results showed that the adaptive
controller was able to reject the effects of both static and dynamic disturbances rapidly,

14
and the maximum percentage overshoot in zone temperature was found to be within
acceptable limits. The controller also showed robust control could handle unmodelled
dynamics and system nonlinearities.
Fatemeh et al (2011) studied unstable oscillatory behavior of the thermostatic radiator
valves during the partial load operating conditions as they were designed for full load
condition. To achieve a balance between stability and performance for radiator control,
they presented a linear parameter varying model of the thermostatic radiator valve (TRV)
as a function of operating flow rate, room temperature and the radiator specifications so
that the TRV controller can be adaptive with the operating conditions. The simulation
results showed that the designed controller based on the LPV model performed
satisfactorily and remained stable in the whole operating conditions.
From the literature review, it is noted that most systems are related to stand-alone HVAC
systems. On the other hand, very little work has been done on the integration of multiple
HVAC systems. Furthermore, much less work has been done on the integration of
conventional hot water heating system and ground source heat pump systems.
To this end, the major objective of this thesis is to model an integrated hot water and
ground source heat pump system and to develop improved control strategies to optimize
energy efficiency of the overall system.

15
Chapter 3 Dynamic Models of Hybrid Hydronic Heating
System
3.1 Introduction
In this chapter, dynamic models of a hybrid hydronic heating system are developed.
Firstly, the system layout and the nodal arrangement of the model are described. Then,
dynamic models are developed for each component, including zone air, building
enclosure, baseboard heaters, radiant floor piping, ground source heat exchanger, heat
pump, heat exchanger, and the boiler. Finally, open loop tests are conducted to show the
dynamic response characteristics of the system at design condition.
3.2 Physical model of the system
As shown in Figure 3.2.1, a typical multi-functional two-storey building is considered in
this thesis. The first floor and the second floor are used for commercial and residential
application respectively. The commercial floor consists of four zones and it is designed to
be served by baseboard heaters. The residential floor consists of four apartments, and
each apartment has four rooms. Radiant floor heating system is installed in each of the
residential spaces.

16
Figure 3.2.1 Commercial and residential floor layout
The schematic diagrams of two systems are shown in Figure 3.2.2 and Figure 3.2.3,
respectively. The base case system is a conventional all boiler system that all the hot
water supply is from the boiler located in a central plant. High temperature water can be
used directly to heat up the commercial floor by circulating hot water through the
baseboard heater units. For residential zones where lower temperature water is required
for the radiant floor heating (RFH), a heat exchanger is applied to regulate the supply
water temperature to the RFH system.

17
However, to use high-quality heat (boiler source) for low-quality energy demand system
(radiant floor space heating) is not desirable because of the low exergy efficiency.
Therefore, to upgrade and make the system sustainable, it is proposed to add a
ground-source heat pump system to the conventional hot water boiler heating system.
Thus the overall system is a hybrid hydronic heating system which is flexible to provide
high temperature and medium temperature hot water as needed in the baseboard and RFH
systems respectively. As such, low temperature water can be supplied, partially or
completely, by the suitable sources at desirable quality levels.
The schematic layout of the above two systems are shown in Figure 3.2.2 and Figure
3.2.3, respectively.
Figure 3.2.2 All boiler heating system layout
Figure 3.2.2 represents a conventional all boiler heating system. The boiler is located in a
central plant and hot water is supplied through an underground distribution loop.

18
Figure 3.2.3 Hybrid hydronic heating system layout
The system design and equipment selection consist of (1) heating load estimation, (2)
radiant floor heating system sizing, (3) Baseboard heater sizing, (4) Ground loop heat
exchanger sizing, (4) Heat pump selection, (5) Heat exchanger sizing, and (6) Boiler
selection. Steady sate design method was used to determine the design capacity. The
summary of calculations is presented in Appendix-A.
3.3 The formulation of a dynamic model
3.3.1 Commercial zone model
Figure 3.3.1 shows a schematic diagram of the piping system and the baseboards installed
in each of the four commercial zones of the building. To develop the commercial zone

19
model, an energy balance approach was used. The equations 3.1 to 3.4 describe the
model.
These equations state that the net energy stored in the zone air is equal to the heat output
from the baseboard heater units, the solar radiation and the internal heat gain minus the
heat losses from the building enclosure and infiltration.
Note that there are four commercial zones and the zone temperatures are identified by
Tzc1, Tzc2, Tzc3, Tzc4, respectively.
Figure 3.3.1 Schematic diagram of the reversed return hot water system loop

20
1int111
111111311
1
3600)(
)()()()(
csolcozcairairc
wlczcwwncozcwinwinchtrspcwcwzc
zc
QQTTcVolACH
TTUATTUATTmcdtTd
C
(3.1)
2int222
221222522
2
3600)(
)()()()(
csolcozcairairc
wlczcwwncozcwinwinchtrspcwcwzc
zc
QQTTcVolACH
TTUATTUATTmcdtTd
C
(3.2)
3int333
331333733
3
3600)(
)()()()(
csolcozcairairc
wlczcwwncozcwinwinchtrspcwcwzc
zc
QQTTcVolACH
TTUATTUATTmcdtTd
C
(3.3)
4int444
441444844
4
3600)(
)()()()(
csolcozcairairc
wlczcwwncozcwinwinchtrspcwcwzc
zc
QQTTcVolACH
TTUATTUATTmcdtTd
C
(3.4)
dwcwcwc mum 111 (3.5)
dwcwcwc mum 222 (3.6)
dwcwcwc mum 333 (3.7)
dwcwcwc mum 444 (3.8)
3.3.2 Building enclosure model
A sectional view of the wall assembly is shown in Figure 3.3.2, and a wall temperature
model was derived. The wall assembly consists of a 100 mm face brick, an air gap, a 100
mm insulation layer, another air gap, and a 13 mm gypsum board.

21
Figure 3.3.2 Structure of exterior wall
To simplify the model, uniform temperature in the wall assembly is used for the heat
transfer analysis. Therefore, the heat transfer process through the wall section can be
simply considered as one-dimensional problem. Two nodes are used for the heat transfer
analysis: one is located in the outside brick layer, and the other is located on the exterior
surface. Based on the energy conservation analysis at each node, the temperature
equation for each node can be described as:
)()()(
21 wlswlwwnwlzwwnwl
wl TTUATTUAdtTd
C (3.9)
ow
incioowlwwls hU
QThTUT
2
2 (3.10)
The symbols used in the equations are described in the nomenclature.

22
3.3.3 Baseboard heater model
By applying the energy balance principle, an equation describing heat transfer processes
in the heater was developed. The models are described by equations 3.11 to 3.18.
The following equations state that the net energy stored in the water inside of the heater
tube in each zone is equal to the heat supplied from the hot water minus the heat emission
from the outside surface of the heater(s) to the zone air.
nzc
htrspchtrhtrspcwcw
htrhtr T
TTUTTmc
dtTd
C
11
1111
11 )
2()(
)( (3.11)
nzc
htrhtrhtrhtrhtrwcw
htrhtr T
TTUTTmc
dtTd
C
11
212211
22 )
2()(
)( (3.12)
nzc
htrhtrhtrhtrhtrwcw
htrhtr T
TTUTTmc
dtTd
C
11
323321
33 )
2()(
)( (3.13)
nzc
htrspchtrhtrspcwcw
htrhtr T
TTUTTmc
dtTd
C
12
4442
44 )
2()(
)( (3.14)
nzc
htrhtrhtrhtrhtrwcw
htrhtr T
TTUTTmc
dtTd
C
12
545542
55 )
2()(
)( (3.15)
nzc
htrspchtrhtrspcwcw
htrhtr T
TTUTTmc
dtTd
C
13
6663
66 )
2()(
)( (3.16)
nzc
htrhtrhtrhtrhtrwcw
htrhtr T
TTUTTmc
dtTd
C
13
767763
77 )
2()(
)( (3.17)
nzc
htrspchtrhtrspcwcw
htrhtr T
TTUTTmc
dtTd
C
14
8884
88 )
2()(
)( (3.18)
21
25131
)(
ww
whtrwhtrr mm
mTmTT
(3.19)

23
321
372112
)(
www
whtrwwrr mmm
mTmmTT
(3.20)
4321
483212 )(
wwww
whtrwwwrrc mmmm
mTmmmTT
(3.21)
3.3.4 Residential zone model
Figure 3.3.3 shows a schematic diagram of the RFH system installed in each of the four
residential zones of the building. A model for predicting the zone air temperature of each
zone was formulated by assuming that the zone air temperature is uniformly distributed
throughout the zone. Equations 3.22 to 3.25 state that the net energy stored in the zone air
is equal to the heat output from the radiant floor panel, the solar radiation and the internal
heat gain minus the heat losses from the building enclosure and infiltration.
Figure 3.3.3 Schematic diagram of the radiant floor heating system loop
24
asolroazrairaira
awlrazrwawnroazrwinawinraconvradazr
azr
QTTcVolACH
TTUATTUAQdtTd
C
111
1111111,,1
1
3600)(
)()()(
(3.22)
bsolrobzrairairb
bwlrbzrwbwnrobzrwinbwinrbconvradbzr
bzr
QTTcVolACH
TTUATTUAQdtTd
C
111
1111111,,1
1
3600)(
)()()(
(3.23)
csolroczrairairc
cwlrczrwcwnroczrwincwinrcconvradczr
czr
QTTcVolACH
TTUATTUAQdtTd
C
111
1111111,,1
1
3600)(
)()()(
(3.24)
dsolrodzrairaird
dwlrdzrwdwnrodzrwindwinrdconvraddzr
dzr
QTTcVolACH
TTUATTUAQdtTd
C
111
1111111,,1
1
3600)(
)()()(
(3.25)
adwrawradwrawr
spradwrawraradwrawrar mumu
TmuTmuT
1111
111111 )1(
))1('(
(3.26)
bdwrbwrbdwrbwr
sprbdwrbwrbrbdwrbwrbr mumu
TmuTmuT
1111
111111 )1(
))1('(
(3.27)
bdwradwr
brbdwraradwrbar mm
TmTmT
11
111111
)(
(3.28)
cdwrcwrcdwrcwr
sprcdwrcwrcrcdwrcwrcr mumu
TmuTmuT
1111
111111 )1(
))1('(
(3.29)
ddwrdwrddwrdwr
sprddwrdwrdrddwrdwrdr mumu
TmuTmuT
1111
111111 )1(
))1('(
(3.30)
ddwrcdwr
drddwrcrcdwrdcr mm
TmTmT
11
111111
)(
(3.31)
ddwrcdwrbdwradwr
dcrddwrcdwrbarbdwradwrabcdr mmmm
TmmTmmT
1111
111111111
)()(
(3.32)

25
3.3.5 Floor slab model
The plan view of the radiant floor heating panel is shown in the Figure 3.3.4. Since the
specific heat of water is higher than that of the concrete, the temperature gradient in the
direction of the hot water pipes is negligible compared to that in the direction
perpendicular to the RFH pipes. Also, as the hot water pipes are equally spaced, it can be
assumed that the same unit section is symmetrically repeating.
Figure 3.3.4 Plan view of embedded tube
A typical floor slab structure is shown in Figure 3.3.5. The heat transfer from the water
circulated in the radiant floor piping to the slab surface is considered as two-dimensional
heat flow: horizontal heat flux from the water node to the nearby concrete nodes, and
vertical heat flux from water node as well as the concrete nodes in the tube layer to the
upper layer. It is also assumed that the concrete nodes on both sides of each tube node are
of the same condition.

26
Figure 3.3.5 Structure of floor slab
1. Water node
The equation describing the water temperature in the tube is given by:
)()(2)()(
,2,,,,1,,,,,
iciwvwccondiciwhwccondiwsprwrwiw
w TTUTTUTTmcdtTd
C (3.33)
2. Concrete node horizontally from the tube
The equation describing the concrete node temperature horizontally from the tube is
given by:
)()(2)(
,3,1,,,1,,,,1
1 icicvcccondiciwhwccondic
cc TTUTTUdtTd
C (3.34)
3. Concrete node on top of each tube
The equation describing the concrete node temperature on top of each tube is given by:
)()(2)()(
,1,2,1,,3,2,,,2,,,,2
2 ifloicvcflocondicichcccondiciwvwccondic
cc TTUTTUTTUdtTd
C
(3.35)

27
4. Concrete node on top of each concrete node horizontally from the tube
The equation describing the concrete node temperature on top of each concrete node
horizontally from the tube is given by:
)()()(2)(
,2,3,2,,3,1,,,3,2,,,3
3 ifloicvcflocondicicvcccondicichcccondic
cc TTUTTUTTUdtTd
C
(3.36)
5. Floor covering node on top of each tube
The equation describing the floor covering node temperature on top of each tube is given
by:
)()(2)()(
,1,1,1,,2,1,,1,2,1,,1
1 isiflovflocondifloiflohfloifloicvcflocondiflo
flo TTUTTUTTUdtTd
C
(3.37)
6. Floor covering node on top of each concrete node horizontally from the tube
The equation describing the floor covering node temperature on top of each concrete
node horizontally from the tube is given by
)()(2)()(
,2,2,2,,2,1,,2,3,2,,2
2 isiflovflocondifloiflohfloifloicvcflocondiflo
flo TTUTTUTTUdtTd
C
(3.38)
7. Floor surface node on top of each tube
The equation describing the floor surface node temperature on top of each tube is given
by:

28
)()(,1,
,1
,1,
,1,1,1
vflocond
ic
vflocond
iriflois U
qUq
TT (3.39)
8. Floor surface node on top of each concrete node horizontally from the tube
The equation describing the floor surface node temperature on top of concrete node
horizontally from the tube is given by:
)()(,2,
,2
,2,
,2,2,2
vflocond
ic
vflocond
iriflois U
qUq
TT (3.40)
9. Heat transfer due to radiation and convection from the floor surface on top of each
tube
))273()273((105 44,11
8,1
enispenir TTAFq (3.41)
31.1,11,1 )(17.2 zisic TTAq (3.42)
10. Heat transfer due to radiation and convection from the floor surface on top of each
concrete node horizontally from the tube
))273()273((105 44,22
8,2
enispenir TTAFq (3.43)
31.1,22,2 )(17.2 zisic TTAq (3.44)
11. Radiative and convective heat transfer from radiant floor slab to the zone air
n
iiciricirconvrad qqqqQ
1,2,2,1,1, )( (3.45)
The properties of the materials in the radiant floor system and the symbols used in the
equations 3.33-3.45 are listed in the following Table 3.1.

29
Symbol Description Value or formula dflocflo [J/(m3 o C)] Density*specific heat capacity
of floor covering material 8400
dconccon [J/(m3 o C)] Density*specific heat capacity of slab concrete
1.8*106
Prw [-] Prandtl number of the water 4.34 νw [m2s-1] Kinematic viscosity of water 0.658*10-6 kw [W/(m o C)] Thermal conductivity of the
water 0.649
kt [W/(m o C)] Thermal conductivity of the tube
0.38
Rew [-] Reynolds number of the water
w
riww
dV
,Re
Nuw [-] Nusselt number of the water if Rew < 2300
36.4wNu else if Rew >= 2300 & Rew < 10000
2)64.1Reln79.0( wrf
)1(Pr)8
(7.1207.1
)PrRe8
(
67.05.0
wr
wwr
w f
f
Nu
else Rew >= 10000 3.08.0 PrRe023.0 wwwNu
Rcond,t [o C/W] Thermal resistance of the tube wall
Lkdd
Rt
ri
ro
tcond
2
)ln(,
,
,
Rconv,w [o C/W] Thermal resistance between water and tube wall due to convection
LkNuR
wwwconv
1,
Rcond,tc,v [o C/W] Thermal resistance between the tube wall and the concrete node vertically from the tube wall
rop
ropvtccond dLk
dtR
,
,,,
5.025.0

30
Rcond,wc,h [o C/W] Thermal resistance between the water and the concrete node horizontally from the water node
htccondtcondwconvhwccond RRRR ,,,,,,
Rcond,wc,v [o C/W] Thermal resistance between the water and the concrete node vertically from the water node
vtccondtcondwconvhwccond RRRR ,,,,,,
Ucond,wc,h [W/ o C] Thermal conductance between the water and the concrete node horizontally from the water node
hwccondhwccond R
U,,
,,1
Ucond,wc,v [W/ o C] Thermal conductance between the water and the concrete node vertically from the water node
vwccondvwccond R
U,,
,,1
Rcond,cc,v [o C/W] Thermal resistance between the concrete node in the tube layer and the concrete node in the concrete layer (vertically)
)(5.025.0
,,,
rotp
pvcccond dSLk
tR
Rcond,cc,h [o C/W] Thermal resistance between the concrete node in the tube layer and the concrete node in the concrete layer (horizontally)
)(5.025.0
,,,
ropp
thcccond dtLk
SR
Ucond,cc,v [W/ o C] Thermal conductance between the concrete node in the tube layer and the concrete node in the concrete layer (vertically)
vcccondvcccond R
R,,
,,1
Ucond,cc,h [W/ o C] Thermal conductance between the concrete node in the tube layer and the concrete node in the concrete layer (horizontally)
hcccondhcccond R
R,,
,,1
Rcond,cflo1,v[o C/W] Thermal resistance between the concrete node on top of the tube node and the floor covering node
roc
c
rop
ropvcflocond dLk
tdLk
dtR
,,
,,1,
25.025.025.0
Rcond,cflo2,v [o C/W] Thermal resistance between the concrete node on top of each concrete node in the tube layer and the floor covering node
)(25.0
)(5.025.025.0
,,
,,2,
rotc
c
rotp
ropvcflocond dSLk
tdSLkdt
R

31
Ucond,cflo1,v [W/ o C] Thermal conductance between the concrete node on top of the tube node and the floor covering node
vcflocondvcflocond R
U,1,
,1,1
Ucond,cflo2,v [W/ o C] Thermal conductance between the concrete node on top of each concrete node in the tube layer and the floor covering node
vcflocondvcflocond R
U,2,
,2,1
Rflo,h [o C/W] Thermal resistance between the floor covering nodes
cc
thflo tLk
SR
25.0,
Uflo,h [W/ o C] Thermal conductance between
the floor covering nodes hflo
hflo RU
,,
1
Rcond,flo1,v [o C/W] Thermal resistance between the
floor covering node in the tube layer and the floor surface node
roc
cvflocond dLk
tR
,,1,
5.0
Rcond,flo2,v [o C/W] Thermal resistance between the floor covering node on top of the concrete node and the floor surface node
)(5.05.0
,,2,
rotc
cvflocond dSLk
tR
Ucond,flo1,v [W/ o C] Thermal conductance between the floor covering node in the tube layer and the floor surface node
vflocondvflocond R
U,1,
,1,1
Ucond,flo2,v [W/ o C] Thermal conductance between the floor covering node on top of the concrete node and the floor surface node
vflocondvflocond R
U,2,
,2,1
Cw [J/o C]
Thermal capacitance of the water inside the radiant floor piping for each control volume
wwri
w cdLd
C 4
2,
Ccc1 [J/o C]
Thermal capacitance of the concrete node horizontally from the tube for each control volume
conconro
rotcc cdLd
dSC
,
,1 2
)(

32
Ccc2 [J/o C] Thermal capacitance of the concrete node vertically from the tube for each control volume
conconro
ropcc cdLd
dtC
,
,2 2
)(
Ccc3 [J/o C] Thermal capacitance of the concrete node on top of each concrete node in the tube layer for each control volume
concon
rotropcc cdL
dSdtC
2)(
2)( ,,
2
Cflo1 [J/o C] Thermal capacitance of the floor covering node on top of the tube for each control volume
floflocroflo cdLtdC ,1
Cflo2 [J/o C] Thermal capacitance of the floor covering node on top of the concrete node for each control volume
floflo
rotflo cdL
dSC
2)( ,
2
Table 3.1 Physical properties and operating conditions of the radiant floor heating system
3.3.6 Ground loop heat exchanger model
A three-dimensional numerical simulation model for U-tube borehole heat exchanger is
presented. The transient effects of heat transports inside the ground coupled heat
exchanger are considered by analyzing each thermal capacity of borehole components:
water inside the ground buried tubes, grouting material, and surrounding soil.

33
Figure 3.3.6 Thermal network analysis for the ground loop heat exchanger describing
heat and mass transport processes in a vertical direction
Figure 3.3.7 Horizontal cross-section view of the single U-tube

34
1. Fluid node inside the tube
The heat and mass transports inside the U-tube are considered by the force convection
from the moving fluid, and the conduction from/to the connected grout node. In the
meantime, the conduction between fluid nodes is also considered since slow water mass
flow rate inside the tube is considered. While moving along the tubes, the grout nodes
transfer heat to the fluid:
)()2(
)()(
,1,11,1,11,1
,11,1,1
iwgigrfgiwgiwgiwgff
iwgiwgwgwiwg
fluid TTzUz
TTTAkTTmc
dtTd
C
(3.46)
)()2(
)()(
,2,21,2,21,2
,21,2,2
iwgigrfgiwgiwgiwgff
iwgiwgwgwiwg
fluid TTzUz
TTTAkTTmc
dtTd
C
(3.47)
The symbols used in the equations are described in the nomenclature.
2. Grout node
In each layer, the grout nodes are connected to each other, to the borehole wall, and to the
fluid nodes inside the tubes. The heat transfer equations for the grout nodes can be
described:
)(
)()2(
)()(
,1,1
,1,21,1,11,1
,1,,1
igriwgfg
igrigrggigrigrigrgg
igrigbgbigr
grout
TTzU
TTzUz
TTTAkTTdzU
dtTd
C
(3.48)

35
)(
)()2(
)()(
,2,2
,2,11,2,21,2
,2,,2
igriwgfg
igrigrggigrigrigrgg
igrigbgbigr
grout
TTzU
TTzUz
TTTAkTTzU
dtTd
C
(3.49)
3. Grout wall node
The borehole wall nodes are considered as nodes without volume. Therefore, a
steady-state analysis for the grout wall nodes is proposed:
gbbsi
igrigrgbisoilbsiigb UU
TTUTUT
2)( ,2,1,1
,
(3.50)
4. Soil node
The soil layer is divided as 5 sub-layers, and the end nodes connected with the last soil
layer nodes are considered as the undisturbed ground temperature. The heat transfer
among soil nodes occur by heat conduction. Since the heat transport in the soil is always
considered transient, the transport equations for the soil node are:
zTTTAk
TTzUTTzUdtTd
C isoilisoilisoilssisoiligbbsiisoilisoilss
isoilsoil
)2()()(
)( 1,1,11,11,1,,1,21
,11
(3.51)
zTTTAk
TTzUTTzUdtTd
C isoilisoilisoilssisoilisoilssisoilisoilss
isoilsoil
)2()()(
)( 1,2,21,22,2,11,2,32
,22
(3.52)
zTTTAk
TTzUTTzUdtTd
C isoilisoilisoilssisoilisoilssisoilisoilss
isoilsoil
)2()()(
)( 1,3,31,33,3,22,3,43
,33
(3.53)

36
zTTTAk
TTzUTTzUdtTd
C isoilisoilisoilssisoilisoilssisoilisoilss
isoilsoil
)2()()(
)( 1,4,41,44,4,33,4,54
,44
(3.54)
zTTTAk
TTzUTTzUdtTd
C isoilisoilisoilssisoilisoilssisoiligroundss
isoilsoil
)2()()(
)( 1,5,51,55,5,44,5,4
,55
(3.55)
The parameters of the ground loop model and equations used to determine the parameters
are described in the following Table 3.2.
Symbol Description Value or formula mwg [kg/s] Ground loop water mass flow
rate 0.24
Physical properties
kf [W/(m o C)] Thermal conductivity of the ground loop fluid
0.568
Af [m2] Cross-sectional area of the fluid node
4
2,gi
f
dA
Prfluid [-] Prandtl number of the ground loop fluid
11.4
νfluid [m2s-1] Kinematic viscosity of ground loop fluid
1.535*10-6
Refluid [-] Reynolds number of the ground loop fluid
fluid
giwgfluid
dV
,Re
Nufluid [-] Nusselt number of the ground loop fluid
if Refluid < 2300
36.4fluidNu else if Refluid >= 2300 & Refluid < 10000
2)64.1Reln79.0( fluidgf

37
)1(Pr)8
(7.1207.1
)PrRe8
(
67.05.0
fluidg
fluidfluidg
fluid f
f
Nu
else Refluid >= 10000 3.08.0 PrRe023.0 fluidfluidfluidNu
Cfluid [J/ o C] Thermal capacitance of the fluid node
wwffluid cddzAC
kg [W/(m o C)] Thermal conductivity of the grout
2.4
dgcg [J/(m3 o C)] Density*specific heat capacity of grout
2.19*106
Ag [m2] Cross-sectional area of the grout node )
2(
42
,
2
gobore
g dD
A
Cgrout [J/ o C] Thermal capacitance of the grout node
dzd
DcdC go
boregggrout )
2(
42
,
2
ks [W/(m o C)] Thermal conductivity of the soil 2.2 dscs [J/(m3 o C)] Density*specific heat capacity
of soil 2.21*106
As1 [m2] Cross-sectional area of the soil node 1
22
1 4bore
xxsD
LA
As2 [m2] Cross-sectional area of the soil node 2
222 )2( xxxxs LLA
As3 [m2] Cross-sectional area of the soil node 3
223 )2()3( xxxxs LLA
As4 [m2] Cross-sectional area of the soil node 4
224 )3()4( xxxxs LLA
As5 [m2] Cross-sectional area of the soil node 5
225 )4()5( xxxxs LLA
Csoil1 [J/ o C] Thermal capacitance of the soil node 1
ss
borexxsoil cddz
DLC )
4(
22
1,
Csoil2 [J/ o C] Thermal capacitance of the soil node 2
ssxxxxsoil cddzLLC ))2(( 22
2,

38
Csoil3 [J/ o C] Thermal capacitance of the soil node 3
ssxxxxsoil cddzLLC ))2()3(( 22
3,
Csoil4 [J/ o C] Thermal capacitance of the soil node 4
ssxxxxsoil cddzLLC ))3()4(( 22
4,
Csoil5 [J/ o C] Thermal capacitance of the soil node 5
ssxxxxsoil cddzLLC ))4()5(( 22
5,
Rconv [mK W-1] Thermal resistance between water and tube wall due to convection
ffluidconv kNuR 1
kpipe [W/(m o C)] Thermal conductivity of the pipe 0.38 Rcond,1 [m o C/W] Thermal resistance of the tube
wall
pipe
gi
go
cond kdd
R
2
)ln(,
,
1,
Rcond,2 [m o C/W] Thermal resistance between the tube wall and the grout zone ggcond RLR 2,
Rfg [m o C/W] Thermal resistance between the fluid in the pipes and the grout zones
2,1, condcondconvfg RRRR
Rg [m o C/W] Thermal resistance between the outer wall of one tube and the borehole wall gaining from two-dimensional heat conduction analysis and borehole geometry
)888.0601.1(2
)2
cosh(,
22,
2
bg
go
gobore
g ds
kd
sdDar
R
Rar[m o C/W] Thermal resistance between the outer walls of two tubes
g
go
go
ar kd
dsar
R
2
)2
cosh( 2,
2,
2
Lg [-] The value Lg determines how the thermal resistance between the outer wall of one tube and the borehole wall Rg is divided
)2
ln(
)2
2ln(
,
,
2,
2
go
bore
go
gobore
g
dDd
dD
L
Rgb [m o C/W] Thermal resistance between the grout zones and the borehole wall
gggb RLR )1(

39
Rgg [m o C/W] Thermal resistance between two grout zones )22
)2(2
ggargb
ggargbgg RLRR
RLRRR
Rbsi [m o C/W] Thermal resistance between the soil node1 and the grout wall
s
bore
bore
bsi k
D
L
R
2
))
2(
)4
(log(
Rss1 [m o C/W] Thermal resistance between soil node1 and soil node2
s
borexx
xx
ss k
DLL
R
2
)
42
5.1log(
1
Rss2 [m o C/W] Thermal resistance between soil node2 and soil node3
s
xx
xx
ss kLL
R
2
)5.15.2
log(
2
Rss3 [m o C/W] Thermal resistance between soil node3 and soil node4
s
xx
xx
ss kLL
R
2
)5.25.3
log(
3
Rss4 [m o C/W] Thermal resistance between soil node4 and soil node5
s
xx
xx
ss kLL
R
2
)5.35.4
log(
4
Table 3.2 Geometrical data, physical properties and operating conditions of the ground loop heat exchanger
3.3.7 Heat pump model
A water-to-water heat pump is modeled based on its two major components: evaporator
and condenser, and an equation-fit COP model is utilized to connect the two. The energy
balance equation of the heat pump can be described as:

40
1. Evaporator model
)1()TT()T(
rsrgrs COPEUcm
dtd
C comcomwwge (3.56)
2. Condenser model
)()T( rlrrrlwwrcomcomc TTcmCOPEU
dtdC (3.57)
3. COP model (R410a refrigerant)
The COP model is based on the polynomial curve-fit to the manufacture’s data. The data
used is listed in the Appendix-B.
com
cond
EECOP (3.58)
wrrrwgwrwgrr
wrwgrrwrwgrr
mTCmCmmCTCmCmCTCCmCmCTCCCCOP
13T1211T10
987T6543T21
rgrg
2222rgrg
(3.59)
3.3.8 Heat exchanger model
1. Return water nodes of the primary side:
Equation 3.60 describes the rate of heat stored in the primary side of is equal to the heat
supplied by the primary piping network minus the heat transferred to secondary side.
exremixpwwre
h qTTmcdtTdC )()(
111
1 (3.60)
2. Supply water nodes of the secondary side:
The rate of heat stored in the secondary side is equal to the heat input from the primary
side, minus the heat transferred to the secondary side. This is expressed in Equation 3.61

41
)()(
2 rlsprwrwexspr
h TTmcqdtTd
C (3.61)
Logarithmic mean temperature difference of each heat exchanger is computed from:
rlre
sprexsp
rlresprexsp
TTTT
TTTTLMTD
1
1
ln
)()( (3.62)
The rate of heat transferred is determined from:
LMTDAUq exexex (3.63)
3.3.9 Boiler model
A gas-fired condensing boiler is used in this study. The temperature of supply water of
boiler is a function of the capacity of the boiler, the efficiency of boiler, mass flow rate of
supply-return water and the rate of fuel consumption. The boiler efficiency is calculated
by using the equation given in Li et al (2010). The energy balance equation of the boiler
can be described as:
)()(
max rbbwwffb
b TTcmHVebmUdtTd
C (3.64)
The return water temperature to the boiler can be described as:
pwwc
pwrewcrcrb mm
mTmTT
1
11 )(
(3.65)
3.3.10 Heat losses from the water distribution pipe network
The heat losses from the water distribution loop are evaluated based on the boiler supply
water temperature Tb, ground temperature Tg, water flow rate, pipe material, as well as

42
the insulation property and the total length of pipe. The pipe segments that contribute to
the pipe heat losses are: from the boiler to the commercial zone supply; from the
commercial zone to the boiler return; from the boiler to the heat exchanger supply; and
from the heat exchanger to the boiler return. It is assumed that the heat pump unit and the
heat exchanger are located inside the building. Therefore, the pipe heat losses from the
ground source heat exchanger, heat pump and heat exchanger are ignored.
3.4 Open loop simulations of the system
All the component models described earlier in sections 3.1 to 3.3 were integrated to
develop an overall hybrid hydronic heating system model. The model equations were
solved using MATLAB. Open loop simulation runs were made to study the dynamic
responses of the system. The open loop test results for the design condition are depicted
in Figure 3.4.1.

43
Figure 3.4.1 System open loop test at design condition (-15 o C outside air temperature)
The temperature responses at design condition are depicted in Figure 3.4.1. The system
was started from arbitrary initial conditions. As shown in the figure, the boiler and the
heat exchanger supply temperatures reach nearly steady state in 2 hours and 7 hours,
respectively, at their design loads, and the response time is affected by the thermal
capacity of components and the loads acting on the system. For the residential zone 1a
and commercial zone 1, the response times are 8 hours and 2 hours, respectively, which
are indicative of the higher thermal mass of the radiant floor heating system than the
baseboard heater system. The overall system responses are not only affected by space

44
heating loads but due to thermal dynamic effect of the heat pump loop interacting with
the ground loop. A ten day responses of the overall system were simulated and the results
are depicted in Figure 3.4.2.
Figure 3.4.2 System open loop test for the heat pump temperature responses at design
condition (-15 o C outside air temperature)
By comparing Figure 3.4.1 and 3.4.2, it can be noted that the boiler and zone temperature
responses reach steady state much faster than heat pump loop temperatures. This is due to
the effect of ground loop thermal interactions while the boiler and zone temperatures
responses are impacted by the changers in zone loads. The heat pump-ground loop

45
temperature responses exhibit much slower variations that reflect large thermal capacity
effect of the ground loop.
In order to improve the energy efficiency of the overall system, it would be important to
reset the boiler supply water temperature and the supply water from the heat exchanger as
a function of loads. To study this aspect, simulation runs were made to determine the
functional relationship between boiler water temperature and the outdoor air temperature.
Likewise, the heat exchanger supply water temperature as a function of outdoor air
temperature was examined. The results are depicted in Figure 3.4.3. In this simulation,
the outside air temperature was varied from the design condition at -15 o C to the partial
load condition at -5 o C, and the corresponding boiler supply water temperature and the
heat exchanger supply water temperature were determined.
As shown in Figure 3.4.3, the boiler temperature decreased from 87 o C to 72 o C when
the system loads changed from full load to partial load condition. Similarly, it can be
stated that the heat exchanger supply water temperature can be regulated between 45 o C
to 39 o C to meet the zone loads of the residential building while the outdoor temperature
vary from -15 o C to -5 o C range.

46
Figure 3.4.3 Supply water temperature of boiler and heat exchanger under different
outside air temperature
The entering source water temperature is one of the most important factors to determine
the efficiency of a heat pump. To this end, open loop simulation runs were also made to
study the impact of entering ground loop water temperature on the COP of the heat pump.
The entering source temperature (EST) is related to the temperature of the ground where
the ground loop is installed. In terms of space heating application, a higher soil
temperature will provide a higher EST and a more efficient heat pump operation. The
simulation results presented in Figure 3.4.4 show that the COP increases linearly as the
EST increases.

47
Figure 3.4.4 Effect of entering source temperature on COP

48
Chapter 4 Proportional-Integral and Adaptive Control of
Hybrid Hydronic Heating System
4.1 Introduction
In this chapter, the design and tuning of feedback controllers are explored and the
responses of the system subject to disturbances are investigated. The objective is to
improve the regulation performance of the control loops of the overall hybrid hydronic
heating system. Figure 4.1.1 shows the schematic diagram of a hybrid source hot water
heating system supplying space heating via boiler and ground loop heat pump. Also,
shown in Figure 4.1.1 are the feedback control loops. There are five loops in the system:
(1) boiler control loop (Figure 4.1.2), which controls the boiler fuel supply to maintain
the boiler supply water temperature at its set-point; (2) heat exchanger control loop
(Figure 4.1.3), which controls the secondary side supply water temperature through the
regulation of the primary side water temperature; (3) Heat pump loop (Figure 4.1.4),
which controls the condenser side supply water temperature through the compressor
power regulation; (4) Commercial zone water loop (Figure 4.1.5), which regulates the
water flow rate according to zone air temperature change via a two way zone valve; and
(5) Residential zone water loop (Figure 4.1.6), which regulates the supply water flow rate
by a three way mixing valve.
The application of two types of control schemes was examined: a conventional fixed gain
PI control, and an adaptive gain PI control.

49
Figure 4.1.1 Schematic diagram of hybrid source hydronic heating system control loop
for space heating
Figure 4.1.2 Boiler control loop

50
Figure 4.1.3 Heat exchanger control loop
Figure 4.1.4 Heat pump control loop

51
Figure 4.1.5 Commercial zone control loop
Figure 4.1.6 Residential zone control loop

52
4.2 The effects of load disturbances on the residential and commercial zones
The zone temperatures are affected by several disturbances such as the outdoor
temperature, the thermal dynamic effects of incident or transmitted solar radiation, as
well as the internal heat gain. The changes in initial conditions of the model itself can
also lead to variations in zone temperature. These disturbances could occur concurrently
or in several combinations. Note that most of the HVAC systems are designed at the peak
load condition. As such the effects of solar heat gain and internal heat gain are not
considered at the design stage. In practice, however, the buildings operate under variable
load conditions which are much less than the design load conditions. To maintain zone
temperatures at desired set-points under such conditions, proper design and selection of
the control system is critical to maintain desirable zone air condition and to avoid
unnecessary energy waste.
To carry out the simulation runs, a sinusoidal profile for the outdoor air temperature is
assumed, with the mean air temperature -10 o C and an amplitude 10 o C. The hourly data
of solar radiation is considered in both the incident and transmitted form and was
modeled by using Hottel’s clear sky model. The daily outdoor air temperature profile is
shown in Figure 4.2.1.

53
Figure 4.2.1 Outdoor air temperature profile
By applying the above outdoor air temperature profile, the temperature responses of the
commercial and residential zones without control were simulated. The results are shown
in Figure 4.2.2.
Figure 4.2.2 Residential and commercial zone air temperature responses with no control

54
As shown in Figure 4.2.2, the residential zone air temperature fluctuates between 24 o C
and 30 o C, and the commercial zone air temperature fluctuates between 21 o C and 30 o C
without control. These fluctuations will be amplified if the solar radiation and internal
heat gain are also included in the simulation. The results demonstrate that it would be
reasonable to expect up to 10 o C temperature fluctuations in buildings when no control is
applied when the system operates under a typical day load conditions.
4.3 Fixed gain PI control of zone air temperatures
A fixed gain PI control strategy for zone temperature control in both residential and
commercial zones was studied. A well-tuned PI controller can provide satisfactory
temperature regulation performance of the hydronic heating system.
The PI control algorithm can be described as:
dttetKtetKtU ip )()()()()( (4.1)
where e (t) = Tset – Tpv, Kp (t) is the proportional gain, Ki (t) is the integral gain, Tset is the
set-point temperature, Tpv is the present value, and U (t) is the control signal.
In the simulations, the set-point temperatures for the residential and commercial zones
were assumed to be 21 o C and 20 o C, respectively. The set-point water temperatures for
the boiler supply is 88.7 o C, and for the residential and commercial zones are 45 o C.
Temperature responses subject to outside air temperature changes, solar heat flux and
internal heat gains for the residential and commercial zones are depicted in Figure 4.3.1.
The controller gains used in the simulation runs were obtained by trial-and-error. The

55
following set of controller gains kp1a = 2.0, ki1a = 0.0022, kp1 = 0.8, ki1 = 0.05 gave
acceptable set-point tracking responses.
Figure 4.3.1 Validation of the constant gain values of PI controllers for the residential and
commercial zone temperature control
The simulation results depicted in Figure 4.3.1 (a) and (b) show that the set-point
temperatures for both residential and commercial zones can be maintained, but more
noticeable oscillations were found in the residential zone. This is due to the fact that the
residential RFH system has significantly higher thermal capacity as such the initial
temperature in the zone impacts the control performance. The slow system response to

56
control input changes of the RFH system also contributes to this sluggish response.
Furthermore, due to the fact that the PI controller was designed and tuned based in the
most critical operation point, the responses under partial load conditions show noticeable
fluctuations. To this end, an adaptive control scheme is proposed to improve the
controller performance.
4.4 Simulation results for the adaptive PI control
A well-tuned fixed gain PI controller can provide good disturbance rejection, such as due
to changes in initial conditions and ambient air temperature, as well as the thermal
dynamic effects of absorbed solar radiation fluxes. Nevertheless, due to nonlinear
dynamics of the system and unknown external disturbances, reliance on fixed gain PI
controller to achieve good temperature control remains a challenging problem. To this
end, an adaptive controller has been designed and implemented to improve control
performance of the system. Instead of using trial-and-error approach to find the gains, the
adaptive PI control considers both input and output to define and update the gains.
The adaptive gain PI control algorithm was described as:
)()()()()()( oomoaiap TTkdttetKtetKtU (4.2)
where Kap(t) is the adaptive proportional gain, which is given by:
)()(
)(,iwsprwrw
ozrizap TTmc
TTatK
, (4.3)
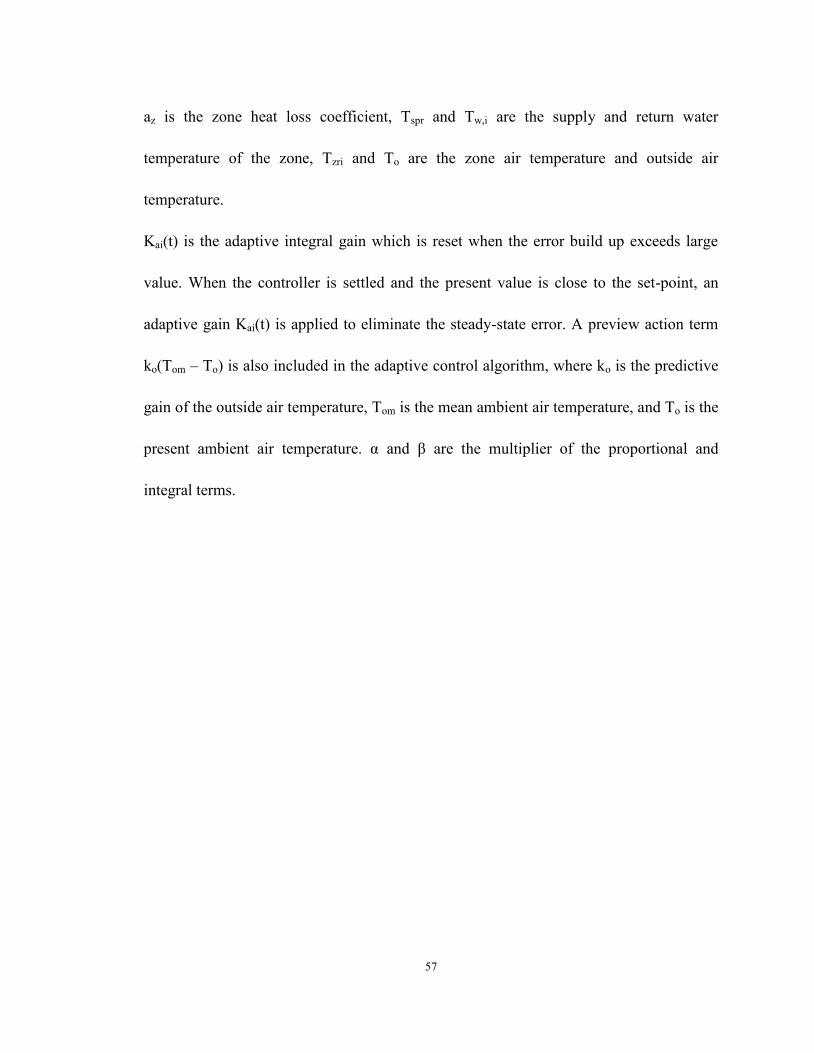
57
az is the zone heat loss coefficient, Tspr and Tw,i are the supply and return water
temperature of the zone, Tzri and To are the zone air temperature and outside air
temperature.
Kai(t) is the adaptive integral gain which is reset when the error build up exceeds large
value. When the controller is settled and the present value is close to the set-point, an
adaptive gain Kai(t) is applied to eliminate the steady-state error. A preview action term
ko(Tom – To) is also included in the adaptive control algorithm, where ko is the predictive
gain of the outside air temperature, Tom is the mean ambient air temperature, and To is the
present ambient air temperature. α and β are the multiplier of the proportional and
integral terms.

58
Figure 4.4.1 Responses of the adaptive PI controllers for the residential and commercial
zones temperature control
The responses of the adaptively controlled system are shown in Figure 4.4.1. Compared
with the constant gain PI controller performance (Figure 4.3.1) under same operating
conditions, the adaptive PI control shows better disturbance rejection and higher stability
(Figure 4.4.1).
Moreover, when a sudden step change is applied, such as an increase or decrease in
set-point temperature of the zone, the controller responds in a stable and smooth manner
as shown in Figure 4.4.2. The simulations were conducted at two different outdoor air

59
temperature profiles (one ranging between -15 o C and -5 o C to simulate a cold-day; and
the other ranging from -5 o C to 5 o C, representing a mild winter day condition) were
applied for this analysis. Zone temperature set-points in buildings were assumed to be 19
o C during the first 10 hours, and set forward to 21 o C for the remainder of the day.
Figure 4.4.2 Comparison of controller responses with adaptive control (a-b) and fixed
gain control (c-d) for the residential zone subject to step change in 2 o C and a outside air temperature profile from -15 o C to -5 o C

60
Figure 4.4.3 Comparison of controller responses with adaptive control (a-b) and fixed
gain control (c-d) for the residential zone subject to step change in 2 o C and a outside air temperature profile from -5 o C to 5 o C
The manner in which the adaptive controller brings the zone temperatures from a lower
set-point to a higher set-point is depicted in Figure 4.4.1 (a), (b) and Figure 4.4.2 (a), (b)
for two cases with different outdoor air temperature profiles. Also shown in Figure 4.4.2
(c) (d) and Figure 4.4.2 (c) (d) are the responses obtained from the fixed gain controller.
Due to the fact that the controller is designed and tuned for high load condition, under
low load conditions when outside air temperature is higher and and/or zone set-point
temperature is lower, oscillations in zone temperature may occur because of the nonlinear
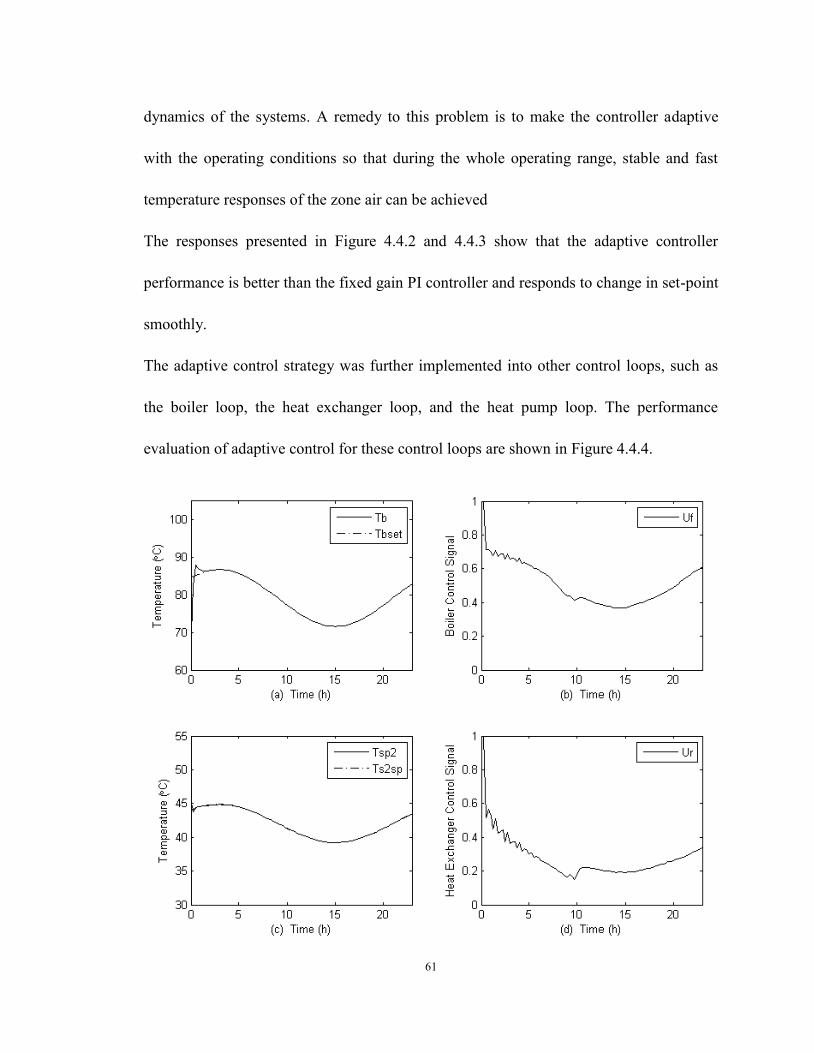
61
dynamics of the systems. A remedy to this problem is to make the controller adaptive
with the operating conditions so that during the whole operating range, stable and fast
temperature responses of the zone air can be achieved
The responses presented in Figure 4.4.2 and 4.4.3 show that the adaptive controller
performance is better than the fixed gain PI controller and responds to change in set-point
smoothly.
The adaptive control strategy was further implemented into other control loops, such as
the boiler loop, the heat exchanger loop, and the heat pump loop. The performance
evaluation of adaptive control for these control loops are shown in Figure 4.4.4.

62
Figure 4.4.4 Temperature responses of the boiler, heat exchanger, and heat pump control
loops for adaptive control
Figure 4.4.4 shows the adaptive control responses of the boiler temperature, heat
exchanger temperature and the return water temperature through the heat pump loop
corresponding to a typical day simulation result. As can be noted, the controller is
adapting very well to diurnal load changes that occur during a typical day operation and
variable set-points.

63
Chapter 5 Control Strategies for Improved Energy Efficiency
of Hybrid Hydronic Heating System
5.1 Introduction
Several control strategies were investigated to improve the energy efficiency of the
hybrid hydronic heating system. Energy simulations runs were conducted under different
operating conditions. A conventional fixed set-point PI control was used as the base case
control strategy. In this case, supply water temperatures of boiler, heat pump and heat
exchanger are pre-determined and kept constant according to the historical performance
data. Also, an outdoor reset control strategy was developed in a way that the rate of heat
delivery to the building can be adjusted to match the building heat losses. Finally, an
optimal set-point control strategy is proposed to minimize the overall energy
consumption of the system while maintaining desirable zone air temperature.
5.2 Conventional fixed set-point control strategy
A conventional fixed set-point PI control strategy is presented as the base case. Here, the
supply water temperatures of boiler, heat pump and heat exchanger are pre-determined
and kept constant. The set-point temperature of boiler supply is 88.7 o C, and the supply
temperatures for both heat exchanger and heat pump were set at 45 o C. The set-point
temperatures for both residential and commercial zones were 21 o C. Under these

64
conditions, the zone temperature responses and control valve responses are shown in
Figure 5.2.1.
Figure 5.2.1 Output responses of residential and commercial zone (fixed set-point control
strategy)

65
Figure 5.2.2 Output responses of boiler and heat exchanger (fixed set-point control
strategy)
The results show that a well tuned PI controller can maintain zone and boiler
temperatures at their respective set-point in the presence of disturbances acting on the
system.
5.3 Outside air temperature reset control strategy
An outside air temperature reset control strategy is developed to continually adjust the
rate of heat delivery to the zone to match the zone heat loads. To simplify the control
process, same set-point temperatures for the heat exchanger and the heat pump supply
were applied in this simulation. A series of open loop tests were conducted to determine
the target set-point water temperature as a function of the outside air temperature. Figure
5.3.1 shows the change of the supply water temperature set-point as a function of the
outside air temperature.
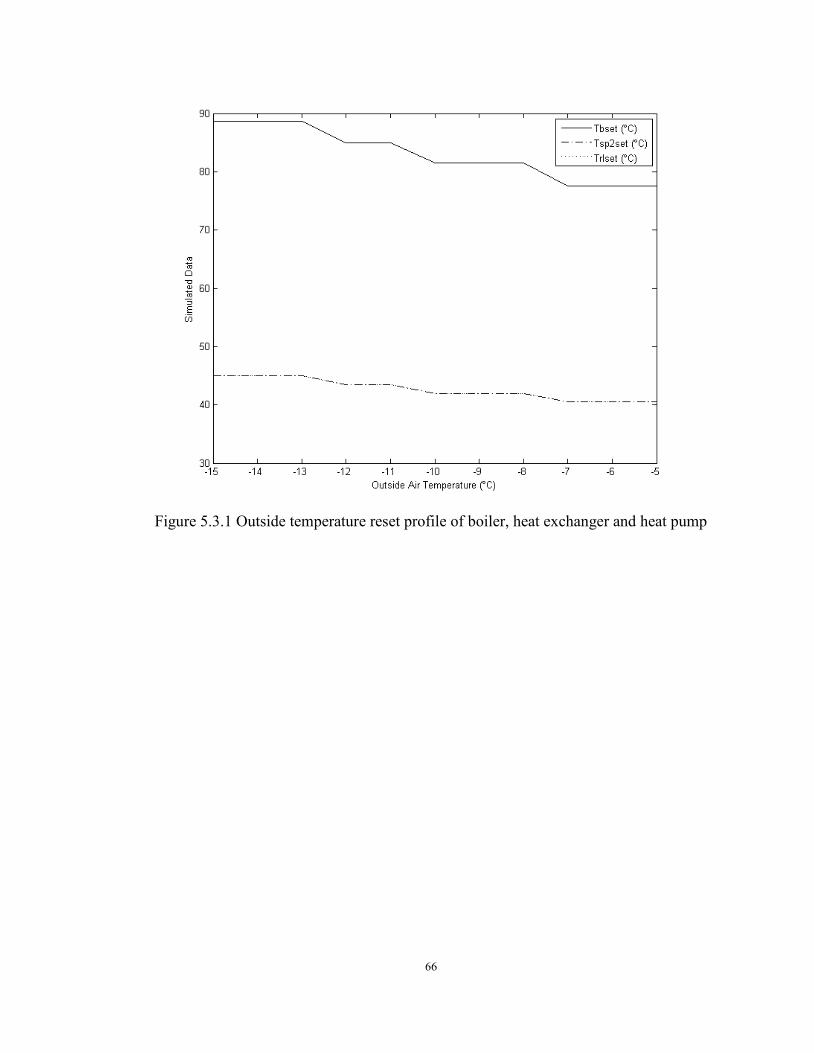
66
Figure 5.3.1 Outside temperature reset profile of boiler, heat exchanger and heat pump
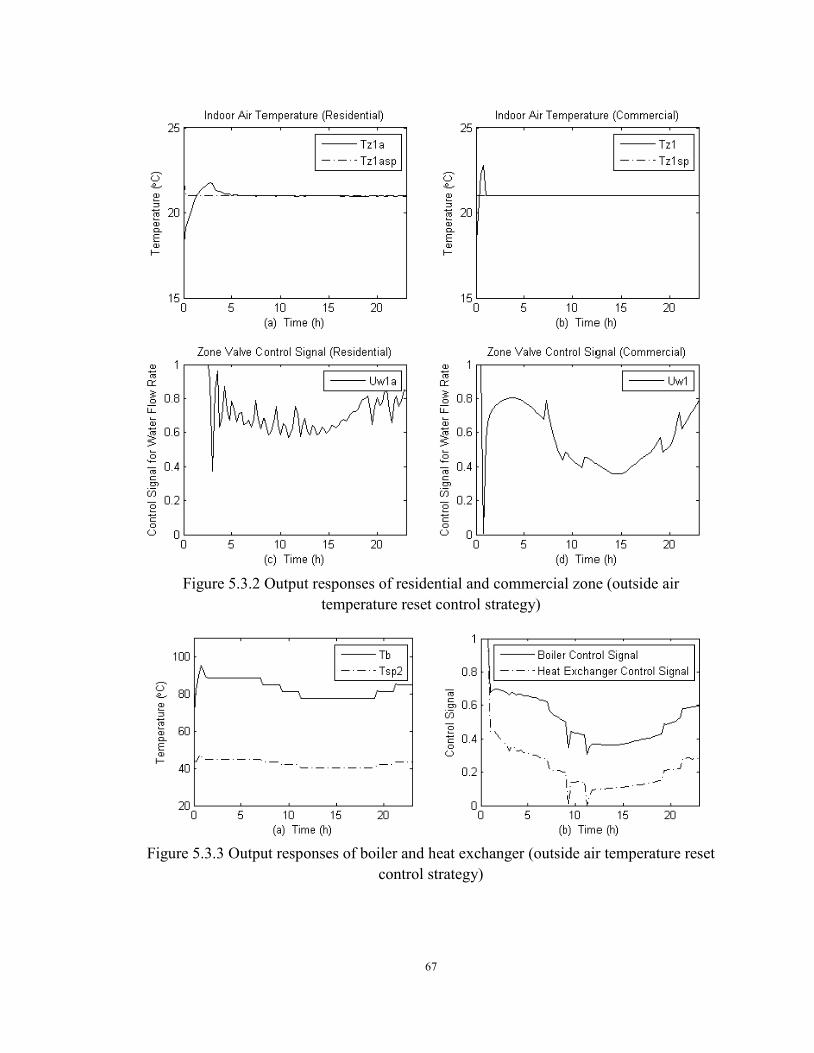
67
Figure 5.3.2 Output responses of residential and commercial zone (outside air
temperature reset control strategy)
Figure 5.3.3 Output responses of boiler and heat exchanger (outside air temperature reset
control strategy)
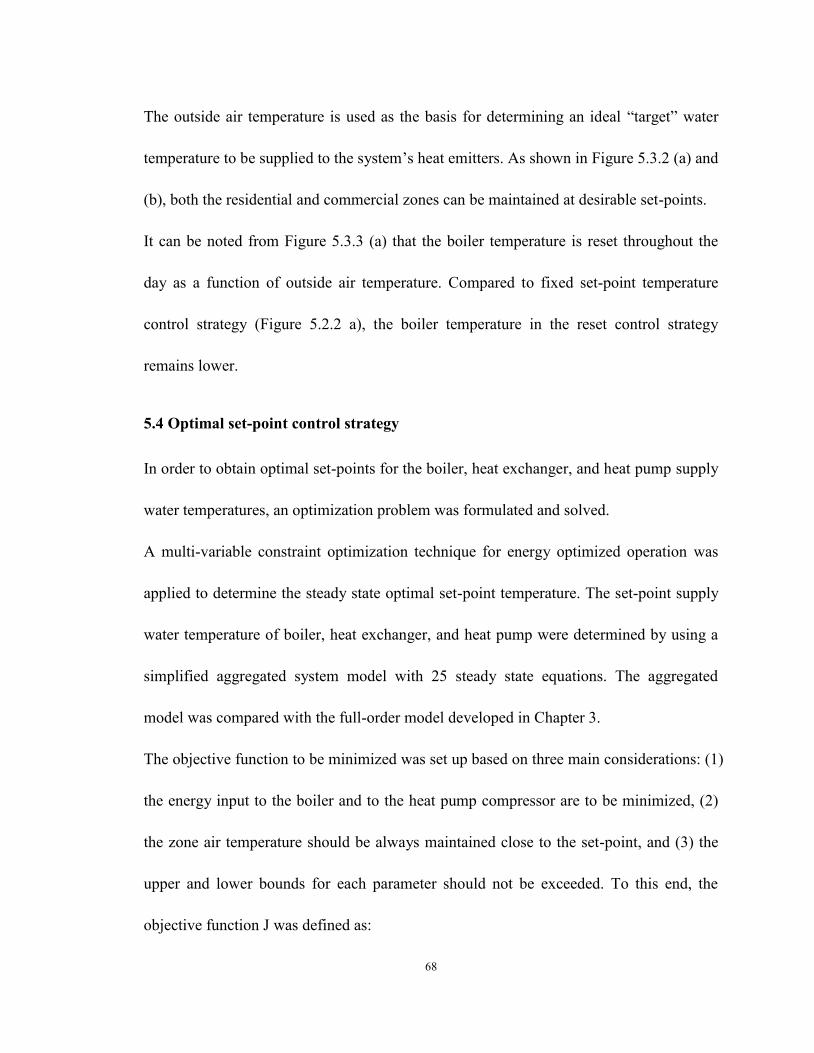
68
The outside air temperature is used as the basis for determining an ideal “target” water
temperature to be supplied to the system’s heat emitters. As shown in Figure 5.3.2 (a) and
(b), both the residential and commercial zones can be maintained at desirable set-points.
It can be noted from Figure 5.3.3 (a) that the boiler temperature is reset throughout the
day as a function of outside air temperature. Compared to fixed set-point temperature
control strategy (Figure 5.2.2 a), the boiler temperature in the reset control strategy
remains lower.
5.4 Optimal set-point control strategy
In order to obtain optimal set-points for the boiler, heat exchanger, and heat pump supply
water temperatures, an optimization problem was formulated and solved.
A multi-variable constraint optimization technique for energy optimized operation was
applied to determine the steady state optimal set-point temperature. The set-point supply
water temperature of boiler, heat exchanger, and heat pump were determined by using a
simplified aggregated system model with 25 steady state equations. The aggregated
model was compared with the full-order model developed in Chapter 3.
The objective function to be minimized was set up based on three main considerations: (1)
the energy input to the boiler and to the heat pump compressor are to be minimized, (2)
the zone air temperature should be always maintained close to the set-point, and (3) the
upper and lower bounds for each parameter should not be exceeded. To this end, the
objective function J was defined as:

69
2,
2,max )()( csetaggzcrsetaggzrcomcomff TTTTCOPEUHVebmUJ (5.1)
The simplified aggregate model equations, expressed as steady state constraints are
shown in the following:
3600)(
)()()(
,
,,,,,,,,
oaggzrairairagg
oaggzrceilaggceiloaggzrwaggwnroaggzrwinaggwinraggconvrad
TTcVolACHTTUATTUATTUAQ
(5.2)
)()(2)( ,2,,,,,1,,,,,,, aggcaggreraggvwccondaggcaggreragghwccondaggreraggspraggwrw TTUTTUTTmc
)()(2 ,3,2,,,,1,,,, aggcaggcaggvcccondaggcaggreragghwccond TTUTTU (5.3)
)()(2)( ,1,21,,,,3,2,,,,2,,,, aggfloaggcaggvcflocondaggcaggcagghcccondaggcaggreraggvwccond TTUTTUTTU
(5.4)
)()(2)( ,3,1,,,,3,2,,,,2,32,,, aggcaggcaggvcccondaggcaggcagghcccondaggfloaggcaggvcflocond TTUTTUTTU
(5.5)
)()(2)( ,1,1,,,,2,1,,,,1,21,,, aggsaggfloaggvflocondaggfloaggfloagghflocondaggfloaggcaggvcflocond TTUTTUTTU
(5.6)
)()(2)( ,2,32,,,,2,1,,,,2,22,,, aggfloaggcaggvcflocondaggfloaggfloagghflocondaggsaggfloaggvflocond TTUTTUTTU
(5.7)
)()(,,,
,1
,,,
,1,1,1
aggvflocond
aggc
aggvflocond
aggraggfloaggs U
qUq
TT (5.8)
)()(2,,,
,2
2,,,
,2,2,2
aggvflocond
aggc
aggvflocond
aggraggfloaggs U
qUq
TT (5.9)

70
3600)(
)()()(
,
,,,,,,,
oaggzcairairagg
oaggzcwaggwncoaggzcwinaggwincaggrecaggspcaggwcw
TTcVolACHTTUATTUATTmc
(5.10)
naggzc
aggrecaggspcagghtraggrecaggspcaggwcw T
TTUTTmc
1
,,,
,,,, )2
()( (5.11)
)( ,1,,1 aggreaggmixaggpwwex TTmcq (5.12)
exaggrlaggspraggwrw qTTmc )( ,,, (5.13)
ALMTDUq exex (5.14)
aggrlaggre
aggspraggexsp
aggrlaggreaggspraggexsp
TTTT
TTTTLMTD
,,1
,,
,,1,,
ln
)()(
(5.15)
aggpwraggpwr
aggpwaggpwraggexspaggpwraggmix mUmU
mmUTmUT
,1,1
,1,1,,1, )1(
)1(
(5.16)
)1()TT( aggrs,aggrg,, COPEUcm comcomwaggwg (5.17)
)( ,,, aggreraggrlwaggwrcomcom TTcmCOPEU (5.18)
com
cond
EECOP (5.19)
aggwraggreraggwg
aggwraggwgaggreraggwraggwg
aggreraggwraggwgaggrer
mTCmCmmCTCmCmC
TCCmCmCTCCCCOP
,,,
aggrg,,,,aggrg,2
,2
,
2,
2aggrg,,,,aggrg,
13
T1211T1098
7T6543T21
(5.20)
)( ,,max aggrbaggbwwff TTcmHVebmU (5.21)
aggpwaggwc
aggpwaggexreaggwcaggrcaggrb mm
mTmTT
,1,
,1,,,,
)(
(5.22)
)()( ,1,,,1 gaggblossaggexspaggbwaggpw TTUTTcm (5.23)

71
)()( ,11,,1,1 gaggrelossaggexreaggrewaggpw TTUTTcm (5.24)
)()( ,2,,, gaggblossaggspcaggbwaggwc TTUTTcm (5.25)
)()( ,2,,, gaggreclossaggrcaggrecwaggwc TTUTTcm (5.26)
Figure 5.4.1 Comparison between the simplified aggregated model and the detailed full
order model
The open loop tests for both simplified aggregated model and detailed full order model
were conducted and the results were shown in Figure 5.4.1. The temperature responses

72
for the boiler, heat exchanger, residential zone, and commercial zone for both cases were
plotted. It can be noted that the errors between the two models is not very significant.
The optimization problem was solved by utilizing the fmincon (J) function in MATLAB.
The sensitivity of optimal set-points of boiler, heat exchanger and heat pump to the
outside air temperature were studied and shown in Figure 5.4.2.
Figure 5.4.2 Optimal set-point temperature profile for boiler, heat exchanger and heat
pump
The above figure shows the optimal set-point of boiler, heat exchanger and heat pump, as
a function of outside air temperature. The results show that the set-point temperatures

73
decrease as the outside air temperature increases. The above optimal set-point
temperature were implemented on the system by conducting a typical day simulation.
The results are depicted in Figure 5.4.3 and Figure 5.4.4.
Figure 5.4.3 Output responses of residential and commercial zone (optimal control strategy)

74
Figure 5.4.4 Output responses of boiler and heat exchanger (optimal control strategy)
Simulation results presented in Figure 5.4.4 reflect continuous change in boiler and heat
exchanger temperature which track the optimal set-points smoothly.
5.5 Energy consumption
System-based and control-based energy simulations were conducted. For the purpose of
simulation, two different days: a cold day (temperature range -15 o C to -5 o C) and a mild
day (temperature range -5 o C to 5 o C) were used. Comparison of the energy
consumption between all boiler system and hybrid hydronic system were made.
As shown in Table 5.5.1, the implementation of the ground source heat pump system can
contribute to 55.4% and 70% of boiler energy savings for the cold day and mild day, as
compared with the conventional all boiler system.
Energy simulation of hybrid hydronic system was conducted under three different control
strategies and the simulations results are presented in Table 5.5.2. It can be noted from
the table that on a cold day (-15 o C to -5 o C), the energy savings of 4.5% and 6.6%

75
respectively for the reset control and the optimal control were obtained compared to the
base case. Under the mild day conditions (-15 o C to -5 o C), the heating load demands are
lower, and as such more energy saving (19.9% and 22%) were realized by using the reset
and optimal control strategies.
The simulation results show that the outside air temperature reset control strategy is an
efficient and simple strategy to achieve energy savings. As the supply water temperatures
are regulated according to the outside air temperature, less pipe heat losses occur and
higher boiler operational efficiency can be achieved. Although the optimal control
strategy results in higher energy savings, it is relatively more difficult to implement in
real systems.

76
Daily outdoor air temperature profile (Cold winter day)
(-15<To<-5)
Conventional all boiler heating
system
Hybrid source heating system
Boiler energy saving
Total energy consumption (MJ)
2184.2 2185.1 NA
Energy consumption (commercial zone)
(MJ)
1182.4 (Boiler) 1183.5 (Boiler) NA
Energy consumption (Residential zone)
(MJ)
1001.8 (Boiler) 446.7 (Boiler) 554.9 (Heat
pump)
55.4%
Daily outdoor air temperature profile (Mild winter day)
(-5<To<5)
Conventional all boiler heating
system
Hybrid source heating system
Boiler energy saving
Total energy consumption (MJ)
1683.1 1684.7 NA
Energy consumption (commercial zone)
(MJ)
913.4 (Boiler) 915 (Boiler) NA
Energy consumption (Residential zone)
(MJ)
769.7 (Boiler) 231.5 (Boiler) 538.2 (Heat
pump)
70%
Table 5.1 Energy comparison of different operating methods (system based) under high heating low demand and low heating load demand conditions

77
Daily outdoor air temperature profile (Higher Demand)
(-15<To<-5)
Conventional fixed set-point PI control
Outdoor air temperature reset control
Optimal set-point PI control
Total energy consumption (MJ)
2185.1 2087 2040.2
Energy consumption (commercial zone) (MJ)
1183.5 1133.3 1099.6
Energy consumption (Residential zone) (MJ)
446.7 (Boiler) 554.9 (Heat pump)
380.6 (Boiler) 573.1 (Heat pump)
468.0 (Boiler) 472.6 (Heat pump)
Energy saving NA 4.5% 6.6% Daily outdoor air temperature profile (Lower Demand)
(-5<To<5)
Conventional fixed set-point PI control
Outdoor air temperature reset control
Optimal set-point PI control
Total energy consumption (MJ)
1684.7 1350 1317
Energy consumption (commercial zone) (MJ)
915 746.5 717.8
Energy consumption (Residential zone) (MJ)
231.5 (Boiler) 538.2 (Heat pump)
80.7 (Boiler) 522.8 (Heat pump)
183.6 (Boiler) 415.6 (Heat pump)
Energy saving NA 19.9% 22% Table 5.2 Energy comparison of different operating methods (control based) under high
heating low demand and low heating load demand conditions
5.6 Summary
The transient responses and energy simulations for all three control strategies were
conducted. With properly selected hot water supply set-point temperatures and
well-tuned PI controllers, both the residential and commercial zones can be maintained at
desirable conditions. However, supplying the hot water at constant temperature can lead

78
to higher pipe heat losses and low boiler efficiency at partial load conditions. To this end,
an outside air temperature reset strategy was implemented. The supply water
temperatures to the zones were regulated according to the outside air temperatures. As
such, continual adjustment of heat delivery to the zone was achieved to match the zone
heat losses. Moreover, less flow rate fluctuations at the zone level were observed for the
reset control. This more stable circulation can ensure that the heat delivered to different
parts is even and the potential localized heat sinks can be avoided. Furthermore, a
multi-variable constraint optimization technique for energy optimized operation was
applied to determine the steady state optimal set-point temperature. In this case, the
operational interactions among control loops were taken into consideration. Instead of
using same supply water temperature for heat pump and the heat exchanger, a unique
temperature profile for the heat pump was determined and used. These measures resulted
in further energy savings.

79
Chapter 6 Conclusions, Contributions and Recommendations
for Future Research
6.1 Conclusions and contributions
The development of the dynamic model, the design and simulations of the control
strategies and the model-based energy analysis for the hybrid source hydronic heating
system have been presented in this study. The conclusions and contributions are stated in
the following sections: design and dynamic modeling of the overall HWH system, energy
simulations under different operating conditions, and the study of control strategies for
the optimized system performance.
6.1.1 Dynamic modeling of the hybrid source hydronic heating system
Dynamic models for each component were first developed and integrated, including the
boiler, heat exchanger, ground loop heat pump, ground loop heat exchanger, baseboard
heaters, and radiant floor heating pipes. The hybrid hydronic heating system model was
used to analyze and simulate the system responses, in terms of the influences of building
heating load, zone air temperature variation, circulating water flow rate, as well as other
disturbances.
It was found that zone and boiler temperature responses are faster compared to the heat
exchanger and heat pump loop temperature because of the large thermal capacity of the

80
ground loop. For the daily temperature responses of the boiler and zone, the direct effect
of the ground loop thermal capacity is less considerable.
6.1.2 Adaptive control of hybrid hydronic system
A conventional fixed gain PI control and an adaptive gain PI control were presented and
the simulation results for both controls were investigated. A well-tuned PI controller was
found to give good temperature control. However, the dynamic characteristics of RFH
system change significantly during operation. The system nonlinearities cause unstable
oscillatory behavior in zone temperature, especially during the low load conditions. A
fixed set of control gains were shown to be not efficient to handle the multiple time
varying processes during the system operation. To this end, an adaptive gain strategy was
designed. It was shown that the adaptive control strategy gives good temperature control
under variable load conditions compared to the conventional fixed gain control. The
responses were smooth and control was stable.
6.1.3 Energy comparison under three different control strategies
Energy simulations of the system under different control strategies were conducted. The
fixed set-point strategy was found to contribute to higher energy consumption due to
higher pipe heat losses. The reset control strategy, on the other hand, was found to be
effective in reducing system energy consumption. The supply water temperature was
regulated as a function of the outdoor air temperature, so that the water temperature is

81
just sufficient to compensate for the zone heat losses. By this way, the boiler energy was
saved by 5% (cold winter day) and 20% (mild winter day), respectively, compared to the
fixed set-point control strategy. The optimal set-point control strategy resulted in the
highest energy saving of 7% (cold winter day) and 22% (mild winter day), respectively.
In this case, the interactions and tradeoff under different operating conditions between
sources are considered and modeled by a multi-variable constraint objective function
optimization technique.
It was also found that the ground loop heat pump system contributes between 50 to 70%
of energy to the residential RFH system compared to the all boiler system.
6.2 Recommendations for future research
1) Solar radiation incident on the radiant floor surface plays an important role for both
the energy and control analysis. Solar energy absorption by the thermal mass of a
floor heating system may contribute to a considerable reduction in energy
consumption. However, proper predictive control strategy should also be
implemented to anticipate the thermal lag effect.
2) Dynamic optimal control instead of steady-state optimal control should be studied
and implemented in the current system to develop improved control strategies.

82
References
[1] Bauer.D, W. Heidemann, and H.-J.G. Diersch, 2011. Transient 3D analysis of
borehole heat exchanger modeling. Geothermics 40, 250-260.
[2] Bernier, M.A., P.Pinel, R.Labib, and R. Paillot. 2004. A Multiple-load aggregation
Algorithm for Annual Hourly Simulations of GCHP Systems. HVAC&R Research.
[3] Carslaw HS, Jaeger JC. 1946. Conduction of heat in solids. Oxford UK: Claremore
[4] Cecchini, C., D. Marchal. 1991. A simulation model of refrigerant and
air-conditioning equipment based on experimental data. ASHRAE Transactions 97(2):
388-393.
[5] Chae. Y.T, K. H. Lee, J. S. Park. 2011. Improved thermal performance of a hydronic
radiant panel heating system by the optimization of tube shapes. Journal of Zhejiang
University (Applied Physics & Engineering), 428-437.
[6] Chen, T.Y. 2002. Application of Adaptive Predictive Control to a Floor Heating
System with a Large Thermal lag. Energy and Buildings. 34 (2002). Pp.45-51.
[7] Cho, S.H, and Zaheer-uddin, M, (1999) "An experimental study of multiple parameter
switching control for radiant floor heating systems", Energy, the Int. Journal, Vol.24, pp.
433-444.
[8] Daniel E. Fisher and Simon J. Rees, 2005. Modeling Ground Source Heat Pump
Systems in a Building Energy Simulation Program (EnergyPlus). Ninth International
IBPSA Conference.

83
[9] Eskilson, P. 1987. Thermal Analysis of Heat Extraction Boreholes. Doctoral Thesis.
University of Lund, Sweden.
[10] Fatemeh Tahersima, Jakob Stoustrup and Henrik Rasmussen. 2011. Eliminating
Oscillations in TRV-Controlled Hydronic Radiators. 2011 50th IEEE Conference on
Decision and Control and European Control Conference (CDC-ECC) Orlando, FL, USA,
December 12-15, 2011
[11] Florides. G and S. Kalogirou. 2007. Ground heat exchangers – A review of systems,
models and applications. Renewable Energy 32 (2007). 2461-2478.
[12] Ingersoll LR, Plass HJ. Theory of the ground pipe source for the heat pump. ASHVE
Trans 1948; 54:339–48.
[13] Ingersoll, L.R. and A.C. Zobel. 1954. Heat conduction with engineering and
geological application, 2th ed. McGraw-Hill, New York.
[14] Jin, Spitler. 2002. A parameter estimation based model of water-to-water heat pumps
for use in energy calculation programs. ASHRAE Transactions 2002, Vol 108, Part1.
[15] Kavanaugh SP. 1985. Simulation and experimental verification of vertical ground
coupled heat pump systems. Ph.D dissertation. Stillwater, Oklahoma: Oklahoma State
University, Stillwater.
[16] Li L, Zaheer-uddin, M, 2010. Steady State and Dynamic Modeling of an Indirect
District Heating System. Int. Journal of Air-Conditioning and Refrigeration Vol. 18, No.
1 (2010) 61-75
84
[17] Li, S.C 2010. Modeling and control strategies for radiant floor heating systems.
Master thesis, Concordia University.
[18] Liao,Z., Parand. 2002. Develop a Dynamic Model of Gas and Oil Burned Boilers
for Optimization of Boiler Control in Central Heating Systems.
[19] Morrison, A.1997. GS2000 Software. Proceedings of the Third International Heat
Pumps in Cold Climates Conference, Wolfville, Nova Scotia, pp. 67-76.
Press
[20] Sattari. S and B. Farhanieh, 2006. A parametric study on radiant floor heating
system perperformance. Renewable Energy 31, 1617-1626.
[21] Singh. G, M. Zaheer-uddin, R.V.Patel. 2000. Adaptive control of multivariable
thermal processes in HVAC systems. Energy Conversion & Management 41 (2000),
1671-1685.
[22] Spitler, J.D, S.J.Rees, and C. Yavuzturk. 2000. Recent developments in ground
source heat pump system design, modeling and applications. Proceedings of the Dublin
2000 Conference.
[23] Stefanuk, N.B.M., J.D. Aplevich, and M. Renksizbulut. 1992. Modeling and
simulation of a superheat-controlled water-to-water heat pump. ASHRAE Transactions
98(2): 172-184.
[24] Tang. 2003. Modeling Packaged Heat Pumps in a Quasi-steady State Energy
Simulation Program. Master thesis. Oklahoma State University.

85
[25] Nam.Y, R. Ooka, and S. Hwang, 2008. Development of a numerical model to
predict heat exchange rates for a ground-source heat pump system. Energy and Buildings
40, 2133-2140.
[26] Zaheer-uddin, M, Z.L. Zhang, and S.H. Cho (2001) "Augmented control strategies
for radiant floor heating systems", Int. Journal of Energy Research, Vol.25.
[27] Zaheer-uddin, M. 1993. Optimal, Sub-optimal and Adaptive Control Methods for the
Design of Temperature Controllers for Intelligent Buildings. Building and Environment,
Vol. 28, No. 3, pp. 311-322.
[28] Zaheer-uddin, M., P. Monastiriakos, 1998. Hydronic heating systems: transient
modeling, validation and load matching control. Int. Journal of Energy Research, Vol. 22,
pp. 33-46

86
Appendices
Appendix-A Design parameters of Hybrid Hydronic Heating System
Symbol Description Value or formula Heating Load Estimation
Tod [o C] Outside air temperature at design condition
-15
Tzcd [o C] Commercial zone air temperature at design condition
21
Tzrd [o C] Residential zone air temperature at design condition
22
Qhc [W] Total heating load of commercial zone
14224
Qhcz1 [W] Heating load of commercial zone 1
5715.6
Qhcz2 [W] Heating load of commercial zone 2
2973.7
Qhcz3 [W] Heating load of commercial zone 3
3243.5
Qhcz4 [W] Heating load of commercial zone 4
2291.6
Qhr [W] Total heating load of residential zone
12788
Qhrz1a [W] Heating load of residential zone 1a
748.4
Qhrz1b [W] Heating load of residential zone 1b
1053.3
Qhrz1c [W] Heating load of residential zone 1c
452.6
Qhrz1d [W] Heating load of residential zone 1d
942.6
Boiler selection Qbd [W] Boiler capacity 35000 Radiant floor heating system sizing

87
Trspd [o C] Residential zone design supply water temperature
45
Trred [o C] Residential zone design return water temperature
35
di,r [m] Inner diameter of the tube 0.0087 do,r [m] Outer diameter of the tube 0.0127 St [m] Interval between tubes Varies for each zone tp [m] Thickness of the floor slab
concrete layer 0.0381
tc [m] Thickness of the floor slab covering layer
0.009525
L [m] Radiant floor pipe length for each control segment
Varies for each zone
Baseboard heater sizing
Tcspd [o C] Commercial zone design supply water temperature
85
Tcred [o C] Commercial zone design return water temperature
65
n Factor identified based on heater heat transfer test
0.3
Uhtr1 [W/K]
Thermal conductance of the baseboard heater 1
nczd
credcspd
hczhtr
TTT
QU
1
11
)2
)((
25.0
Uhtr2 [W/K]
Thermal conductance of the baseboard heater 2
nczd
credcspd
hczhtr
TTTQ
U
1
12
)2
)((
5.0
Uhtr3 [W/K]
Thermal conductance of the baseboard heater 3
nczd
credcspd
hczhtr
TTT
QU
1
13
)2
)((
25.0
Uhtr4 [W/K]
Thermal conductance of the baseboard heater 4
nczd
credcspd
hczhtr
TTTQ
U
1
24
)2
)((
5.0

88
Uhtr5 [W/K]
Thermal conductance of the baseboard heater 5
nczd
credcspd
hczhtr
TTTQ
U
1
25
)2
)((
5.0
Uhtr6 [W/K]
Thermal conductance of the baseboard heater 6
nczd
credcspd
hczhtr
TTTQ
U
1
36
)2
)((
5.0
Uhtr7 [W/K]
Thermal conductance of the baseboard heater 7
nczd
credcspd
hczhtr
TTTQ
U
1
37
)2
)((
5.0
Uhtr8 [W/K]
Thermal conductance of the baseboard heater 8
nczd
credcspd
hczhtr
TTTQ
U
1
48
)2
)((
0.1
Ground loop heat exchanger sizing
N1 Number of bores in each series circuit
2
N2 Number of parallel circuit 2 di,g [m] Inner diameter of the tube 0.0262 do,g [m] Outer diameter of the tube 0.032 z [m] Distance between vertical
nodes 2/13.7
z1 [m] Distance between vertical nodes, z<10 m
2
z2 [m] Distance between vertical nodes, 10m<z<75m
13.7
s [m] Shank space between two tubes
0.06
Lbore [m] Center to center distance between two boreholes
6
Dbore [m] Borehole diameter 0.13 Dpbore [m] Borehole depth 75 Heat pump selection
Heat pump type Water-to-water heat pump

89
Refrigeration type R410a Ecom [W] Heat pump compressor
power 5000
Heat exchanger sizing
Texspd [o C] Heat exchanger primary side design supply water temperature
85
Texred [o C] Heat exchanger primary side design return water temperature
75
LMTDd Design Log Mean Temperature Difference
rredexred
rspdexspd
rredexredrspdexspdd
TTTT
TTTTLMTD
ln
)()(
Uex [W/(m2o C)] Heat transfer coefficient of heat exchanger
3000
Aex [m2] Heat transfer area of heat exchanger
dex
hrex LMTDU
QA
10.60 7.42
79.1 80.0
8/19/09

90
Appendix-B Premium Hydronic System H Series HS Specification Catalogue
HS018 - Performance Data cont. Heating Capacity
Source EST °F Flow
GPM
4 25
5
ELT °F 60 80
100 120 60 80
100 120 60
3 80 100 120 60
30 4 80 100 120 60
5 80 100 120 60
3 80 100 120 60
50 4 80 100 120 60
5 80 100 120 60
3 80 100 120 60
70 4 80 100 120 60
5 80 100 120 60
3 80 100 120 60
90 4 80 100 120 60
5 80 100 120
80.5 99.4
29.9 28.2
0.88 1.19
26.9 24.2
9.96 6.97
78.9 80.0
76.3 95.5
80.1 99.0
29.2 27.7
0.88 1.19
26.2 23.6
9.72 6.84
75.7 77.1
76.0 95.2
69.8 89.4
109.1 128.7 70.4 90.0
109.6 129.2 70.7 90.2
109.8 129.4 70.9 90.5 110.0 129.6 73.5 93.0
112.4 131.9 73.9 93.3 112.7 132.1 74.2 93.6 112.9 132.3 76.6 95.9
115.2 134.5 77.1 96.3 115.5 134.7 77.5 96.7
115.8 135.0 79.6 98.6
14.2 13.7 13.2 12.7 15.1 14.5 14.0 13.4 15.5 14.9 14.3 13.7 15.9 15.2 14.6 13.9 19.7 18.9 18.1 17.3 20.2 19.3 18.4 17.6 20.7 19.8 18.8 17.9 24.2 23.2 22.1 21.1 24.9 23.7 22.6 21.5 25.5 24.3 23.0 21.8 28.5 27.1
0.90 1.21 1.53 1.84 0.91 1.22 1.54 1.85 0.91 1.22 1.53 1.85 0.90 1.21 1.53 1.84 0.90 1.21 1.52 1.84 0.89 1.21 1.52 1.83 0.89 1.20 1.52 1.83 0.88 1.19 1.51 1.82 0.88 1.19 1.51 1.82 0.88 1.19 1.51 1.82 0.88 1.18
11.1 9.6 8.0 6.4
12.0 10.4 8.7 7.1
12.4 10.7 9.0 7.4
12.8 11.1 9.4 7.6
16.6 14.7 12.9 11.0 17.1 15.2 13.2 11.3 17.7 15.6 13.6 11.6 21.2 19.1 17.0 14.9 21.8 19.6 17.4 15.2 22.5 20.2 17.9 15.6 25.5 23.0
4.62 3.31 2.53 2.02 4.86 3.48 2.66 2.12 5.02 3.58 2.73 2.17 5.18 3.68 2.80 2.21 6.46 4.58 3.48 2.76 6.62 4.69 3.55 2.81 6.83 4.82 3.64 2.86 8.06 5.69 4.30 3.40 8.27 5.82 4.39 3.45 8.49 5.96 4.48 3.51 9.49 6.70
20.4 21.1 21.7 22.4 21.8 22.9 24.0 25.1 23.2 24.2 25.1 26.0 24.7 25.4 26.1 26.9 38.6 39.9 41.2 42.4 40.7 41.7 42.8 43.8 42.7 43.5 44.4 45.2 55.4 56.9 58.3 59.8 58.1 59.3 60.5 61.7 60.7 61.7 62.6 63.6 72.5 74.2
67.4 87.1
106.8 126.6 68.3 88.0
107.7 127.4 68.6 88.2
107.9 127.5 68.8 88.4
108.0 127.6 70.9 90.4
110.0 129.5 71.2 90.7
110.2 129.7 71.5 90.9
110.4 129.8 73.4 92.8 112.2 131.6 73.8 93.1 112.5 131.8 74.2 93.5
112.7 132.0 75.6 94.9
14.3 13.8 13.3 12.8 15.2 14.6 14.0 13.5 15.6 15.0 14.3 13.7 16.1 15.3 14.6 13.9 19.8 19.0 18.1 17.3 20.4 19.5 18.5 17.6 21.0 19.9 18.9 17.9 24.5 23.4 22.3 21.2 25.2 23.9 22.7 21.5 25.9 24.5 23.2 21.9 28.4 27.1
0.88 1.19 1.51 1.82 0.90 1.21 1.52 1.83 0.89 1.20 1.50 1.81 0.89 1.19 1.49 1.80 2.74 2.43 2.12 1.80 1.81 1.80 1.80 1.80 0.87 1.17 1.48 1.79 4.59 3.65 2.72 1.78 2.72 2.41 2.09 1.78 0.85 1.16 1.47 1.78 0.85 1.15
11.3 9.7 8.1 6.5
12.1 10.5 8.8 7.2
12.6 10.9 9.2 7.5
13.0 11.3 9.5 7.8
10.4 10.7 10.9 11.1 14.2 13.3 12.4 11.5 18.0 15.9 13.9 11.8 8.8
10.9 13.0 15.1 15.9 15.7 15.6 15.4 22.9 20.6 18.2 15.8 25.5 23.1
4.76 3.38 2.58 2.05 4.96 3.55 2.71 2.16 5.14 3.66 2.79 2.21 5.32 3.78 2.87 2.27 4.71 3.48 2.85 2.82 3.31 3.16 3.02 2.87 7.12 4.99 3.75 2.94 4.46 3.41 2.99 3.48 2.71 2.91 3.18 3.54 8.93 6.20 4.63 3.61 9.84 6.92
20.3 21.0 21.6 22.3 21.7 22.8 23.9 25.0 23.2 24.1 25.0 25.9 24.6 25.3 26.1 26.8 42.8 42.7 42.5 42.3 42.7 43.0 43.4 43.7 42.6 43.4 44.3 45.1 64.0 62.5 61.1 59.6 62.2 62.0 61.8 61.6 60.5 61.5 62.5 63.5 72.5 74.1
65.9 85.7
105.5 125.3 66.3 86.0
105.8 125.6 66.5 86.2
105.9 125.6 66.7 86.4
106.0 125.7 68.2 87.9
107.5 127.2 68.5 88.1
107.7 127.3 68.7 88.3
107.8 127.4 70.2 89.7
109.2 128.7 70.5 90.0
109.4 128.9 70.8 90.2
109.6 129.1 71.6 91.1
14.4 13.9 13.3 12.8 15.2 14.6 14.1 13.5 15.7 15.0 14.4 13.7 16.2 15.4 14.7 13.9 20.0 19.1 18.2 17.4 20.6 19.6 18.6 17.7 21.2 20.1 19.0 18.0 24.7 23.5 22.4 21.2 25.5 24.2 22.9 21.6 26.2 24.8 23.4 22.0 28.2 27.0
0.86 1.17 1.49 1.80 0.88 1.19 1.49 1.80 0.88 1.18 1.48 1.78 0.87 1.16 1.46 1.75 4.59 3.65 2.71 1.77 2.72 2.40 2.08 1.76 0.85 1.15 1.45 1.75 8.30 6.11 3.93 1.74 4.56 3.62 2.68 1.74 0.82 1.13 1.43 1.74 0.81 1.11
11.5 9.9 8.3 6.7
12.2 10.6 9.0 7.4
12.7 11.0 9.3 7.6
13.2 11.5 9.7 7.9 4.3 6.6 9.0
11.3 11.3 11.4 11.5 11.7 18.3 16.2 14.1 12.0 -3.6 2.7 9.0
15.3 9.9 11.8 13.7 15.7 23.4 21.0 18.5 16.1 25.4 23.2
4.91 3.46 2.63 2.08 5.06 3.61 2.76 2.20 5.26 3.75 2.85 2.26 5.46 3.89 2.95 2.33 2.97 2.37 2.21 2.88 2.22 2.40 2.63 2.94 7.41 5.17 3.87 3.02 0.87 1.13 1.67 3.57 1.64 1.96 2.50 3.64 9.36 6.45 4.78 3.70 10.20 7.14
20.3 20.9 21.6 22.3 21.6 22.7 23.8 24.9 23.1 24.0 24.9 25.8 24.5 25.3 26.0 26.7 47.1 45.4 43.8 42.2 44.8 44.4 44.0 43.6 42.4 43.3 44.2 45.1 72.5 68.2 63.8 59.5 66.4 64.8 63.1 61.4 60.3 61.4 62.4 63.4 72.5 74.0
Operation not recommended
LLT °F
Load Flow-3 GPM HC MBTUH Power
kW HE MBTUH COP LST
°F LLT °F HC
MBTUH Load Flow-4 GPM
Power kW HE
MBTUH COP LST °F LLT
°F HC MBTUH
Load Flow-5 GPM Power kW HE
MBTUH COP LST °F
Operation not recommended 29.0 27.6
0.85 1.15
26.1 23.7
10.05 7.05
75.7 77.0
71.9 91.4
28.8 27.6
0.81 1.11
26.0 23.8
10.40 7.28
75.8 77.0
Operation not recommended 29.6 28.2
0.85 1.15
26.7 24.2
10.28 7.19
79.0 80.0
72.1 91.6
29.3 28.1
0.81 1.11
26.5 24.3
10.60 7.42
79.1 80.0
Operation not recommended

91
HS025 - Performance Data cont. Heating Capacity
Source EST °F Flow
GPM
5.5 25
7
ELT °F 60 80
100 120 60 80
100 120 60
4 80 100 120 60
30 5.5 80 100 120 60
7 80 100 120 60
4 80 100 120 60
50 5.5 80 100 120 60
7 80 100 120 60
4 80 100 120 60
70 5.5 80 100 120 60
7 80 100 120 60
4 80 100 120 60
90 5.5 80 100 120 60
7 80 100 120
84.2 102.9
47.0 44.5
1.39 1.82
42.3 38.3
9.91 7.18
77.6 78.7
78.7 97.8
83.5 102.3
45.5 43.2
1.38 1.81
40.8 37.0
9.66 6.99
73.6 75.2
78.2 97.4
71.0 90.6
110.1 129.7 71.4 91.0 110.6 130.2 71.8 91.3
110.8 130.3 72.1 91.6 111.0 130.5 75.2 94.5
113.9 133.3 75.7 95.0 114.3 133.6 76.2 95.4
114.7 133.9 78.9 98.1 117.3 136.4 79.6 98.7
117.8 136.9 80.3 99.3
118.3 137.3 82.7
101.6
21.4 20.5 19.7 18.8 22.2 21.4 20.6 19.8 22.9 21.9 21.0 20.1 23.5 22.4 21.4 20.3 29.4 28.2 27.0 25.9 30.4 29.1 27.7 26.4 31.5 30.0 28.5 27.0 36.6 35.0 33.5 31.9 38.0 36.3 34.5 32.8 39.4 37.5 35.5 33.6 44.0 41.9
1.28 1.70 2.12 2.54 1.29 1.71 2.12 2.54 1.29 1.71 2.12 2.54 1.29 1.71 2.12 2.54 1.31 1.74 2.16 2.59 1.31 1.74 2.16 2.59 1.32 1.74 2.17 2.59 1.33 1.77 2.20 2.64 1.34 1.77 2.21 2.64 1.34 1.77 2.21 2.64 1.37 1.80
17.0 14.7 12.4 10.1 17.8 15.6 13.4 11.1 18.4 16.1 13.7 11.4 19.1 16.6 14.1 11.6 24.9 22.3 19.6 17.0 25.9 23.2 20.4 17.6 27.0 24.0 21.1 18.1 32.1 29.0 25.9 22.9 33.4 30.2 27.0 23.7 34.8 31.4 28.0 24.6 39.3 35.7
4.90 3.54 2.72 2.17 5.04 3.67 2.84 2.28 5.19 3.76 2.90 2.31 5.34 3.85 2.95 2.34 6.55 4.74 3.65 2.91 6.79 4.90 3.76 2.99 6.98 5.02 3.83 3.04 8.06 5.81 4.45 3.54 8.34 6.00 4.58 3.63 8.61 6.19 4.72 3.73 9.41 6.80
20.0 20.7 21.3 22.0 20.8 22.0 23.1 24.3 22.6 23.5 24.5 25.4 24.4 25.1 25.8 26.6 37.2 38.5 39.9 41.2 39.6 40.7 41.8 42.9 42.1 42.9 43.8 44.7 53.5 55.0 56.6 58.2 56.6 57.9 59.2 60.5 59.7 60.7 61.8 62.8 69.7 71.6
68.1 87.7
107.4 127.1 69.1 88.7
108.4 128.1 69.3 88.9
108.6 128.2 69.6 89.1
108.7 128.3 71.9 91.4
111.0 130.5 72.3 91.8 111.3 130.7 72.7 92.1 111.5 131.0 74.8 94.2 113.5 132.9 75.3 94.7
114.0 133.3 75.9 95.1
114.4 133.6 77.7 96.9
21.5 20.7 19.8 19.0 22.4 21.6 20.8 20.0 23.0 22.1 21.2 20.3 23.7 22.6 21.6 20.6 29.5 28.3 27.1 25.9 30.4 29.1 27.8 26.5 31.4 30.0 28.5 27.1 36.5 35.0 33.4 31.9 37.9 36.2 34.5 32.8 39.2 37.3 35.5 33.6 43.7 41.7
1.26 1.67 2.09 2.51 1.26 1.68 2.09 2.51 1.26 1.68 2.09 2.51 1.26 1.68 2.09 2.51 1.27 1.69 2.11 2.54 1.27 1.69 2.11 2.54 1.27 1.69 2.11 2.54 1.28 1.71 2.14 2.57 1.28 1.71 2.14 2.57 1.29 1.71 2.14 2.57 1.31 1.73
17.2 14.9 12.7 10.4 18.1 15.9 13.6 11.4 18.7 16.4 14.1 11.7 19.3 16.9 14.5 12.1 25.1 22.5 19.9 17.3 26.1 23.4 20.6 17.9 27.1 24.2 21.3 18.4 32.1 29.1 26.1 23.1 33.5 30.3 27.2 24.0 34.8 31.5 28.2 24.8 39.2 35.8
5.02 3.62 2.77 2.21 5.21 3.78 2.91 2.33 5.35 3.87 2.97 2.37 5.50 3.96 3.03 2.41 6.79 4.89 3.75 2.99 7.02 5.04 3.86 3.06 7.23 5.18 3.95 3.13 8.37 6.00 4.59 3.65 8.65 6.19 4.72 3.74 8.95 6.40 4.86 3.84 9.79 7.07
19.9 20.6 21.3 21.9 20.7 21.8 23.0 24.1 22.5 23.4 24.4 25.3 24.3 25.0 25.7 26.5 37.1 38.4 39.7 41.1 39.5 40.6 41.7 42.8 42.0 42.9 43.7 44.6 53.4 55.0 56.5 58.1 56.6 57.9 59.1 60.4 59.7 60.7 61.7 62.7 69.8 71.6
66.4 86.1
105.9 125.6 66.7 86.4
106.2 125.9 66.8 86.6
106.3 126.0 67.0 86.7
106.4 126.2 68.7 88.3
108.0 127.7 69.0 88.6
108.2 127.8 69.2 88.8
108.4 128.0 70.7 90.3
109.8 129.4 71.1 90.6
110.1 129.6 71.5 91.0 110.4 129.9 72.8 92.2
21.6 20.8 19.9 19.1 22.6 21.8 20.9 20.1 23.2 22.3 21.4 20.5 23.8 22.8 21.9 20.9 29.5 28.3 27.2 26.0 30.5 29.2 27.9 26.6 31.4 30.0 28.6 27.3 36.4 34.9 33.4 31.9 37.7 36.1 34.4 32.8 39.0 37.2 35.4 33.6 43.4 41.5
1.23 1.65 2.06 2.48 1.23 1.64 2.06 2.47 1.23 1.64 2.06 2.47 1.23 1.64 2.06 2.47 1.23 1.65 2.06 2.48 1.23 1.65 2.06 2.48 1.23 1.65 2.06 2.48 1.23 1.65 2.07 2.49 1.23 1.65 2.07 2.49 1.23 1.65 2.07 2.49 1.25 1.66
17.4 15.1 12.9 10.6 18.4 16.2 13.9 11.7 19.0 16.7 14.4 12.1 19.6 17.2 14.8 12.5 25.3 22.7 20.1 17.5 26.3 23.6 20.9 18.2 27.2 24.4 21.6 18.8 32.2 29.3 26.3 23.4 33.5 30.4 27.3 24.3 34.8 31.6 28.3 25.1 39.1 35.9
5.15 3.70 2.83 2.26 5.38 3.88 2.98 2.38 5.53 3.98 3.05 2.43 5.67 4.07 3.12 2.48 7.03 5.04 3.85 3.07 7.25 5.19 3.96 3.15 7.48 5.34 4.06 3.22 8.67 6.20 4.73 3.75 8.98 6.40 4.87 3.85 9.29 6.61 5.01 3.95
10.17 7.33
19.9 20.5 21.2 21.9 20.5 21.7 22.8 24.0 22.4 23.3 24.2 25.2 24.2 24.9 25.6 26.3 37.0 38.3 39.6 41.0 39.5 40.6 41.6 42.7 42.0 42.8 43.6 44.5 53.4 54.9 56.4 57.9 56.6 57.8 59.0 60.3 59.7 60.7 61.7 62.6 69.8 71.5
Operation not recommended
LLT °F
Load Flow-4 GPM HC MBTUH Power
kW HE MBTUH COP LST
°F LLT °F
Load Flow-5 .5 GPM HC MBTUH Power
kW HE MBTUH COP LST
°F LLT °F HC
MBTUH Load Flow-7 GPM
Power kW HE
MBTUH COP LST °F
Operation not recommended 44.8 42.8
1.32 1.74
40.3 36.8
9.96 7.22
73.8 75.2
73.0 92.5
44.1 42.4
1.26 1.66
39.8 36.7
10.30 7.46
73.9 75.2
Operation not recommended 45.9 43.8
1.33 1.74
41.4 37.9
10.16 7.38
77.8 78.8
73.2 92.7
44.8 43.2
1.26 1.67
40.5 37.5
10.42 7.59
78.1 79.0
Operation not recommended

92
HS040 - Performance Data cont. Heating Capacity
Source EST °F Flow
GPM
7.5 25
10
ELT °F 60 80
100 120 60 80
100 120 60
5 80 100 120 60
30 7.5 80 100 120 60
10 80 100 120 60
5 80 100 120 60
50 7.5 80 100 120 60
10 80 100 120 60
5 80 100 120 60
70 7.5 80 100 120 60
10 80 100 120 60
5 80 100 120 60
90 7.5 80 100 120 60
10 80 100 120
87.1 106.5 125.9
65.8 64.3 62.7
2.02 2.59 3.16
58.9 55.4 51.9
9.54 7.27 5.82
77.9 78.6 79.3
79.5 99.0 118.4
86.2 105.5 124.8
63.7 61.9 60.1
2.01 2.58 3.15
56.8 53.1 49.3
9.30 7.03 5.59
72.6 73.8 75.0
79.0 98.4
117.8
72.2 91.9 111.5 131.2 72.7 92.4 112.0 131.7 73.3 92.8
112.3 131.8 73.9 93.2 112.6 131.9 76.9 96.3
115.6 134.9 77.7 96.9 116.1 135.4 78.5 97.6
116.7 135.8 81.2
100.2 119.2 138.2 82.1
101.1 120.0 138.9 83.1
102.0 120.8 139.6 85.4
104.5
29.7 28.8 28.0 27.1 30.9 30.0 29.2 28.3 32.3 31.0 29.8 28.6 33.6 32.0 30.5 28.9 41.1 39.5 37.9 36.3 43.0 41.1 39.1 37.2 44.9 42.6 40.4 38.2 51.3 48.9 46.6 44.2 53.7 51.1 48.5 45.9 56.1 53.2 50.4 47.5 61.5 59.4
1.83 2.42 3.00 3.59 1.84 2.42 2.99 3.57 1.84 2.43 3.02 3.61 1.84 2.44 3.04 3.64 1.88 2.47 3.06 3.65 1.86 2.46 3.06 3.66 1.84 2.45 3.07 3.68 1.92 2.52 3.12 3.72 1.88 2.49 3.11 3.72 1.84 2.47 3.09 3.72 1.99 2.56
23.5 20.6 17.7 14.8 24.6 21.8 19.0 16.1 26.0 22.7 19.5 16.3 27.3 23.7 20.1 16.5 34.7 31.1 27.4 23.8 36.6 32.7 28.7 24.7 38.6 34.3 30.0 25.6 44.7 40.3 35.9 31.5 47.3 42.6 37.9 33.2 49.8 44.8 39.8 34.8 54.7 50.7
4.76 3.50 2.73 2.21 4.92 3.64 2.85 2.32 5.14 3.74 2.90 2.32 5.35 3.85 2.94 2.33 6.37 4.67 3.61 2.90 6.77 4.89 3.75 2.98 7.14 5.08 3.85 3.03 7.83 5.69 4.37 3.48 8.37 6.00 4.57 3.61 8.93 6.32 4.77 3.74 9.05 6.79
20.2 20.8 21.3 21.9 19.8 21.0 22.2 23.4 22.1 23.1 24.0 25.0 24.4 25.1 25.9 26.6 35.7 37.2 38.7 40.2 38.9 40.1 41.3 42.4 42.0 42.9 43.8 44.7 51.5 53.4 55.2 57.0 55.6 57.1 58.5 59.9 59.7 60.8 61.8 62.8 67.4 69.1
68.2 87.9
107.7 127.4 69.5 89.3
109.0 128.7 70.0 89.6
109.2 128.9 70.4 89.9
109.5 129.0 72.7 92.2 111.7 131.2 73.2 92.7
112.1 131.5 73.8 93.1
112.5 131.9 75.8 95.1 114.4 133.7 76.5 95.7
115.0 134.2 77.2 96.4 115.5 134.7 78.5 97.8
29.7 28.8 27.9 27.0 30.8 30.0 29.1 28.3 32.2 31.0 29.9 28.7 33.6 32.1 30.7 29.2 40.8 39.3 37.7 36.2 42.7 40.9 39.1 37.3 44.5 42.5 40.4 38.4 50.9 48.6 46.4 44.2 53.1 50.7 48.3 45.9 55.4 52.8 50.2 47.6 59.0 56.7
1.78 2.36 2.94 3.52 1.79 2.36 2.93 3.50 1.78 2.36 2.94 3.52 1.78 2.37 2.95 3.54 1.81 2.39 2.96 3.54 1.80 2.38 2.97 3.55 1.79 2.38 2.97 3.56 1.83 2.42 3.00 3.59 1.81 2.40 2.99 3.58 1.80 2.39 2.99 3.58 1.88 2.44
23.6 20.7 17.9 15.0 24.7 21.9 19.1 16.3 26.1 23.0 19.9 16.7 27.5 24.1 20.6 17.1 34.7 31.1 27.6 24.1 36.5 32.7 29.0 25.2 38.4 34.3 30.3 26.3 44.6 40.4 36.1 31.9 46.9 42.5 38.1 33.6 49.2 44.6 40.0 35.4 52.5 48.3
4.89 3.58 2.78 2.25 5.06 3.73 2.91 2.37 5.29 3.85 2.98 2.39 5.54 3.99 3.05 2.42 6.61 4.82 3.72 2.99 6.95 5.03 3.86 3.08 7.29 5.23 3.99 3.16 8.16 5.91 4.54 3.61 8.58 6.18 4.73 3.75 9.04 6.47 4.93 3.90 9.20 6.80
20.1 20.7 21.3 21.9 19.8 21.0 22.1 23.3 22.1 23.0 23.9 24.9 24.3 25.0 25.8 26.5 35.7 37.2 38.6 40.1 38.9 40.0 41.2 42.3 42.1 42.9 43.8 44.6 51.6 53.4 55.1 56.8 55.7 57.1 58.4 59.8 59.9 60.8 61.8 62.7 68.3 70.1
66.1 85.9
105.7 125.5 66.3 86.2
106.0 125.8 66.6 86.4
106.2 125.9 66.9 86.6
106.4 126.1 68.4 88.1
107.8 127.5 68.7 88.4
108.0 127.7 69.1 88.7
108.3 128.0 70.4 90.0
109.5 129.1 70.8 90.4
109.9 129.5 71.3 90.8 110.3 129.8 71.6 91.1
29.6 28.7 27.8 26.9 30.7 29.9 29.0 28.2 32.2 31.1 30.0 28.9 33.6 32.2 30.9 29.5 40.6 39.1 37.6 36.2 42.3 40.7 39.0 37.4 44.1 42.3 40.4 38.6 50.4 48.3 46.2 44.1 52.5 50.3 48.1 45.9 54.6 52.3 50.0 47.7 56.4 53.9
1.72 2.29 2.87 3.44 1.73 2.30 2.86 3.43 1.73 2.29 2.86 3.43 1.72 2.29 2.86 3.43 1.74 2.30 2.87 3.44 1.74 2.30 2.87 3.44 1.74 2.30 2.87 3.44 1.74 2.31 2.88 3.45 1.75 2.31 2.88 3.45 1.75 2.31 2.88 3.44 1.77 2.32
23.7 20.9 18.0 15.2 24.8 22.0 19.3 16.5 26.3 23.2 20.2 17.1 27.7 24.4 21.1 17.8 34.6 31.2 27.8 24.4 36.4 32.8 29.2 25.6 38.2 34.4 30.6 26.9 44.5 40.4 36.4 32.3 46.5 42.4 38.3 34.1 48.6 44.4 40.2 36.0 50.4 46.0
5.04 3.67 2.84 2.29 5.20 3.81 2.97 2.41 5.46 3.97 3.07 2.46 5.72 4.12 3.16 2.52 6.84 4.97 3.84 3.08 7.15 5.18 3.98 3.19 7.43 5.37 4.13 3.29 8.49 6.13 4.70 3.75 8.82 6.38 4.90 3.90 9.14 6.62 5.09 4.06 9.34 6.80
20.1 20.7 21.3 21.9 19.8 20.9 22.1 23.2 22.0 22.9 23.9 24.8 24.3 25.0 25.6 26.3 35.7 37.1 38.5 39.9 38.9 40.0 41.1 42.2 42.1 42.9 43.7 44.5 51.7 53.3 55.0 56.7 55.8 57.1 58.4 59.6 60.0 60.8 61.7 62.6 69.2 71.0
Operation not recommended
LLT °F
Load Flow-5 GPM HC MBTUH Power
kW HE MBTUH COP LST
°F LLT °F
Load Flow-7 .5 GPM HC MBTUH Power
kW HE MBTUH COP LST
°F LLT °F HC
MBTUH Load Flow-10 GPM
Power kW HE
MBTUH COP LST °F
Operation not recommended 60.4 58.3 56.2 61.8 59.9 58.1
1.89 2.45 3.01 1.90 2.46 3.02
53.9 49.9 45.9 55.3 51.5 47.8
9.37 6.97 5.47 9.55 7.13 5.62
73.5 74.7 76.0 78.6 79.4 80.2
71.8 91.3
110.8 71.9 91.5 111.0
57.1 54.7 52.4 57.7 55.6 53.4
1.77 2.33 2.88 1.77 2.33 2.88
51.0 46.8 42.6 51.7 47.6 43.6
9.44 6.90 5.33 9.55 7.00 5.43
74.3 75.6 76.9 79.3 80.2 81.0
Operation not recommended
Operation not recommended

93
HS050 - Performance Data cont. Heating Capacity
Source EST °F Flow
GPM
11.5 25
15
ELT °F 60 80
100 120 60 80
100 120 60
8 80 100 120 60
30 11.5 80 100 120 60
15 80 100 120 60
8 80 100 120 60
50 11.5 80 100 120 60
15 80 100 120 60
8 80 100 120 60
70 11.5 80 100 120 60
15 80 100 120 60
8 80 100 120 60
90 11.5 80 100 120 60
15 80 100 120
82.8 101.5 120.2
88.3 83.4 78.6
2.86 3.73 4.61
78.5 70.7 62.8
9.05 6.55 5.00
79.2 80.3 81.4
77.0 96.2 115.4
82.3 101.1 119.8
86.6 81.8 76.9
2.86 3.72 4.59
76.9 69.0 61.2
8.89 6.43 4.91
74.9 76.5 78.0
76.8 95.9
115.1
71.3 91.0
110.6 130.3 71.8 91.4 111.1 130.7 72.2 91.7 111.3 130.9 72.5 92.0 111.5 131.1 75.1 94.5
113.9 133.2 75.7 95.0 114.2 133.5 76.3 95.4
114.6 133.7 78.5 97.6 116.7 135.7 79.3 98.2
117.2 136.1 80.1 98.9
117.6 136.4 81.9
100.6 119.4
43.9 42.6 41.3 40.0 45.7 44.4 43.0 41.7 47.2 45.5 43.9 42.3 48.6 46.7 44.8 42.9 58.8 56.3 53.9 51.4 61.0 58.1 55.2 52.4 63.3 59.9 56.6 53.3 71.8 68.2 64.7 61.1 74.9 70.7 66.6 62.4 77.9 73.2 68.4 63.7 84.9 80.1 75.2
2.50 3.41 4.32 5.23 2.36 3.31 4.27 5.22 2.50 3.41 4.31 5.22 2.64 3.50 4.36 5.22 2.56 3.47 4.39 5.30 2.64 3.53 4.41 5.30 2.72 3.58 4.44 5.30 2.76 3.63 4.51 5.38 2.78 3.64 4.51 5.38 2.79 3.65 4.52 5.38 2.85 3.71 4.58
35.4 31.0 26.6 22.2 37.6 33.1 28.5 23.9 38.6 33.9 29.2 24.5 39.6 34.8 29.9 25.1 50.0 44.4 38.9 33.3 52.0 46.1 40.2 34.3 54.0 47.7 41.5 35.2 62.4 55.8 49.3 42.7 65.4 58.3 51.2 44.0 68.4 60.7 53.0 45.3 75.2 67.4 59.6
5.15 3.66 2.80 2.24 5.67 3.92 2.96 2.34 5.53 3.92 2.98 2.37 5.39 3.91 3.01 2.41 6.65 4.71 3.58 2.83 6.78 4.83 3.67 2.89 6.79 4.89 3.72 2.94 7.62 5.50 4.20 3.33 7.90 5.69 4.32 3.40 8.18 5.87 4.44 3.47 8.73 6.32 4.82
20.1 20.7 21.3 22.0 20.3 21.5 22.7 23.8 22.4 23.4 24.3 25.2 24.6 25.2 25.9 26.6 37.1 38.5 40.0 41.4 39.8 41.0 42.1 43.3 42.6 43.4 44.3 45.2 53.9 55.6 57.3 59.0 57.3 58.6 60.0 61.4 60.6 61.7 62.7 63.8 70.6 72.6 74.6
67.9 87.6
107.4 127.2 69.0 88.8
108.5 128.2 69.3 89.0
108.7 128.4 69.6 89.2
108.9 128.5 71.6 91.1
110.6 130.2 72.0 91.5
110.9 130.3 72.4 91.8 111.2 130.5 74.1 93.5 112.8 132.1 74.7 93.9
113.1 132.3 75.3 94.4 113.5 132.6 76.5 95.6
114.8
44.0 42.6 41.3 40.0 45.8 44.4 43.0 41.7 47.2 45.6 43.9 42.3 48.7 46.8 44.8 42.9 58.6 56.2 53.8 51.4 60.8 57.9 55.1 52.3 62.9 59.6 56.4 53.2 71.5 68.1 64.6 61.2 74.3 70.3 66.3 62.4 77.1 72.5 68.0 63.5 82.8 78.7 74.7 84.1 80.2 76.2 85.4 81.6 77.7
2.50 3.37 4.25 5.12 2.43 3.33 4.23 5.13 2.49 3.37 4.25 5.13 2.56 3.41 4.27 5.12 2.54 3.42 4.30 5.18 2.58 3.44 4.31 5.18 2.61 3.47 4.32 5.18 2.65 3.51 4.37 5.23 2.66 3.52 4.37 5.23 2.67 3.52 4.38 5.23 3.51 4.09 4.68 3.12 3.84 4.56 2.73 3.58 4.44
35.4 31.1 26.8 22.5 37.5 33.0 28.6 24.1 38.7 34.1 29.4 24.8 40.0 35.1 30.2 25.4 50.0 44.6 39.2 33.7 52.0 46.2 40.4 34.6 54.0 47.8 41.7 35.5 62.5 56.1 49.7 43.4 65.2 58.3 51.4 44.5 67.9 60.5 53.1 45.7 70.8 64.8 58.7 73.5 67.1 60.7 76.1 69.3 62.6
5.16 3.71 2.85 2.29 5.53 3.91 2.98 2.38 5.56 3.96 3.03 2.42 5.59 4.02 3.08 2.45 6.72 4.80 3.66 2.91 6.91 4.93 3.75 2.96 7.03 5.03 3.82 3.01 7.92 5.69 4.34 3.43 8.18 5.86 4.44 3.49 8.47 6.04 4.56 3.56 7.21 5.70 4.68 7.91 6.12 4.90 9.19 6.68 5.14
20.1 20.7 21.3 21.9 20.3 21.5 22.6 23.8 22.4 23.3 24.2 25.1 24.5 25.2 25.8 26.5 37.1 38.5 39.9 41.3 39.9 41.0 42.1 43.2 42.6 43.4 44.3 45.1 53.9 55.5 57.2 58.8 57.3 58.6 59.9 61.3 60.7 61.7 62.7 63.7 71.7 73.3 74.9 75.6 76.9 78.1 79.5 80.5 81.4
66.0 85.9
105.7 125.5 66.3 86.1
105.9 125.7 66.5 86.3
106.0 125.8 66.7 86.4
106.2 125.9 68.0 87.7
107.4 127.1 68.3 87.9
107.6 127.2 68.6 88.2
107.7 127.3 69.8 89.3
108.9 128.4 70.1 89.6
109.1 128.6 70.5 89.9
109.3 128.7 71.1 90.6 110.2 71.2 90.8
110.4 71.3 91.0 110.6
44.0 42.6 41.3 39.9 45.8 44.4 43.0 41.6 47.3 45.6 43.9 42.2 48.8 46.8 44.8 42.8 58.5 56.2 53.8 51.5 60.5 57.8 55.0 52.3 62.5 59.4 56.2 53.1 71.2 67.9 64.6 61.3 73.7 69.9 66.1 62.3 76.2 71.9 67.6 63.3 80.7 77.4 74.1 81.6 78.6 75.5 82.5 79.7 76.9
2.49 3.33 4.17 5.01 2.49 3.34 4.19 5.04 2.48 3.33 4.18 5.03 2.47 3.32 4.17 5.02 2.52 3.36 4.21 5.06 2.51 3.36 4.21 5.06 2.51 3.36 4.20 5.05 2.54 3.39 4.23 5.08 2.55 3.39 4.24 5.08 2.55 3.39 4.24 5.08 4.16 4.47 4.77 3.38 3.95 4.52 2.59 3.43 4.26
35.5 31.3 27.0 22.8 37.3 33.0 28.7 24.4 38.8 34.2 29.6 25.0 40.4 35.5 30.6 25.7 49.9 44.7 39.4 34.2 51.9 46.3 40.6 35.0 53.9 47.9 41.9 35.8 62.5 56.3 50.2 44.0 65.0 58.3 51.6 45.0 67.5 60.3 53.1 46.0 66.5 62.2 57.8 70.1 65.1 60.1 73.7 68.0 62.3
5.18 3.75 2.90 2.33 5.39 3.89 3.01 2.42 5.59 4.01 3.08 2.46 5.79 4.13 3.15 2.50 6.80 4.88 3.74 2.98 7.06 5.04 3.83 3.03 7.27 5.17 3.91 3.07 8.21 5.87 4.47 3.54 8.48 6.04 4.57 3.59 8.76 6.21 4.68 3.65 5.68 5.08 4.55 7.08 5.83 4.90 9.33 6.81 5.28
20.1 20.7 21.3 21.9 20.4 21.5 22.6 23.7 22.4 23.3 24.2 25.1 24.5 25.1 25.8 26.5 37.1 38.5 39.8 41.2 39.9 41.0 42.0 43.1 42.6 43.4 44.2 45.1 53.9 55.5 57.1 58.7 57.3 58.6 59.9 61.2 60.7 61.7 62.7 63.7 72.9 74.0 75.1 76.4 77.3 78.3 79.9 80.7 81.4
Operation not recommended
LLT °F
Load Flow-8 GPM HC MBTUH Power
kW HE MBTUH COP LST
°F LLT °F
Load Flow-11 .5 GPM HC MBTUH Power
kW HE MBTUH COP LST
°F LLT °F HC
MBTUH Load Flow-15 GPM
Power kW HE
MBTUH COP LST °F
Operation not recommended
Operation not recommended
Operation not recommended

94
HS060 - Performance Data cont. Heating Capacity
Source EST °F Flow
GPM
13.5 25
18
ELT °F 60 80
100 120 60 80
100 120 60
9 80 100 120 60
30 13.5 80 100 120 60
18 80 100 120 60
9 80 100 120 60
50 13.5 80 100 120 60
18 80 100 120 60
9 80 100 120 60
70 13.5 80 100 120 60
18 80 100 120 60
9 80 100 120 60
90 13.5 80 100 120 60
18 80 100 120
83.3 102.3 121.3
101.6 97.3 93.0
3.31 4.31 5.31
90.3 82.6 74.9
8.99 6.61 5.13
79.7 80.5 81.4
77.1 96.5 115.9
82.8 101.8 120.8
99.7 95.3 90.9
3.3 4.3 5.3
88.4 80.6 72.8
8.89 6.52 5.04
74.9 76.3 77.6
76.8 96.2
115.6
71.1 90.8
110.6 130.4 71.5 91.3 111.1 131.0 71.9 91.7 111.4 131.1 72.4 92.0 111.7 131.3 75.1 94.6
114.1 133.7 75.8 95.2 114.6 134.0 76.4 95.7
115.0 134.3 78.8 98.0 117.2 136.4 79.6 98.7
117.8 136.9 80.4 99.4
118.4 137.4 82.4
101.4
48.3 47.3 46.3 45.3 50.1 49.3 48.6 47.8 52.1 50.9 49.7 48.6 54.1 52.5 50.9 49.3 66.0 63.9 61.7 59.6 68.8 66.2 63.7 61.1 71.6 68.6 65.6 62.6 81.9 78.4 74.9 71.4 85.5 81.6 77.6 73.7 89.1 84.7 80.3 75.9 97.7 93.2
2.93 3.93 4.93 5.93 2.94 3.95 4.95 5.96 3.0 4.0 5.0 6.0
2.97 3.96 4.96 5.95 3.0 4.0 5.0 6.0 3.1 4.0 5.0 6.0 3.1 4.1 5.1 6.0
3.12 4.06 5.01 5.95 3.1 4.1 5.1 6.0
3.17 4.16 5.14 6.13 3.26 4.25
38.3 33.9 29.5 25.1 40.1 35.9 31.7 27.5 42.0 37.4 32.8 28.2 44.0 39.0 34.0 29.0 55.7 50.2 44.7 39.3 58.4 52.5 46.6 40.6 61.1 54.7 48.4 42.0 71.3 64.5 57.8 51.1 74.8 67.5 60.3 53.0 78.3 70.5 62.7 55.0 86.6 78.7
4.83 3.53 2.75 2.24 4.99 3.66 2.87 2.35 5.17 3.77 2.94 2.39 5.34 3.88 3.01 2.43 6.34 4.66 3.63 2.93 6.61 4.81 3.72 2.98 6.79 4.93 3.79 3.03 7.69 5.65 4.38 3.52 7.97 5.81 4.48 3.57 8.24 5.97 4.57 3.63 8.78 6.42
20.6 21.1 21.6 22.1 20.8 21.8 22.7 23.7 22.9 23.7 24.4 25.2 25.0 25.5 26.1 26.7 37.2 38.5 39.8 41.0 40.1 41.1 42.1 43.1 43.0 43.7 44.5 45.2 53.7 55.2 56.8 58.3 57.4 58.6 59.8 61.0 61.0 61.9 62.8 63.7 70.2 72.0
67.4 87.3
107.1 126.9 68.7 88.5
108.4 128.2 68.9 88.7
108.6 128.4 69.2 89.0
108.7 128.5 71.4 91.0
110.6 130.3 71.8 91.4 111.0 130.5 72.2 91.7 111.3 130.8 74.1 93.5 112.9 132.3 74.6 94.0
113.4 132.7 75.2 94.5 113.8 133.1 76.5 95.9
48.6 47.6 46.5 45.5 50.5 49.7 48.8 48.0 51.8 50.8 49.8 48.8 53.2 52.0 50.8 49.6 66.2 64.1 62.0 60.0 68.5 66.1 63.8 61.5 70.8 68.2 65.6 63.0 81.8 78.5 75.2 72.0 85.1 81.5 77.8 74.2 88.5 84.5 80.5 76.5 95.2 91.9
2.86 3.85 4.83 5.82 2.87 3.86 4.85 5.84 2.87 3.86 4.84 5.83 2.88 3.86 4.84 5.82 2.92 3.89 4.86 5.83 2.93 3.90 4.87 5.85 2.95 3.92 4.89 5.87 2.98 3.92 4.87 5.81 3.00 3.95 4.91 5.86 3.02 3.98 4.95 5.91 3.09 4.06
38.8 34.4 30.0 25.6 40.7 36.5 32.3 28.0 42.0 37.6 33.2 28.9 43.3 38.8 34.2 29.7 56.2 50.8 45.4 40.1 58.5 52.8 47.2 41.5 60.7 54.8 48.9 43.0 71.6 65.1 58.6 52.1 74.9 68.0 61.1 54.2 78.2 70.9 63.6 56.3 84.7 78.0
4.98 3.62 2.82 2.29 5.17 3.77 2.95 2.41 5.29 3.86 3.01 2.45 5.41 3.95 3.07 2.50 6.62 4.83 3.74 3.02 6.84 4.96 3.84 3.08 7.01 5.09 3.92 3.15 8.07 5.88 4.54 3.63 8.33 6.04 4.65 3.71 8.62 6.23 4.77 3.80 9.04 6.65
20.6 21.1 21.6 22.1 20.7 21.6 22.6 23.6 22.9 23.6 24.3 25.1 25.0 25.6 26.1 26.6 37.1 38.4 39.6 40.8 40.1 41.0 42.0 42.9 43.0 43.7 44.4 45.1 53.6 55.1 56.6 58.1 57.3 58.5 59.6 60.8 61.0 61.9 62.7 63.6 70.6 72.1
65.6 85.5
105.4 125.2 65.8 85.7
105.6 125.5 65.9 85.8
105.7 125.6 66.0 85.9
105.8 125.7 67.6 87.4
107.1 126.9 67.8 87.6
107.3 127.1 68.0 87.8
107.5 127.3 69.4 89.0
108.7 128.3 69.7 89.3
108.9 128.6 70.1 89.6
109.2 128.8 70.6 90.4
48.9 47.8 46.8 45.7 50.9 50.0 49.0 48.1 51.6 50.7 49.8 49.0 52.2 51.4 50.6 49.8 66.3 64.3 62.3 60.3 68.2 66.1 64.0 61.9 70.0 67.8 65.6 63.4 81.7 78.6 75.6 72.5 84.8 81.4 78.1 74.8 87.8 84.2 80.6 77.0 92.7 90.5
2.79 3.76 4.74 5.71 2.79 3.77 4.74 5.72 2.8 3.8 4.7 5.7
2.79 3.76 4.72 5.69 2.8 3.8 4.7 5.7 2.8 3.8 4.7 5.7 2.8 3.8 4.7 5.7
2.83 3.78 4.72 5.67 2.8 3.8 4.7 5.7
2.86 3.80 4.75 5.69 2.92 3.86
39.4 35.0 30.6 26.2 41.4 37.1 32.8 28.6 42.0 37.8 33.7 29.5 42.7 38.6 34.5 30.4 56.7 51.4 46.1 40.9 58.5 53.2 47.8 42.4 60.4 54.9 49.4 44.0 72.0 65.7 59.4 53.1 75.0 68.5 61.9 55.4 78.0 71.2 64.4 57.6 82.7 77.4
5.14 3.72 2.89 2.35 5.35 3.89 3.03 2.46 5.41 3.95 3.08 2.51 5.48 4.01 3.14 2.56 6.90 4.99 3.86 3.11 7.09 5.13 3.96 3.18 7.24 5.25 4.06 3.26 8.46 6.10 4.69 3.75 8.73 6.29 4.83 3.86 8.99 6.49 4.98 3.96 9.30 6.87
20.5 21.0 21.5 22.0 20.5 21.5 22.5 23.5 22.8 23.5 24.3 25.0 25.1 25.6 26.1 26.5 37.0 38.2 39.4 40.6 40.0 41.0 41.9 42.8 43.1 43.7 44.3 45.0 53.5 54.9 56.4 57.8 57.3 58.4 59.5 60.6 61.1 61.8 62.6 63.4 71.0 72.3
Operation not recommended
LLT °F
Load Flow-9 GPM HC MBTUH Power
kW HE MBTUH COP LST
°F LLT °F
Load Flow-13 .5 GPM HC MBTUH Power
kW HE MBTUH COP LST
°F LLT °F HC
MBTUH Load Flow-18 GPM
Power kW HE
MBTUH COP LST °F
Operation not recommended 96.7 93.5 90.4 98.2 95.2 92.2
3.11 4.08 5.05 3.13 4.10 5.08
86.1 79.6 73.1 87.5 81.2 74.9
9.12 6.72 5.24 9.22 6.81 5.33
75.3 76.4 77.5 80.0 80.7 81.4
70.7 90.5
110.3 70.8 90.7 110.5
93.7 91.8 89.9 94.7 93.1 91.4
2.9 3.9 4.8
2.94 3.89 4.85
83.7 78.6 73.4 84.7 79.8 74.9
9.37 6.94 5.46 9.44 7.00 5.53
75.7 76.6 77.5 80.3 80.9 81.4
Operation not recommended
Operation not recommended

95
HS075 - Performance Data cont. Heating Capacity
Source EST °F Flow
GPM
14.5 25
19
ELT °F 60 80
100 120 60 80
100 120 60
10 80 100 120 60
30 14.5 80 100 120 60
19 80 100 120 60
10 80 100 120 60
50 14.5 80 100 120 60
19 80 100 120 60
10 80 100 120 60
70 14.5 80 100 120 60
19 80 100 120 60
10 80 100 120 60
90 14.5 80 100 120 60
19 80 100 120
85.9 104.8 123.7
125.4 120.2 115.0
4.79 6.13 7.46
109.1 99.3 89.5
7.67 5.75 4.51
78.2 79.2 80.3
79.3 98.6 118.0
85.3 104.2 123.2
122.8 117.6 112.4
4.77 6.07 7.38
106.5 96.8 87.2
7.55 5.67 4.46
73.4 74.9 76.4
79.0 98.3
117.6
72.1 91.8 111.6 131.3 72.6 92.3 112.0 131.8 73.1 92.7
112.4 132.0 73.6 93.1 112.7 132.2 76.7 96.1
115.5 134.9 77.4 96.7 116.0 135.3 78.1 97.3
116.5 135.7 80.8 99.9 119.0 138.1 81.7
100.7 119.7 138.7 82.7
101.5 120.4 139.2 84.8
103.7
58.8 57.4 56.1 54.7 61.1 59.7 58.4 57.0 63.5 61.7 59.9 58.2 65.8 63.6 61.5 59.3 81.0 78.2 75.3 72.5 84.5 81.1 77.7 74.4 87.9 84.0 80.2 76.3
100.9 96.6 92.2 87.9
105.5 100.5 95.6 90.6 110.0 104.4 98.9 93.3
120.1 114.9
3.90 5.11 6.32 7.53 3.90 5.12 6.35 7.57 3.9 5.2 6.4 7.6
3.95 5.19 6.43 7.67 4.2 5.4 6.7 7.9 4.2 5.5 6.7 8.0 4.3 5.5 6.8 8.0
4.48 5.74 7.00 8.26 4.5 5.8 7.0 8.3
4.55 5.82 7.09 8.36 4.74 6.02
45.5 40.0 34.5 29.0 47.8 42.3 36.7 31.2 50.1 44.1 38.1 32.1 52.3 45.9 39.5 33.1 66.7 59.6 52.5 45.4 70.1 62.4 54.8 47.2 73.4 65.2 57.1 48.9 85.6 77.0 68.3 59.7 90.0 80.8 71.5 62.2 94.5 84.6 74.7 64.8
103.9 94.4
4.42 3.29 2.60 2.13 4.59 3.42 2.69 2.21 4.74 3.51 2.75 2.24 4.88 3.59 2.80 2.27 5.60 4.17 3.28 2.66 5.86 4.35 3.39 2.74 5.98 4.42 3.44 2.77 6.60 4.93 3.86 3.12 6.84 5.09 3.97 3.19 7.08 5.26 4.09 3.27 7.42 5.59
20.1 20.7 21.3 21.9 20.1 21.3 22.4 23.6 22.2 23.2 24.1 25.0 24.3 25.0 25.7 26.4 36.2 37.7 39.2 40.6 39.1 40.3 41.5 42.7 42.0 42.9 43.8 44.7 52.3 54.1 55.9 57.7 56.0 57.5 58.9 60.3 59.7 60.8 61.9 63.0 68.6 70.5
68.4 88.2
108.0 127.8 69.6 89.4
109.2 129.0 70.0 89.7
109.4 129.2 70.4 90.0
109.7 129.3 72.7 92.3 111.9 131.4 73.3 92.8
112.2 131.7 73.8 93.2
112.6 132.0 75.9 95.2 114.5 133.9 76.6 95.8
115.1 134.3 77.3 96.4 115.6 134.7 78.6 97.9
58.9 57.5 56.1 54.7 61.2 59.8 58.4 57.0 63.6 61.8 60.0 58.2 65.9 63.7 61.6 59.4 81.0 78.2 75.4 72.6 84.4 81.1 77.9 74.6 87.8 84.1 80.3 76.6
100.8 96.6 92.4 88.2
105.2 100.5 95.7 91.0
109.7 104.4 99.1 93.8 117.4 113.2
3.78 4.97 6.15 7.34 3.79 4.99 6.19 7.39 3.82 5.02 6.23 7.43 3.84 5.05 6.27 7.48 4.02 5.24 6.46 7.69 4.07 5.29 6.51 7.73 4.11 5.33 6.55 7.77 4.26 5.50 6.74 7.99 4.32 5.55 6.79 8.02 4.38 5.60 6.83 8.06 4.45 5.71
46.0 40.6 35.1 29.7 48.3 42.8 37.3 31.8 50.5 44.6 38.7 32.8 52.8 46.5 40.2 33.9 67.3 60.3 53.3 46.4 70.5 63.1 55.7 48.2 73.8 65.9 58.0 50.1 86.3 77.8 69.4 60.9 90.5 81.5 72.6 63.6 94.7 85.2 75.8 66.3
102.2 93.7
4.57 3.39 2.67 2.18 4.74 3.52 2.77 2.26 4.88 3.60 2.82 2.29 5.03 3.70 2.88 2.33 5.85 4.34 3.39 2.75 6.08 4.50 3.51 2.83 6.19 4.58 3.57 2.87 6.96 5.16 4.02 3.24 7.14 5.30 4.13 3.32 7.35 5.47 4.26 3.42 7.75 5.82
20.0 20.6 21.2 21.8 20.0 21.2 22.3 23.4 22.2 23.1 24.0 24.9 24.3 25.0 25.6 26.3 36.1 37.6 39.0 40.4 39.1 40.2 41.4 42.5 42.0 42.9 43.7 44.6 52.2 54.0 55.7 57.4 56.0 57.4 58.7 60.1 59.7 60.7 61.8 62.8 68.9 70.7
66.4 86.2
106.1 125.9 66.7 86.5
106.3 126.2 66.9 86.7
106.5 126.3 67.2 86.9
106.7 126.5 68.8 88.5
108.2 127.9 69.2 88.8
108.5 128.1 69.5 89.1
108.7 128.3 70.9 90.5 110.0 129.6 71.4 90.9
110.4 129.9 71.9 91.3 110.8 130.2 72.4 92.1
59.0 57.6 56.1 54.7 61.3 59.9 58.4 57.0 63.7 61.9 60.1 58.3 66.0 63.8 61.7 59.5 81.0 78.3 75.5 72.8 84.3 81.2 78.0 74.8 87.7 84.1 80.5 76.9
100.7 96.6 92.6 88.5
105.0 100.5 95.9 91.4
109.3 104.3 99.3 94.3
114.6 111.5
3.66 4.82 5.98 7.14 3.68 4.85 6.03 7.20 3.7 4.9 6.1 7.2
3.73 4.92 6.10 7.29 3.9 5.1 6.3 7.5 3.9 5.1 6.3 7.5 4.0 5.2 6.3 7.5
4.03 5.26 6.48 7.71 4.1 5.3 6.5 7.7
4.20 5.39 6.57 7.76 4.16 5.39
46.5 41.1 35.7 30.3 48.7 43.3 37.9 32.4 51.0 45.2 39.4 33.5 53.3 47.1 40.8 34.6 67.8 61.0 54.2 47.3 71.0 63.7 56.5 49.3 74.1 66.5 58.9 51.2 86.9 78.7 70.4 62.2 91.0 82.3 73.7 65.0 95.0 85.9 76.9 67.8
100.4 93.1
4.72 3.50 2.75 2.24 4.88 3.61 2.84 2.32 5.03 3.71 2.90 2.36 5.18 3.80 2.96 2.39 6.10 4.50 3.51 2.84 6.32 4.66 3.63 2.93 6.40 4.74 3.69 2.98 7.32 5.39 4.18 3.36 7.48 5.53 4.31 3.46 7.62 5.67 4.43 3.56 8.07 6.06
19.95 20.5 21.1 21.7 20.0 21.1 22.2 23.3 22.1 23.0 23.9 24.8 24.2 24.9 25.6 26.2 36.0 37.4 38.8 40.2 39.0 40.1 41.2 42.3 42.0 42.8 43.6 44.4 52.1 53.8 55.5 57.2 55.9 57.2 58.6 59.9 59.7 60.7 61.7 62.6 69.3 70.8
Operation not recommended
LLT °F
Load Flow-10 GPM HC MBTUH Power
kW HE MBTUH COP LST
°F LLT °F
Load Flow-14 .5 GPM HC MBTUH Power
kW HE MBTUH COP LST
°F LLT °F HC
MBTUH Load Flow-19 GPM
Power kW HE
MBTUH COP LST °F
Operation not recommended 119.5 115.4 111.4 121.6 117.7 113.8
4.49 5.76 7.02 4.53 5.81 7.08
104.2 95.8 87.4
106.1 97.9 89.6
7.80 5.88 4.65 7.88 5.95 4.72
73.7 75.0 76.4 78.5 79.4 80.3
72.6 92.3
112.0 72.8 92.5 112.2
116.2 113.3 110.4 117.8 115.2 112.5
4.22 5.44 6.67 4.27 5.49 6.70
101.8 94.7 87.7
103.2 96.4 89.7
8.08 6.10 4.85 8.08 6.15 4.92
74.0 75.2 76.3 78.8 79.5 80.3
Operation not recommended
Operation not recommended

96

97