Dynamic Mechanical Analysis as a Complementary Technique ...
15
foods Article Dynamic Mechanical Analysis as a Complementary Technique for Stickiness Determination in Model Whey Protein Powders Laura T. O’Donoghue 1,2,3, † , Md. Kamrul Haque 1,3, † , Sean A. Hogan 1 , Fathima R. Laffir 4 , James A. O’Mahony 2,3 and Eoin G. Murphy 1,3, * 1 Teagasc Food Research Centre, Moorepark, Fermoy, P61 C996 Co. Cork, Ireland 2 School of Food and Nutritional Sciences, University College Cork, T12 K8AF Cork, Ireland 3 Dairy Processing Technology Centre (DPTC), Ireland 4 Materials and Surface Science Institute (MSSI), University of Limerick, V94 T9PX Limerick, Ireland * Correspondence: [email protected] † L.T.O’D. and M.K.H. contributed equally to this work. Received: 1 September 2020; Accepted: 10 September 2020; Published: 15 September 2020 Abstract: The α-relaxation temperatures (T α ), derived from the storage and loss moduli using dynamic mechanical analysis (DMA), were compared to methods for stickiness and glass transition determination for a selection of model whey protein concentrate (WPC) powders with varying protein contents. Glass transition temperatures (T g ) were determined using differential scanning calorimetry (DSC), and stickiness behavior was characterized using a fluidization technique. For the lower protein powders (WPC 20 and 35), the mechanical T α determined from the storage modulus of the DMA (T α onset) were in good agreement with the fluidization results, whereas for higher protein powders (WPC 50 and 65), the fluidization results compared better to the loss modulus results of the DMA (T α peak). This study demonstrates that DMA has the potential to be a useful technique to complement stickiness characterization of dairy powders by providing an increased understanding of the mechanisms of stickiness. Keywords: dairy powders; stickiness; thermal relaxation; spray drying 1. Introduction Stickiness of powders is a major challenge encountered by dairy processors, especially during the spray drying of products with high lactose contents, as it leads to lower powder yields and inferior powder quality. Stickiness in lactose-containing powders occurs predominantly due to the glass transition phenomenon, in which a phase change occurs in the amorphous material on exposure to high temperature and/or relative humidity (RH) conditions. This lowers the viscosity of the powder particle surface, allowing liquid bridges to form between particles, resulting in cohesion between particles and/or adhesion to equipment surfaces. A considerable amount of work has been performed developing stickiness characterization techniques that can estimate the temperature and RH conditions at which individual dairy powders will become sticky [1–6]. This information has become very useful to dairy processors at helping to minimize challenges during spray drying, allowing for the alteration of drying parameters to ensure that temperature and RH conditions within dryers are such that powder stickiness is avoided. Furthermore, these methods are also beneficial to dairy scientists to allow them to gain a deeper understanding of the wide variety of factors affecting the stickiness behavior of dairy powders. There are a wide variety of methods available to determine the stickiness behavior of dairy powders, which can be classified as either direct or indirect techniques. Direct methods are perhaps Foods 2020, 9, 1295; doi:10.3390/foods9091295 www.mdpi.com/journal/foods
Transcript of Dynamic Mechanical Analysis as a Complementary Technique ...
foods
Article
Dynamic Mechanical Analysis as a ComplementaryTechnique for Stickiness Determination in ModelWhey Protein Powders
Laura T. O’Donoghue 1,2,3,†, Md. Kamrul Haque 1,3,†, Sean A. Hogan 1, Fathima R. Laffir 4,James A. O’Mahony 2,3 and Eoin G. Murphy 1,3,*
1 Teagasc Food Research Centre, Moorepark, Fermoy, P61 C996 Co. Cork, Ireland2 School of Food and Nutritional Sciences, University College Cork, T12 K8AF Cork, Ireland3 Dairy Processing Technology Centre (DPTC), Ireland4 Materials and Surface Science Institute (MSSI), University of Limerick, V94 T9PX Limerick, Ireland* Correspondence: [email protected]† L.T.O’D. and M.K.H. contributed equally to this work.
Received: 1 September 2020; Accepted: 10 September 2020; Published: 15 September 2020 �����������������
Abstract: The α-relaxation temperatures (Tα), derived from the storage and loss moduli usingdynamic mechanical analysis (DMA), were compared to methods for stickiness and glass transitiondetermination for a selection of model whey protein concentrate (WPC) powders with varying proteincontents. Glass transition temperatures (Tg) were determined using differential scanning calorimetry(DSC), and stickiness behavior was characterized using a fluidization technique. For the lowerprotein powders (WPC 20 and 35), the mechanical Tα determined from the storage modulus of theDMA (Tα onset) were in good agreement with the fluidization results, whereas for higher proteinpowders (WPC 50 and 65), the fluidization results compared better to the loss modulus results of theDMA (Tα peak). This study demonstrates that DMA has the potential to be a useful technique tocomplement stickiness characterization of dairy powders by providing an increased understandingof the mechanisms of stickiness.
Keywords: dairy powders; stickiness; thermal relaxation; spray drying
1. Introduction
Stickiness of powders is a major challenge encountered by dairy processors, especially during thespray drying of products with high lactose contents, as it leads to lower powder yields and inferiorpowder quality. Stickiness in lactose-containing powders occurs predominantly due to the glasstransition phenomenon, in which a phase change occurs in the amorphous material on exposure tohigh temperature and/or relative humidity (RH) conditions. This lowers the viscosity of the powderparticle surface, allowing liquid bridges to form between particles, resulting in cohesion betweenparticles and/or adhesion to equipment surfaces. A considerable amount of work has been performeddeveloping stickiness characterization techniques that can estimate the temperature and RH conditionsat which individual dairy powders will become sticky [1–6]. This information has become very usefulto dairy processors at helping to minimize challenges during spray drying, allowing for the alterationof drying parameters to ensure that temperature and RH conditions within dryers are such that powderstickiness is avoided. Furthermore, these methods are also beneficial to dairy scientists to allow themto gain a deeper understanding of the wide variety of factors affecting the stickiness behavior ofdairy powders.
There are a wide variety of methods available to determine the stickiness behavior of dairypowders, which can be classified as either direct or indirect techniques. Direct methods are perhaps
Foods 2020, 9, 1295; doi:10.3390/foods9091295 www.mdpi.com/journal/foods

Foods 2020, 9, 1295 2 of 15
the most accurate, as they measure the changes in a specific property of the powder, such as theviscosity or resistance to shear. One of the oldest direct stickiness measurement techniques is apropeller-driven device, first created by Lazar et al. [7] for use on tomato powder, in which the forcerequired to move a stirrer in a bed of powder was measured. This method was later modified andused for stickiness characterization of dairy powders by Chuy and Labuza [1], Hennigs et al. [8],and Özkan et al. [3]. However, as this method is performed under static conditions, the results arelikely to be more representative of the interactions that occur during storage of powders, due to theincreased inter-particle surface contact [5]. In contrast, pneumatic methods, in which the particles comeinto direct contact with an air stream of increasing/alternating RH, may be considered more accurate,as they most closely simulate the conditions that occur during spray drying. Examples of pneumaticmethods that have been used to characterize the stickiness behavior of dairy powders include thefluidization rigs used by Hogan et al. [5] and Murti et al. [9], the blow test method developed byBrooks [10] and Paterson et al. [2], and the particle gun created by Zuo et al. [4]. However, the stickinessdata generated from these methods can also differ due to differences in air velocities [9], particletrajectories, and contact times between particles and the air stream.
One indirect approach that is well established and commonly used as an indication of stickinessin dairy powders is the determination of glass transition temperature (Tg). The Tg can be definedas the temperature at which the glass transition takes place and is normally determined either bymeasurement or estimation using mathematical modeling, such as the Couchman–Karasz equation [11].The measurement approach is considered more precise, as it allows tracking of changes that occurin a specific property of the material during the phase change. For example, differential scanningcalorimetry (DSC) measures the changes that occur in specific heat capacity of the sample during theglass transition and has been widely used to determine the Tg of dairy powders [1,6,12–18]. It shouldbe noted that while the glass transition determination is not a stickiness test method, a relationshipdoes exist between the Tg and sticking point temperature (SPT), which can be used to roughly estimatethe sticking temperature. One of the first studies to compare the Tg to the SPT, which was determinedusing the method by Lazar et al. [7], reported that the SPT was approximately 10–15 ◦C higher thanthe Tg onset [19]. Furthermore, the extent to which the temperature must exceed the Tg in order forsticking to occur is not consistent, even for the same powder, as it depends on a wide variety of factors,such as the powder composition [5], exposure time [20], and the methods used to determine both theSPT and Tg [21]. This is evident in the range of T–Tg values that have been reported for skim milkpowder (SMP); 20.6 ◦C [18], 29 ◦C [5], 33.6 ◦C [22], 14–22 ◦C [13], and 23.3 ◦C [8]. The determinationof Tg alone is therefore not an accurate method for stickiness characterization, as although there isa correlation between the SPT and Tg, it is difficult to predict the precise temperature above the Tg
that sticking will occur [21]. Hence, further research is required in order to develop an empiricalrelationship for predicting SPT, using Tg.
Another indirect method that has recently been related to the stickiness phenomenon is dynamicmechanical analysis (DMA), also referred to as dynamic mechanical thermal analysis (DMTA),which has been used in many studies to determine mechanical α-relaxations of amorphous foodmaterials [6,23–25]. Mechanical α-relaxations describe the changes in the physical state of the materialaround the glass transition and could therefore also be good indications of the changes in viscositythat occur during stickiness development. Furthermore, as DMA is a highly sensitive method,it may provide an opportunity to develop a greater understanding of the mechanisms of stickinessdevelopment (i.e., changes in viscoelastic behavior) when the results are compared to other binary(i.e., sticky/non-sticky) methods. The DMA method involves subjecting the sample to a sinusoidalforce and measuring the amount of energy stored (storage modulus) and lost (loss modulus) from thesample. During the glass transition, as the material “relaxes” from an amorphous into a crystallinestate, there will be a sudden decrease in the storage modulus (E′) and a corresponding increase in theloss modulus (E”). Silalai and Roos [6] compared the results obtained from DMA to a sticky pointtester, modified from the design by Lazar et al. [7], and found that the α-relaxation temperatures
Foods 2020, 9, 1295 3 of 15
(calculated from the peak of the loss modulus) were good indicators for stickiness development forSMP/maltodextrin mixes. However, the sticky point tester used in that study is a viscometry-basedtechnique, which may not produce the most accurate stickiness characterization results compared topneumatic methods. Furthermore, the SMP/maltodextrin powders examined in that study are also notrepresentative of the wide range of dairy powders available commercially. For example, the primarycarbohydrate in the majority of the powders was maltodextrin (rather than lactose), and the highestprotein content powder examined in that study was that of the original SMP (~35% w/w).
The current study compared the α-relaxation temperatures (Tα) derived from DMA storage andloss moduli to methods more commonly used to measure phase transitions (DSC) and stickinessbehavior (fluidization) for a selection of whey protein concentrate (WPC) powders. While this provideduseful information relating to the effect of measurement technique on thermally induced phase changes,the primary objective of the study was not to make a simple comparison of techniques but rather tointerpret the data as a whole for the purpose of better understanding the mechanism of stickiness.In particular, it was expected that the increased understanding of the viscous and elastic transitionsobtained using DMA would complement DSC and fluidization analyses to enhance the suite of toolsavailable for the development of powdered dairy products.
2. Materials and Methods
2.1. Materials
Whey protein concentrate (WPC) 80 powder and whey permeate powder (WPP) were supplied bylocal dairy companies. Model WPC powders were produced for this purpose of this study by mixingthe WPC 80 and WPP and reconstituting with water in different proportions to produce WPCs withtarget protein contents of 20%, 35%, 50%, and 65% (w/w). These WPC80/permeate solutions were thenspray dried using an Anhydro three-stage drier with fines return to the top of the drier (SPX FlowTechnology, Soeborg, Denmark), using a two-fluid nozzle atomizer. Solid contents of the concentrateswere 42%, 40%, 36%, and 32% for the WPC 20, 35, 50, and 65, respectively. All powders were driedusing inlet and outlet temperatures of 180 ◦C and 80 ◦C, respectively, and the final stage of drying wascompleted in an external fluid bed at 60 ◦C. The WPC powders were then stored in foil bags at 16 ◦Cprior to analysis. All analysis was carried out within six months of manufacture.
2.2. Powder Composition
Protein content was determined using a LECO Nitrogen Analyser FP-638 (LECO Corporation,St. Jospeh, MI, USA), using a nitrogen-to-protein conversion factor of 6.38. Fat content was determinedby Röse–Gottlieb [26]. Ash content was analyzed after overnight incineration in a muffle furnaceat 550 ◦C. Free moisture was determined after drying in an oven at 86 ◦C for 6 h. Lactose contentwas calculated by difference. Particle size was measured by laser light scattering using a Mastersizer3000 (Malvern Instruments Ltd., Malvern, UK, equipped with an Aero S dry powder dispersion unit.The optical parameters used were refractive indices of 1.46 and 1 for powder and air, respectively;absorbance index of 0.1. Volume mean diameter D4,3 was used to characterize the size of particles.
2.3. Surface Composition
X-ray photoelectron spectroscopy (XPS) was carried out using a Kratos AXIS Ultra spectrometer(Kratos Analytical Ltd., Manchester, UK). The percentage coverage of protein, fat, and lactose at thepowder surface was calculated according to the method described by Faldt et al. [27] in which a matrixformula is created from the elemental compositions of the various milk components. Analysis wascarried out in duplicate.
Foods 2020, 9, 1295 4 of 15
2.4. Moisture Sorption Isotherms
Moisture sorption isotherms were determined using a dynamic vapour sorption (DVS) Intrinsic 1(Surface Measurement Systems Ltd., London, UK). Samples (~35 mg) were first equilibrated to 0% RHand then humidified up to 90% RH in 10% increments at 25 ◦C using a single ramp method. Equilibriumwas considered to be reached when the % change in mass with time (dm/dt) was <0.0033%/min for atleast 10 min at each RH.
2.5. Stickiness by Fluidization
In the current study, a fluidization technique, previously described by Hogan et al. [5], was usedto determine the SPT (Tf) of each powder. Stickiness curves were generated for each sample by plottingthe air (dry bulb) temperature against the RH (calculated from the saturated air temperature andabsolute humidity) at which fluidization ceased.
2.6. Powder Equilibration
Powder samples (2 g) were transferred into glass vials and dried overnight in a vacuum oven(Jeio Tech 665 L Vacuum Oven OV-12, Fisher Scientific, Leicestershire, UK) at 45 ◦C. The dried sampleswere equilibrated in evacuated desiccators over saturated salt solutions of LiCl, CH3COOK, MgCl2,and K2CO3 (Sigma Chemical Co., St. Louis, MO, USA), with corresponding relative water vaporpressures (RVPs) of 11.4%, 23.1%, 33.2%, and 44.1%, respectively, at room temperature (23–24 ◦C) for14 days.
2.7. Differential Scanning Calorimetry
A differential scanning calorimeter (DSC Q2000; TA Instruments, Crawley, UK) was usedto determine the glass transition temperatures (Tg) of the equilibrated powders, as described byMurphy et al. [28]. Hermetically sealed DSC aluminum pans, containing ~16 mg of powder, wereheated in a nitrogen purged environment using an empty aluminum pan as a reference. The sampleswere subjected to the following thermal profile; heating from approximately 40 ◦C below to 40 ◦Cabove the Tg at 5 ◦C min−1, cooling back to 50 ◦C below the Tg at 10 ◦C min−1, and finally heating at5 ◦C min−1 to an end temperature of 50 ◦C above the Tg. The Tg onset values were determined fromthe second heating cycle using the TA Universal Analysis software. All analyses were completed induplicate. T–Tg values were calculated by extracting the equation of the lines for the stickiness andglass transition curves and subtracting the y values at a given RH (x value).
2.8. Dynamic Mechanical Analysis
A dynamic mechanical analyzer (DMA Q800, TA Instruments, New Castle, UK) with 35 mmdual cantilever clamp was used to determine the α-relaxation temperatures (Tα) of the equilibratedpowders. Approximately 400 mg of equilibrated powder was loaded into a stainless-steel powdersample tray and the surface of the powder bed was leveled off and covered with a stainless-steel lid.The powder sample tray and lid were then inserted into the clamp and tightened using a screwdriverwith a set torque (level 8). The analyses were carried out dynamically at a heating rate of 2 ◦C/min,from approximately 50 ◦C below the onset temperature of the decrease in storage modulus to 50 ◦Cabove the onset temperature at frequencies of 1.0, 5.0, 10.0, and 20.0 Hz. However, it was found thatthere was no significant difference in the temperature at which the storage modulus decreased atfrequencies greater than 10.0 Hz. Therefore, all the Tα values were determined at 10 Hz. Tα wasdetermined from the onset in the decrease in the storage modulus (Tα onset), and the peak of the lossmodulus (Tα peak), using the TA Universal Analysis software (TA Instruments, New Castle, UK).A liquid nitrogen tank (50 L; CFL-50, Cryofab Inc, Kenilworth, NJ, USA) was connected to the dynamicmechanical analyzer for cooling below room temperature. The Tα of each powder with various RVPs
Foods 2020, 9, 1295 5 of 15
was measured in duplicate. Prior to sample analysis, the dynamic mechanical analyzer was regularlycalibrated using a stainless-steel bar.
2.9. Statistical Analysis
The results presented are the average of at least three measurements and are reported as meanvalue± standard deviation. Stickiness by fluidization was performed in quadruplicate. Powder particlesize was performed in triplicate. Other measurements were performed in duplicate. Statistical analysiswas carried out by subjecting data sets to one-way ANOVA with a Fisher post-hoc test using Minitab 17(Minitab LLC, State College, PA, USA) statistical analysis package. A level of confidence of p < 0.05was used.
3. Results and Discussion
3.1. Bulk and Surface Composition
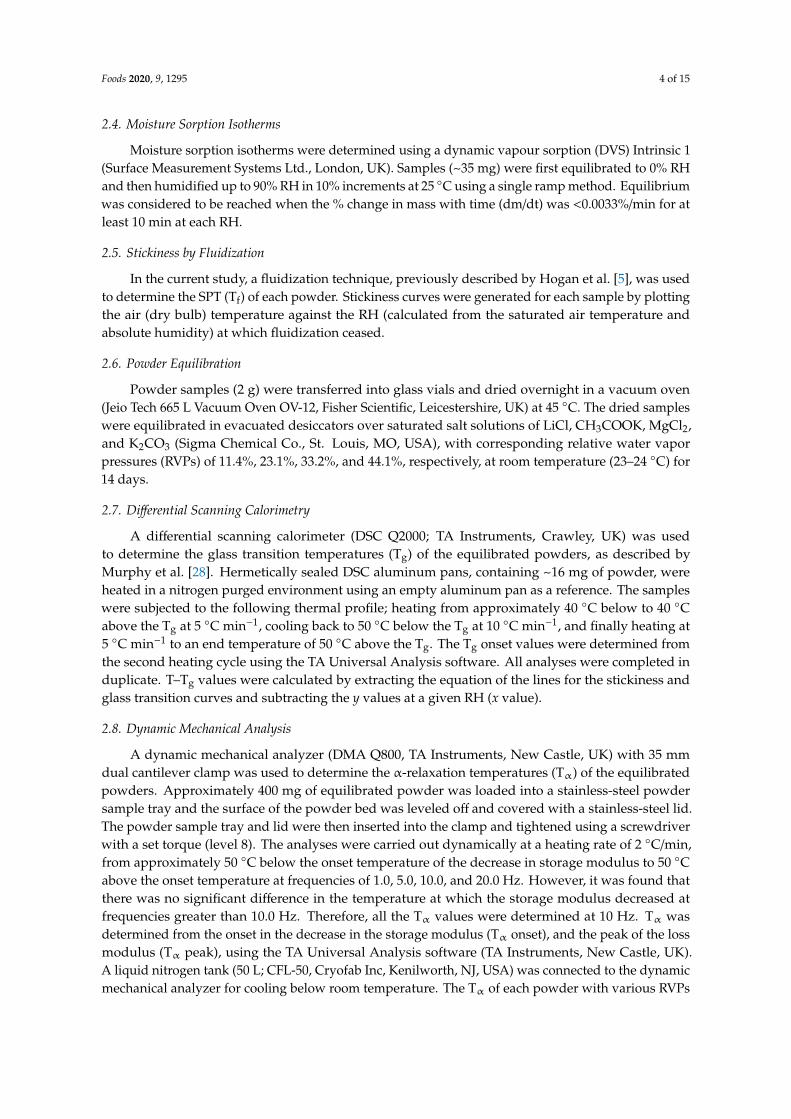
The bulk composition and particle size of each powder is reported in Table 1. Protein contentsfor the WPC 20, 35, 50, and 65 powders were 19.3, 35.7, 53.4, and 69.1 (% w/w), respectively.Lactose contents ranged from 66.2–17.5 (% w/w) for the WPC 20 and WPC 65, respectively. Fat contentincreased (1.31–5.33% w/w) and ash content decreased (7.34–4.23% w/w) with increasing protein content.Particle size has also been shown to affect the stickiness behavior of dairy powders [18]; however,in the present study, there was very little difference in particle size between the four powders (D4,3values of 106–118 µm), therefore it is unlikely to be a contributing factor in their stickiness behavior.
Table 1. Composition of whey protein concentrate (WPC) powders with protein contents ranging from~20 (WPC 20) to ~65% (WPC 65).
Sample Protein(% w/w) Fat (% w/w) Lactose *
(% w/w)Ash
(% w/w)Free Moisture
(% w/w) **Particle SizeD4,3 *** (µm)
WPC 20 19.3 ± 0.02 a 1.31 ± 0.04 a 66.2 7.34 ± 0.01 a 5.90 ± 0.01 a 106WPC 35 35.7 ± 0.20 b 3.19 ± 0.06 b 48.6 6.36 ± 0.00 b 6.11 ± 0.08 b 118WPC 50 53.4 ± 0.15 c 4.15 ± 0.02 c 32.8 5.59 ± 0.24 c 4.07 ± 0.14 c 118WPC 65 69.1 ± 0.38 d 5.33 ± 0.03 d 17.5 4.23 ± 0.00 d 3.90 ± 0.05 d 115
* Calculated by difference; ** on a wet basis; *** D4,3 = volume mean diameter. a–d Within a column, values withdifferent superscripts vary significantly (p < 0.05).
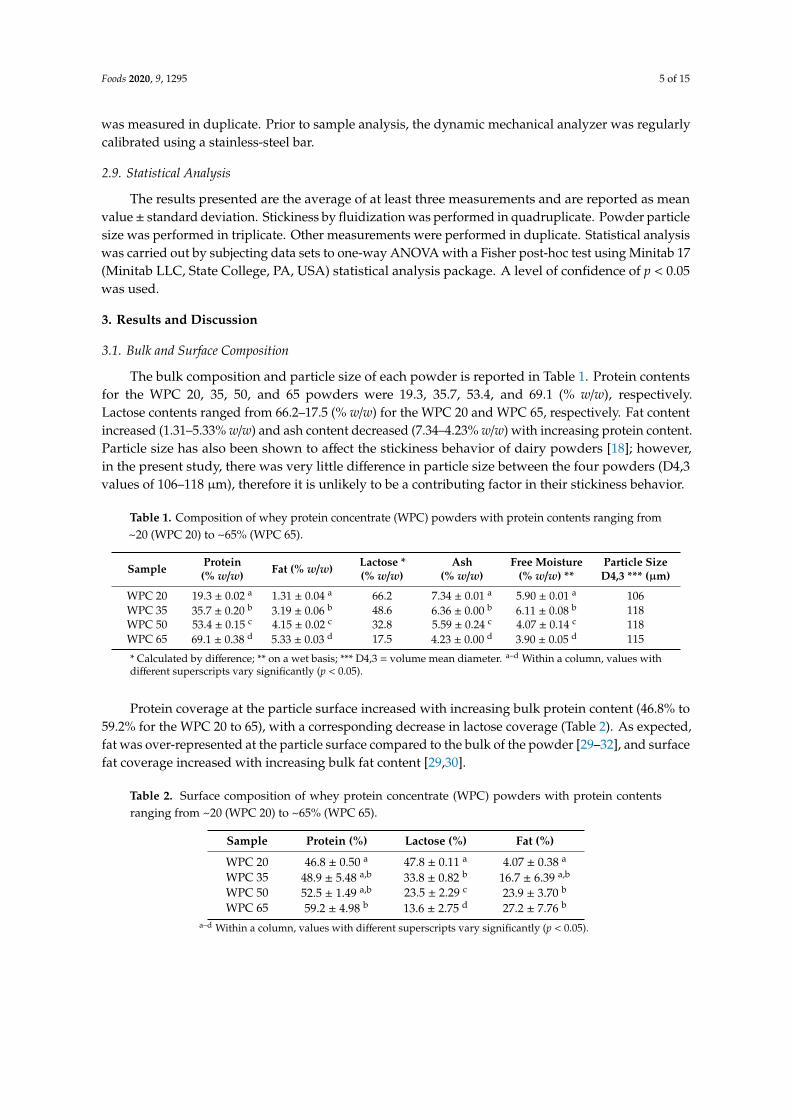
Protein coverage at the particle surface increased with increasing bulk protein content (46.8% to59.2% for the WPC 20 to 65), with a corresponding decrease in lactose coverage (Table 2). As expected,fat was over-represented at the particle surface compared to the bulk of the powder [29–32], and surfacefat coverage increased with increasing bulk fat content [29,30].
Table 2. Surface composition of whey protein concentrate (WPC) powders with protein contentsranging from ~20 (WPC 20) to ~65% (WPC 65).
Sample Protein (%) Lactose (%) Fat (%)
WPC 20 46.8 ± 0.50 a 47.8 ± 0.11 a 4.07 ± 0.38 a
WPC 35 48.9 ± 5.48 a,b 33.8 ± 0.82 b 16.7 ± 6.39 a,b
WPC 50 52.5 ± 1.49 a,b 23.5 ± 2.29 c 23.9 ± 3.70 b
WPC 65 59.2 ± 4.98 b 13.6 ± 2.75 d 27.2 ± 7.76 b
a–d Within a column, values with different superscripts vary significantly (p < 0.05).
Foods 2020, 9, 1295 6 of 15
3.2. Moisture Sorption Isotherms
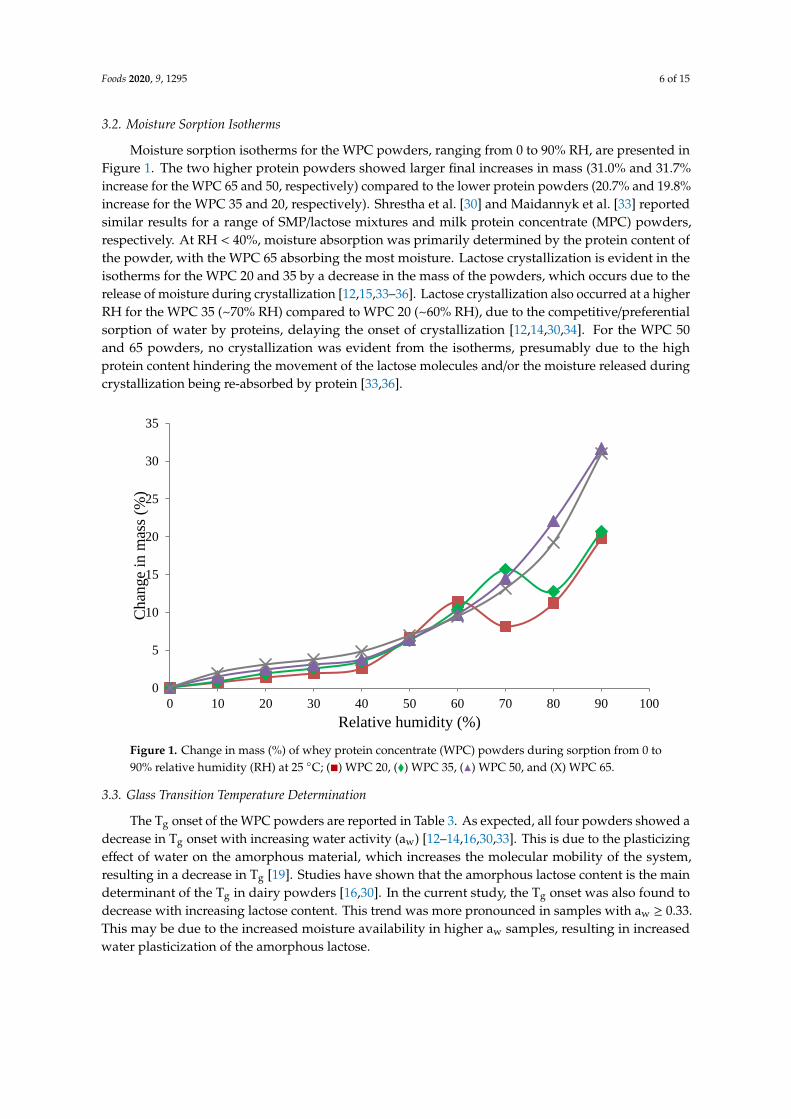
Moisture sorption isotherms for the WPC powders, ranging from 0 to 90% RH, are presented inFigure 1. The two higher protein powders showed larger final increases in mass (31.0% and 31.7%increase for the WPC 65 and 50, respectively) compared to the lower protein powders (20.7% and 19.8%increase for the WPC 35 and 20, respectively). Shrestha et al. [30] and Maidannyk et al. [33] reportedsimilar results for a range of SMP/lactose mixtures and milk protein concentrate (MPC) powders,respectively. At RH < 40%, moisture absorption was primarily determined by the protein content ofthe powder, with the WPC 65 absorbing the most moisture. Lactose crystallization is evident in theisotherms for the WPC 20 and 35 by a decrease in the mass of the powders, which occurs due to therelease of moisture during crystallization [12,15,33–36]. Lactose crystallization also occurred at a higherRH for the WPC 35 (~70% RH) compared to WPC 20 (~60% RH), due to the competitive/preferentialsorption of water by proteins, delaying the onset of crystallization [12,14,30,34]. For the WPC 50and 65 powders, no crystallization was evident from the isotherms, presumably due to the highprotein content hindering the movement of the lactose molecules and/or the moisture released duringcrystallization being re-absorbed by protein [33,36].
Foods 2020, 9, x FOR PEER REVIEW 6 of 15
reported similar results for a range of SMP/lactose mixtures and milk protein concentrate (MPC)
powders, respectively. At RH < 40%, moisture absorption was primarily determined by the protein
content of the powder, with the WPC 65 absorbing the most moisture. Lactose crystallization is
evident in the isotherms for the WPC 20 and 35 by a decrease in the mass of the powders, which
occurs due to the release of moisture during crystallization [12,15,33–36]. Lactose crystallization also
occurred at a higher RH for the WPC 35 (~70% RH) compared to WPC 20 (~60% RH), due to the
competitive/preferential sorption of water by proteins, delaying the onset of crystallization
[12,14,30,34]. For the WPC 50 and 65 powders, no crystallization was evident from the isotherms,
presumably due to the high protein content hindering the movement of the lactose molecules and/or
the moisture released during crystallization being re-absorbed by protein [33,36].
Figure 1. Change in mass (%) of whey protein concentrate (WPC) powders during sorption from 0 to
90% relative humidity (RH) at 25 °C; (■) WPC 20, (♦) WPC 35, (▲) WPC 50, and (X) WPC 65.
3.3. Glass Transition Temperature Determination
The Tg onset of the WPC powders are reported in Table 3. As expected, all four powders showed
a decrease in Tg onset with increasing water activity (aw) [12–14,16,30,33]. This is due to the
plasticizing effect of water on the amorphous material, which increases the molecular mobility of the
system, resulting in a decrease in Tg [19]. Studies have shown that the amorphous lactose content is
the main determinant of the Tg in dairy powders [16,30]. In the current study, the Tg onset was also
found to decrease with increasing lactose content. This trend was more pronounced in samples with
aw ≥ 0.33. This may be due to the increased moisture availability in higher aw samples, resulting in
increased water plasticization of the amorphous lactose.
Table 3. Onset temperatures for glass transition (Tg) of whey protein concentrate (WPC) powders
with protein contents ranging from ~20% (WPC 20) to ~65% (WPC 65), stored at different water
activities (aw).
Sample 0.11 aw 0.23 aw 0.33 aw 0.44 aw
WPC 20 63.2 ± 0.56 a 50.6 ± 0.00 a 37.1 ± 0.25 a 18.6 ± 0.07 a
WPC 35 62.2 ± 0.01 b 49.9 ± 0.17 b 40.9 ± 0.60 b 21.6 ± 0.01 b
WPC 50 64.4 ± 0.13 c 47.6 ± 0.30 c 44.8 ± 0.26 c 33.7 ± 0.42 c
WPC 65 67.8 ± 0.23 d 52.4 ± 0.10 d 47.3 ± 0.23 d 42.7 ± 0.03 d a–d Within a column, values with different superscripts vary significantly (p < 0.05).
0
5
10
15
20
25
30
35
0 10 20 30 40 50 60 70 80 90 100
Chan
ge
in m
ass
(%)
Relative humidity (%)
Figure 1. Change in mass (%) of whey protein concentrate (WPC) powders during sorption from 0 to90% relative humidity (RH) at 25 ◦C; (�) WPC 20, (�) WPC 35, (N) WPC 50, and (X) WPC 65.
3.3. Glass Transition Temperature Determination
The Tg onset of the WPC powders are reported in Table 3. As expected, all four powders showed adecrease in Tg onset with increasing water activity (aw) [12–14,16,30,33]. This is due to the plasticizingeffect of water on the amorphous material, which increases the molecular mobility of the system,resulting in a decrease in Tg [19]. Studies have shown that the amorphous lactose content is the maindeterminant of the Tg in dairy powders [16,30]. In the current study, the Tg onset was also found todecrease with increasing lactose content. This trend was more pronounced in samples with aw ≥ 0.33.This may be due to the increased moisture availability in higher aw samples, resulting in increasedwater plasticization of the amorphous lactose.
Foods 2020, 9, 1295 7 of 15
Table 3. Onset temperatures for glass transition (Tg) of whey protein concentrate (WPC) powderswith protein contents ranging from ~20% (WPC 20) to ~65% (WPC 65), stored at different wateractivities (aw).
Sample 0.11 aw 0.23 aw 0.33 aw 0.44 aw
WPC 20 63.2 ± 0.56 a 50.6 ± 0.00 a 37.1 ± 0.25 a 18.6 ± 0.07 a
WPC 35 62.2 ± 0.01 b 49.9 ± 0.17 b 40.9 ± 0.60 b 21.6 ± 0.01 b
WPC 50 64.4 ± 0.13 c 47.6 ± 0.30 c 44.8 ± 0.26 c 33.7 ± 0.42 c
WPC 65 67.8 ± 0.23 d 52.4 ± 0.10 d 47.3 ± 0.23 d 42.7 ± 0.03 d
a–d Within a column, values with different superscripts vary significantly (p < 0.05).
3.4. Powder Fluidization Analysis
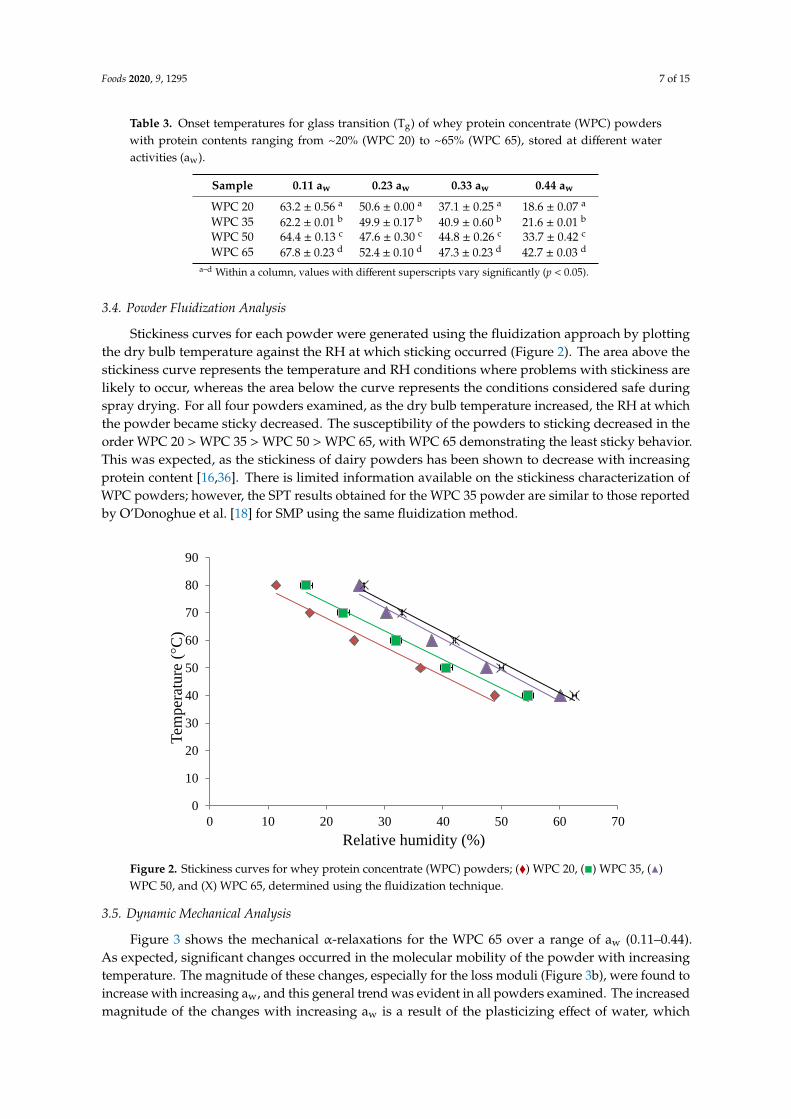
Stickiness curves for each powder were generated using the fluidization approach by plottingthe dry bulb temperature against the RH at which sticking occurred (Figure 2). The area above thestickiness curve represents the temperature and RH conditions where problems with stickiness arelikely to occur, whereas the area below the curve represents the conditions considered safe duringspray drying. For all four powders examined, as the dry bulb temperature increased, the RH at whichthe powder became sticky decreased. The susceptibility of the powders to sticking decreased in theorder WPC 20 > WPC 35 > WPC 50 > WPC 65, with WPC 65 demonstrating the least sticky behavior.This was expected, as the stickiness of dairy powders has been shown to decrease with increasingprotein content [16,36]. There is limited information available on the stickiness characterization ofWPC powders; however, the SPT results obtained for the WPC 35 powder are similar to those reportedby O’Donoghue et al. [18] for SMP using the same fluidization method.
Foods 2020, 9, x FOR PEER REVIEW 7 of 15
3.4. Powder Fluidization Analysis
Stickiness curves for each powder were generated using the fluidization approach by plotting
the dry bulb temperature against the RH at which sticking occurred (Figure 2). The area above the
stickiness curve represents the temperature and RH conditions where problems with stickiness are
likely to occur, whereas the area below the curve represents the conditions considered safe during
spray drying. For all four powders examined, as the dry bulb temperature increased, the RH at which
the powder became sticky decreased. The susceptibility of the powders to sticking decreased in the
order WPC 20 > WPC 35 > WPC 50 > WPC 65, with WPC 65 demonstrating the least sticky behavior.
This was expected, as the stickiness of dairy powders has been shown to decrease with increasing
protein content [16,36]. There is limited information available on the stickiness characterization of
WPC powders; however, the SPT results obtained for the WPC 35 powder are similar to those
reported by O’Donoghue et al. [18] for SMP using the same fluidization method.
Figure 2. Stickiness curves for whey protein concentrate (WPC) powders; (♦) WPC 20, (■) WPC 35,
(▲) WPC 50, and (X) WPC 65, determined using the fluidization technique.
3.5. Dynamic Mechanical Analysis
Figure 3 shows the mechanical α-relaxations for the WPC 65 over a range of aw (0.11–0.44). As
expected, significant changes occurred in the molecular mobility of the powder with increasing
temperature. The magnitude of these changes, especially for the loss moduli (Figure 3b), were found
to increase with increasing aw, and this general trend was evident in all powders examined. The
increased magnitude of the changes with increasing aw is a result of the plasticizing effect of water,
which increases the molecular mobility of the system [6]. This causes a decrease in the viscosity of
the particle surface, leading to the onset of sticking [37].
0
10
20
30
40
50
60
70
80
90
0 10 20 30 40 50 60 70
Tem
per
ature
(°C
)
Relative humidity (%)
Figure 2. Stickiness curves for whey protein concentrate (WPC) powders; (�) WPC 20, (�) WPC 35, (N)WPC 50, and (X) WPC 65, determined using the fluidization technique.
3.5. Dynamic Mechanical Analysis
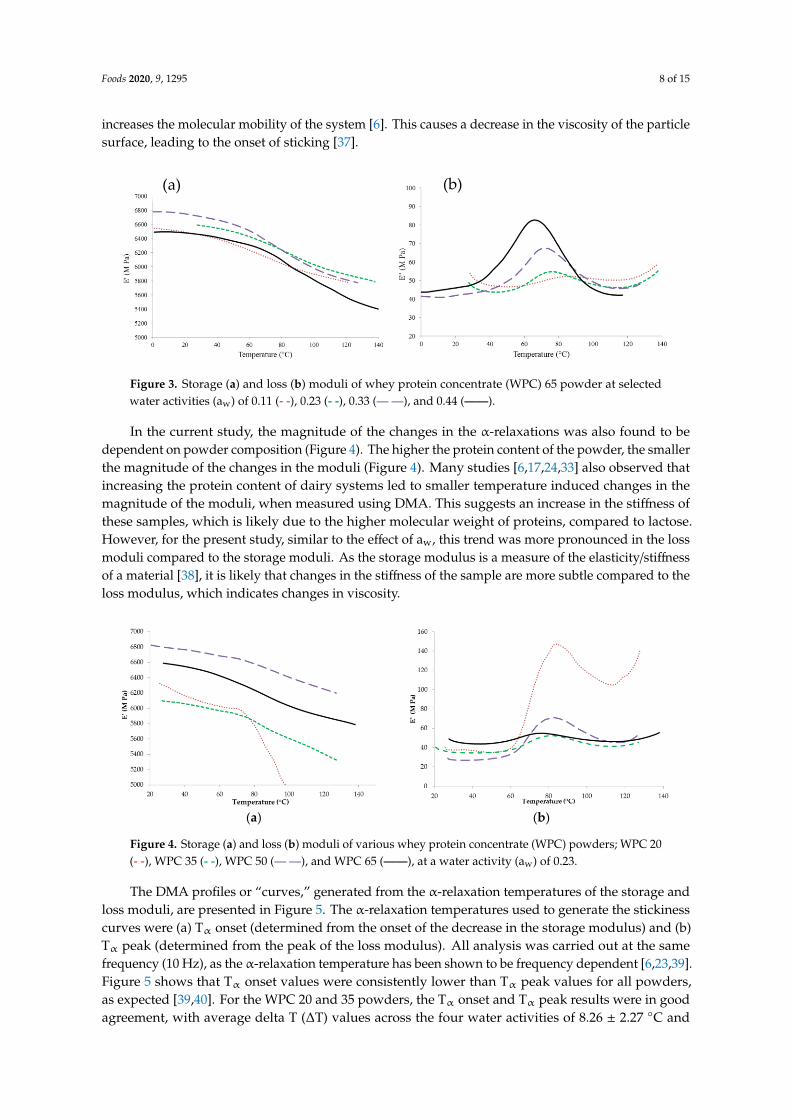
Figure 3 shows the mechanical α-relaxations for the WPC 65 over a range of aw (0.11–0.44).As expected, significant changes occurred in the molecular mobility of the powder with increasingtemperature. The magnitude of these changes, especially for the loss moduli (Figure 3b), were found toincrease with increasing aw, and this general trend was evident in all powders examined. The increasedmagnitude of the changes with increasing aw is a result of the plasticizing effect of water, which
Foods 2020, 9, 1295 8 of 15
increases the molecular mobility of the system [6]. This causes a decrease in the viscosity of the particlesurface, leading to the onset of sticking [37].Foods 2020, 9, x FOR PEER REVIEW 8 of 15
Figure 3. Storage (a) and loss (b) moduli of whey protein concentrate (WPC) 65 powder at selected
water activities (aw) of 0.11 (- -), 0.23 (‒ ‒), 0.33 (― ―), and 0.44 (――).
In the current study, the magnitude of the changes in the α-relaxations was also found to be
dependent on powder composition (Figure 4). The higher the protein content of the powder, the
smaller the magnitude of the changes in the moduli (Figure 4). Many studies [6,17,24,33] also
observed that increasing the protein content of dairy systems led to smaller temperature induced
changes in the magnitude of the moduli, when measured using DMA. This suggests an increase in
the stiffness of these samples, which is likely due to the higher molecular weight of proteins,
compared to lactose. However, for the present study, similar to the effect of aw, this trend was more
pronounced in the loss moduli compared to the storage moduli. As the storage modulus is a measure
of the elasticity/stiffness of a material [38], it is likely that changes in the stiffness of the sample are
more subtle compared to the loss modulus, which indicates changes in viscosity.
(a) (b)
Figure 4. Storage (a) and loss (b) moduli of various whey protein concentrate (WPC) powders; WPC
20 (- -), WPC 35 (‒ ‒), WPC 50 (― ―), and WPC 65 (――), at a water activity (aw) of 0.23.
The DMA profiles or “curves,” generated from the α-relaxation temperatures of the storage and
loss moduli, are presented in Figure 5. The α-relaxation temperatures used to generate the stickiness
curves were (a) Tα onset (determined from the onset of the decrease in the storage modulus) and (b)
Tα peak (determined from the peak of the loss modulus). All analysis was carried out at the same
frequency (10 Hz), as the α-relaxation temperature has been shown to be frequency dependent
[6,23,39]. Figure 5 shows that Tα onset values were consistently lower than Tα peak values for all
powders, as expected [39,40]. For the WPC 20 and 35 powders, the Tα onset and Tα peak results were
in good agreement, with average delta T (∆T) values across the four water activities of 8.26 ± 2.27 °C
and 6.42 ± 1.29 °C for WPC 20 and 35, respectively. The Tα peak data obtained for the WPC 35 also
compare well to Tα peak values (i.e., X⁰ vs. Y⁰ at Z aw) reported by Silalai and Roos [23] for SMP at the
same frequency (10 Hz). The average ∆T between the Tα onset and Tα peak values for the WPC 50
was slightly greater at 12.2 ± 9.85 °C; however, ∆T at high aw was much more pronounced (~20 °C),
as can be seen in Figure 5c. For WPC 65, the average ∆T was the greatest of all the powders at 21.8 ±
(b) (a)
Figure 3. Storage (a) and loss (b) moduli of whey protein concentrate (WPC) 65 powder at selectedwater activities (aw) of 0.11 (- -), 0.23 (- -), 0.33 (— —), and 0.44 (——).
In the current study, the magnitude of the changes in the α-relaxations was also found to bedependent on powder composition (Figure 4). The higher the protein content of the powder, the smallerthe magnitude of the changes in the moduli (Figure 4). Many studies [6,17,24,33] also observed thatincreasing the protein content of dairy systems led to smaller temperature induced changes in themagnitude of the moduli, when measured using DMA. This suggests an increase in the stiffness ofthese samples, which is likely due to the higher molecular weight of proteins, compared to lactose.However, for the present study, similar to the effect of aw, this trend was more pronounced in the lossmoduli compared to the storage moduli. As the storage modulus is a measure of the elasticity/stiffnessof a material [38], it is likely that changes in the stiffness of the sample are more subtle compared to theloss modulus, which indicates changes in viscosity.
Foods 2020, 9, x FOR PEER REVIEW 8 of 15
Figure 3. Storage (a) and loss (b) moduli of whey protein concentrate (WPC) 65 powder at selected
water activities (aw) of 0.11 (- -), 0.23 (‒ ‒), 0.33 (― ―), and 0.44 (――).
In the current study, the magnitude of the changes in the α-relaxations was also found to be
dependent on powder composition (Figure 4). The higher the protein content of the powder, the
smaller the magnitude of the changes in the moduli (Figure 4). Many studies [6,17,24,33] also
observed that increasing the protein content of dairy systems led to smaller temperature induced
changes in the magnitude of the moduli, when measured using DMA. This suggests an increase in
the stiffness of these samples, which is likely due to the higher molecular weight of proteins,
compared to lactose. However, for the present study, similar to the effect of aw, this trend was more
pronounced in the loss moduli compared to the storage moduli. As the storage modulus is a measure
of the elasticity/stiffness of a material [38], it is likely that changes in the stiffness of the sample are
more subtle compared to the loss modulus, which indicates changes in viscosity.
(a) (b)
Figure 4. Storage (a) and loss (b) moduli of various whey protein concentrate (WPC) powders; WPC
20 (- -), WPC 35 (‒ ‒), WPC 50 (― ―), and WPC 65 (――), at a water activity (aw) of 0.23.
The DMA profiles or “curves,” generated from the α-relaxation temperatures of the storage and
loss moduli, are presented in Figure 5. The α-relaxation temperatures used to generate the stickiness
curves were (a) Tα onset (determined from the onset of the decrease in the storage modulus) and (b)
Tα peak (determined from the peak of the loss modulus). All analysis was carried out at the same
frequency (10 Hz), as the α-relaxation temperature has been shown to be frequency dependent
[6,23,39]. Figure 5 shows that Tα onset values were consistently lower than Tα peak values for all
powders, as expected [39,40]. For the WPC 20 and 35 powders, the Tα onset and Tα peak results were
in good agreement, with average delta T (∆T) values across the four water activities of 8.26 ± 2.27 °C
and 6.42 ± 1.29 °C for WPC 20 and 35, respectively. The Tα peak data obtained for the WPC 35 also
compare well to Tα peak values (i.e., X⁰ vs. Y⁰ at Z aw) reported by Silalai and Roos [23] for SMP at the
same frequency (10 Hz). The average ∆T between the Tα onset and Tα peak values for the WPC 50
was slightly greater at 12.2 ± 9.85 °C; however, ∆T at high aw was much more pronounced (~20 °C),
as can be seen in Figure 5c. For WPC 65, the average ∆T was the greatest of all the powders at 21.8 ±
(b) (a)
Figure 4. Storage (a) and loss (b) moduli of various whey protein concentrate (WPC) powders; WPC 20(- -), WPC 35 (- -), WPC 50 (— —), and WPC 65 (——), at a water activity (aw) of 0.23.
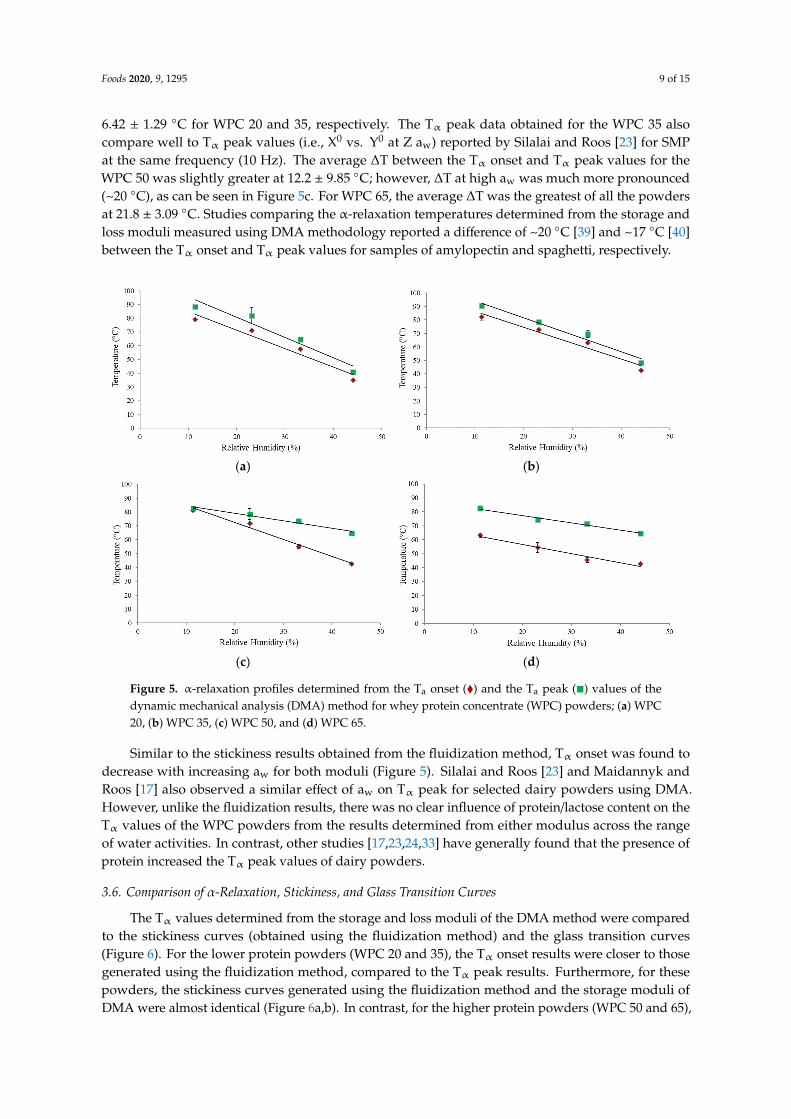
The DMA profiles or “curves,” generated from the α-relaxation temperatures of the storage andloss moduli, are presented in Figure 5. The α-relaxation temperatures used to generate the stickinesscurves were (a) Tα onset (determined from the onset of the decrease in the storage modulus) and (b)Tα peak (determined from the peak of the loss modulus). All analysis was carried out at the samefrequency (10 Hz), as the α-relaxation temperature has been shown to be frequency dependent [6,23,39].Figure 5 shows that Tα onset values were consistently lower than Tα peak values for all powders,as expected [39,40]. For the WPC 20 and 35 powders, the Tα onset and Tα peak results were in goodagreement, with average delta T (∆T) values across the four water activities of 8.26 ± 2.27 ◦C and
Foods 2020, 9, 1295 9 of 15
6.42 ± 1.29 ◦C for WPC 20 and 35, respectively. The Tα peak data obtained for the WPC 35 alsocompare well to Tα peak values (i.e., X0 vs. Y0 at Z aw) reported by Silalai and Roos [23] for SMPat the same frequency (10 Hz). The average ∆T between the Tα onset and Tα peak values for theWPC 50 was slightly greater at 12.2 ± 9.85 ◦C; however, ∆T at high aw was much more pronounced(~20 ◦C), as can be seen in Figure 5c. For WPC 65, the average ∆T was the greatest of all the powdersat 21.8 ± 3.09 ◦C. Studies comparing the α-relaxation temperatures determined from the storage andloss moduli measured using DMA methodology reported a difference of ~20 ◦C [39] and ~17 ◦C [40]between the Tα onset and Tα peak values for samples of amylopectin and spaghetti, respectively.
Foods 2020, 9, x FOR PEER REVIEW 9 of 15
3.09 °C. Studies comparing the α-relaxation temperatures determined from the storage and loss
moduli measured using DMA methodology reported a difference of ~20 °C [39] and ~17 °C [40]
between the Tα onset and Tα peak values for samples of amylopectin and spaghetti, respectively.
(a) (b)
(c) (d)
Figure 5. α-relaxation profiles determined from the Ta onset (♦) and the Ta peak (■) values of the
dynamic mechanical analysis (DMA) method for whey protein concentrate (WPC) powders; (a) WPC
20, (b) WPC 35, (c) WPC 50, and (d) WPC 65.
Similar to the stickiness results obtained from the fluidization method, Tα onset was found to
decrease with increasing aw for both moduli (Figure 5). Silalai and Roos [23] and Maidannyk and
Roos [17] also observed a similar effect of aw on Tα peak for selected dairy powders using DMA.
However, unlike the fluidization results, there was no clear influence of protein/lactose content on
the Tα values of the WPC powders from the results determined from either modulus across the range
of water activities. In contrast, other studies [17,23,24,33] have generally found that the presence of
protein increased the Tα peak values of dairy powders.
3.6. Comparison of α-Relaxation, Stickiness, and Glass Transition Curves
The Tα values determined from the storage and loss moduli of the DMA method were compared
to the stickiness curves (obtained using the fluidization method) and the glass transition curves
(Figure 6). For the lower protein powders (WPC 20 and 35), the Tα onset results were closer to those
generated using the fluidization method, compared to the Tα peak results. Furthermore, for these
powders, the stickiness curves generated using the fluidization method and the storage moduli of
DMA were almost identical (Figure 6 a,b). In contrast, for the higher protein powders (WPC 50 and
65), the Tα peak results were closer to the fluidization results. Figure 6 also demonstrates that as the
protein content of the powder increased (i.e., lactose content decreased), the Tα onset curve moved
away from the fluidization curve and closer to the glass transition curve. Furthermore, for the WPC
65 powder, the Tα onset results of DMA and the glass transition curve were almost indistinguishable.
This would suggest that, for powders with higher protein contents, the Tα onset values obtained from
the DMA method may be more representative of the changes occurring during the glass transition
rather than stickiness development.
Figure 5. α-relaxation profiles determined from the Ta onset (�) and the Ta peak (�) values of thedynamic mechanical analysis (DMA) method for whey protein concentrate (WPC) powders; (a) WPC20, (b) WPC 35, (c) WPC 50, and (d) WPC 65.
Similar to the stickiness results obtained from the fluidization method, Tα onset was found todecrease with increasing aw for both moduli (Figure 5). Silalai and Roos [23] and Maidannyk andRoos [17] also observed a similar effect of aw on Tα peak for selected dairy powders using DMA.However, unlike the fluidization results, there was no clear influence of protein/lactose content on theTα values of the WPC powders from the results determined from either modulus across the rangeof water activities. In contrast, other studies [17,23,24,33] have generally found that the presence ofprotein increased the Tα peak values of dairy powders.
3.6. Comparison of α-Relaxation, Stickiness, and Glass Transition Curves
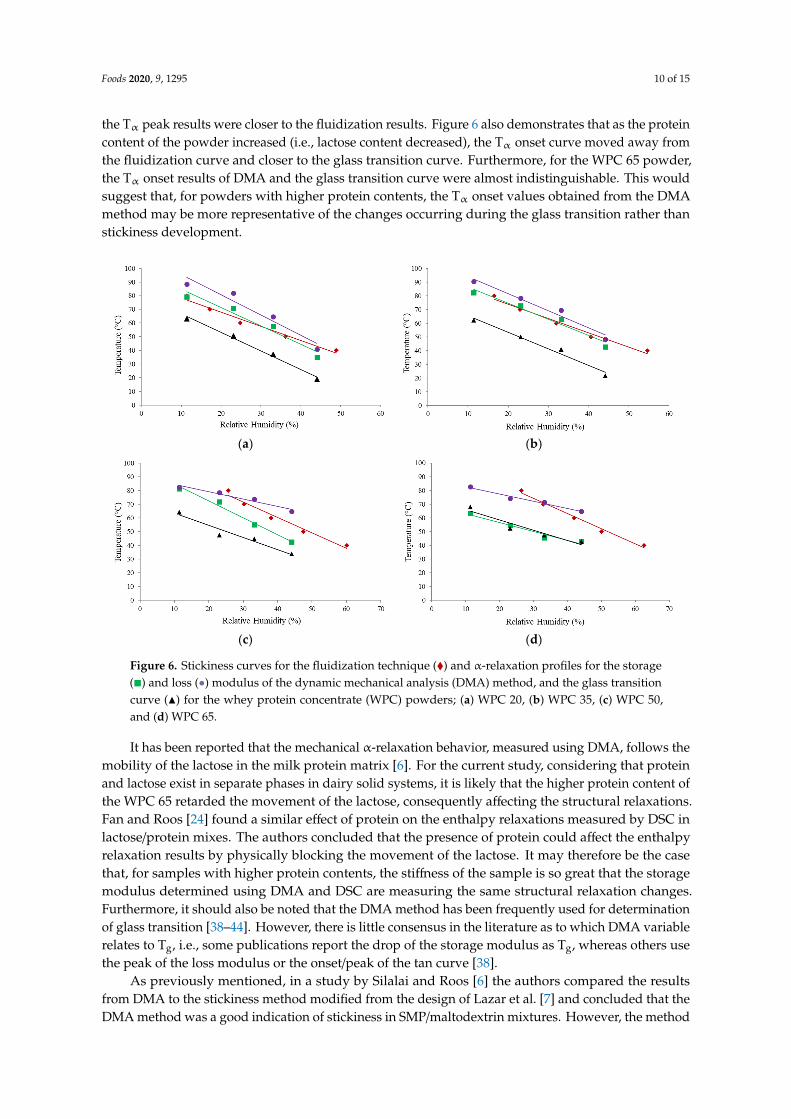
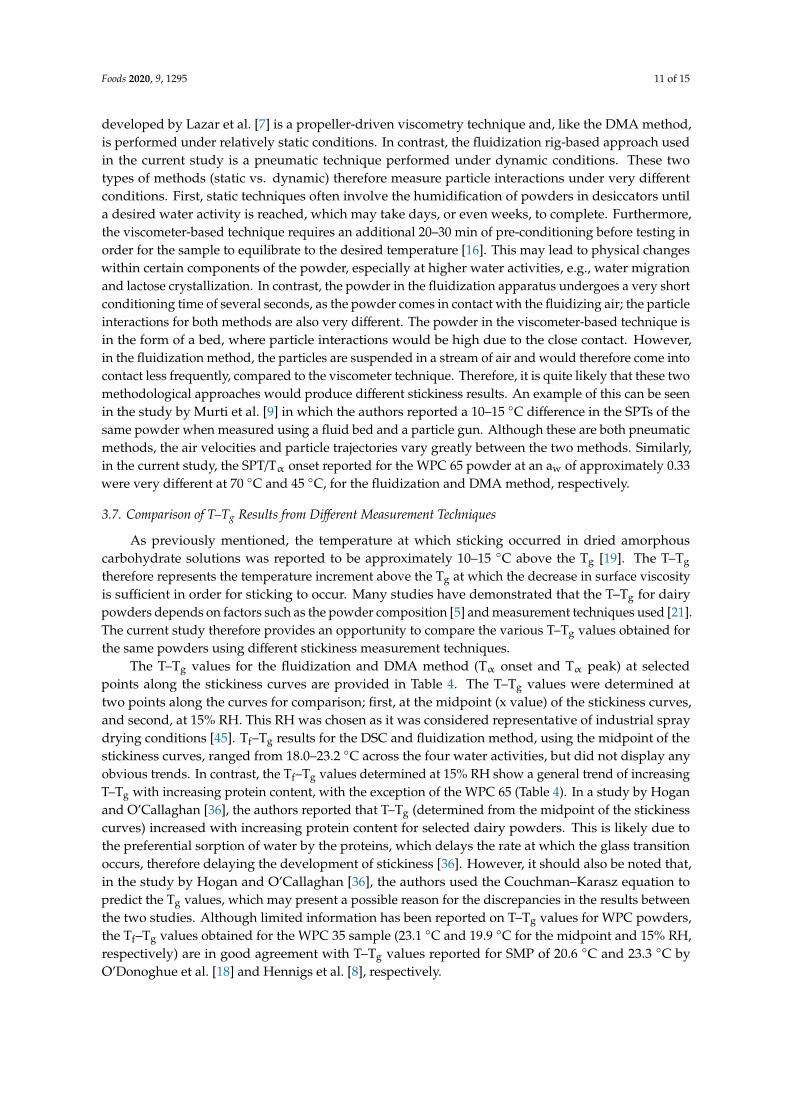
The Tα values determined from the storage and loss moduli of the DMA method were comparedto the stickiness curves (obtained using the fluidization method) and the glass transition curves(Figure 6). For the lower protein powders (WPC 20 and 35), the Tα onset results were closer to thosegenerated using the fluidization method, compared to the Tα peak results. Furthermore, for thesepowders, the stickiness curves generated using the fluidization method and the storage moduli ofDMA were almost identical (Figure 6a,b). In contrast, for the higher protein powders (WPC 50 and 65),
Foods 2020, 9, 1295 10 of 15
the Tα peak results were closer to the fluidization results. Figure 6 also demonstrates that as the proteincontent of the powder increased (i.e., lactose content decreased), the Tα onset curve moved away fromthe fluidization curve and closer to the glass transition curve. Furthermore, for the WPC 65 powder,the Tα onset results of DMA and the glass transition curve were almost indistinguishable. This wouldsuggest that, for powders with higher protein contents, the Tα onset values obtained from the DMAmethod may be more representative of the changes occurring during the glass transition rather thanstickiness development.Foods 2020, 9, x FOR PEER REVIEW 10 of 15
(a) (b)
(c) (d)
Figure 6. Stickiness curves for the fluidization technique (♦) and α-relaxation profiles for the storage
(■) and loss (●) modulus of the dynamic mechanical analysis (DMA) method, and the glass transition
curve (▲) for the whey protein concentrate (WPC) powders; (a) WPC 20, (b) WPC 35, (c) WPC 50,
and (d) WPC 65.
It has been reported that the mechanical α-relaxation behavior, measured using DMA, follows
the mobility of the lactose in the milk protein matrix [6]. For the current study, considering that
protein and lactose exist in separate phases in dairy solid systems, it is likely that the higher protein
content of the WPC 65 retarded the movement of the lactose, consequently affecting the structural
relaxations. Fan and Roos [24] found a similar effect of protein on the enthalpy relaxations measured
by DSC in lactose/protein mixes. The authors concluded that the presence of protein could affect the
enthalpy relaxation results by physically blocking the movement of the lactose. It may therefore be
the case that, for samples with higher protein contents, the stiffness of the sample is so great that the
storage modulus determined using DMA and DSC are measuring the same structural relaxation
changes. Furthermore, it should also be noted that the DMA method has been frequently used for
determination of glass transition [38–44]. However, there is little consensus in the literature as to
which DMA variable relates to Tg, i.e., some publications report the drop of the storage modulus as
Tg, whereas others use the peak of the loss modulus or the onset/peak of the tan curve [38].
As previously mentioned, in a study by Silalai and Roos [6] the authors compared the results
from DMA to the stickiness method modified from the design of Lazar et al. [7] and concluded that
the DMA method was a good indication of stickiness in SMP/maltodextrin mixtures. However, the
method developed by Lazar et al. [7] is a propeller-driven viscometry technique and, like the DMA
method, is performed under relatively static conditions. In contrast, the fluidization rig-based
approach used in the current study is a pneumatic technique performed under dynamic conditions.
These two types of methods (static vs. dynamic) therefore measure particle interactions under very
different conditions. First, static techniques often involve the humidification of powders in
desiccators until a desired water activity is reached, which may take days, or even weeks, to complete.
Furthermore, the viscometer-based technique requires an additional 20–30 min of pre-conditioning
before testing in order for the sample to equilibrate to the desired temperature [16]. This may lead to
physical changes within certain components of the powder, especially at higher water activities, e.g.,
Figure 6. Stickiness curves for the fluidization technique (�) and α-relaxation profiles for the storage(�) and loss (•) modulus of the dynamic mechanical analysis (DMA) method, and the glass transitioncurve (N) for the whey protein concentrate (WPC) powders; (a) WPC 20, (b) WPC 35, (c) WPC 50,and (d) WPC 65.
It has been reported that the mechanical α-relaxation behavior, measured using DMA, follows themobility of the lactose in the milk protein matrix [6]. For the current study, considering that proteinand lactose exist in separate phases in dairy solid systems, it is likely that the higher protein content ofthe WPC 65 retarded the movement of the lactose, consequently affecting the structural relaxations.Fan and Roos [24] found a similar effect of protein on the enthalpy relaxations measured by DSC inlactose/protein mixes. The authors concluded that the presence of protein could affect the enthalpyrelaxation results by physically blocking the movement of the lactose. It may therefore be the casethat, for samples with higher protein contents, the stiffness of the sample is so great that the storagemodulus determined using DMA and DSC are measuring the same structural relaxation changes.Furthermore, it should also be noted that the DMA method has been frequently used for determinationof glass transition [38–44]. However, there is little consensus in the literature as to which DMA variablerelates to Tg, i.e., some publications report the drop of the storage modulus as Tg, whereas others usethe peak of the loss modulus or the onset/peak of the tan curve [38].
As previously mentioned, in a study by Silalai and Roos [6] the authors compared the resultsfrom DMA to the stickiness method modified from the design of Lazar et al. [7] and concluded that theDMA method was a good indication of stickiness in SMP/maltodextrin mixtures. However, the method
Foods 2020, 9, 1295 11 of 15
developed by Lazar et al. [7] is a propeller-driven viscometry technique and, like the DMA method,is performed under relatively static conditions. In contrast, the fluidization rig-based approach usedin the current study is a pneumatic technique performed under dynamic conditions. These twotypes of methods (static vs. dynamic) therefore measure particle interactions under very differentconditions. First, static techniques often involve the humidification of powders in desiccators untila desired water activity is reached, which may take days, or even weeks, to complete. Furthermore,the viscometer-based technique requires an additional 20–30 min of pre-conditioning before testing inorder for the sample to equilibrate to the desired temperature [16]. This may lead to physical changeswithin certain components of the powder, especially at higher water activities, e.g., water migrationand lactose crystallization. In contrast, the powder in the fluidization apparatus undergoes a very shortconditioning time of several seconds, as the powder comes in contact with the fluidizing air; the particleinteractions for both methods are also very different. The powder in the viscometer-based technique isin the form of a bed, where particle interactions would be high due to the close contact. However,in the fluidization method, the particles are suspended in a stream of air and would therefore come intocontact less frequently, compared to the viscometer technique. Therefore, it is quite likely that these twomethodological approaches would produce different stickiness results. An example of this can be seenin the study by Murti et al. [9] in which the authors reported a 10–15 ◦C difference in the SPTs of thesame powder when measured using a fluid bed and a particle gun. Although these are both pneumaticmethods, the air velocities and particle trajectories vary greatly between the two methods. Similarly,in the current study, the SPT/Tα onset reported for the WPC 65 powder at an aw of approximately 0.33were very different at 70 ◦C and 45 ◦C, for the fluidization and DMA method, respectively.
3.7. Comparison of T–Tg Results from Different Measurement Techniques
As previously mentioned, the temperature at which sticking occurred in dried amorphouscarbohydrate solutions was reported to be approximately 10–15 ◦C above the Tg [19]. The T–Tg
therefore represents the temperature increment above the Tg at which the decrease in surface viscosityis sufficient in order for sticking to occur. Many studies have demonstrated that the T–Tg for dairypowders depends on factors such as the powder composition [5] and measurement techniques used [21].The current study therefore provides an opportunity to compare the various T–Tg values obtained forthe same powders using different stickiness measurement techniques.
The T–Tg values for the fluidization and DMA method (Tα onset and Tα peak) at selectedpoints along the stickiness curves are provided in Table 4. The T–Tg values were determined attwo points along the curves for comparison; first, at the midpoint (x value) of the stickiness curves,and second, at 15% RH. This RH was chosen as it was considered representative of industrial spraydrying conditions [45]. Tf–Tg results for the DSC and fluidization method, using the midpoint of thestickiness curves, ranged from 18.0–23.2 ◦C across the four water activities, but did not display anyobvious trends. In contrast, the Tf–Tg values determined at 15% RH show a general trend of increasingT–Tg with increasing protein content, with the exception of the WPC 65 (Table 4). In a study by Hoganand O’Callaghan [36], the authors reported that T–Tg (determined from the midpoint of the stickinesscurves) increased with increasing protein content for selected dairy powders. This is likely due tothe preferential sorption of water by the proteins, which delays the rate at which the glass transitionoccurs, therefore delaying the development of stickiness [36]. However, it should also be noted that,in the study by Hogan and O’Callaghan [36], the authors used the Couchman–Karasz equation topredict the Tg values, which may present a possible reason for the discrepancies in the results betweenthe two studies. Although limited information has been reported on T–Tg values for WPC powders,the Tf–Tg values obtained for the WPC 35 sample (23.1 ◦C and 19.9 ◦C for the midpoint and 15% RH,respectively) are in good agreement with T–Tg values reported for SMP of 20.6 ◦C and 23.3 ◦C byO’Donoghue et al. [18] and Hennigs et al. [8], respectively.
Foods 2020, 9, 1295 12 of 15
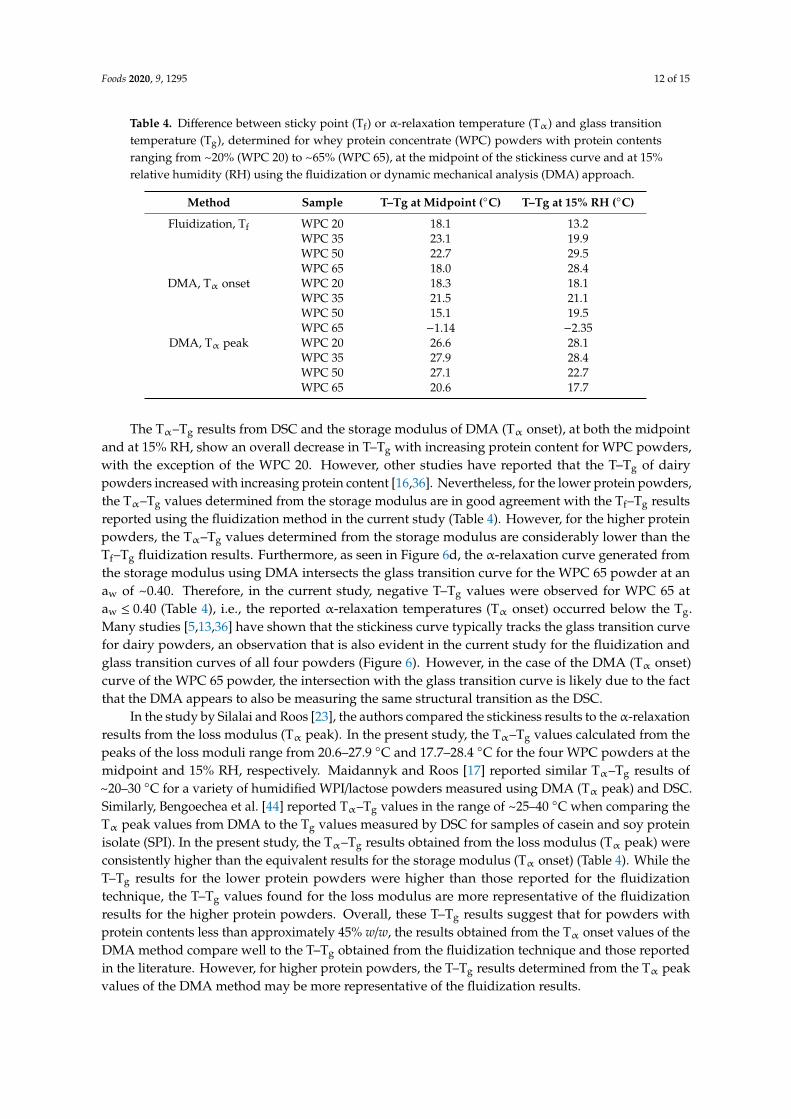
Table 4. Difference between sticky point (Tf) or α-relaxation temperature (Tα) and glass transitiontemperature (Tg), determined for whey protein concentrate (WPC) powders with protein contentsranging from ~20% (WPC 20) to ~65% (WPC 65), at the midpoint of the stickiness curve and at 15%relative humidity (RH) using the fluidization or dynamic mechanical analysis (DMA) approach.
Method Sample T–Tg at Midpoint (◦C) T–Tg at 15% RH (◦C)
Fluidization, Tf WPC 20 18.1 13.2WPC 35 23.1 19.9WPC 50 22.7 29.5WPC 65 18.0 28.4
DMA, Tα onset WPC 20 18.3 18.1WPC 35 21.5 21.1WPC 50 15.1 19.5WPC 65 −1.14 −2.35
DMA, Tα peak WPC 20 26.6 28.1WPC 35 27.9 28.4WPC 50 27.1 22.7WPC 65 20.6 17.7
The Tα–Tg results from DSC and the storage modulus of DMA (Tα onset), at both the midpointand at 15% RH, show an overall decrease in T–Tg with increasing protein content for WPC powders,with the exception of the WPC 20. However, other studies have reported that the T–Tg of dairypowders increased with increasing protein content [16,36]. Nevertheless, for the lower protein powders,the Tα–Tg values determined from the storage modulus are in good agreement with the Tf–Tg resultsreported using the fluidization method in the current study (Table 4). However, for the higher proteinpowders, the Tα–Tg values determined from the storage modulus are considerably lower than theTf–Tg fluidization results. Furthermore, as seen in Figure 6d, the α-relaxation curve generated fromthe storage modulus using DMA intersects the glass transition curve for the WPC 65 powder at anaw of ~0.40. Therefore, in the current study, negative T–Tg values were observed for WPC 65 ataw ≤ 0.40 (Table 4), i.e., the reported α-relaxation temperatures (Tα onset) occurred below the Tg.Many studies [5,13,36] have shown that the stickiness curve typically tracks the glass transition curvefor dairy powders, an observation that is also evident in the current study for the fluidization andglass transition curves of all four powders (Figure 6). However, in the case of the DMA (Tα onset)curve of the WPC 65 powder, the intersection with the glass transition curve is likely due to the factthat the DMA appears to also be measuring the same structural transition as the DSC.
In the study by Silalai and Roos [23], the authors compared the stickiness results to the α-relaxationresults from the loss modulus (Tα peak). In the present study, the Tα–Tg values calculated from thepeaks of the loss moduli range from 20.6–27.9 ◦C and 17.7–28.4 ◦C for the four WPC powders at themidpoint and 15% RH, respectively. Maidannyk and Roos [17] reported similar Tα–Tg results of~20–30 ◦C for a variety of humidified WPI/lactose powders measured using DMA (Tα peak) and DSC.Similarly, Bengoechea et al. [44] reported Tα–Tg values in the range of ~25–40 ◦C when comparing theTα peak values from DMA to the Tg values measured by DSC for samples of casein and soy proteinisolate (SPI). In the present study, the Tα–Tg results obtained from the loss modulus (Tα peak) wereconsistently higher than the equivalent results for the storage modulus (Tα onset) (Table 4). While theT–Tg results for the lower protein powders were higher than those reported for the fluidizationtechnique, the T–Tg values found for the loss modulus are more representative of the fluidizationresults for the higher protein powders. Overall, these T–Tg results suggest that for powders withprotein contents less than approximately 45% w/w, the results obtained from the Tα onset values of theDMA method compare well to the T–Tg obtained from the fluidization technique and those reportedin the literature. However, for higher protein powders, the T–Tg results determined from the Tα peakvalues of the DMA method may be more representative of the fluidization results.
Foods 2020, 9, 1295 13 of 15
4. Conclusions
DMA was shown to be an interesting complementary technique to other commonly appliedmethods for measurement of phase transitions (Tg by DSC) and stickiness behavior (fluidizationtechnique) for dairy powders. The data demonstrated that the comparability to other techniquesdepends on the composition of the powder and the modulus used (Tα onset or Tα peak). The storagemodulus results were in good agreement with the stickiness results from the fluidization technique forlower protein dairy powders (<45% protein w/w), whereas for powders with higher protein contents(~45–65% protein w/w), the results from the loss modulus were found to be more accurate. While DMAmay not be a suitable method for stickiness determination, it has potential as a complementarytechnique that would provide more detailed information on the visco-elastic changes occurring duringstickiness development. For example, the results of the current study suggest two different mechanismsof stickiness development: for the lower protein powders, stickiness occurs following a reductionin powder stiffness, and for the higher protein powder, there appears to be a two-stage mechanisminvolving a reduction in stiffness followed by a significant change in viscosity. It should also be notedthat DMA is commonly used for Tg determination, and in the current study, the Tα onset results werefound to be almost identical to the Tg results obtained using DSC analysis for the WPC 65.
Overall, this study has highlighted the variability of different methods reported in the literatureto ostensibly measure the same or similar structural changes in dairy powders (i.e., SPT, Tg) and hasdemonstrated that the use of material characterization methods, such as DMA, may facilitate a deeperunderstanding of the fundamental mechanisms of stickiness development. However, the static natureof the powders during DMA determination limits its applicability as a direct method to determine thestickiness of powders in a dynamic system such as a spray dryer. Therefore, it is recommended touse DMA in combination with methods such as fluidization or particle gun analyses which are morereflective of stickiness under dynamic conditions.
Author Contributions: L.T.O. performed the experiments, analyzed data, and drafted the document;M.K.H. performed the experiments and analyzed data; S.A.H. provided data interpretation and edited themanuscript throughout drafting; F.R.L. performed XPS and interpreted data; J.A.O. provided academic supervision,data interpretation, and edited the manuscript throughout drafting; E.G.M. was project lead, conceptualized thestudy, and edited the manuscript throughout drafting. All authors have read and agreed to the published versionof the manuscript.
Funding: This work was supported by the Irish State through funding from the Enterprise Ireland (EI) TechnologyCentres Programme—grant number TC/2014/0016.
Acknowledgments: The authors would like to thank Niall O’Reilly and Philip Cresswell of the Waterford Instituteof Technology for their assistance in determining the moisture sorption isotherms of the powders.
Conflicts of Interest: The authors declare no conflict of interest. The funders had no role in the design of thestudy; in the collection, analyses, or interpretation of data; in the writing of the manuscript, or in the decision topublish the results.
References
1. Chuy, L.E.; Labuza, T.P. Caking and stickiness of dairy-based food powders as related to glass transition.J. Food Sci. 1994, 59, 43–46. [CrossRef]
2. Paterson, A.H.J.; Bronlund, J.E.; Brooks, G.F. The blow test for measuring the stickiness of powders.In Proceedings of the AIChE 2001 Annual Meeting, Reno, NV, USA, 4–9 November 2001.
3. Özkan, N.; Walisinghe, N.; Chen, X.D. Characterization of stickiness and cake formation in whole and skimmilk powders. J. Food Eng. 2002, 55, 293–303. [CrossRef]
4. Zuo, J.Y.; Paterson, A.H.J.; Bronlund, J.E.; Chatterjee, R. Using a particle-gun to measure initiation of stickinessof dairy powders. Int. Dairy J. 2007, 17, 268–273. [CrossRef]
5. Hogan, S.; O’Callaghan, D.; Bloore, G. Application of fluidised bed stickiness apparatus to dairy powderproduction. Milchwissenschaft 2009, 64, 308–311.
6. Silalai, N.; Roos, Y.H. Mechanical relaxation times as indicators of stickiness in skim milk–maltodextrinsolids systems. J. Food Eng. 2011, 106, 306–317. [CrossRef]
Foods 2020, 9, 1295 14 of 15
7. Lazar, M.; Brown, A.; Smith, G.; Wong, F.; Lindquist, F. Experimental production of tomato powder by spraydrying. Food Technol. 1956, 10, 129–134.
8. Hennigs, C.; Kockel, T.; Langrish, T. New measurements of the sticky behavior of skim milk powder.Dry. Technol. 2001, 19, 471–484. [CrossRef]
9. Murti, R.A.; Paterson, A.H.J.; Pearce, D.L.; Bronlund, J.E. The influence of particle velocity on the stickinessof milk powder. Int. Dairy J. 2010, 20, 121–127. [CrossRef]
10. Brooks, G.F. The Sticking and Crystallisation of Amorphous Lactose. Master’s Thesis, Massey University,Auckland, New Zeland, 2000.
11. Couchman, P.; Karasz, F. A classical thermodynamic discussion of the effect of composition on glass-transitiontemperatures. Macromolecules 1978, 11, 117–119. [CrossRef]
12. Jouppila, K.; Roos, Y. Glass transitions and crystallization in milk powders. J. Dairy Sci. 1994, 77, 2907–2915.[CrossRef]
13. Ozmen, L.; Langrish, T. Comparison of glass transition temperature and sticky point temperature for skimmilk powder. Dry. Technol. 2002, 20, 1177–1192. [CrossRef]
14. Haque, M.K.; Roos, Y. Water plasticization and crystallization of lactose in spray-dried lactose/proteinmixtures. J. Food Sci. 2004, 69, FEP23–FEP29. [CrossRef]
15. Haque, M.K.; Roos, Y. Water sorption and plasticization behavior of spray-dried lactose/protein mixtures.J. Food Sci. 2004, 69, E384–E391. [CrossRef]
16. Silalai, N.; Roos, Y.H. Roles of water and solids composition in the control of glass transition and stickinessof milk powders. J. Food Sci. 2010, 75, E285–E296. [CrossRef]
17. Maidannyk, V.; Roos, Y. Water sorption, glass transition and “strength” of lactose-whey protein systems.Food Hydrocoll. 2017, 70, 76–87. [CrossRef]
18. O’Donoghue, L.T.; Haque, M.K.; Kennedy, D.; Laffir, F.R.; Hogan, S.A.; O’Mahony, J.A.; Murphy, E.G.Influence of particle size on the physicochemical properties and stickiness of dairy powders. Int. Dairy J.2019, 98, 54–63. [CrossRef]
19. Roos, Y.; Karel, M. Plasticizing effect of water on thermal behavior and crystallization of amorphous foodmodels. J. Food Sci. 1991, 56, 38–43. [CrossRef]
20. Karel, M.; Anglea, S.; Buera, P.; Karmas, R.; Levi, G.; Roos, Y. Stability-related transitions of amorphous foods.Thermochim. Acta 1994, 246, 249–269. [CrossRef]
21. Boonyai, P.; Bhandari, B.; Howes, T. Stickiness measurement techniques for food powders: A review.Powder Technol. 2014, 145, 34–46. [CrossRef]
22. Murti, R.A.; Paterson, A.H.J.; Pearce, D.L.; Bronlund, J.E. Stickiness of skim milk powder using the particlegun technique. Int. Dairy J. 2009, 19, 137–141. [CrossRef]
23. Silalai, N.; Roos, Y.H. Coupling of dielectric and mechanical relaxations with glass transition and stickinessof milk solids. J. Food Eng. 2011, 104, 445–454. [CrossRef]
24. Fan, F.; Roos, Y.H. Structural relaxations of amorphous lactose and lactose-whey protein mixtures. J. Food Eng.2016, 173, 106–115. [CrossRef]
25. Fan, F.; Roos, Y.H. Structural strength and crystallization of amorphous lactose in food model solids atvarious water activities. Inn. Food Sci. Emerg. Technol. 2017, 40, 27–34. [CrossRef]
26. IDF. Determination of Fat Content—Rose Gottlieb Reference Method. IDF Standard 9C; International DairyFederation: Brussels, Belgium, 1987.
27. Faldt, P.; Bergenstahl, B.; Carlsson, G. The surface coverage of fat on food powders analyzed by ESCA(electron spectroscopy for chemical analysis). Food Struct. 1993, 12, 10.
28. Murphy, E.G.; Roos, Y.H.; Hogan, S.A.; Maher, P.G.; Flynn, C.G.; Fenelon, M.A. Physical stability of infantmilk formula made with selectively hydrolysed whey proteins. Int. Dairy J. 2015, 40, 39–46. [CrossRef]
29. Nijdam, J.; Langrish, T. The effect of surface composition on the functional properties of milk powders.J. Food Eng. 2006, 77, 919–925. [CrossRef]
30. Shrestha, A.K.; Howes, T.; Adhikari, B.P.; Wood, B.J.; Bhandari, B.R. Effect of protein concentration on thesurface composition, water sorption and glass transition temperature of spray-dried skim milk powders.Food Chem. 2007, 104, 1436–1444. [CrossRef]
31. Kim, E.H.-J.; Chen, X.D.; Pearce, D. Surface composition of industrial spray-dried milk powders. 2. Effects ofspray drying conditions on the surface composition. J. Food Eng. 2009, 94, 169–181. [CrossRef]
Foods 2020, 9, 1295 15 of 15
32. Foerster, M.; Gengenbach, T.; Woo, M.W.; Selomulya, C. The impact of atomization on the surface compositionof spray-dried milk droplets. Colloids Surf. B Biointerfaces 2016, 140, 460–471. [CrossRef]
33. Maidannyk, V.; McSweeney, D.J.; Hogan, S.A.; Miao, S.; Montgomery, S.; Auty, M.A.; McCarthy, N.A.Water sorption and hydration in spray-dried milk protein powders: Selected physicochemical properties.Food Chem. 2020, 304, 125418. [CrossRef]
34. Berlin, E.; Anderson, B.A.; Pallansch, M.J. Comparison of water vapor sorption by milk powder components.J. Dairy Sci. 1968, 51, 1912–1915. [CrossRef]
35. Foster, K.D.; Bronlund, J.E.; Paterson, A.H.J. The prediction of moisture sorption isotherms for dairy powders.Int. Dairy J. 2005, 15, 411–418. [CrossRef]
36. Hogan, S.; O’Callaghan, D. Influence of milk proteins on the development of lactose-induced stickiness indairy powders. Int. Dairy J. 2010, 20, 212–221. [CrossRef]
37. Downton, G.E.; Flores-Luna, J.L.; King, C.J. Mechanism of stickiness in hygroscopic, amorphous powders.Ind. Eng. Chem. Fund. 1982, 21, 447–451. [CrossRef]
38. Menard, K.P. Dynamic Mechanical Analysis. In Encyclopedia of Polymer Science and Technology; John Wiley & Sons,Inc.: Hoboken, NJ, USA, 2002; pp. 1–33.
39. Kalichevsky, M.; Jaroszkiewicz, E.; Ablett, S.; Blanshard, J.; Lillford, P. The glass transition of amylopectinmeasured by DSC, DMTA and NMR. Carbohydr. Polym. 1992, 18, 77–88. [CrossRef]
40. Rahman, M.S.; Al-Marhubi, I.M.; Al-Mahrouqi, A. Measurement of glass transition temperature bymechanical (DMTA), thermal (DSC and MDSC), water diffusion and density methods: A comparisonstudy. Chem. Phys. Lett. 2007, 440, 372–377. [CrossRef]
41. Kararli, T.T.; Hurlbut, J.B.; Needham, T.E. Glass-rubber transitions of cellulosic polymers by dynamicmechanical analysis. J. Pharm. Sci. 1990, 79, 845–848. [CrossRef]
42. Hallberg, L.; Chinachoti, P. Dynamic mechanical analysis for glass transitions in long shelf-life bread.J. Food Sci. 1992, 57, 1201–1229. [CrossRef]
43. Siebenmorgen, T.; Yang, W.; Sun, Z. Glass transition temperature of rice kernels determined by dynamicmechanical thermal analysis. Trans. ASAE 2004, 47, 835. [CrossRef]
44. Bengoechea, C.; Arrachid, A.; Guerrero, A.; Hill, S.E.; Mitchell, J.R. Relationship between the glass transitiontemperature and the melt flow behavior for gluten, casein and soya. J. Cereal Sci. 2007, 45, 275–284. [CrossRef]
45. Schuck, P.; Dolivet, A.; Méjean, S.; Jeantet, R. Relative humidity of outlet air: The key parameter to optimizemoisture content and water activity of dairy powders. Dairy Sci. Technol. 2008, 88, 45–52. [CrossRef]
© 2020 by the authors. Licensee MDPI, Basel, Switzerland. This article is an open accessarticle distributed under the terms and conditions of the Creative Commons Attribution(CC BY) license (http://creativecommons.org/licenses/by/4.0/).