
Dynamic fill-up and picking process for small and middle ...
149
Dynamic fill-up and picking process for small and middle sized companies in the food market industry DIPLOMARBEIT zur Erlangung des akademischen Grades Diplom-Ingenieur im Rahmen des Studiums Wirtschaftsinformatik eingereicht von Ing. Matthias Bauer, BSc Matrikelnummer 01225825 an der Fakultät für Informatik der Technischen Universität Wien Betreuung: Assoc. Prof. Dr. Dipl.-Ing. Hilda Tellio˘ glu Wien, 5. Mai 2021 Matthias Bauer Hilda Tellio˘ glu Technische Universität Wien A-1040 Wien Karlsplatz 13 Tel. +43-1-58801-0 www.tuwien.at
Transcript of Dynamic fill-up and picking process for small and middle ...
Dynamic fill-up and pickingprocess for small and middlesized companies in the food
market industry
DIPLOMARBEIT
zur Erlangung des akademischen Grades
Diplom-Ingenieur
im Rahmen des Studiums
Wirtschaftsinformatik
eingereicht von
Ing. Matthias Bauer, BScMatrikelnummer 01225825
an der Fakultät für Informatik
der Technischen Universität Wien
Betreuung: Assoc. Prof. Dr. Dipl.-Ing. Hilda Tellioglu
Wien, 5. Mai 2021Matthias Bauer Hilda Tellioglu
Technische Universität WienA-1040 Wien Karlsplatz 13 Tel. +43-1-58801-0 www.tuwien.at


Dynamic fill-up and pickingprocess for small and middlesized food market companies
DIPLOMA THESIS
submitted in partial fulfillment of the requirements for the degree of
Diplom-Ingenieur
in
Business Informatics
by
Ing. Matthias Bauer, BScRegistration Number 01225825
to the Faculty of Informatics
at the TU Wien
Advisor: Assoc. Prof. Dr. Dipl.-Ing. Hilda Tellioglu
Vienna, 5th May, 2021Matthias Bauer Hilda Tellioglu
Technische Universität WienA-1040 Wien Karlsplatz 13 Tel. +43-1-58801-0 www.tuwien.at


Erklärung zur Verfassung derArbeit
Ing. Matthias Bauer, BSc
Hiermit erkläre ich, dass ich diese Arbeit selbständig verfasst habe, dass ich die verwen-deten Quellen und Hilfsmittel vollständig angegeben habe und dass ich die Stellen derArbeit – einschließlich Tabellen, Karten und Abbildungen –, die anderen Werken oderdem Internet im Wortlaut oder dem Sinn nach entnommen sind, auf jeden Fall unterAngabe der Quelle als Entlehnung kenntlich gemacht habe.
Wien, 5. Mai 2021Matthias Bauer
v


Acknowledgements
First of all, I would like to thank my advisor, Assoc. Prof. Dr. Dipl.-Ing. Hilda Tellioğlu,who gave me the opportunity to work on this important topic. Her office was open tosupport and guide me through this thesis all the time.
Many thanks to the responsible stock managers Thomas Koppensteiner, Dietmar Schi-mani and Monika Wimmer from SONNENTOR Kräuterhandelsgesellschaft mbH, FranzVogler from KASTNER GroßhandelsgesmbH and Thomas Vit from Julius KiennastLebensmittelgroßhandels GmbH who took their time for an interview and supported mewhenever questions would arise. Also many thanks to Ing. Harald Falkner, the CEO ofFab4minds IT GmbH, who created the connection and the possibility to work on theERP system of SONNENTOR Kräuterhandelsgesellschaft mbH to test the prototype.
Special thanks to my family, which always has an open ear whenever I needed something.Many thanks to my parents, who made it possible for me to study at the TU Viennaand arrange all around so that I was able to focus on university.
Also, I want to thank all my friends and relatives, who helped me in creating thisthesis.
Finally, I want to thank my beloved girlfriend Angela, who supported and motivated methrough this challenging time.
vii


Kurzfassung
Durch die fallenden Preise für Artikel und der immer kürzer werdenden Lieferzeitenwerden optimale Lagerverwaltungssysteme immer wichtiger. Bei der Erstellung undOptimierung von Lagerverwaltungssystemen muss dies auch von Unternehmen in derLebensmittelbranche berücksichtigt werden, um weiterhin konkurrenzfähig zu bleiben.Dadurch ist es notwendig, den Artikeldurchsatz zu erhöhen, die Artikel dort zu lagern,wo es am passendsten ist und die Wege für die Angestellten so kurz wie möglich zu halten.Diese Arbeit zielt darauf ab, den Nachschlicht und Kommissionierprozess zu optimieren.Zuerst werden durch eine Literaturrecherche die wichtigsten Parameter eines Lagerverwal-tungssystems und des Nachschlicht- bzw. des Kommissionierprozesses erarbeitet. DurchInterviews mit den verantwortlichen Lagerleiter/innen von drei verschiedenen Unter-nehmen der Branche werden die wichtigen und zeitkritischen Parameter und Prozesseidentifiziert. Basierend auf der Literaturrecherche und den Interviews werden verschiedeneAnsätze zur Optimierung des Nachschlichtprozesses umgesetzt und in einem ERP Systemeiner Firma implementiert. Für den Kommissionierprozess werden ebenfalls verschiedeneAnsätze zur Erstellung einer Sammel-Kommissionierung und der optimalen Wegeberech-nung für die Angestellten erarbeitet und implementiert.Das Resultat der vorliegenden Arbeit zeigt, dass die Optimierungen des Nachschlichtpro-zesses keine erheblichen Vorteile bringen, jedoch einen großen Einfluss auf den Kommis-sionierprozess haben. Mit dem derzeitigen Personal und räumlichen Umständen kanndas Optimierungspotential erheblich gesteigert werden. Ohne den davor eingeführtenNachschlichtprozess wäre dies nicht in dieser Größendimension möglich.
ix

Abstract
Inventory management techniques gain more and more importance due to decreasingprices of goods and faster delivery times. In the food market industry, this must beincluded when creating or optimizing a stock management system. Therefore, it isnecessary to optimize the throughput of articles, store the articles in the most properstock location and minimize the employees’ ways. Thus, this master thesis aims to createan approach to fill-up articles and pick articles in an optimal manner.First, essential parameters of stock management systems and the fill-up and pickingprocesses are identified by a literature review. After that, the responsible stock managersfrom three different companies in this sector were interviewed to identify the mosttime-consuming and critical processes within a stock management system. Differentapproaches for filling up goods in a warehouse in an optimal manner regarding shortdistances to the packing tables were applied and implemented into the ERP system of acompany investigated. The second part of this thesis handles the optimization of thepicking process. Therefore, different approaches to creating a batch order and the optimalway through the stock for the picking personnel were implemented into the ERP system.The results of this thesis show that the optimization of the fill-up process does not createa big difference to the current approach but has an impact on the picking process. Atthe current personal and spatial circumstances, the throughput of the picking processcan be increased.
xi

Contents
Kurzfassung ix
Abstract xi
Contents xiii
1 Introduction 11.1 Problem definition . . . . . . . . . . . . . . . . . . . . . . . . . . . . . . 11.2 Expected outcome . . . . . . . . . . . . . . . . . . . . . . . . . . . . . 21.3 Methodology . . . . . . . . . . . . . . . . . . . . . . . . . . . . . . . . 31.4 Structure of the work . . . . . . . . . . . . . . . . . . . . . . . . . . . 5
2 Related Work 72.1 State of the art . . . . . . . . . . . . . . . . . . . . . . . . . . . . . . . 72.2 Fill-up approaches . . . . . . . . . . . . . . . . . . . . . . . . . . . . . 82.3 Picking process approaches . . . . . . . . . . . . . . . . . . . . . . . . 142.4 Order batching . . . . . . . . . . . . . . . . . . . . . . . . . . . . . . . 172.5 Structure of the stock . . . . . . . . . . . . . . . . . . . . . . . . . . . 192.6 Strategies to find a path . . . . . . . . . . . . . . . . . . . . . . . . . . . 21
3 Implementation 273.1 Interview summary . . . . . . . . . . . . . . . . . . . . . . . . . . . . . 273.2 Defining important parameters . . . . . . . . . . . . . . . . . . . . . . 353.3 Fill-up process . . . . . . . . . . . . . . . . . . . . . . . . . . . . . . . 453.4 Picking process . . . . . . . . . . . . . . . . . . . . . . . . . . . . . . . 68
4 Evaluation 874.1 Important parameters for fill-up and picking processes . . . . . . . . . 874.2 Fill-up process . . . . . . . . . . . . . . . . . . . . . . . . . . . . . . . . 914.3 Picking process . . . . . . . . . . . . . . . . . . . . . . . . . . . . . . . 103
5 Conclusion and future work 115
List of Figures 118
xiii

List of Tables 120
Bibliography 121
Appendix A 123Sonnentor . . . . . . . . . . . . . . . . . . . . . . . . . . . . . . . . . . . . . 123
Appendix B 125Interview with SONNENTOR Kräuterhandels GMBH . . . . . . . . . . . . 125
Appendix C 129Interview with KASTNER GroßhandelsgesmbH . . . . . . . . . . . . . . . . 129
Appendix D 133Interview with JULIUS KIENNAST LEBENSMITTELGROSSHANDELS GMBH 133

CHAPTER 1Introduction
1.1 Problem definitionThere are about 8,400 trading companies in Austria with approximately 140,000 employees(full and part-time) in the food market industry1. There are about 500 new companiesfounded every year in this industry. Most of them have a big stock but no possibilityor enough experience to optimize their stock management. Stock management meansfinding the optimal stock location for every product. An optimal stock location has thefollowing characteristics.
• Time-saving: Product pickers should have precise ways to the most commonproducts.
• Cost-saving: There are many factors to save costs with an optimized stockmanagement system. One of them is that it is unnecessary to have an enormousamount of goods in the main inventory. The optimized way is to store just theamount of one or two days in that stock. Therefore, the demand for the followingdays and the demand of previous periods are needed. The main stock is that part ofthe inventory where the pickers collect their goods for B2C (Business-to-Customers)customers that usually order lower amounts of goods. The other part is for fill-uppurposes of the main stock and for B2B (Business-to-Business) customers. Anothercost-saving possibility is to save labor by an optimal picking and fill-up process.This can be achieved by saving time at these processes.
• Consider existing conditions: Some products have specific product specifica-tions like strong smell, whether they absorb the aroma of other goods, expirationdates or whether the product must be cooled. The products should be placed insuch a way that nothing happens regarding these specifications.
1http://wko.at/statistik/BranchenFV/B_301.pdf
1

1. Introduction
• Optimal picking processing: Short ways from processing to the stock locationsaves time and money.
• Optimal picking spatial distribution: The best products (products with thehighest inventory turnover ratio) should not be placed next to each other to avoidaccidents caused by picking personnel and stackers.
• Optimal picking product quality: The stock management should also thinkabout different product quality levels. Different quality levels are needed in differentproduct families.
• Optimal picking batches: With B2B customers, it is not allowed to send themelder batches of a good compared to deliveries before.
• Optimal seasonal goods’ stock location: It is possible to have seasonal goodslike an advent calendar in winter or potatoes in summer.
These specifications of stocks can lead companies to create a dynamic inventory. Adynamic stock means that an article does not have one standard place in the stock. Thestock management system must learn from the data where the best place for this articlecan be. If one article is a product with a high turnover ratio, it is sometimes betterto have it near the packing tables to minimize the pickers’ ways. If a processing stepis finished, a picker has to fill it up at the stock. The system has to calculate out ofconstraints which stock place is ideal for this article. Therefore, one stock place may befilled with two or more different products because it fits better to the constraints.
Another dynamic step is the picking process. If a person starts a picking process, he/sheshould get the right stock place for an article. If the stock management can work withmore than one good per stock location, the article of the current picking process must beavailable for the picker.
It is very complex to ensure all specifications of an optimal stock. Therefore, manythe companies do not want to change anything on their product distribution in theirstocks. Because this is a complex topic, the company cannot test it before. Some booksare available, but they include just examples, how it can work and which factors areimportant. Usually, these books do not contain constraints that have to be ensured tocreate a dynamic inventory.
1.2 Expected outcomeThe expected result of this master thesis is in the first step a list with all identifiedparameters for a dynamic fill-up and picking process. Important parameters for thefill-up process can be for instance the expiration date, request of an article in a specificperiod of time, inventory ratio turnover of an article, whether an article is in an externalwarehouse and whether product specifications like a strong smell or absorbing aroma
2

1.3. Methodology
from other goods. Parameters for the picking process are for example the minimal wayof the pickers, grouping the most similar orders, identifying the best number of pickersor finding the next best inventory place with regard to the expiration date or batchof a specific good. Interviews with the stock managers and his/her substitutes fromSonnentor, Kastner and Kiennast will identify these parameters.
The second step handles the fill-up process. After a good is delivered by a supplier or isproduced in the production hall, the system has to calculate the best place for this articleto fill it up in the inventory. Therefore, one stock place may be filled up with more thanone product. This best stock place will lead to a reduction of time when picking thegoods for the orders. After the fill-up process, the picking process will be handled. If apicker wants a new picking task, the system calculates one collection order. A collectionorder is an order with a specific number of similar batched orders to minimize the picker’sway.
This part of the master thesis ends up in separate algorithms for the fill-up and pickingprocess, which are also integrated into the test environment of the stock managementsystem of Sonnentor2.
The last step of the master thesis is to show the differences between a standard stockmanagement system with a non-dynamic fill-up and picking process and the dynamicone. Differences will be the reduction of time at both of these processes. The results willbe provided by different plots to create awareness of the potential improvement of thesystem.
1.3 Methodology1.3.1 Literature reviewAt the beginning of this master thesis, a literature review will be done to gain insightsinto the stock management workflows. This will be done by following the guideline tocreate a meaningful and qualitative literature review stated in [DKW17]. Thus, theresearch question’s fundamental work to define constraints for the fill-up and pickingprocess and which parameter influences the calculation to find the optimal stock placewere examined. The literature review also gives an overview of the different approachesto find the optimal stock place and how a person should be walking through the stockwhen picking goods.
1.3.2 Qualitative analysisThe second step will be to create a qualitative analysis by having an interview with theresponsible stock managers in the food market industry. These interviews will start bycarrying out a study to determine which data is needed for this thesis (amount of stocks,amount of racks, number of pickers per shift, list of goods and specifications). This will
2For more information on Sonnentor see the Appendix 5
3

1. Introduction
be achieved by reading and comparing different papers, interviewing the responsiblepeople from Sonnentor, Kiennast and Kastner and showing the most important stockmanagement parameters. Questions to answer after the interviews will be:
1. Do articles have any specifications?
2. What kind of racks are the most important ones in the food market industry?
3. What are the most important packaging units in the food market industry?
4. Should every picker and stacker use all corridors? (To avoid accidents and conflicts)
5. Should each picker take one order or more than one simultaneously?
6. How to calculate the request for an article for a specific period?
7. What are the most time-consuming workflows within the stock management?
1.3.3 Implementation of a prototype for a fill-up and picking activityBased on the literature review and the qualitative analysis, a prototype will be imple-mented into the test environment of Sonnentor. The prototype will handle the mosttime-consuming process, which is the fill-up and picking process. In this prototype, thedifferent approaches of each process will be implemented to get a meaningful outcome.The prototype will be implemented so that the parameters are easy to change to create asemi-autonomous process.
1.3.4 Statistical evaluation of ratio of optimizationIn the last step, the awareness of the optimization potential will be shown for the fill-upand picking process. Therefore, a statistical evaluation will be carried out to show thetime improvements from a non-dynamic to a dynamic system for the picking and thefill-up part. This will be shown by different plots.
1.3.5 Research questionsThis master thesis will handle the two most time-consuming parts of a stock managementsystem: the picking and fill-up process. Therefore, this master thesis will aim to findan optimization potential in that process. After this, this thesis will split up into twodifferent parts: the picking part and the fill-up part. The fill-up part will calculatethe correct stock location for an article based on the literature review parameters andqualitative analysis. The picking part ensures getting the right stock-place from thesystem and handles an optimal collection of different orders. Therefore, the system hasto analyse the collected data from the previous periods and the following days or weeks’orders. The research questions of this master thesis are:
4

1.4. Structure of the work
1. Can a dynamic fill-up process be provided by a semi-autonomous algorithm?
• Which constraints are important for a fill-up process?• What is the demand on an article with respect of the current orders and
previous periods?• What are the parameters needed to define an optimal place of a product with
respect of their specifications?
2. Can a picking process be provided by a semi-autonomous algorithm?
• What is the best algorithm to group orders together?• Which parameters are needed to define an optimal picking process?• What is the shortest way for a picker through the stock?
1.4 Structure of the workThis master thesis is structured as follows. In Chapter 2, the theoretical background ofa stock management system and the specific processes are described. Chapter 3 showsthe result of the interviews with Sonnentor, Kastner and Kiennast, gives an overview ofthe important parameters of an article and describes the implementation of the fill-upand picking-process. The master thesis ends with an evaluation in Chapter 4 and theconclusion and future work in Chapter 5.
5


CHAPTER 2Related Work
2.1 State of the artThe current state of the art has no comparatively scientific work available, describingdifferent parameters and aiming for an optimal fill-up and picking process. There aresome comparable papers and books available that describe approaches on how to guide aperson through the stock or give away some classification methods for the fill-up process.Commercial products were investigated in this thesis too.
2.1.1 Scientific workThe paper [DSAS18] aims to find an optimal order picking system to minimize the timein a multidimensional stock. The authors use the genetic algorithm to determine aminimum route through the Single Picker Routing Problem (SPRP) which is a TravelingSalesman Problem (TSP). In this paper, the authors considered a three-dimensionalstock environment, where the z-axis is the height of the racking system. The height ofthe racking system is needed to include the vertical lifting speed of the stacker to theoverall time which is needed for picking.
The paper [vGRCdK18] shows an overview of the state of the art, a classificationof the planning problems and a review of efficient picking systems by combining differentapproaches. The authors give a general overview of the different planning problems fromdifferent points of view:
1. Strategic: The strategic planning problems deal with the design of a warehouse.This includes the decision of the design or the level of automation.
2. Tactical: Tactical planning problems mean the resource dimension like the storagecapacity and size of the racks at a specific place in the warehouse.
7
2. Related Work
3. Operational: The operational planning problems are for example batching androuting through the racks.
[Ign17] gives an overview of a complete logistic system. A complete logistic system meansstarting with an efficient order system to have enough on stock every time and endingwith an optimized distribution and retail system. This paper shows how to optimize thestock system to minimize the costs for storing the goods.
The paper [DCR07] handles the reordering process of an inventory at mid-season. Mid-season means the point of time when one type of product is obsolete and new productsarrive. Therefore, the authors of this paper calculated the demand for the new productswithout substitutes to have the optimal amount of these products on stock.
2.1.2 Commercial productsThere are also some commercial products for inventory systems. The system with themost dynamic approach is Dynamic Inventory1. Dynamic Inventory has two main tasks.First to track all products at every point in time in the store. This will be ensured byscanning the codes of the article and the stock location at every goods movement. Thesecond task is to handle purchase and sales orders.Systems with a similar approach are Oracle Netsuite2, the inventory management systemfrom ASAP Systems3, Manage Inventory And Monitor Assets from freshworks4 or theERP system from fab4minds5.Most of the commercial products are not published and there is not too much informationavailable. The best example is Amazon. There are just a few interviews with regionalmanagers of Amazon where they did not tell much about their stock management system6.Amazon works with the chaos approach. This means that every product will be stored atthe next available stock location. Two same products can be far away from each other.The chaos approach can also be applied at bigger warehouses where it is not so importantto have ways as short as possible.
2.2 Fill-up approachesFill-up approaches are necessary to create an optimal article distribution on stock.Nowadays the supply chain becomes more and more important to reduce costs. Anarticle with a high forecasting accuracy can be ordered just in time and can be stored ata more prominent position than a high variable article. This is why the supply chain
1https://www.dynamicinventory.net/inventory-management-software/2https://bit.ly/2RTUKy53https://bit.ly/2pXVF3Z4https://bit.ly/2QXTokO5https://bit.ly/2QSXD0P6https://bit.ly/3tj5ck9
8
2.2. Fill-up approaches
gets more attention than ever, as described in [ABA+19]. The goal of fill-up approachesrelated to this master thesis is to find the best stock location at the fill-up stage to ensurean efficient picking strategy. Filling-up strategies are the basis of an efficient pickingsystem. The stock management system has to calculate the customer demands or accessfrequencies in real-time from the last periods and the upcoming orders to optimize thepickers’ ways. Therefore it is necessary to have predefined methods to find the best stocklocation. The most common stock management types are the clustering of goods withABC-cluster, XYZ-analysis, the combination of these two approaches or to have a chaosapproach.
2.2.1 ABC-cluster
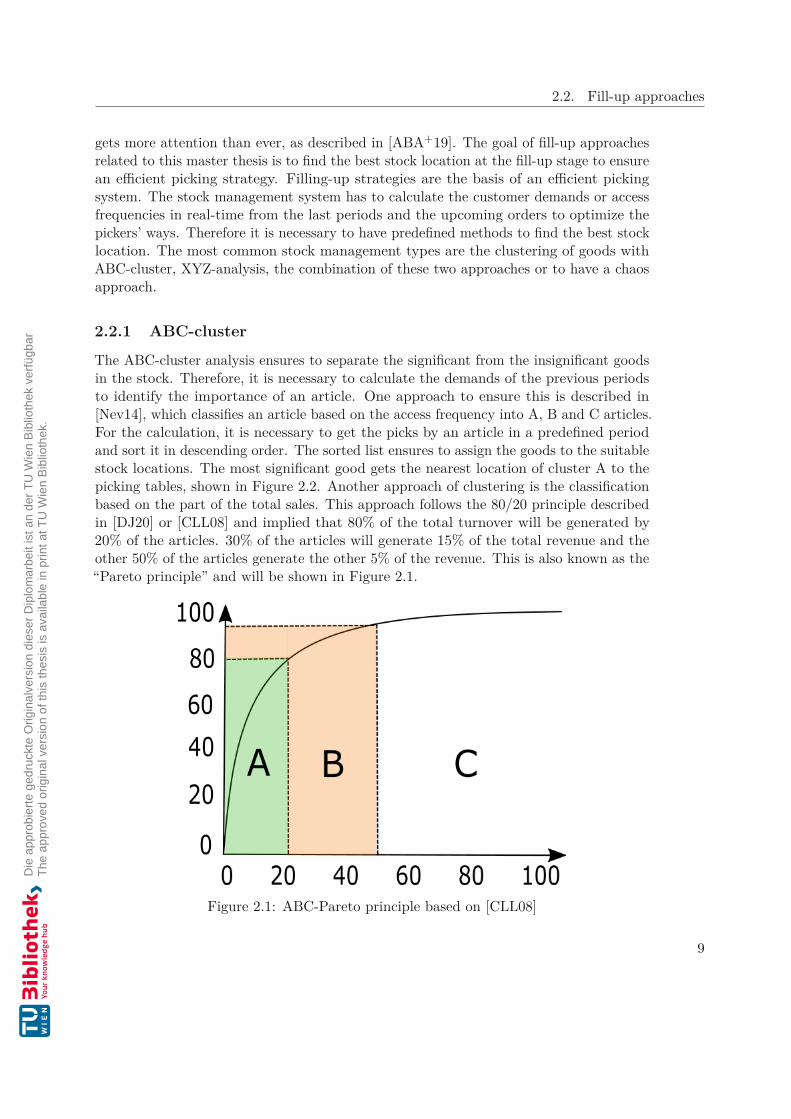
The ABC-cluster analysis ensures to separate the significant from the insignificant goodsin the stock. Therefore, it is necessary to calculate the demands of the previous periodsto identify the importance of an article. One approach to ensure this is described in[Nev14], which classifies an article based on the access frequency into A, B and C articles.For the calculation, it is necessary to get the picks by an article in a predefined periodand sort it in descending order. The sorted list ensures to assign the goods to the suitablestock locations. The most significant good gets the nearest location of cluster A to thepicking tables, shown in Figure 2.2. Another approach of clustering is the classificationbased on the part of the total sales. This approach follows the 80/20 principle describedin [DJ20] or [CLL08] and implied that 80% of the total turnover will be generated by20% of the articles. 30% of the articles will generate 15% of the total revenue and theother 50% of the articles generate the other 5% of the revenue. This is also known as the“Pareto principle” and will be shown in Figure 2.1.
Figure 2.1: ABC-Pareto principle based on [CLL08]
9

2. Related Work
No matter which clustering approach will be used, the specification of a class will bethe same. Cluster A has a high, B has a moderate and C has a low access frequency inthe stock. Articles within class A should be next to the packing table, B in the nextsector and C can be far away from the packing table. This methodology is shown inFigure 2.2. For the calculation of the thresholds, different approaches are available. It ispossible to set fixed thresholds to fill the classes, but then there may be a non-uniformeddistribution through the classifications. The better approach is to cut the calculatedvalues into three pieces to ensure uniform distribution.Inside of one cluster, it is possible to calculate an ABC-cluster again. Defining moreclassifications ensures a more precise definition of the stock location for one article.Groups like AA, AB, BA, ... are possible in that case.
Figure 2.2: ABC-clustering at a stock described in [Nev14]
2.2.2 XYZ-analysisAnother clustering method is the XYZ-analysis [Nev14]. The difference to the ABC-clustering is that the XYZ-analysis defines the prediction accuracy. In the case of acompany in the food market industry, the standard deviation of the sales contractsof the last period will be taken into account. Based on the deviation, the article canbe classified into X, Y or Z. This variability of the different goods, as described in[ABA+19], should handle the stock location of a good. Different circumstances definewhether an article has high, moderate or low variability. There are “seasonal fluctuation,
10

2.2. Fill-up approaches
trends, economic factors” [ABA+19], which influence the prediction accuracy. For thecalculation, predefined properties can be taken into account, which will influence theprediction accuracy. Parameters for the food market industry can be:
• demand in previous periods (e.g., the demand of this good in the same month asone year before)
• demand for the next days/weeks (calculated out of the open orders)
• product turnover ratio
• worth of orders from previous periods (higher earnings of one good has higherpriority for the company)
Based on this data, an article can be classified in one of the three classes X, Y or Z. Thecluster X has a high, Y has a moderate and Z has a low prediction accuracy. An articlewill start in class Z when launching the article. Based on the number of sales or stockturnover ratio, the article can raise its classification to Y or X.There are different ways to create the classification with the calculated goods. It ispossible to create fixed thresholds that define the classes. As default, the thresholds area standard deviation under 25% for a X article, between 25 and 50 percent for an Yarticle and over 50 percent for a Z article. The disadvantage of this strategy is that afixed threshold can lead to a inhomogeneous distribution across the different classes.
2.2.3 Combination ABC-XYZ-analysisIt is also possible to combine the ABC-clustering and the XYZ-analysis [Nev14]. Thiscombination ensures that the goods have the best stock location regarding access frequencyand prediction accuracy. The results of this strategy bring a two-dimensional classificationlike AZ, BY and so on. With that classification, it is possible to sort it regardingsignificance. Because the result is two-dimensional, a stock manager has to decide whichsort mechanism he/she applies for the stock. In some stocks, it is better to rate amoderate access frequency higher than a moderate prediction. Table 2.1 shows thedifferent results of the combination of ABC-clustering and XYZ-analysis.
Another critical factor is at which point in time the calculation of the classification will bedone. [SRHMB12] shows a big difference if performing the calculation once a year and foran extended period or calculating it more often. When calculating the classifications oncea year with a long period, only 60% of the articles will be in the right classes comparedto a more periodic calculation. The results of this study show that it is more efficient tocalculate the classification more often and for a predefined period like 12 months. Asalready mentioned, the number of calculations is also important. In [SRHMB12], theauthors reviewed 2 cases and compared whether the calculation should be done oncea year or more often. This results in the deviation of “class changes” over time. Case1 calculates the deviation by adding and subtracting one month to the base month of
11

2. Related Work
A B C
X high access frequencyhigh prediction accuracy
moderate access frequencyhigh prediction accuracy
low access frequencyhigh predictionaccuracy
Yhigh access frequencymoderate predictionaccuracy
moderate access frequencymoderate predictionaccuracy
low access frequencymoderate predictionaccuracy
Z high access frequencylow prediction accuracy
moderate access frequencylow prediction accuracy
low access frequencylow predictionaccuracy
Table 2.1: Results of combination of ABC-clustering and XYZ-analysis [Nev14]
one year. The result is a deviation of 4.24 percent. This means that a calculation byadding or subtracting one month to the base period of one year will change the classes byabout 4.24 percent. On the other hand, shifting the base period every month will changethe classes by 6.5 percent. The higher deviation will be preferable to have a dynamicclassification method. A low change rate of classification leads to a static inventory.Figure 2.3 from [SRHMB12] shows the two cases in detail.
Figure 2.3: Compare of classification frequencies [SRHMB12]
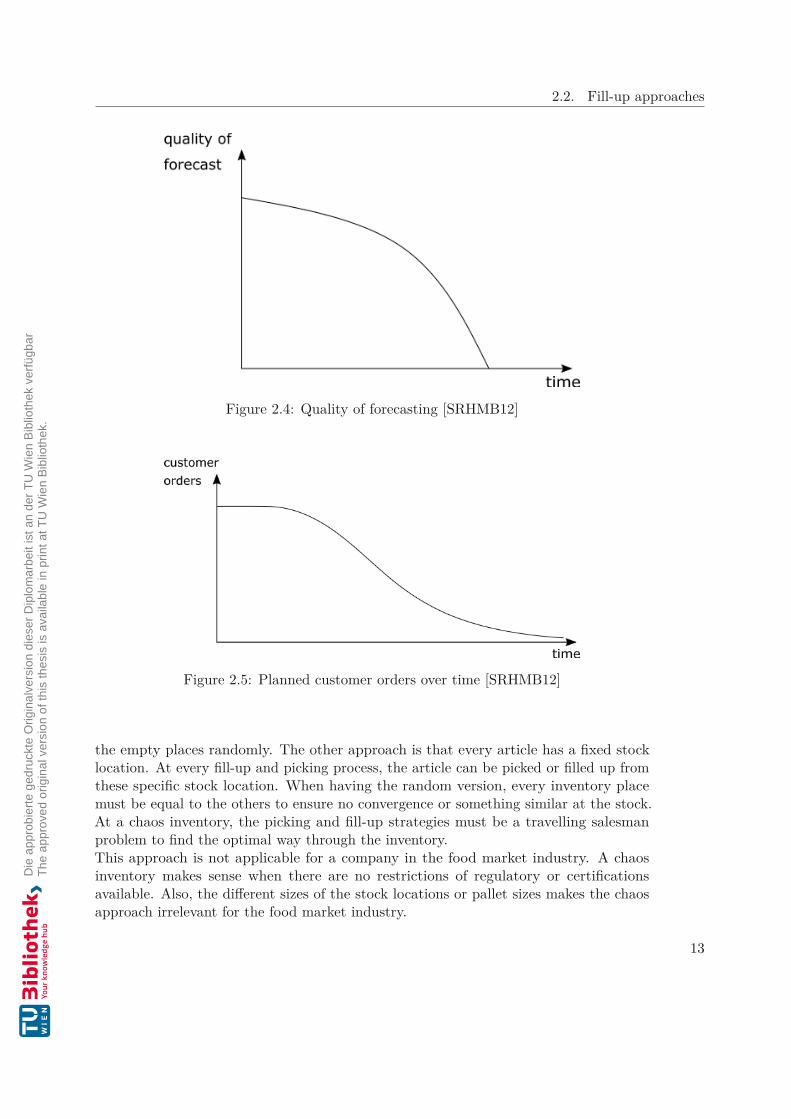
Also, the forecasting amounts of an article can be taken into account for the ABC-XYZanalysis. To create a meaningful forecast, the data of planned orders and growth rateshould be taken into account. It is necessary to update the calculation periodically to geta usable result. The quality of the forecast will decrease over time, as shown in Figure2.4. This is because the planned customer orders, which are part of the forecasting, willdecrease, as shown in Figure 2.5.
2.2.4 Chaos approachAnother strategy to find the optimal racking position is to create a chaos inventory[See05]. There are two different meanings of chaos inventory. First, an article can bestored at every stock location and the stock management system will choose one of
12
2.2. Fill-up approaches
Figure 2.4: Quality of forecasting [SRHMB12]
Figure 2.5: Planned customer orders over time [SRHMB12]
the empty places randomly. The other approach is that every article has a fixed stocklocation. At every fill-up and picking process, the article can be picked or filled up fromthese specific stock location. When having the random version, every inventory placemust be equal to the others to ensure no convergence or something similar at the stock.At a chaos inventory, the picking and fill-up strategies must be a travelling salesmanproblem to find the optimal way through the inventory.This approach is not applicable for a company in the food market industry. A chaosinventory makes sense when there are no restrictions of regulatory or certificationsavailable. Also, the different sizes of the stock locations or pallet sizes makes the chaosapproach irrelevant for the food market industry.
13
2. Related Work
2.3 Picking process approachesIn the VDI-Guideline 3590, a picking system is defined as “... the compilation of specificsubsets (articles) from a provided total quantity (assortment) on the basis of demandinformations (orders)” [Ber97]. This thesis will analyse the picking process within acompany in the food market industry and provide tools to manage it efficiently.Different picking process approaches exist, which depend mainly on the type of goods andthe article packaging sizes. The main difference is whether the pickers have a stacker tocollect the goods, walk through the inventory, collect the goods by hand (picker-to-parts)or whether there are picking robots available in the stock (parts-to-picker). There arethree other types of picking systems available, the ”picker-to-box“, ”picker-and-sort“ and”completely automated picking“ approaches [DMM09]. This thesis will concentrate on the”picker-to-parts“ approaches because this is the most common one in a small or middlesized company. The picker needs a stacker if he/she has a larger amount of goods whichis impossible to carry or if the stock location is too high to reach. The third approachis that the racks come to the pickers. Robots will achieve this. The advantage of thissystem is that robots are cheap and can work at all times. One big company which usesrobots for picking goods is Amazon7. Another differentiation of the picking process ispaperless or paper picking. At the paper picking process, the picker has to print allpicking lists with all positions of the defined orders. For paperless mode no paper isneeded and the positions will be shown on a device or will be applied by a voice fromthe stock management system. The following sections will describe the different pickingapproaches.
2.3.1 Pick-by-documentPick-by-document is a picking approach, where the picker needs a picking list [SZ16]. Atinstalled terminals, the pickers can print one (or more) picking lists with all positionsfor the specific orders. On those documents with all positions and racking positions thepicker can collect all of these orders.
2.3.2 Pick-by-voiceWith this approach, every picker has a headset to ensure the communication between thepicker and the picking system [SZ16]. The stock management system leads the pickerfrom stock place to stock place. An advantage of this is that the pickers do not haveany scanners or other things in their hands. They can work with both hands to pick thegoods. The picker confirms the withdrawal by talking to the system. For this approach,the stock management system must be extended by speech recognition software anda pick-by-voice software component. Another advantage of this approach is that thenumber of pickers per corridor is unimportant because every picker gets the order fromthe stock management system directly to the headset. A disadvantage of this approachis to train every picker to the pick-by-voice system.
7https://www.amazon.de/
14

2.3. Picking process approaches
2.3.3 Pick-by-lightThe stock management system leads the pickers with the pick-by-light [SZ16] approachto the next stock location by showing lights. Each stock location has a light at the front,followed by a small display for the amount which should be picked. There are usuallybuttons to confirm the picking process from this stock location so that the system knowswhen the next stock location light should be turned on. A disadvantage of this approachis that the number of pickers per corridor is essential so that the pickers do not getconfused by the lights of other pickers. This can be solved by different luminous colorsto increase efficiency. An advantage is that there is nearly no training needed.
2.3.4 Dynamic picking systemIn a dynamic picking system [GK08], the stock management system ensures that thegoods are brought to the picker automatically. Robots will achieve this. They bring partsof a rack directly to the picker. The picker takes the goods out of the boxes/racks andbrings the racks/goods with the robots or the flat conveyor back to the stock location.
2.3.5 Pick-by-terminalA fixed installed terminal at the stacker, tables or other picking vehicles will achieveTerminal-Picking8. A scanner helps the pickers to get the article numbers, serial numbersor batch numbers of the picked goods and ensures a fast and low error rate pickingapproach [SZ16].
2.3.6 Pick-by-scan (pick by MDE)Pick-by-scan is a paperless approach that will be handled by a mobile device (MDE)[RA18].This MDE replaces the picking list, so that the picker receives all relevant informationon the display of the device. MDE’s are, most of the time, hand-held computer orsomething similar like a watch with a more prominent display (hence sometimes calledpick-by-watch) and an integrated bar code scanner. The stock management system andthe device are connected and show the picker step by step all positions from the givenorder(s). Confirmed by the scan of the goods bar-code, the stock management systemhas an overview whether the picker is at the right stock and picks the right good.
2.3.7 Pick-by-pointThe pick-by-point approach9 is a new way to collect goods from the warehouse. Thisapproach was developed by LUCA GmbH10 and is a paperless picking system. At thePick-by-Point approach, the communication between the stock management system andthe picker is handled by a laser. At every corridor, a laser is installed and it shows the
8https://logistikknowhow.com/bestandsverwaltung/pick-by-terminal/9https://logistikknowhow.com/bestandsverwaltung/pick-by-point/
10http://www.luca.eu/
15

2. Related Work
Advantage Disadvantage
Pick-by-document + also available if system crashes+ cheap
- high failure rate- slow if it isn’t optimized- paper and printing costs
Pick-by-voice
+ fast+ nearly no failures+ many pickers at the same time
possible
- training of pickers- high initial costs- training of system
Pick-by-light + no training needed - every picker needsown corridor
Dynamic pickingsystem
+ fast+ no failures+ distance between corridors can
be minimized+ high picking rate+ ergonomic workplace
- dependend oninternet connection andsystem availability
- high initial costs- low flexibility
Pick-by-terminal + low failure rate+ dynamic stock taking possible
- low picking rate- training of pickers- language barrier can lead
to failures- initial costs
Pick-by-scan(MDE)
+ real time communicationwith system
+ no idle times+ low failure rate+ optimization possible
- not "hands-free"- unreadable or soiled
bar-codes can betime consuming
- training of pickers
Pick-by-point+ low failure rate+ high picking rate+ dynamic stock taking possible
- high initial costs- high maintenance costs
Table 2.2: Overview of Advantage and Disadvantage of different picking approaches[tHSB11]
next stock location by tracing a laser pointer at the next stock location. To reduce thefailure rate, there can be sensors at the front of each stock location. If the picker takesgoods from the wrong stock place, he/she will get an acoustical signal or somethingsimilar.
2.3.8 Comparison between this approaches
Table 2.2 gives an overview of all picking approaches, which are described above anddescribes the advantages and disadvantages. In some stock management systems, it isreasonable to combine different strategies. One combination can be Pick-by-scan and
16

2.4. Order batching
Pick-by-Document. At this combination, the picker prints a picking list and collectsall positions of this list. When he/she arrives at the racking position, he/she can scanthe goods from the stock. The system can check if he/she has the right article andreduce the failure rate. Another advantage of this combination is that the system knowsthe approximately amount of the goods. It is important that the data on the stockmanagement system is as good as possible to start the right processes at the right pointin time.Nevertheless, miscounts of pickers cannot be excluded by this approach. The combinationof Pick-by-Scan and Pick-by-Document is also a cheap possibility. Only the acquisitionof scanners, training of the employees and integration in the software lead to costs.
2.4 Order batchingAt the picking process, a fundamental question is how to pick the goods from the stockin an optimal manner. This can be done in several different ways. At some point in time,this step must be optimized to handle all orders in a controlled way. The picking processis another big part that can be optimized in the stock. These changes can have a bigimpact on the order processing rate.Most of the small and middle sized companies pick their goods order by order. Thiscan be optimized by batching several orders together. “Some researchers resort to orderbatching to minimize the order-picking travel distance. With order batching, orders arebatched together, and their items are picked in the same picking trip. Order batchingcan reduce the order-picking travel distance if orders with similar picking locations canbe picked together.” [HT06] This means that the overall travelling time for every pickerwill be reduced by defining which orders should be picked in one picking process.Every order batching approach, which will be described in the following sections, in thefirst step defines a seed order. Based on this seed order, other similar orders will begrouped together to one picking order. This can be done by different approaches, whichwill be described in the following sections.
2.4.1 Seed orderThe seed order is the basis to group orders together. When selecting this specific order,it is important to think about how the company works and whether there is a promise tothe customer that must be fulfilled. The authors of the paper [HT06] described differentapproaches to select a seed order. Only the approaches which apply to a company inthe food market industry will be described in this thesis. Approaches to select the seedorders are:
• Random Rule: The seed order will be selected randomly out of all open orders inthe system.
• Smallest/greatest number of picking locations (SNPL/GNPL): These two ap-proaches calculate the smallest or greatest number of order picking locations.
17

2. Related Work
The idea for the smallest number of picking locations is that there are many similarorders which can be grouped to this order. In the next step, the approach selectsthe accompanying orders, which should be picked together. With the approach toselect the greatest number of picking locations, a wide variety of stock locationsover the hall will be preferred. It is difficult to find similar orders for such orders.Therefore, this type of order will be selected as a basis for other orders. A possibleapproach to find additional orders can be to minimize the way between the articlesof the seed order and the other orders.
• Smallest/greatest number of picking aisles (SNPA/GNPA): This is a similar ap-proach to the smallest or greatest number of picking locations. The number ofaisles where the goods are stored must be low or high for the same reasons as inthe approach before.
All other selection approaches can not be applied in the food market industry becauseone good will be stored most of the time at one stock location. The other approaches arerelevant if the investigated good can be stored at different stock locations simultaneously.
2.4.2 Order batching approachesBased on the seed order, the system must calculate specific accompanying orders. Thismust be done by specific rules. In the literature, some different approaches to select theseorders are available. The authors of [HT06] described the different approaches.
• Random selection: Out of all open sales contracts in the system, random contractswill be picked and grouped together with the seed order.
• Smallest number of additional picking locations (SNAPL): This approach selects,based on the seed order, just these orders, which minimize the additional pickinglocations. This means that every additional picking location, based on the seedorder, has a negative impact on the calculation. In the best case, the seed orderand the accompanying order have the same picking locations.
• Greatest number of identical picking locations (GNIPL): Only these orders wherethe amount of identical stock loactions is high will be taken. With this approach, adifferent number of articles per order does not depend.
• Greatest picking-location similarity ratio (GPLSR): With this approach the ratio ofidentical stock locations on the total number of picking locations will be calculated.The number of identical stock locations will be divided by the total number ofpicking locations which the picker must visit when he adds this investigated orderto the picking process.
• Greatest picking-location covering ratio (GPLCR): The covering ratio defines theratio of the identical stock locations of the seed and additional order to the numberof picking locations of the seed order.
18

2.5. Structure of the stock
2.5 Structure of the stockWhen having a batch order, it is necessary to look at the different structures of a stock.Based on physical and the company’s restrictions, there are different types of stocksavailable. In Figure 2.6, all different stock types are shown. The construction type of thestock is a company decision. Important questions of the structure of a warehouse are:
• Is the aile accessible on both sides?
• Is there any direction given by the stock management?
• Is an aisle available for pickers and machines?
• Will the numbering start with the same numbers at the different aisles?
• Is it allowed and possible that more than one person is in an aisle at a time?
The characteristic of the different types which are shown in Figure 2.6 are:
• Type 1: Within one aisle, the direction can be changed. The numbering issimultaneously on both sides of the aisle.
• Type 2: In this type, every aisle has a direction. Every person or machine mustwalk in this predefined direction. The direction in the aisles and the numbering ofthe stock locations in the different aisles alternate.
• Type 3: The direction within one aisle is predefined and does not alternate betweenthe different aisles. Also, the numbering does not alternate between the differentaisles.
• Type 4: In this type, the aisles do not have any predefined direction. Thenumbering of the stock locations stays the same between the different aisles.
• Type 5: This type is similar to type 2, but the numbering stays the same betweenthe different aisles.
Type 1 and 4 are also possible to have just one entrance and exit per aisle. This leads tomore storage areas. At types 2, 3 and 5, it is possible to create alleyways just available forone person or machine at once. In addition, the impact on the probability of having anaccident should be taken into account. A small aisle available for stackers and picker withno direction has a higher probability of an accident than a wider aisle with a predefineddirection.
The type of stock has an impact on the approach to find the best path through the stock.Different approaches will be shown in the following section.
19

2. Related Work
(a) Type 1 (b) Type 2
(c) Type 3 (d) Type 4
(e) Type 5
Figure 2.6: Different types stock structures defined by the author of this thesis
20

2.6. Strategies to find a path
2.6 Strategies to find a pathFor the picking process, it is necessary to guide the picking person through the inventoryin an optimal manner. Therefore, different approaches to handle this can be applied. Tofind the optimal way through the inventory can be seen as travelling-salesman problem(TSP). The goal of a travelling-salesman problem is to find a way to visit all cities [IJ14].In the food market industry, every stock location can be seen as a city defined in thetravelling-salesman problem definition. The picker person gets a set of articles at aspecific stock location and has to find an optimal way to pick all goods. All algorithms tofind the optimal way with the travelling-salesman problem are too complex and can notbe adapted for the stock management system. The picker would need several minutesto find the optimal way. Therefore, the way through the stock will be calculated bydifferent heuristics. A heuristic will find a way through the stock but may not be optimal[ADO09]. The goal of a heuristic is to minimize the average distance a picker will go inthe stock. An advantage of a heuristic is that the strategy is predefined and will be doneat every process. Calculating a heuristic is also not that complex as a travelling-salesmanproblem. This is important so that no time will be wasted when waiting for a routethrough the stock.A heuristic for a stock management system will be classified as a one or two-dimensionalheuristic. One-dimensional heuristics are given when the picker moves vertical or hori-zontal. In a two-dimensional heuristic, the picker can move vertical and horizontal. Fora two-dimensional approach, a picking device will be needed. For a middle sized foodmarket company, just the one-dimensional person-to-goods approach will be suitablewhen having a big amount of picking actions.There are five heuristics to find an optimal way through the stock in a good executiontime.
• S-shape strategy without skipping
• S-shape strategy with skipping
• Return method without repetition
• Return method with repetition
• Mid-point heuristic
All of these heuristics can be the optimal one. The best heuristic can be chosen for everystock management system based on the fill-up strategy and inventory structure. Thesesix heuristics will be described in detail in the following sections.
2.6.1 S-shape strategy without skippingThe “S-shape without skipping” is the easiest way to find a way through the stock andreaching all goods on the route. At this approach, the picker will walk through all
21

2. Related Work
corridors even if there is no article to pick in the specific hallway. At every front sideof a corridor, the picker has to change the hallway. After finishing the picking process,the picker has to return to the packing tables to start the next action. The best useof this approach is when every picking process has a high amount of different goods.When having a long picking list, there is a high probability of having to walk through allcorridors in a picking process. Another advantage is to avoid accidents. In a big inventory,there are stackers and pickers on the way. When having a predefined direction, theprobability of having accidents where pickers and stackers are involved can be decreased.It is also a big advantage to simplify the routing strategy when training new employees.The training effort for new employees will be minimal for this strategy.A big disadvantage of this method is that employees have to walk unnecessary ways whenthere is no article in a specific corridor. The S-shape strategy without skipping will beshown in Figure 2.7. All stock locations which store an article that must be picked inthe current picking process are highlighted in red.
Figure 2.7: S-shape strategy without skipping [Nev14]
2.6.2 S-shape strategy with skippingThe “S-shape strategy with skipping” optimizes the “S-shape strategy without skipping”by allowing to skip corridors where no article needs to be picked. In this heuristic,every picker has to walk through the corridors in an S-shape. This increases the pickingperformance because unnecessary distances will be avoided in this heuristic. The avoidanceof accidents between stacker and picker will not be given in this approach because thedirection of how people are allowed to enter the corridor can change. Therefore, the
22

2.6. Strategies to find a path
width of the corridor must be sufficient for more than one picker or stacker. Figure 2.8shows how to walk through the stock in the S-shape with a skipping strategy.
Figure 2.8: S-shape strategy with skipping [Nev14]
2.6.3 Return method without repetitionAnother common heuristic is the “return method without repetition”. At this method,the picker can only walk on one side of the corridor. If an article is in a corridor, thepicker walks to the stock location, picks the good and returns to the face side. The pickerhas to walk into each corridor that holds an article and leaves the corridor where he/shewalked into it. An advantage of the return method is that it is unnecessary to plan aspace for changing the corridors at both sides. However, there must be enough spacefor several picker doing their jobs simultaneously. Otherwise, the pickers, which use thecorridor simultaneously, will block each other. The space-saving advantage will be facedwith the longer distance of the picker. The picker has to walk to the very last stocklocation for just one article in the worst case scenario. This can be prevented by takingthe access frequencies of the articles into account when filling up the stock locations.Figure 2.10 shows, how this method works.
2.6.4 Return method with repetitionThe second specification of the return method is the “return method with repetition”.This means that a picker is allowed to enter the corridor once per article. If there is asecond good in this corridor, the picker has to return to the hallway’s face side and enter
23

2. Related Work
Figure 2.9: The return method without repetition [Nev14]
the corridor again. The repetition approach can be applied when there is not enoughspace to enter a corridor with a picking device. The advantage of this approach is to savemore space than in the approach without repetition. There is no need to have a space tochange the corridor and it is unnecessary to increase the width of a corridor for enteringwith a picking device. This method faces the disadvantage of the longer distance that apicker has to walk through the stock. This disadvantage can be reduced by decreasingthe picking frequency per corridor and adding a suitable allocation of stock locations. InFigure 2.10 a use case will be shown when applying the “return with repetition” approach.
2.6.5 Mid-point heuristicA special “return method” is the “mid-point heuristic”. This means that every corridorwill be cut into halves. The picker is now allowed to pick just these goods from the firsthalf of the corridor where he/she entered the hallway. When the person picked all goodsfrom the first half of the corridor, he/she changes to the backside of the corridor andstarts to pick again only the article from the first half of the corridor. The picker has toenter just these corridors where articles for picking are available. When applying thismethod, the access frequency of each article has to be taken into account when fillingup the stock locations. This means that articles with a high access frequency should bestocked next to the face sides of the corridors to avoid unnecessary walking distances.It makes sense if the saved distance per corridor is bigger than the distance to changefrom the front to the backside of a corridor. The “mid-point heuristic” will be shown inFigure 2.11.
24

2.6. Strategies to find a path
Figure 2.10: The return method with repetition [Nev14]
Figure 2.11: The mid-point heuristic [Nev14]
25


CHAPTER 3Implementation
3.1 Interview summaryThe interviews were held with the responsible stock managers from Sonnentor Kräuter-handels GmbH 5, Kastner GroßhandelsgesmbH 5 and Kiennast LebensmittelgroßhandelsGmbH 5. These companies were chosen because they are all in the food market industry,have about 200 to 300 employees and are situated in Lower Austria. Companies from thefood market industry were taken into account because food has more and strict require-ments regarding stock management. The summary is split into three parts: properties ofthe articles, the structure of the stock and the workflow inside the stock management. InSection 5 the whole interviews of all companies can be read.
3.1.1 Properties of the articlesThis question deals with the articles and how they have to be stocked. Some restrictionscome from food regulations, whereas others come from different certifications. The threecompanies trade mainly food so the products can be cooled, have a strong smell, acceptthe aroma from other goods, easily perishable and some articles should not be stacked orare touch-sensitive. A small part of their goods are poisonous or acidly. These articlesare for example cleaning powder or laundry detergent. They will be stored in a separatepart of the stock.The different types of goods need different conditions. A temperature-dependent productmust be stored in a hall with an appropriate temperature level. The products in thesetemperature levels can be classified as follows:
• 20° C: The dry assortment will be stored at this temperature level. Dry assortmentmeans all products that are packed or in another way preserved like spicery, cansor drinks.
27

3. Implementation
• 15° C: At this temperature level, exotic fruits and bananas will be stored.
• 11° C: In stocks with about 11° Celsius, there are fruits and vegetables.
• 4° C: Dairy products like milk, cheese or yogurt will be stored at about 4° Celsius.
• 2° C: Leafy vegetables are stored at this temperature level. This type of goodsneeds a humidity of about 99% in addition.
• 0° C: Meat, bacon, sausages and other raw products will be stored.
• -21° C: This is the lowest temperature level. All frozen products will be stored atthis temperature level.
Not only the temperature is essential. The packages can also influence the articles. Twoof the three companies interviewed have international customers, so another attribute ofan article is the language of the label. One company separates the goods with differentlanguages as independent articles with an individual stock location. The other companystores these articles without a label. When a customer buys this article in a differentlanguage, the package will be labeled on demand. This approach creates another challengeto know the expiration date and the batch number of these goods precisely since they donot have a label.The packaging size of an article is another critical characteristic. Most of the stockmanagement systems did not know this type of information. The size and weight of apackaging unit are essential whenever an article should not be stacked. All companiesstated that it is crucial to pick the products based on the weight of the goods descendingto deliver entire articles.Another specialty is individual goods. An individual good is a product that is not instock but can be ordered by the customer. Individual goods are for example vouchers,goods with a personal text or “providers”. A “provider” is a good that can be ordered bya customer, but it is not in stock. These goods will be ordered from individual suppliersand delivered to the customers after a few days. These goods will not be ordered thatoften, so it is not profitable to have it in stock. “Providers” are for example rare cheese,a unique whiskey or an exquisite bottle of wine.
3.1.2 Structure of the stockThis section gives an overview of the structure and the organization of the stocks at thecompanies interviewed.The interviewed companies Sonnentor, Kastner and Kiennast have comparable stockenvironments. Kiennast has one logistic center in Gars am Kamp, where they handle allorders. Sonnentor has its center in Sprögnitz and an external warehouse in Waldhausen,about five kilometres away. This external warehouse has no independent stock manage-ment system. The system from Sprögnitz has to involve the goods from this externalwarehouse in the calculations. Every day, there are just a few transportations from
28

3.1. Interview summary
Waldhausen to Sprögnitz. The stock management system has to take this circumstanceinto consideration. Kastner has its logistic centre in Zwettl and six other warehousesin Vienna (North and South), Eisenstadt, Jennersdorf, Krems and Amstetten. Allwarehouses work independently with their own stock management systems. The nextwarehouse or the warehouse with a specific truck route handles the orders from thecustomers. At Kastner, the external warehouses do not have any effect on the stockmanagement system because of their independence.Every warehouse from the three companies interviewed has nearly the same structureand differentiate only about the dimension. All warehouses have shelves, a separate placefor packing and labelling and a place for outgoing goods. The most important types ofshelves are flow storage, pallet shelves, high-level racks and small part warehouses. Alldifferent goods can be stored on one of these shelves.The fresh meat and things that are easily perishable are stored in flow storage. The flowrack at the picking warehouse at Sonnentor can be seen in Figure 3.1. Articles will be putin at the backside of the flow rack and taken out at the front. This method of operationguarantees the FIFO (first-in-first-out) principle. Small part warehouses store all articles
Figure 3.1: Flow rack at the picking warehouse at Sonnentor
sold bit by bit and that are too small to store them on a pallet shelf. Perishable goodswith a high turnover ratio like fruits and vegetables are stored on a pallet shelf. Everyinterviewed company has high-level pallet racks with up to 6 levels which can be seen in
29

3. Implementation
Figure 3.2. All articles that have a high turnover but are not perishable will be stored
Figure 3.2: High level pallet racks at Sonnentor
on this type of shelf. The dry assortment like spicery and packed goods are stored inhigh-level racks. Figure 3.3 shows the part at the main warehouse of Sonnentor. Thereare some more warehouses, but these are for raw materials and production only. Thewarehouse shown is more interesting for fill-up and picking actions. There are differentcolours in this figure, which the different parts of these warehouses. The green part isthe packaging area where all goods come together and will be packed for every customer.Yellow is for small parts which can be sold additionally to the food, which can be shakeror teapots. The red part is the picking-warehouse for B2C customers. This part of thewarehouse should hold the amount for the next few days in the stock. The way for thepickers will be short, and there will be flow racks for an optimized picking process. Theblue part is the main part where the articles will be stored on pallet racks. The articlespicked from this part will be picked for B2B customers only or will be filled up to thepicking warehouse (red).The organization of corridors and stock numbers are also comparable at the interviewedcompanies. An overview of the different types will be given in Chapter 3.2.1. These typesof organizations are important to handle the different ways for the picker and fill-up
30

3.1. Interview summary
persons. Therefore, the type of the stock organization will be a parameter for calculatingof the shortest way for the involved people. The parameter will be a global setting foreach company because the organization of the stock will not change that fast.In the different researched companies, stock numbers are just a way to help the pickingor fill-up persons to orientate. These numbers are important for the organization of thestock management system, but are useless for the software. In the system, every rackingposition should get a predefined order number. This internal order number helps thesystem to calculate an optimal way through the stock.
Figure 3.3: Overview of the main Warehouse of Sonnentor
3.1.3 Stock management workflowThe following section gives an overview of the workflow within the stock management.A workflow within stock management will be influenced by the customers, how theycan order the goods, the properties of the goods and which articles they have, theworking time, how they pick the goods and when and how they get the goods from theirsuppliers. All these specialties can influence the companies, how they work and theoptimization potential of the stock management system. How they get the goods andhow they transport the articles to the customers will not be handled within this thesis.To differentiate how they get the orders from the customers will be simplified to groupcustomers into Business to Customer (B2C) and Business to Business (B2B).
Customers
Sonnentor works different in comparison to Kastner and Kiennast regarding their cus-tomers. Sonnentor has its franchise shops and other companies (Business to Business -B2B) and a significant amount of individual customers (Business to Customer - B2C).This leads to a different workflow within the stock processes. Kastner and Kiennastonly have B2B customers who are gastronomy, gas stations, shops and other types ofinstitutions. The B2B orders contain, most of the time, a more significant amount ofgoods than at Sonnentor, so there is no need to group orders at Kastner and Kiennast
31

3. Implementation
most of the time. If there are orders with a high amount of goods, picking order by ordermay be a better approach.The companies have similar ways to get customer orders. All three have their webshopfor their clients. At Kastner and Kiennast, the regular customers also have electricaldevices like “Bestfriend” or other MDA (mobile data acquisition) devices directly linkedto the company. How to handle the different amounts of goods that have to be on stockis different through the companies. At Sonnentor, they have to stock the raw materialfrom the farmers. This raw material will be taken in the production hall to produceend products. Most of the goods are seasonal, so they have to plan how much theyneed and how much they can process. Their plan is based on the last periods addedwith a specific amount to handle all open orders throughout the year. At Kastner, theycollect all their customer orders throughout the day, and at midday they order the goodsfrom their suppliers. When the good is on stock or its suppliers have the good on stock,the customer will receive the products the next day. If the product is a “provider”, thearticle will arrive after a few days. Kiennast also wants to order the goods from theirsuppliers based on open orders. They also add events to their calculations. A specialevent can be an exhibition where the orders will increase for a short period of time. Allcompanies interviewed stated that the calculation of the demand for the products is notoptimal. They have their open orders for the next days, weeks or months, but they donot know the amount from the last years. At Kiennast they would have to collect alle-mails from the last years to know the amount of goods ordered from the last exhibitions.The responsible employees in these companies indicate that this task takes much timeand is based on personal experience.
Articles
The different articles’ characteristics mentioned above lead the companies to differentiatethe workflow of their stock management. Different languages lead to two differentapproaches. The first possibility is to store them in a separate stock location. When thecustomer orders the product, the stock management system must know where the pickercan find the article in the correct language. The second approach is to store the goodswithout a label at one stock location. This approach leads to new challenges in accessingbatch numbers and other essential information like an expiration date. The informationand the additional time for labelling will depend on the workflow.Not only common goods will be sold by the companies. When an order with an individualgood arrives, the product has to be ordered from their suppliers, be printed if it is avoucher or labelled with the unique text. The customer gets information that his orderhas an individual good, which takes a few days longer than usual. At the fill-up process,the special good gets its stock location and will be stored in the system. When thepicker gets the picking task, the good will be shown up at this stock location. The stockmanagement system has to release the picking process after the individual good is on thestock.At every company, the articles have a standard stock location. This means that everyarticle will be stored at the same location in the stock every time. The system knows,
32

3.1. Interview summary
based on the article master data, the stock location. Every picking and fill-up process willtake the good from this location. If a new good comes on stock, the location will be takenbased on the “chaos approach”. The next free stock location will be used for the newarticle. There is no intelligent calculation behind the allocation of the stock locations. AtKiennast, one pallet shelf can contain more than one article with the same stock locationnumber. The picking person has to choose the right article for this order. This can onlybe on a pallet shelf because every product is available for the picker. At Sonnentor andKastner, every article is at one specific stock location with a unique number. So at thesecompanies, one pallet shelf can be more than one stock location.
Picking
All three companies merge two different picking types, which are the “pick-by-terminal”and “pick-by-document” approaches. They need the document approach because theirstock management systems do not have the intelligence to sort the open positions from theorder in the right way. The picker prints this document and acts with his/her experienceto pick the heavy goods first and the light ones last and find the fastest way through thestock. At the companies, the corridors are available for all people and machines. Pickersand stackers use the same corridors. Sonnentor and Kastner experiment with defineddriving directions to avoid accidents. This has to be done because pickers use pickingvehicles, and fill-up persons use a stacker. An accident can cause problems for peopleand companies.One important thing at the three companies interviewed is that a new picking processcan be needed if the picker detects that not enough products are available. This canhappen if a picker miscounts at a picking process, but the stock management systemthinks that he/she takes the right amount.
Working time
The three companies Sonnentor, Kastner and Kiennast, have different approaches regard-ing working hours. Kastner has shift work with weekends. Sonnentor and Kiennast havea regular working time from 9 am until 5 pm. The work ends when all orders have beenpicked, packed and are ready for delivery.Kiennast and Kastner deliver the roll containers with trucks, whereas Sonnentor sendsits parcels with a delivery operator. The delivery from the suppliers is different betweenthese three companies too. Kastner and Kiennast try to get the goods in the morning.At Sonnentor, this is a bit difficult because they also work with regional farmers with nopossibility to store the goods in the right way. Therefore, the farmer delivers the goodsa whole day after harvesting. This information is essential to identify the peaks of thefill-up and picking process. All three companies indicate that mondays and tuesdays areweak regarding customer orders.The companies also try to increase the performance of their employees with a bonussystem. These bonus systems also differentiate through these companies, but all systemsare based on the time they need to pick one good.
33

3. Implementation
CertificatesDifferent certificates also have an impact on stock management systems. The mostimportant certificates for the food market industry and the three interviewed companiesare:
• “IFS Logistics is a Standard for auditing companies whose activities are logisticsoriented for food and non-food products, such as transport, storage, loading/un-loading. It applies to all types of transport: delivery by road, rail, ship or plane;frozen/refrigerated products or stable ambient products (different states of matter:liquid, solid or gas). This standard also applies to (un-)freezing service providersas well as for logistics companies using service providers for their transport andstorage activities1”.
• The MSC (Marine Stewardship Council) is a certificate for seafood. This boardof control ensures and audits along the supply chain, from “ocean to plate”. TheMSC label of a product guarantee, “that companies just purchase certified productsfrom certified suppliers”, “certified products are clearly identifiable”, “certifiedproducts are separated from non-certified”, “certified products must be traceableand recorded” and “the company must have a management system”2.
• ABG (Austria Bio Garantie) is a board of control to audit companies and enforcethe Austrian bio standard3.
• Another important board of control in Austria is Demeter. This certificate ensuresthat “all goods, raw materials and ingredients of different quality levels (Demeter,Conversion to Demeter, organic and conventional) must be separated at all stepsof the supply chain (storage, transport and processing)4”.
Summary
Although the companies have similarities regarding goods, customers and stock man-agement, these similarities will influence the workflow within the stock management.The lawgiver or certificates sometimes predefine the conditions of articles so they can beseen as global parameters. These settings will not be changed that often and are fixedfor the specific articles. A big problem is the intelligence of their IT-systems. On theone hand, they are satisfied because the managers can see the turnover and the stockamounts of every good in real-time, whereas on the other hand, the employees see roomfor improvement of the daily workflow. Managers see their IT-systems in the way to
1https://www.ifs-certification.com/index.php/en/standards/265-ifs-logistics-en
2https://www.msc.org/standards-and-certification/chain-of-custody-standard3http://www.abg.at/bestimmungen-zu-bio/gesetzliche-bestimmungen-zu-bio/4https://www.demeter.de/sites/default/files/richtlinien/richtlinien_gesamt.
34

3.2. Defining important parameters
“never change a running system”. Employees want more support from the system. Partsof the picking and fill-up process are based on the long experience of every employee toguarantee the intactness of the goods. This leads to mistakes whenever a new employeestarts his/her job. So it is a challenge to give the managers the correct amounts andstock locations of their goods. For the employees, it is important to simplify and improvethe stock management system to reduce the period of vocational adjustment.
3.2 Defining important parametersBased on the interviews in Chapter 3.1, it is possible to define parameters and constraintswhich should be fulfilled at the picking and fill-up task. These constraints can be splitinto global parameters and mandatory constraints for the picking and fill-up process.Global parameters are facts of a company that will not change very often. An example ofa global parameter can be the structure of stock, working time per shift or the number ofpersons per shift. Mandatory constraints are identified in all three interviewed companies.These types of constraints have to be fulfilled for the company given. An example forsuch a constraint can be the temperature of a cooled good or what types of articles canbe stored next to each other. These constraints are given by regulations or certificatesmost of the time. In the following sections, the identified parameters and constraints willbe defined for the picking and fill-up process.
3.2.1 Global parametersAs already mentioned, there are parameters that will be valid for the whole company.These parameters are predefined and will not change too often. A change of one of theseparameters means a significant change in the structure of the stock management andworkflow. Every parameter in this list has a significant impact on the different processesof the stock management system. Global parameters that will be handled in this thesisare:
• Way through stock: The way through the stock is essential for calculating the fastestway through the corridors. Some companies started experiments with predefinedways through the stock to avoid accidents between persons and stackers. Most ofthe time, the companies give up the experiments because of inefficiency. Pickingand fill-up persons were not supported by the system to find the fastest way basedon these predefined ways. The way through the stock is described in Section 3.2.1and shown with arrows in Figures 3.4 and 3.5.
• Numbering of stock locations: This parameter is connected to the way throughthe stock. The parameter means if every corridor starts with the number one or ifthe corridors alternate with the starting numbers through the aisles. The differentapproaches are described in Section 3.2.1 and the constant and alternating numbersare shown in Figures 3.4 and 3.5. This parameter is important for calculations inthe background of the system to find the fastest way.
35

3. Implementation
• External warehouse available: This information is important to know if the systemhas to involve an external warehouse. The external warehouse influences thecalculation if the good is not available in the main warehouse. A picking processwill not be started until the goods are in the main warehouse. This leads to delaysin picking and fill-up processes. This feature is a true or false information and isavailable in the attributes of an article. To have similar information on two differentplaces is in that case just for upcoming performance reasons.
• Numbers of persons per shift: The number of persons per shift is important forupcoming steps. Calculations of stock locations, ways through corridors or collectionorders pollute the server. The upcoming step will be to increase the performance ofthe calculation. Preliminary calculations can achieve this. If the number of personsper shift is high, the system must save a higher number of calculated collectionorders and ways in advance. When a person asks for the next process, the systemcan take one of those already calculated steps.
• Working time: This parameter is also for saving resources. At night, there areseveral tasks for the servers. Server tasks in the night can be to create backups,restart or import/export data. For this reason, the servers should not be interruptedby calculations of ways or stock locations when nobody is working.
• Period of previous orders: This parameter identifies the time period for selectingthe previous orders. All orders with a specific article within the last year will beanalyzed. The current date minus one year will be used and a range of days givenin this parameter will be added.
Structure of stock
Based on the surveys, there are two models of stocks at the companies examined. Thestructure can be as shown in Figure 3.4, where the way through the stock is a wiggly line.Stock locations are numbered and alternate throughout the corridors. Figure 3.5 showsthe other approach. The whole stock has the same structure and every corridor has thesame numbered stock locations. This information has a big impact on the calculation ofcollection orders, the way through the stock and where to fill up the articles on the stockbased on a cluster.Not only the numbers of stock locations can alternate. Some companies define directionsof traffic. This approach is, on the one hand, safer for picking persons and stackers but,on the other hand, more time-consuming. The structure of the stock has a big effort ofcalculating ways through the stock to find the best way for the pickers. The two differentapproaches are shown with arrows in Figures 3.4 and 3.5.
Properties of a stock location
There is also some important information about every stock location needed. Based onthis information, the system can decide where the entry point of the stock location is
36
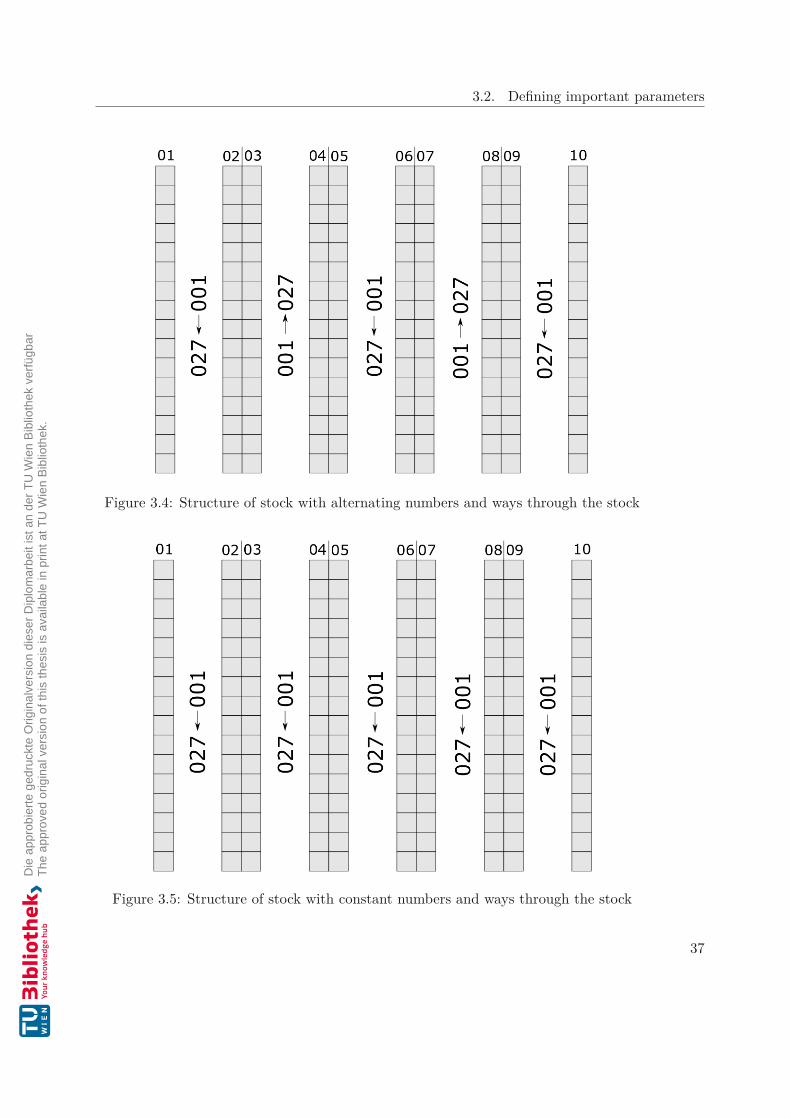
3.2. Defining important parameters
Figure 3.4: Structure of stock with alternating numbers and ways through the stock
Figure 3.5: Structure of stock with constant numbers and ways through the stock
37
3. Implementation
and which articles and can be stored in this specific store. The following information isessential:
• More articles allowed at one stock location: Within the interviewed companies,there are two types of stock locations allowed. Type 1 is to store one article at aspecific stock location. Type 2 allows storage of more than one article at a specificstock location. This makes sense whenever an article needs to be available in morethan one language.
• Type of stock (regarding customers): This is important to know because, at somecompanies, it makes a different for the picking process to pick for a B2B or B2Ccustomer. A B2B customer usually orders a bigger amount and wants the newestbatches of the stock. For a B2C customer, the batch is not that important, and theamount will be less. At Sonnentor, they differentiate between two types of stockareas. One for B2C and one for B2B customers. The B2C stock locations are nextto the packing tables. B2B orders will be handled from the main stock.
• Type of racking system: One of the most important information is the type ofracking system. The system has to know the best way to withdraw from and fill upa stock location. At a pallet rack, the fill-up and picking point is the same. At aflow rack, the fill-up person fills the article from the back side of the aisle and apicking person takes the good from the front side.
• Amounts: The maximum and minimum amounts of goods are important as well.The minimum amount defines at which amount a fill-up person has to restockthis specific article. The maximum amount defines the highest amount of articlesthat can be stored at this stock location. This characteristic can also be a volumeparameter for defining the capacity in a cubic meter. This is important wheneverthe stock location is filled with goods in bulk. Also, the actual stock amount isimportant to calculate the importance of the article to fill up or decides which stocklocation will be taken at the picking process.
• Locked stock: It can also happen that a batch needs to be locked. Therefore, it canalso be useful to lock a specific stock location. The system is not allowed to takearticles from this stock location. At the picking process, this type of store mustnot be shown until the lock is released from the quality management department.
Preparation of a stock location
Another important preliminary step is to define an order number of every single stocklocation which is needed for filling up or picking goods. This order number will be neededto calculate the shortest way through the stock. When defining the order numbers, it isnecessary for every stock manager to decide which stock location is reachable by personsor stackers. This is only needed if there are different types of fill-up or picking persons.In a middle sized company, there will be a stacker and a person working together in a
38

3.2. Defining important parameters
stock. The type of worker is important because the change from one type to anotherwill cost time. A person cannot reach the fourth level in a pallet rack. With the ordernumber, the stock management system can steer the worker in their specific level ofheights. Figures 3.6 and 3.7 show the assignment of sort order numbers. In Figure 3.6,the order numbers separate between the different types of workers. In the figures, everystock location has a unique name. This name is structured as followed (for example,10-04-01A):
• 10: Number of the warehouse if there are more than one available
• 04: Number of a corridor in the warehouse
• 01: Number of the racking position in the corridor
• A: Shows the level of height in the pallet rack
10-04-01A is the lowest stock location of the first pallet rack in corridor 4, located inwarehouse 10. Every corridor can have two different numbers if it is possible to accessboth sides of a pallet rack.Levels A and B are reachable for persons without technical support. Levels C to E areonly reachable by a stacker. The change of the number define the costs to reach a specificstock location. When a specific type of worker reaches more than one level, the ordernumbers will increase the costs by 10. If there is a change of worker type, the ordernumber will increase by 100,000. This ensures that a position of an order from Level Aor B finds another position of an order in Level A or B. For the picking or fill-up process,the minimal difference of the stock locations defines the way through the stock. Figure3.7 shows the assignment of the sort order numbers when no change of worker type isneeded. This can happen if in a specific part of the stock are just worker allowed. Fora middle sized company in this segment, Figure 3.6 will be the normal case of workingstructure. Another differentiation of the order numbers is if there is more than onewarehouse available. The way between the warehouses can also be separated in differentsteps. The costs will be higher for an external warehouse instead of a warehouse at thesame location. Figure 3.8 shows the costs between the different warehouses. In this case,the costs between the warehouses 1 to 4 are 1,000,000, which are at the same location.The cost for the external warehouse 5 is 10,000,000. If there is more than one externalwarehouse, it is also possible to differentiate between these. An external warehouse cancost more than another external warehouse if the way to this location is longer than theother.
Properties of articles
Most of the articles have characteristics based on the acquisition. This means that acooled article must be stored at a stock location with a lower temperature level thanan article from the dry assortment, which can be stored at room temperature. Otherparameters of articles are defined by authorities or certifications. These parameters
39

3. Implementation
Figure 3.6: Order numbers for different type of workers
Figure 3.7: Order numbers for a single type of worker
40

3.2. Defining important parameters
Figure 3.8: Costs between different warehouses
have to be ensured to get the selling concession and sell articles labeled with a specificcertification logo. The requirements of certifications and regulations are strict and willbe monitored in a specific period. Some important information of articles are:
• Temperature level: Based on constraints by authorities and certification, everyarticle has its temperature level. This must be observed because, for some articles,it is not allowed to interrupt the cold chain. If that happens, the article can not besold and needs to be thrown out. Persons who work in the not cooled warehouse arenot allowed to work in the cooled part of the warehouse and vice versa. Therefore,the processes are equal but must be split into different processes for different users.
• Expiration date and batch number: The batch number, which is linked to theexpiration date, is significant. B2B customers only take goods with an elderexpiration date as the orders before. For some business customers, this is strictbecause they also store it for a longer time. If the expiration date is lower than anorder before, they have to rearrange their stock management with extra work. Theexpiration date is also crucial for B2C orders. No customer wants a good which canbe uneatable after a few days. The expiration date is important when filling up thestock locations. When the good is in the picking warehouse, the expiration date
41

3. Implementation
can be unattended because this part of the warehouse has flow racks and holds justthe goods for the next few days.
• Weight: The weight of the article is essential to sorting the picked articles. Themost cumbersome articles should be picked at first to avoid broken boxes. At thetime of the interviews, this will be managed by the picking persons. The systemneeds to support these persons.
• Packaging unit: The packaging unit will declare the size of the article. There aredifferent volumes of single unit amounts per packaging unit available. This candiffer from article to article.
• Language: This attribute means that it is essential to include the language into thecalculation at some companies. Some companies have articles in another languagein a separate stock location, and others store their articles without a label. Thisleads to a delay in the picking process because they need to be labelled before theyare picked. This attribute can change within the articles of a company. An articlewith a higher turnover ratio in different languages will be stored already labelled inthose different languages in separate stock locations. If an article is available inanother language but not that frequently ordered, it will be stored unlabelled andlabelled on demand.
• Batch in quarantine: This indicates whether the article is not allowed to fill upand pick. This is necessary if the quality standard can not be reached or there arechemical residues found in the article.
• Special article: A special article can also lead to a delay in the picking process.Individual articles are, for example, personalized gifts with a personal text onthem. At Sonnentor, this can be a tea with a special dedication on it. Theprinting department will get these articles and prints the personal text on the labels.Currently, there is a delay in the picking process of about three hours of orderswith individual articles.
• Customer demand in previous periods: The system will calculate the demand of thearticle in a specific period (for instance the last year). Every article has a specificdemand, which can change over time. The demand for articles will change overtime because of seasonal variation. At every interviewed company, the time aroundChristmas leads to a peak of customer orders. This is also shown in Figure 3.9,which shows the number of orders per day at Sonnentor.
• Current orders: This parameter shows the amount of the orders currently open ofthis article. The parameter is essential to know for how much must be on stockfor the next day(s). If the amount in stock is too small, a fill-up process must bestarted.
42
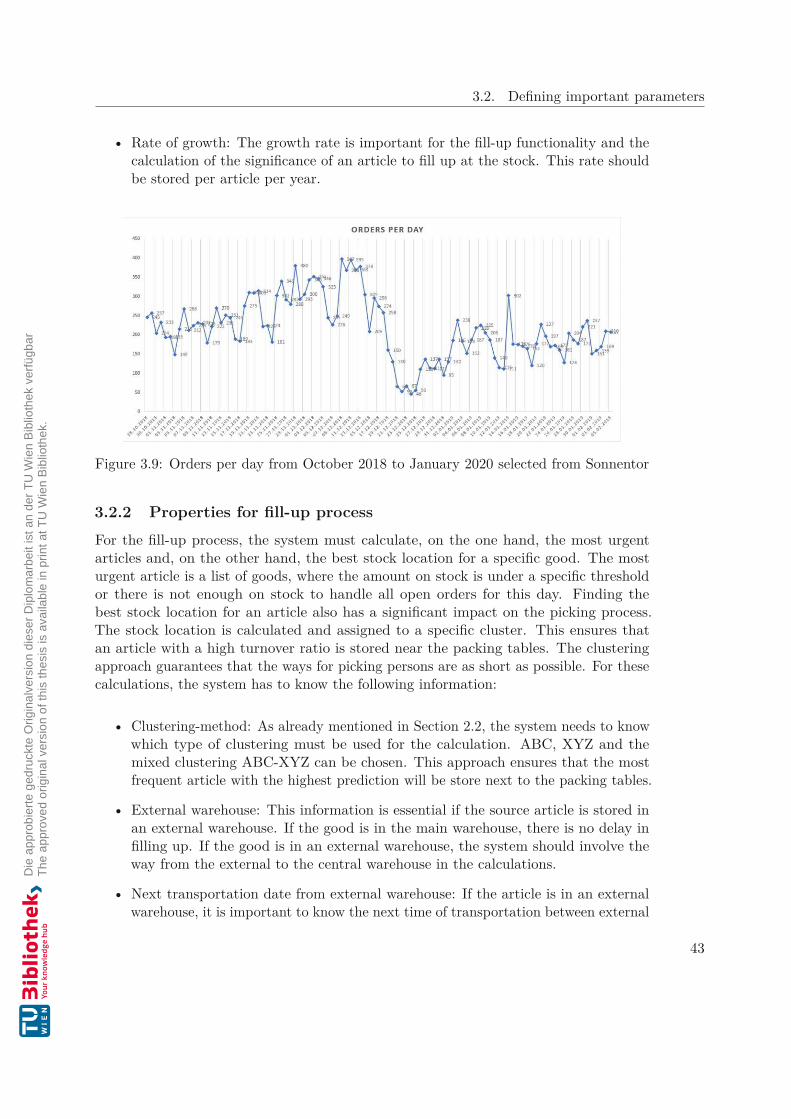
3.2. Defining important parameters
• Rate of growth: The growth rate is important for the fill-up functionality and thecalculation of the significance of an article to fill up at the stock. This rate shouldbe stored per article per year.
Figure 3.9: Orders per day from October 2018 to January 2020 selected from Sonnentor
3.2.2 Properties for fill-up processFor the fill-up process, the system must calculate, on the one hand, the most urgentarticles and, on the other hand, the best stock location for a specific good. The mosturgent article is a list of goods, where the amount on stock is under a specific thresholdor there is not enough on stock to handle all open orders for this day. Finding thebest stock location for an article also has a significant impact on the picking process.The stock location is calculated and assigned to a specific cluster. This ensures thatan article with a high turnover ratio is stored near the packing tables. The clusteringapproach guarantees that the ways for picking persons are as short as possible. For thesecalculations, the system has to know the following information:
• Clustering-method: As already mentioned in Section 2.2, the system needs to knowwhich type of clustering must be used for the calculation. ABC, XYZ and themixed clustering ABC-XYZ can be chosen. This approach ensures that the mostfrequent article with the highest prediction will be store next to the packing tables.
• External warehouse: This information is essential if the source article is stored inan external warehouse. If the good is in the main warehouse, there is no delay infilling up. If the good is in an external warehouse, the system should involve theway from the external to the central warehouse in the calculations.
• Next transportation date from external warehouse: If the article is in an externalwarehouse, it is important to know the next time of transportation between external
43

3. Implementation
and main warehouse. There can be a fixed point of time (like every day at 2 pm)or a fixed period of time (like 2 hours after the order the article will be in the mainstock). This should be added to the calculation.
3.2.3 Properties for picking process
The system calculates every single picking process. This involves the batch order andthe shortest way for the picking persons. Therefore, it is important to have individualparameters at every single picking task. A picking task should have the followinginformation:
• Finished picking process: This information is essential if the picker finishes thepicking process. A picker may miscount the goods during the picking process. Thesystem thinks there is an amount on stock, but the pallet is empty. Therefore, thepicker must have the chance to save this information at every picking process. Thepicking person will finish these tasks later when the good is available again. Thistask is given by the functionality of the ERP system and will not be taken intoaccount in this thesis.
• Order already batched: Due to the complexity of batch orders, this type of ordermust be pre-calculated by the system. Therefore, the system must know if theorder is already in an active batch order or not. When an order is batched, it isnot possible to delete it from this type of order. Even if it would fit better into theother order.
• Shortest way approach: This information is necessary for calculating the shortestway through the stock for the picking persons. Based on that information, thenumbering of the stock location will be changed to guarantee the shortest way withthe specific approach.
• Selection of seed order: There are different ways to select a seed order. The seedorder is the starting point of a batch order. When interviewing the stock managersof Sonnentor, Kastner and Kiennast, they all mentioned that the most importantrule is that all customers should get their goods as fast as possible. This decisionalso has an impact on the way to select the seed order.
• Selection of accompanying orders: Based on the seed order, the accompanyingorders will be selected. There are also different ways to do that, so the systemmust know which approach needs to be taken. Other parameters like the number ofdifferent articles, the size of the stock, the number of picking persons or the stockstructure influence this approach.
44

3.3. Fill-up process
3.3 Fill-up process
The fill-up process is the first part for implementing a prototype on the test environmentof Sonnentor. At this process, it is important to differentiate between B2C and B2Bcustomers whenever this is needed. The investigated companies Kiennast and Kastnerdid not differentiate between B2B and B2C, whereas Sonnentor differs between thesecustomer groups. This is important because B2C handles a smaller amount per orderthan a B2B order. The B2C part of stock also differentiates regarding packaging unitsand type of stock. At Sonnentor, the B2C part is a flow stock. All other stock locationsare pallet racks. Therefore, there is some preliminary work to do which is already handledin Section 3.2.To get an overview of the significance of the optimization of this action, Figure 3.10 showsthe number of fill-up processes per day in the last three years at Sonnentor. All data inthis figure are visualised by a dot in the timeline. The blue line is the linear regressionmodel “loess” with a span of 0.05. “Loess” is a way to show data smoothly. The spanshows the granularity of the regression line. The lower the value of span, the more thegranularity will be more precise and show a wigglier line. Every point in the scale willbe rated. The rating includes all neighbours in decreasing order regarding the distanceof the investigated point. This leads to a smoothed visualisation where the outliers willnot be taken too much into account. This regression line shows a seasonal variation inthe data of Sonnentor. At Christmas, there are the most fill-up processes in the system.Therefore, it is significant to optimize the overall fill-up action.
Figure 3.10: Fill up activities per day from November 2018 to November 2020
45

3. Implementation
To find optimization potential at the fill-up action, it is necessary to get an overview ofthe whole process. The process also should have a look at the upcoming tasks after theseactions. An optimal fill-up strategy is needed to reduce ways in the upcoming pickingtasks. In the companies examined, there are different ways to fill up stock. At Kiennastand Kastner, picking and fill-up persons are different. This leads to a division of work.At Sonnentor, those persons are the same. Whenever they have time during their pickingprocesses, they requests the most important fill-up article. The different ways to fill upstock amounts have no impact on the optimization strategy.Some base functions will be created to implement an optimal working approach, whichwill be used for the overall process.
3.3.1 Base functionalityAt all investigated companies, the main stock will be used by different persons who willbe using the articles differently. One person can use an article on stock to fill it upat the picking stock, another person uses it for a B2B sales order and another personreserves the goods for a special customer. Therefore, it is necessary to create all workflowsto select just these articles, which are free to use. This leads to some limitations andfunctionalities which are used for the B2C and B2B workflow, which will be described inthe following parts of this thesis.
Articles to fill up
To create a useful fill-up action, it is necessary to select all articles, which are open tofill-up. This selection does not give away any ranking of the importance of an article.Therefore, the selection is used to identify just these articles which are needed the nexttime. A user’s motivation will drop when he/she fills up one package at a time. For thisreason, some constraints are created which must be fulfilled to get into the point ranking,which will be described later on. At Sonnentor, an article should be filled up when thefollowing four criteria are fulfilled.
1. At first, there must be articles on stock to fill up for the investigated article.
2. The minimum fill-up amount for the investigated article must be over one trans-portation box. Otherwise, the article is unnecessary.
3. Fill up just these articles, where enough articles are on stock. If there are notenough in stock, the article should not be filled up at the picking warehouse.
4. The articles from the stock should be free. These articles should not be reservedfor another customer.
The following Listing 3.1 shows the criteria from above as a SQL statement.
46

3.3. Fill-up process
1 /∗ C r i t e r i a 1 ∗/2 and av l . amount>03 /∗ C r i t e r i a 2 ∗/4 and cast ( ( s . AlertAmountMax1−i s n u l l ( s tock . amount , 0 ) ) /5 i s n u l l ( apbp . UnitAmount , i s n u l l ( apstd . UnitAmount , 1 ) ) as int ) >= 26 /∗ C r i t e r i a 3 ∗/7 and ( s . AlertAmountMax1−i s n u l l ( s tock . amount , 0 ) ) /8 i s n u l l ( apbp . UnitAmount , i s n u l l ( apstd . UnitAmount , 1 ) )9 ∗ i s n u l l ( apbp . UnitAmount , i s n u l l ( apstd . UnitAmount , 1 ) )
10 <= i s n u l l ( av l . amount ,0) − i s n u l l ( s tock . amount , 0 )11 /∗ C r i t e r i a 4 ∗/12 and sourceStor e2 . Source_Store_SID i s not null13 and sourceStor e2 . Source_StockGrpAttr_SID i s not null
Listing 3.1: Criteria which article should be filled-up
These constraints ensure that just a high amount of an article needs to be filled up andthe articles have to be free at the stock. Otherwise some people will be confused if areserved article is not in stock when they need it.
Lock articles
Another important part is to guarantee that more fill-up persons do not fill up thesame article simultaneously. Therefore, it is necessary to find a mechanism to flag aspecific transaction that other fill-up persons can select. This will be done by lockingthe destination stock location of a fill-up action. When a user starts a fill-up action ata specific time, the system locks the destination stock location by inserting a lock in atemporary table. Other fill-up actions can use this temporary table to check if anotherperson wants to fill up in the same destination stock location. Every fill-up action checksat selecting the next article if this stock location is currently locked. Nevertheless, thelock can lead to several problems. If the scanner of the user loses the connection tothe internet or loses the session of the system, he cannot finish the task, and the stocklocation will be locked all the time. The same thing happens if the user cancels the fill-upaction without saving the progress. This circumstance leads to a timed lock of a stocklocation. The time period for a lock should be, on the one hand, long enough that afill-up person can finish the progress and, on the other hand, not too long that a problemwith the scanner locks the most important article for a too long time period. After a fewtries, the lock is configured for five minutes. Within five minutes, the user has to selectand bring the article to the picking stock. When the articles are in the picking stock, it isunnecessary for other fill-up actions until the reorder point will be reached for this good.
3.3.2 B2C
At Sonnentor most of the articles will be sold to private customers. Therefore, the fill-upprocess at this company is one of the most important steps to create an optimal stock
47

3. Implementation
process. This is needed to save time and money when they reach their main season, whenthey have up to 400 orders per day (December 2018 - 3.9).
Most important fill-up article
Every fill-up transaction can consist of one or more positions. The selection of the firstposition is different from the following positions to ensure optimality.The first step to get an overall optimized fill-up process is to get the most urgent articleto fill up. This will be achieved by calculating a point rating system for every article,which can be used to get the most urgent article. Listing 3.2 shows the part, whichcalculates a stock rating out of the base aspects of the article, stock location and thestock amount. These aspects are:
1. Alert Amount Max: Every stock location needs different specifications as alreadydefined in Section 3.2.1. For the calculation of the most urgent article, the maximumalert amount will be needed. This specification stores the highest amount of articlesthat can be stored at this stock location. In the calculation, this is needed to getthe fill-up amount per stock location. The higher the difference between the actualstock amount and the maximum alert amount is, the higher the necessity is to fillup the article.
2. Alert Amount Min: This parameter defines the opposite way of the first parameter.The minimum amount per stock defines the level at which the stock should berefilled latest. This amount is defined regarding the packaging units and the averageselling amount of the next days. Every article has its own minimum amount forthe picking warehouse.
3. Actual stock amount: The actual stock amount is important for showing theimportance of the article for the fill-up process. This amount will be taken intoaccount when calculating the point rating of the article.
4. Article and article packaging unit: In the first stage of extension, it is necessary toknow the article and the specific packaging unit. The packaging unit is importantto get a minimum amount to fill up. For Sonnentor, a minimum of two packagingunits per article is defined.
5. Required amount: This amount is the sum of all open orders for the next two days.Forecasting as described in Listing 3.7 is only meaningful for months and coarsergranularity because the orders have no impact on other orders. It is only meantto look at a specific month, especially for seasonal products like advent calendars.Listing 3.3 shows the calculation of the open demand per article in the upcomingdays.
6. Department of selling call-off: Every selling contract gets a specific departmentthat has to do the next step. When a contract comes into the system, a department
48
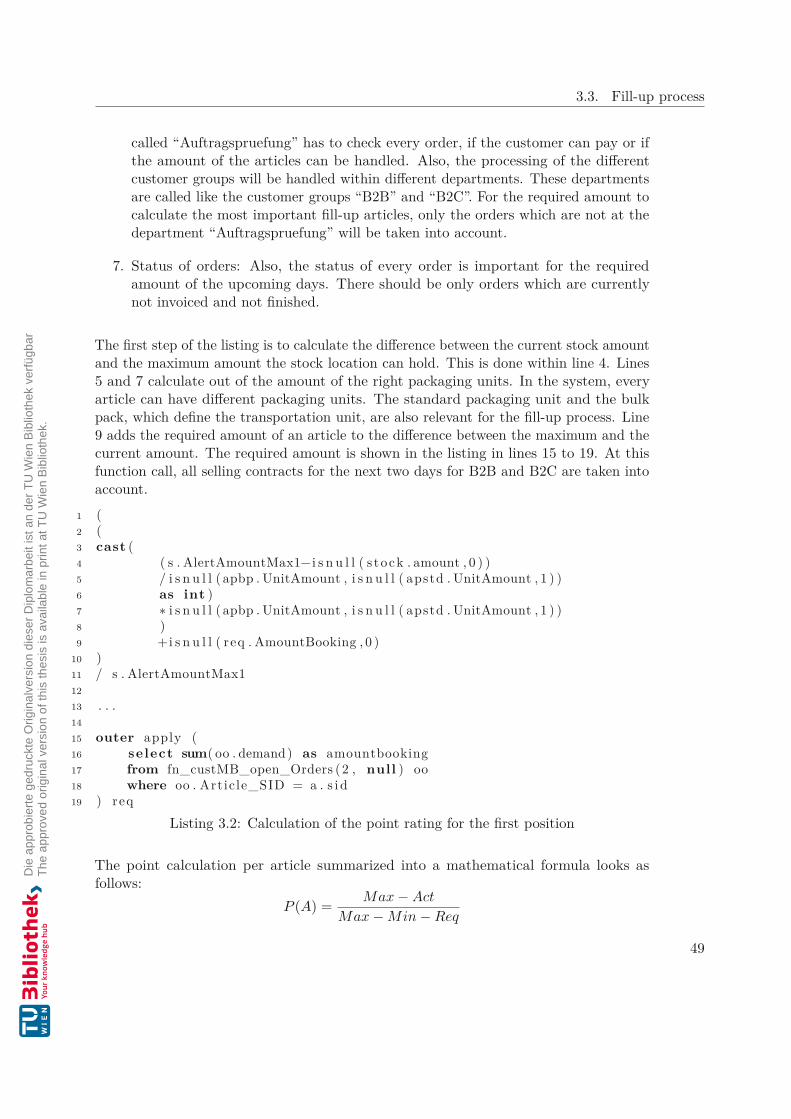
3.3. Fill-up process
called “Auftragspruefung” has to check every order, if the customer can pay or ifthe amount of the articles can be handled. Also, the processing of the differentcustomer groups will be handled within different departments. These departmentsare called like the customer groups “B2B” and “B2C”. For the required amount tocalculate the most important fill-up articles, only the orders which are not at thedepartment “Auftragspruefung” will be taken into account.
7. Status of orders: Also, the status of every order is important for the requiredamount of the upcoming days. There should be only orders which are currentlynot invoiced and not finished.
The first step of the listing is to calculate the difference between the current stock amountand the maximum amount the stock location can hold. This is done within line 4. Lines5 and 7 calculate out of the amount of the right packaging units. In the system, everyarticle can have different packaging units. The standard packaging unit and the bulkpack, which define the transportation unit, are also relevant for the fill-up process. Line9 adds the required amount of an article to the difference between the maximum and thecurrent amount. The required amount is shown in the listing in lines 15 to 19. At thisfunction call, all selling contracts for the next two days for B2B and B2C are taken intoaccount.
1 (2 (3 cast (4 ( s . AlertAmountMax1−i s n u l l ( s tock . amount , 0 ) )5 / i s n u l l ( apbp . UnitAmount , i s n u l l ( apstd . UnitAmount , 1 ) )6 as int )7 ∗ i s n u l l ( apbp . UnitAmount , i s n u l l ( apstd . UnitAmount , 1 ) )8 )9 +i s n u l l ( req . AmountBooking , 0 )
10 )11 / s . AlertAmountMax11213 . . .1415 outer apply (16 select sum( oo . demand) as amountbooking17 from fn_custMB_open_Orders (2 , null ) oo18 where oo . Article_SID = a . s i d19 ) req
Listing 3.2: Calculation of the point rating for the first position
The point calculation per article summarized into a mathematical formula looks asfollows:
P (A) = Max − Act
Max − Min − Req
49
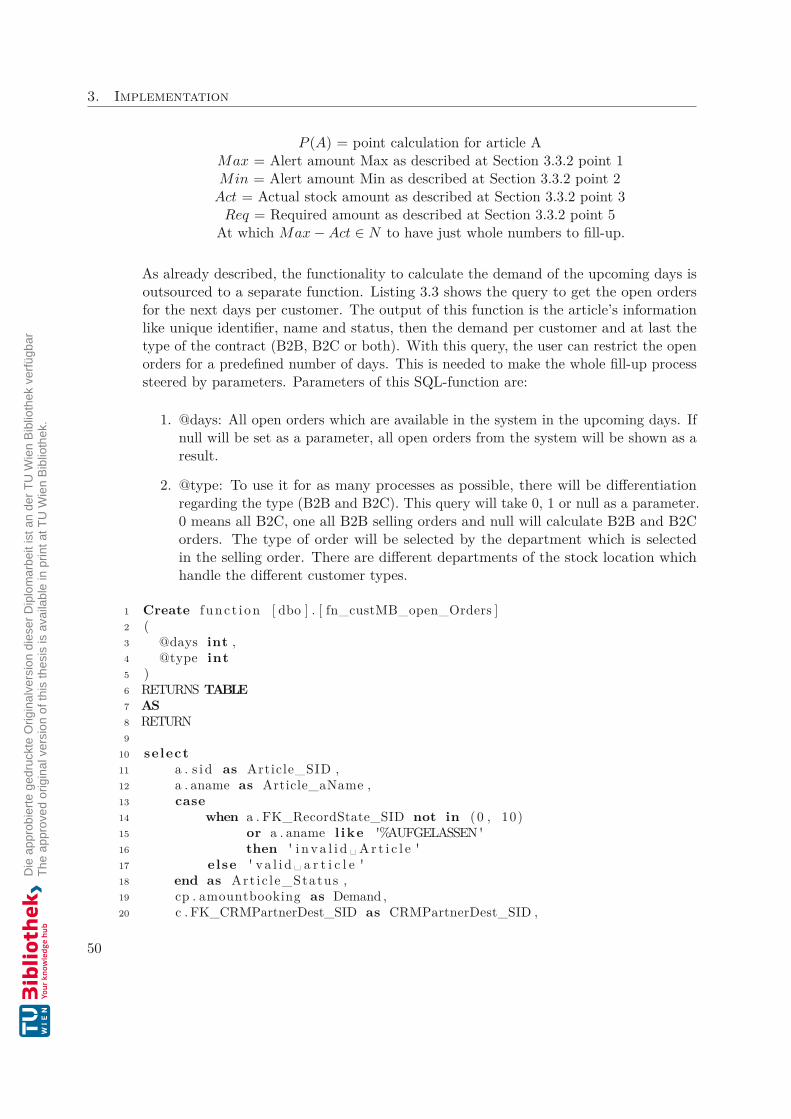
3. Implementation
P (A) = point calculation for article AMax = Alert amount Max as described at Section 3.3.2 point 1Min = Alert amount Min as described at Section 3.3.2 point 2
Act = Actual stock amount as described at Section 3.3.2 point 3Req = Required amount as described at Section 3.3.2 point 5
At which Max − Act ∈ N to have just whole numbers to fill-up.
As already described, the functionality to calculate the demand of the upcoming days isoutsourced to a separate function. Listing 3.3 shows the query to get the open ordersfor the next days per customer. The output of this function is the article’s informationlike unique identifier, name and status, then the demand per customer and at last thetype of the contract (B2B, B2C or both). With this query, the user can restrict the openorders for a predefined number of days. This is needed to make the whole fill-up processsteered by parameters. Parameters of this SQL-function are:
1. @days: All open orders which are available in the system in the upcoming days. Ifnull will be set as a parameter, all open orders from the system will be shown as aresult.
2. @type: To use it for as many processes as possible, there will be differentiationregarding the type (B2B and B2C). This query will take 0, 1 or null as a parameter.0 means all B2C, one all B2B selling orders and null will calculate B2B and B2Corders. The type of order will be selected by the department which is selectedin the selling order. There are different departments of the stock location whichhandle the different customer types.
1 Create f unc t i on [ dbo ] . [ fn_custMB_open_Orders ]2 (3 @days int ,4 @type int5 )6 RETURNS TABLE7 AS8 RETURN9
10 select11 a . s i d as Article_SID ,12 a . aname as Article_aName ,13 case14 when a . FK_RecordState_SID not in (0 , 10)15 or a . aname l ike '%AUFGELASSEN '16 then ' i n v a l i d ␣ A r t i c l e '17 else ' v a l i d ␣ a r t i c l e '18 end as Art ic l e_Status ,19 cp . amountbooking as Demand ,20 c . FK_CRMPartnerDest_SID as CRMPartnerDest_SID ,
50
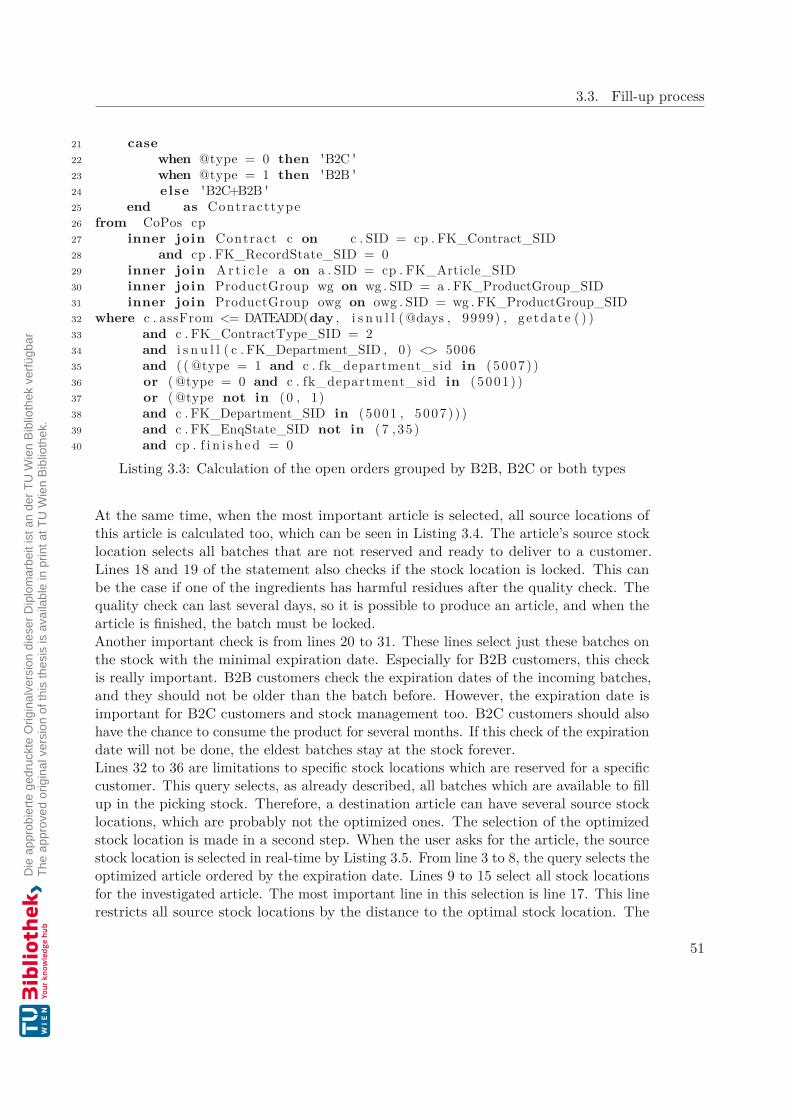
3.3. Fill-up process
21 case22 when @type = 0 then 'B2C '23 when @type = 1 then 'B2B '24 else 'B2C+B2B '25 end as Contracttype26 from CoPos cp27 inner join Contract c on c . SID = cp . FK_Contract_SID28 and cp . FK_RecordState_SID = 029 inner join A r t i c l e a on a . SID = cp . FK_Article_SID30 inner join ProductGroup wg on wg . SID = a . FK_ProductGroup_SID31 inner join ProductGroup owg on owg . SID = wg . FK_ProductGroup_SID32 where c . assFrom <= DATEADD(day , i s n u l l ( @days , 9999) , getdate ( ) )33 and c . FK_ContractType_SID = 234 and i s n u l l ( c . FK_Department_SID , 0) <> 500635 and ( ( @type = 1 and c . fk_department_sid in (5007) )36 or ( @type = 0 and c . fk_department_sid in (5001) )37 or ( @type not in (0 , 1)38 and c . FK_Department_SID in (5001 , 5007) ) )39 and c . FK_EnqState_SID not in (7 , 35 )40 and cp . f i n i s h e d = 0
Listing 3.3: Calculation of the open orders grouped by B2B, B2C or both types
At the same time, when the most important article is selected, all source locations ofthis article is calculated too, which can be seen in Listing 3.4. The article’s source stocklocation selects all batches that are not reserved and ready to deliver to a customer.Lines 18 and 19 of the statement also checks if the stock location is locked. This canbe the case if one of the ingredients has harmful residues after the quality check. Thequality check can last several days, so it is possible to produce an article, and when thearticle is finished, the batch must be locked.Another important check is from lines 20 to 31. These lines select just these batches onthe stock with the minimal expiration date. Especially for B2B customers, this checkis really important. B2B customers check the expiration dates of the incoming batches,and they should not be older than the batch before. However, the expiration date isimportant for B2C customers and stock management too. B2C customers should alsohave the chance to consume the product for several months. If this check of the expirationdate will not be done, the eldest batches stay at the stock forever.Lines 32 to 36 are limitations to specific stock locations which are reserved for a specificcustomer. This query selects, as already described, all batches which are available to fillup in the picking stock. Therefore, a destination article can have several source stocklocations, which are probably not the optimized ones. The selection of the optimizedstock location is made in a second step. When the user asks for the article, the sourcestock location is selected in real-time by Listing 3.5. From line 3 to 8, the query selects theoptimized article ordered by the expiration date. Lines 9 to 15 select all stock locationsfor the investigated article. The most important line in this selection is line 17. This linerestricts all source stock locations by the distance to the optimal stock location. The
51

3. Implementation
distance to this one must be within 100 points. These points are coming from the ordernumber from the stock location, which is described in Figure 3.6. One hundred pointsare the distance within five pallet racks left and right of the optimal one.This is done because there are sometimes different batches stored at one stock location.When the fill-up person comes to that stock location, there is no difference in which batchwill be taken. If the amount to fill up can not be taken from this stock location, the usercan decide if he/she takes it from another stock location that is near to the optimal one.These stock locations can differ regarding expiration date and amount. At the scanner,this can be done by duplicate the source positions and selecting the new batch. Figure3.11 shows the scanner surface. When there is a source position with more than oneavailable batch, the user can duplicating the position with one button and select theother batch. The user can also overwrite the amount which is suggested by the system.
1 outer apply (2 SELECT distinct3 s t . Store_SID as Source_Store_SID ,4 s t . FlexStockCode1 as Source_FlexStockCode1 ,5 s t . FlexStockCode2 as Source_FlexStockCode2 ,6 s t . FlexStockCode3 as Source_FlexStockCode3 ,7 s t . DateExpire as Source_MHD ,8 a . s i d as Source_Article_SID ,9 s t . amountFree as Source_Amuont_Free ,
10 s s . orderNumber as Source_OrderNumber ,11 s t . StockGrpAttr_SID as Source_StockGrpAttr_SID12 FROM F4MBS. dbo . fn_Stock_Search ( getdate ( ) ) s t13 inner join f4mbs . dbo . Store s s14 on s s . SID = s t . s to r e_s id and s s . FK_RecordState_SID = 015 WHERE ( s t . Artic le_SID = a . s i d16 AND s t . StockGrouper not l ike N 'PK:% '17 AND s t . StockGrouper not l ike N 'EX:% '18 AND ( s t . Store_locked <> 1 OR s t . Store_locked IS NULL)19 AND ( s t . StoreGrp_locked <> 1 OR s t . StoreGrp_locked IS NULL) )20 AND ( s t . DateExpire in21 (22 select MIN( da t eexp i r e )23 from f4mbs . dbo . vw_stock minexp24 inner join f4mbs . dbo . a r t i c l e a25 on a . SID = minexp . FK_Article_SID26 where minexp . fk_Article_SID=a . s i d27 and minexp . Amount>028 and minexp . FlexStockCode1 <> ' 09 '29 and s t . Store_SID <> s . s i d30 and minexp . FK_Store_SID <> a . FK_Store_SID31 group by minexp . FK_Article_SID32 )33 and s t . s tockgrouper not l ike '%−PACK:% '34 and s t . FlexStockCode1+'− '+s t . FlexStockCode235 +'− '+s t . FlexStockCode3 <> 'DE−NN−REE '
52

3.3. Fill-up process
36 and s t . FlexStockCode1+'− '+s t . FlexStockCode237 +'− '+s t . FlexStockCode3 <> 'V−P−P '38 )39 AND ( s t .STOCKGROUPER i s not null )40 AND s t . AmountFree > 041 ) sour ceSto r e
Listing 3.4: Selection of all source stock locations of an specific article
1 select nex . Source_StockGrpAttr_SID2 from (3 select top 1 fu . Source_Article_SID ,4 fu . Source_OrderNumber5 from f4mbs . dbo . vw_cust_fi l lup_optimized fu6 where Article_SID = ##a r t i c l e _ s i d##7 order by DateAdd(Day, DateDi f f (Day, 0 , fu . Source_MHD) , 0) asc8 ) opt9 inner join (
10 select fu . Source_StockGrpAttr_SID ,11 fu . Source_Article_SID ,12 fu . Source_OrderNumber13 from f4mbs . dbo . vw_cust_fi l lup_optimized fu14 where Article_SID = ##a r t i c l e _ s i d##15 ) nex on nex . Source_Article_SID = opt . Source_Article_SID16 and17 ( abs ( opt . Source_OrderNumber − nex . Source_OrderNumber ) < 100)
Listing 3.5: Selection of the optimized and nearby stock locations
Optimized way to fill-up
After the most urgent article and the source location is selected, the next position withina transaction will be selected by the minimum distance to the previous article, whichmust be filled up. Which articles are needed to be filled up is already defined by Listing3.1.The order number will calculate the minimum distance to another stock location. Everystock location has a unique order number from a specific schema regarding the level andthe warehouse. The structure of the order numbers is shown in Section 3.2.1 and hasto be done to get an optimal way through the stock. If a stock location does not havean order number, it will be replaced by the high standard value 9999999. This ensuresthat a stock location with an order number is ranked higher than one without an ordernumber because of the absolute distance between the two points. A pre-calculation ofthe optimal way is not possible because the stock locations from every article are notfixed. Since relocation or production can always occur, this would destroy the optimalroute through the stock in real-time. Listing 3.6 shows the part which decides if theposition is the first article in the fill-up transaction or not. The place holder “prev” getsthe previous position from the fill-up transaction. If this place holder is null, it is the first
53
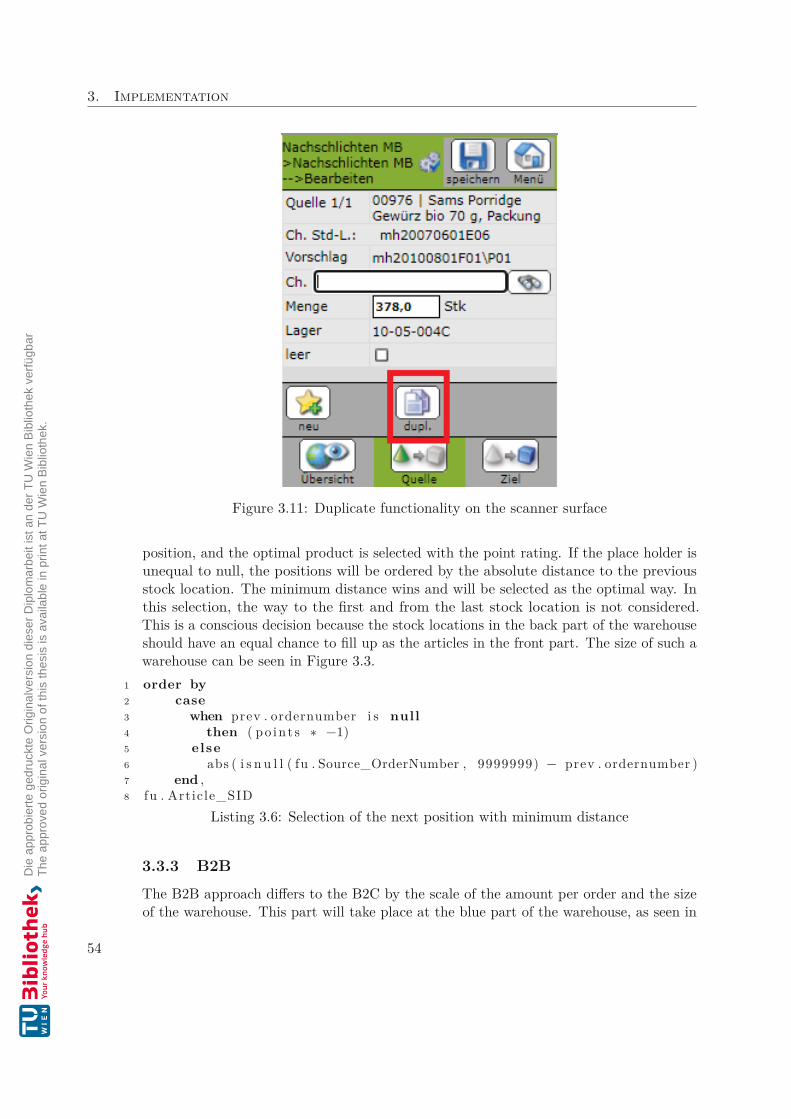
3. Implementation
Figure 3.11: Duplicate functionality on the scanner surface
position, and the optimal product is selected with the point rating. If the place holder isunequal to null, the positions will be ordered by the absolute distance to the previousstock location. The minimum distance wins and will be selected as the optimal way. Inthis selection, the way to the first and from the last stock location is not considered.This is a conscious decision because the stock locations in the back part of the warehouseshould have an equal chance to fill up as the articles in the front part. The size of such awarehouse can be seen in Figure 3.3.
1 order by2 case3 when prev . ordernumber i s null4 then ( po in t s ∗ −1)5 else6 abs ( i s n u l l ( fu . Source_OrderNumber , 9999999) − prev . ordernumber )7 end ,8 fu . Article_SID
Listing 3.6: Selection of the next position with minimum distance
3.3.3 B2BThe B2B approach differs to the B2C by the scale of the amount per order and the sizeof the warehouse. This part will take place at the blue part of the warehouse, as seen in
54

3.3. Fill-up process
Figure 3.3. At Sonnentor, the term B2B has a broader range because usually B2B meansjust business customers. The B2B approach at Sonnentor also declares selling contractsover a specific amount as B2B. This will be done to avoid the emptying of the pickingwarehouse within a single order. The B2B fill-up at Sonnentor is different to Kastner andKiennast because they are their own producer. Sonnentor gets the ingredients from thefarmers and produce the selling product. Filling-up for B2B is, in that case, to bring thecomplete pallets of the selling product from the production hall to the stock. At Kastnerand Kiennast, there are only B2B customers available, but they do not have a separatepicking warehouse for smaller orders. At both these companies, they do not produce anyproducts on their own. They get their products from another supplier. The B2B fill-upmeans, for their understanding, to bring the goods from the truck to the stock location.This section describes how the needed stock amount will be calculated as a forecast andwhere the articles should be stocked. The stock location of every article based on theforecasting is important for the picking process to avoid long ways through the warehouse.At this part, there is no optimization of the way required because every fill-up processwill be done pallet per pallet.
Forecasting
The warehouse capacity at the blue sector, as seen in Figure 3.3, is usually high becauseto store the next months in it. Therefore, it is useful to forecast every article and stocklocation. This should be done to optimize ways for the upcoming fill-up to the pickingwarehouse process or picking process for B2B customers.Forecasting means calculating the number of goods that are needed for the upcomingtime. This will be the first step at the fill-up action for B2B orders. This is needed torate the articles with a higher turnover ratio at a specific previous period in time higherthan others. A higher rating leads to a more prominent place at the stock to reduce waysfor the picking persons. The selling contracts from previous periods will be reviewed andadjusted with the growth rate for a specific article and a specific customer group to getthis data. The forecasting functionality should be parametrized to simplify changes atthe starting point or the time periods of the calculation. Also, the differentiation of B2Band B2C will be important. B2B orders affects the calculation more than B2C ordersbecause of the amount of every order.The responsible persons from the companies examined want to consider the data peryear, per half-year, quarter and month. The rate of growth should be handled at everyarticle per year, as already mentioned in Section 3.2.1. Also, the differentiation betweencustomer groups should be handled. The expected rate of growth of the wholesaler can behigher than gastronomy or the other way round. It is also possible to have a specific rateper partner when it can be expected to have an extraordinary growth of one customer.This functionality can be used to plan the production if there are too few products onstock, to plan the optimal stock locations of every article or to order the right amount ofgoods from the suppliers.The following equation shows the calculation of the forecasting amount with respect tothe growing rates per article and customer.
55

3. Implementation
FA(A) = (n=1
CnAmA ∗ GRCn) + (AmA −n=1
CnAmA) ∗ GRAA
FA(A) = forecasting amount of article An = number of customers which bought article A
CnAmA = amount of article A which was sold to customer n during the previous periodGRCn = expected growing rate of customer n for the upcoming period
AmA = quantity of sales of article A during the previous periodGRAA = expected growing rate of article A for the upcoming period
1 CREATE FUNCTION [ dbo ] . [ fn_custMB_forecast ]2 (3 @invest igat ionDate datetime ,4 @period int ,5 @days int ,6 @type int7 )8 RETURNS TABLE9 AS
10 RETURN1112 select13 f . Article_SID as Article_SID14 , f . Article_aName as Article_aName15 , round (sum( f . Customer_AmountGrowingRate ) , 2) as ForecastingDemand16 from (17 select a . s i d as Article_SID18 , a . aname as Article_aName19 , sum( prev . Demand) as Prev_DemandCustomer20 , ( select sum(demand)21 from [ fn_custMB_prev_Demand ]22 ( @invest igat ionDate , @period , @days , @type )23 where a r t i c l e _ s i d = a . s i d24 ) as CoPos_AmountAdminOveral25 , convert ( f loat , cpDest . a l t i d 3 ) as Customer_GrowingRate26 , sum( prev . Demand) ∗ convert ( f loat , cpDest . a l t i d 3 )27 as Customer_AmountGrowingRate28 , prev . CRMPartnerDest_SID as CRMPartner_SID29 from f4mbs . dbo . a r t i c l e a30 inner join [ fn_custMB_prev_Demand ]31 ( @invest igat ionDate , @period , @days , @type ) prev32 on prev . Article_SID = a . s i d33 inner join crmpartner cpDest34 on cpDest . s i d = prev . CRMPartnerDest_SID35 and cpDest . fk_records ta te_s id = 036 where a . FK_RecordState_SID = 037 group by prev . CRMPartnerDest_SID
56
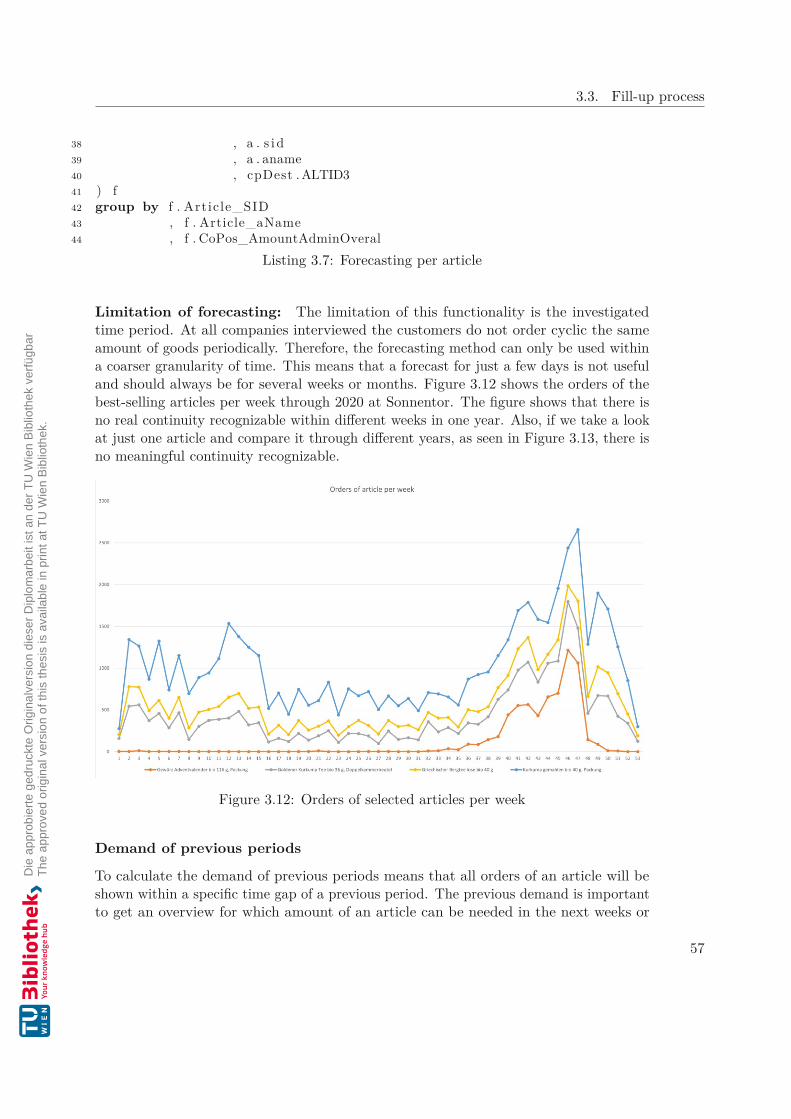
3.3. Fill-up process
38 , a . s i d39 , a . aname40 , cpDest . ALTID341 ) f42 group by f . Article_SID43 , f . Article_aName44 , f . CoPos_AmountAdminOveral
Listing 3.7: Forecasting per article
Limitation of forecasting: The limitation of this functionality is the investigatedtime period. At all companies interviewed the customers do not order cyclic the sameamount of goods periodically. Therefore, the forecasting method can only be used withina coarser granularity of time. This means that a forecast for just a few days is not usefuland should always be for several weeks or months. Figure 3.12 shows the orders of thebest-selling articles per week through 2020 at Sonnentor. The figure shows that there isno real continuity recognizable within different weeks in one year. Also, if we take a lookat just one article and compare it through different years, as seen in Figure 3.13, there isno meaningful continuity recognizable.
Figure 3.12: Orders of selected articles per week
Demand of previous periods
To calculate the demand of previous periods means that all orders of an article will beshown within a specific time gap of a previous period. The previous demand is importantto get an overview for which amount of an article can be needed in the next weeks or
57

3. Implementation
Figure 3.13: Orders of selected articles per week
months and is a base functionality of the forecasting. At Kiennast and Kastner, thisis important because until now, this is based on the experience of the stock manager.This forecasting should also be included when calculating the amount of the articlesduring the fill-up process. Now, the fill-up action gives the amount of free space at thedestination stock location. This should be replaced by the amount which is really neededfor the upcoming days. Parameters for the calculation of the previous demand are:
1. @startdate: The date, which will be the starting point of investigation. In practice,this will be the current date most of the time. With this parameter, it is possibleto get an overview of different points in time during the year.
2. @period: The period is an integer and is defined as the number of months subtractedfrom the start date. This number will be negated in the function.
3. @days: This parameter describes the number of days which will be investigatedfrom the start date minus the number of months given in the parameter period.If the user wants the orders within two weeks, this parameter will be seven. Thenumber of days will create a gap around the date investigated. In this examplethe period investigated will start seven days before and end seven days after therequested date.
58

3.3. Fill-up process
1 CREATE FUNCTION [ dbo ] . [ fn_custMB_prev_Demand ]2 (3 @startDate datetime , /∗ Date o f i n v e s t i g a t i o n4 ( most o f the time cur rent date ) ∗/5 @period int , /∗ per iod in months ∗/6 @days int , /∗ +/− Days o f s tar tDate − per iod ∗/7 @type int /∗ type : 0=B2C ) ; 1=B2B;8 in any other case = both ∗/9 )
10 RETURNS TABLE11 AS12 RETURN1314 select15 a . s i d as Article_SID ,16 a . aname as Article_aName ,17 case18 when a . FK_RecordState_SID not in (0 , 10)19 or a . aname l ike '%AUFGELASSEN ' then ' i n v a l i d ␣ A r t i c l e '20 else ' v a l i d ␣ a r t i c l e '21 end as Art ic l e_Status ,22 cp . AmountAdmin as Demand ,23 c . FK_CRMPartnerDest_SID as CRMPartnerDest_SID ,24 case25 when @type = 0 then 'B2C '26 when @type = 1 then 'B2B '27 else 'B2C+B2B '28 end as Contracttype29 from CoPos cp30 inner join Contract c on c . SID = cp . FK_Contract_SID31 and cp . FK_RecordState_SID = 032 inner join A r t i c l e a on a . SID = cp . FK_Article_SID33 inner join ProductGroup wg on wg . SID = a . FK_ProductGroup_SID34 inner join ProductGroup owg on owg . SID = wg . FK_ProductGroup_SID35 where ( ( @days i s not null36 and c . assFrom >37 DATEADD(MONTH, ( @period ∗( −1)) , dateadd (day , ( @days∗( −1)) , @startDate ) )38 and c . assFrom <39 DATEADD(MONTH, ( @period ∗( −1)) , dateadd (day @days , @startDate ) ) )40 or41 ( @days i s null42 and c . assFrom > DATEADD(MONTH, ( @period ∗( −1)) , @startdate )43 ) )4445 and c . FK_ContractType_SID = 2 /∗ s e l l i n g c a l l o f f ∗/46 and ( ( i s n u l l ( @type , 999) = 147 and c . fk_department_sid in (5007) ) /∗ B2B ∗/48 or ( i s n u l l ( @type , 999) = 049 and c . fk_department_sid in (5001) ) /∗ B2C ∗/
59

3. Implementation
50 or ( i s n u l l ( @type , 999) not in (0 , 1)51 and c . FK_Department_SID in (5001 , 5007) ) ) /∗ B2C; B2B ∗/
Listing 3.8: Calculates the demand of previous periods
The output of Listing 3.8 is, on the one hand, a list of information about the article likeunique identifier, name and status. An article status indicates if an article is deleted ornot relevant in the future. After that, a list of the article demands per customer will beprovided to have an overview, which customer orders which amount of articles in theinvestigated time period. This is needed at the forecasting calculation because everycustomer can get a different rate of growth. The last column is the type of contracts thatis given as a parameter to the function. This can be B2B, B2C or both.The filter of this statement is, on the one hand, the selection of just the contracts withinthe period that the user handles as parameters to the function. At first, the user’s“startdate” is reduced by the parameter “days”. The outcome of this function will bereduced by the period, which is given by the number of months to the function. This isdone from lines 35 to 43. On the other hand, the statement filters all selling contractsbelonging to the user from the given type. This is done in lines 45 to 51. The contractscan be 0, which means all B2C orders, 1 for all B2B orders or any other number for B2Cand B2B orders.
Cluster analysis of an article
When an article is filled up at the blue part of the stock, as seen in Figure 3.3, it isnecessary to have a strategy at which stock location the article should be. The differentstrategies are already described in Section 2.2. All fill-up approaches will be tried out,and the best fitting strategy will be taken. At first, there will be a proceeding for thechaos approach, followed by the ABC and XYZ cluster analysis and the combination ofthese two calculations.For the ABC and the XYZ analysis, it is important to split the stock into three parts.The first part (A/X) is near to the picking warehouse and the packaging area and hasto contain the most important and scalable articles. The second part (B/Y) stores thearticles that have a moderate importance/scalability and the last one (C/Z) stores thearticles that will not be sold that often. Figure 3.14 shows all three parts highlighted atthe stock at Sonnentor. The grey part of the stock is the picking warehouse and shouldnot be available for B2B customers and B2B fill-up actions. The light green part of thestock is reserved for A or X articles. Light orange shows the part which must be filledwith B or Y articles. The light red part is for all articles, which have a low stock turnoverrate and clustered as C or Z.For the ABC-YXZ analysis, each of these three parts from above has to be split intoanother three parts. This ensures that each part of those nine parts can store the ABCand XYZ clustering analysis. An AX article must be stored more prominent to thepackaging tables as an AZ article. Figure 3.15 shows the stock split into three parts A,B and C. Each part is again split into three parts X, Y and Z.
60
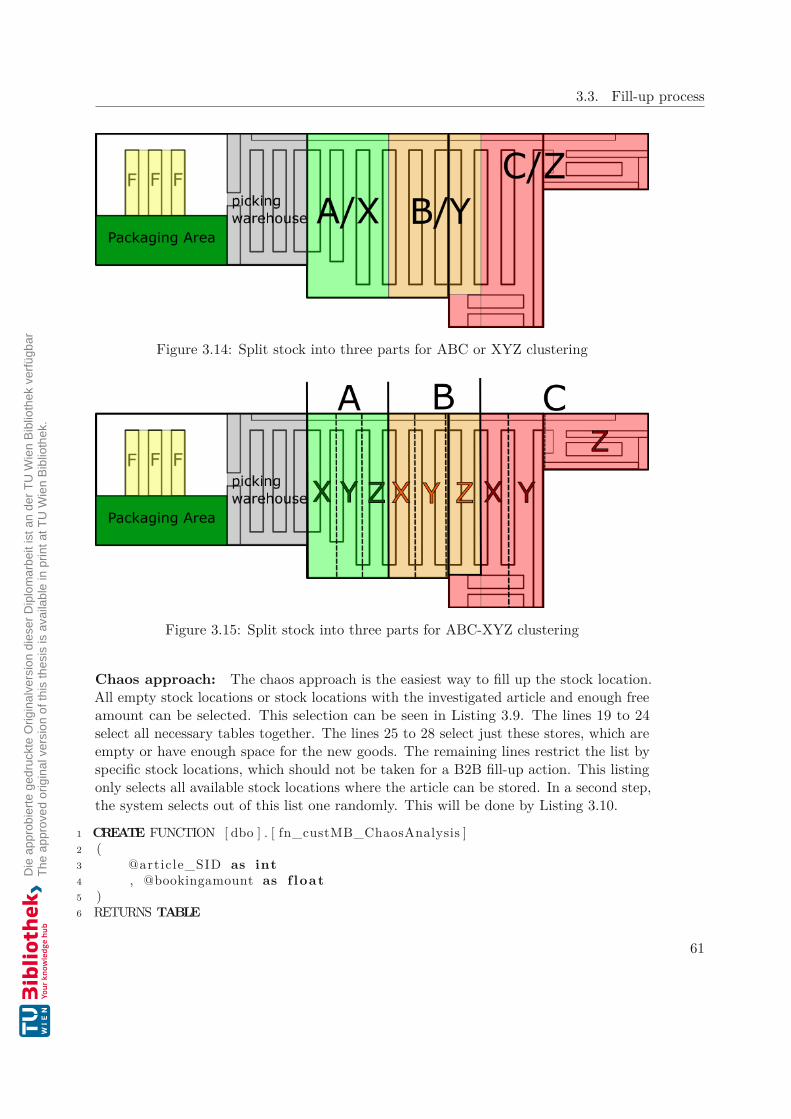
3.3. Fill-up process
Figure 3.14: Split stock into three parts for ABC or XYZ clustering
Figure 3.15: Split stock into three parts for ABC-XYZ clustering
Chaos approach: The chaos approach is the easiest way to fill up the stock location.All empty stock locations or stock locations with the investigated article and enough freeamount can be selected. This selection can be seen in Listing 3.9. The lines 19 to 24select all necessary tables together. The lines 25 to 28 select just these stores, which areempty or have enough space for the new goods. The remaining lines restrict the list byspecific stock locations, which should not be taken for a B2B fill-up action. This listingonly selects all available stock locations where the article can be stored. In a second step,the system selects out of this list one randomly. This will be done by Listing 3.10.
1 CREATE FUNCTION [ dbo ] . [ fn_custMB_ChaosAnalysis ]2 (3 @article_SID as int4 , @bookingamount as f loat5 )6 RETURNS TABLE
61

3. Implementation
7 AS8 RETURN9
10 select sgm . s i d as StoreGrpMain_SID11 , sg . SID as StoreGrp_SID12 , s . SID as Store_SID13 , sgm . aShortName as StoreGrpMain_aShortname14 , sg . aShortName as StoreGrp_aShortname15 , s . aShortName as Store_aShortName16 , s . AlertAmountMax1 as Store_AlertAmountMax117 , s t . FK_Article_SID as Article_SID18 , s t . Amount as Stock_Amount19 from s t o r e s20 inner join s t o r eg rp sg on sg . s i d = s . FK_StoreGrp_SID21 and s . FK_RecordState_SID in (0 , 10)22 inner join StoreGrpMain sgm on sgm . s i d = sg . FK_StoreGrpMain_SID23 and sgm . FK_RecordState_SID in (0 , 10)24 l e f t outer join vw_Stock s t on s t . FK_Store_SID = s . s i d25 where ( ( s t . FK_Article_SID = @article_SID26 and ( i s n u l l ( s t . Amount , 0) + i s n u l l ( @bookingamount , 0)27 <= i s n u l l ( AlertAmountMax1 , 9999) ) )28 or s t . StockGrouper i s null )29 and s . FK_RecordState_SID in (0 , 10)30 and sgm . aShortName in ( ' 10 ' )31 and sg . aShortName not l ike 'F%'32 and sg . ashortname not l ike 'K%'33 and sg . ashortname not l ike 'D%'34 and s . aShortName not l ike '%A '35 and s . aShortName not l ike '%B '36 and s . ashortname not l ike ' ? '37 GO
Listing 3.9: Selecting a stock location for an article by the chaos approach
1 select top 12 , StoreGrpMain_aShortname3 , StoreGrp_aShortname4 , Store_aShortName5 from (6 select StoreGrpMain_SID7 , StoreGrp_SID8 , Store_SID9 , StoreGrpMain_aShortname
10 , StoreGrp_aShortname11 , Store_aShortName12 , Store_AlertAmountMax113 , Article_SID14 , Stock_Amount15 , newid ( ) as id16 from [ fn_custMB_ChaosAnalysis](## a r t i c l e _ s i d##,
62
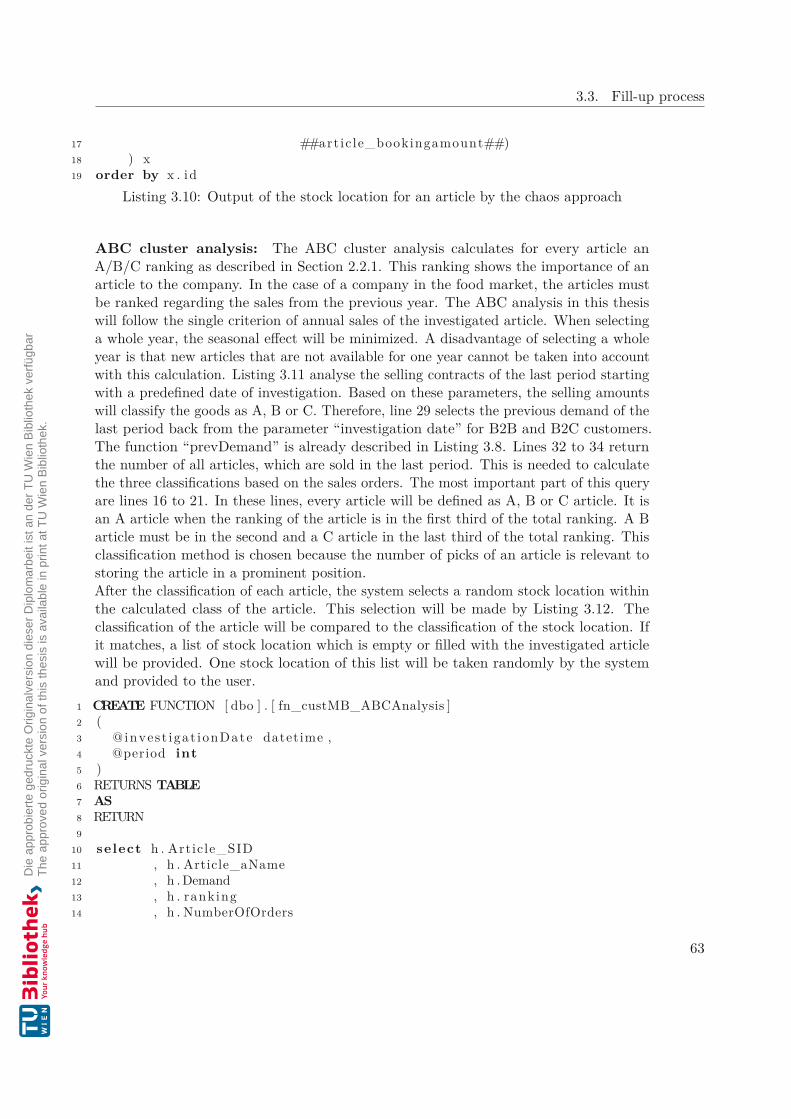
3.3. Fill-up process
17 ##artic le_bookingamount##)18 ) x19 order by x . id
Listing 3.10: Output of the stock location for an article by the chaos approach
ABC cluster analysis: The ABC cluster analysis calculates for every article anA/B/C ranking as described in Section 2.2.1. This ranking shows the importance of anarticle to the company. In the case of a company in the food market, the articles mustbe ranked regarding the sales from the previous year. The ABC analysis in this thesiswill follow the single criterion of annual sales of the investigated article. When selectinga whole year, the seasonal effect will be minimized. A disadvantage of selecting a wholeyear is that new articles that are not available for one year cannot be taken into accountwith this calculation. Listing 3.11 analyse the selling contracts of the last period startingwith a predefined date of investigation. Based on these parameters, the selling amountswill classify the goods as A, B or C. Therefore, line 29 selects the previous demand of thelast period back from the parameter “investigation date” for B2B and B2C customers.The function “prevDemand” is already described in Listing 3.8. Lines 32 to 34 returnthe number of all articles, which are sold in the last period. This is needed to calculatethe three classifications based on the sales orders. The most important part of this queryare lines 16 to 21. In these lines, every article will be defined as A, B or C article. It isan A article when the ranking of the article is in the first third of the total ranking. A Barticle must be in the second and a C article in the last third of the total ranking. Thisclassification method is chosen because the number of picks of an article is relevant tostoring the article in a prominent position.After the classification of each article, the system selects a random stock location withinthe calculated class of the article. This selection will be made by Listing 3.12. Theclassification of the article will be compared to the classification of the stock location. Ifit matches, a list of stock location which is empty or filled with the investigated articlewill be provided. One stock location of this list will be taken randomly by the systemand provided to the user.
1 CREATE FUNCTION [ dbo ] . [ fn_custMB_ABCAnalysis ]2 (3 @inves t igat ionDate datetime ,4 @period int5 )6 RETURNS TABLE7 AS8 RETURN9
10 select h . Article_SID11 , h . Article_aName12 , h . Demand13 , h . ranking14 , h . NumberOfOrders
63

3. Implementation
15 , maxcount . cnt16 , case17 when h . ranking <= ( maxcount . cnt /3) then 'A '18 when h . ranking >19 maxcount . cnt /320 and h . ranking <= (2∗( maxcount . cnt /3) ) then 'B '21 when h . ranking > (2∗( maxcount . cnt /3) ) then 'C '22 end as Class23 from (24 select Article_SID25 , Article_aName26 , sum(Demand) as Demand27 , RANK( ) over28 ( order by sum(demand) desc , a r t i c l e _ s i d asc ) as ranking29 , count ( Article_SID ) as NumberOfOrders30 from fn_custMB_prev_Demand31 ( @invest igat ionDate , @period , null , null )32 group by Article_SID , Article_aName33 ) as h34 , ( select count ( distinct a r t i c l e _ s i d ) cnt35 from fn_custmb_prev_demand36 ( @invest igat ionDate , @period , null , null )37 ) as maxCount38 group by h . Article_SID , h . Article_aName , h . Demand , h . ranking39 , h . NumberOfOrders , maxcount . cnt
Listing 3.11: Selecting a stock location for an article by the ABC cluster analysis
1 select top 1 sgm . ashortname , sg . aShortName , s . aShortName2 from f4mbs . dbo . fn_custMB_ABCAnalysis (GETDATE( ) , 12) cluster3 inner join f4mbs . dbo . s t o r e s4 on l e f t ( s . ext id , 1) = cluster . c l a s s5 inner join f4mbs . dbo . s t o r eg rp sg6 on sg . s i d = s . FK_StoreGrp_SID7 inner join f4mbs . dbo . storegrpmain sgm8 on sgm . s i d = sg . FK_StoreGrpMain_SID9 l e f t outer join f4mbs . dbo . vw_Stock s t
10 on s t . FK_Store_SID = s . s i d11 where cluster . a r t i c l e _ s i d = ##a r t i c l e _ s i d##12 and ( s t . StockGrouper i s null13 or s t . FK_Article_SID = cluster . a r t i c l e _ s i d )14 order by newid ( )
Listing 3.12: Output of the stock location for an article by the ABC cluster analysis
XYZ cluster analysis: Another clustering method is the XYZ approach. This ap-proach, described in Section 2.2.2, calculates a classification for every article as alreadydone in the ABC cluster analysis. The difference to the ABC analysis is that an XYZranking shows the prediction accuracy of the article. This will be done in this thesis by
64

3.3. Fill-up process
the single criterion of a standard deviation per month of an article of the last predefinedperiod. All average sales per month of the last period and the forecasting amount ofthe next month of the investigated date influence the standard deviation of an article.The predicted sales are based on the sales of previous periods and the rate of growth perarticle per customer. To create a meaningful classification, it is necessary to know whichtime period in the future can be taken into account. For the picking warehouse, justa few days are necessary. For the B2B warehouse, a few months should be taken intoaccount. This is because of the different sizes of each warehouse. Only the demand ofopen orders, which is described in Listing 3.3, can not be used because the open ordersreach several days in the future for the majority of the customers. Therefore, for a B2Bfill-up action, the forecasting method which is described in Section 3.3.3 will be used forcreating a useful calculation.Listing 3.13 shows the classification of the articles. Lines 21 to 32 select all articles andtheir sales per month over the last period. Lines 36 to 41 calculate the forecasting amountof the investigated article. Based on the standard deviation, which is calculated in line19, the article will be classified into X, Y and Z articles in lines 12 to 14. If an articlehad no sales in the last period, it gets the deviation of 999 and is automatically a Zarticle. An X article has a low deviation over time and can be predicted very well for thefuture. Therefore, the article can be planned for the upcoming periods. A Y article has amoderate deviation and the prediction of a Z article is very hard. The stock managers ofSonnentor decided, that they want to give an X article a more prominent stock locationthan a Y or a Z article. Based on the fact that the calculation can be done at everyfill-up action, the classification can change very fast but has to be as detailed as possible.The calculation at every fill-up action will be done in advance if the performance getsworse. This can happen if the number of selling contracts increases over time.
1 CREATE FUNCTION [ dbo ] . [ fn_custMB_XYZAnalysis ]2 (3 @invest igat ionDate datet ime4 )5 RETURNS TABLE6 AS7 RETURN89 select Article_SID
10 , Article_aName11 , case12 when Deviat ion >= 0 and Deviat ion < 25 then 'X '13 when Deviat ion >= 25 and Deviat ion < 50 then 'Y '14 when Deviat ion >= 50 then 'Z '15 end as Class16 from (17 select Article_SID18 , Article_aName19 , i s n u l l (STDEV( Selling_Amount ) , 999) as Deviat ion20 from (
65

3. Implementation
21 select a . SID as Article_SID22 , a . aname as Article_aName23 , month( c . s c h e d f i n i s h d a t e ) Month_Number24 , sum( cp . amountadmin ) Selling_Amount25 , ' Contract ' as Typ26 from cont rac t c27 inner join copos cp on cp . fk_contract_sid = c . s i d28 and cp . fk_records tate_s id = 029 inner join a r t i c l e a on a . s i d = cp . f k _ a r t i c l e _ s i d30 where c . fk_cont rac tve r s i on_s id in (5005 , 3)31 and c . SchedFinishDate32 >= dateadd ( year , −1, @inves t igat ionDate )33 group by a . s id , a . aname , month( c . s c h e d f i n i s h d a t e )3435 union a l l3637 select38 Article_SID39 , Article_aName40 , month( dateadd (month , 1 , @inves t igat ionDate ) )41 as Month_Number42 , ForecastingDemand as Selling_Amount43 , ' Foreca s t ing ' as Typ44 from fn_custMB_forecast45 ( @invest igat ionDate , 12 , 30 , null ) f o r e c a s t46 ) x47 group by Article_SID , Article_aName48 ) h
Listing 3.13: Selecting a stock location for an article by the XYZ cluster analysis
Listing 3.14 selects a specific stock location based on the XYZ analysis function. Eachstock location has the classification X, Y or Z, which is shown in Figure 3.14. Based onthe analysis function above, a random stock location with the same classification will beused. Line 3 and 4 create the connection between the analysis and the stock locationclassification.
1 select top 1 sgm . ashortname , sg . aShortName , s . aShortName2 from f4mbs . dbo . fn_custMB_XYZAnalysis (GETDATE( ) ) cluster3 l e f t outer join f4mbs . dbo . s t o r e s4 on substring ( s . ext id , 3 , 1) = cluster . c l a s s5 l e f t outer join f4mbs . dbo . s t o r eg rp sg6 on sg . s i d = s . FK_StoreGrp_SID7 l e f t outer join f4mbs . dbo . storegrpmain sgm8 on sgm . s i d = sg . FK_StoreGrpMain_SID9 l e f t outer join f4mbs . dbo . vw_Stock s t
10 on s t . FK_Store_SID = s . s i d11 where cluster . a r t i c l e _ s i d = ##a r t i c l e _ s i d##12 and ( s t . StockGrouper i s null13 or s t . FK_Article_SID = cluster . a r t i c l e _ s i d )
66

3.3. Fill-up process
14 order by newid ( )Listing 3.14: Output of the stock location for an article by the XYZ cluster analysis
ABC-XYZ cluster analysis The clustering methods above can be combined to theABC-XYZ analysis. As already described in Section 2.2.3, each article gets a classificationabout ABC and XYZ criteria. The classification per article means that, on the one hand,if the article has a high turnover ratio at the stock and, on the other hand, if the demandfor an article will be high in the next weeks. An A-Y classification will identify an articlewith a higher priority than an article with B-X classification. At Sonnentor, the stock issplit as described in Figure 3.15. Therefore, each ABC classification will be split into thethree XYZ parts. Listing 3.15 gets the value of the article from the ABC analysis in line17. Line 18 gets the value of the article from the XYZ analysis. The output combinesboth methods in line 16.
1 CREATE FUNCTION [ dbo ] . [ fn_custMB_ABCXYZAnalysis ]2 (3 @inves t igat ionDate datetime ,4 @period int5 )6 RETURNS TABLE7 AS8 RETURN9
10 select abc . Article_SID ,11 abc . Article_aName ,12 abc . Demand as PrevDemand ,13 abc . c l a s s as ABCClass ,14 xyz . ForecastingDemand as Pred ic t ion ,15 xyz . c l a s s as XYZClass ,16 abc . Class + xyz . Class as ABCXYZClass17 from fn_custMB_ABCAnalysis ( @invest igat ionDate , @period ) abc18 inner join fn_custMB_XYZAnalysis ( @invest igat ionDate ) xyz19 on xyz . Article_SID = abc . Article_SID
Listing 3.15: Selecting a stock location for an article by the ABC-XYZ cluster analysis
When the classification is done for each article, the system needs a specific stock locationfor the investigated article. This will be done with Listing 3.16. Lines 3 and 4 select allstock locations with the specific classification value from the database. When an articlewith B-Z classification arrives all stock locations that are defined as B-Z articles willbe selected. Lines 12 and 13 restrict the list to the empty stock locations or the stocklocations which is currently filled with the same article.
1 select top 1 sgm . ashortname , sg . aShortName , s . aShortName2 from f4mbs . dbo . fn_custMB_abcxyzanalysis (GETDATE( ) , 12) cluster3 inner join f4mbs . dbo . s t o r e s4 on substring ( s . ext id , 5 , 2) = cluster . ABCXYZClass
67
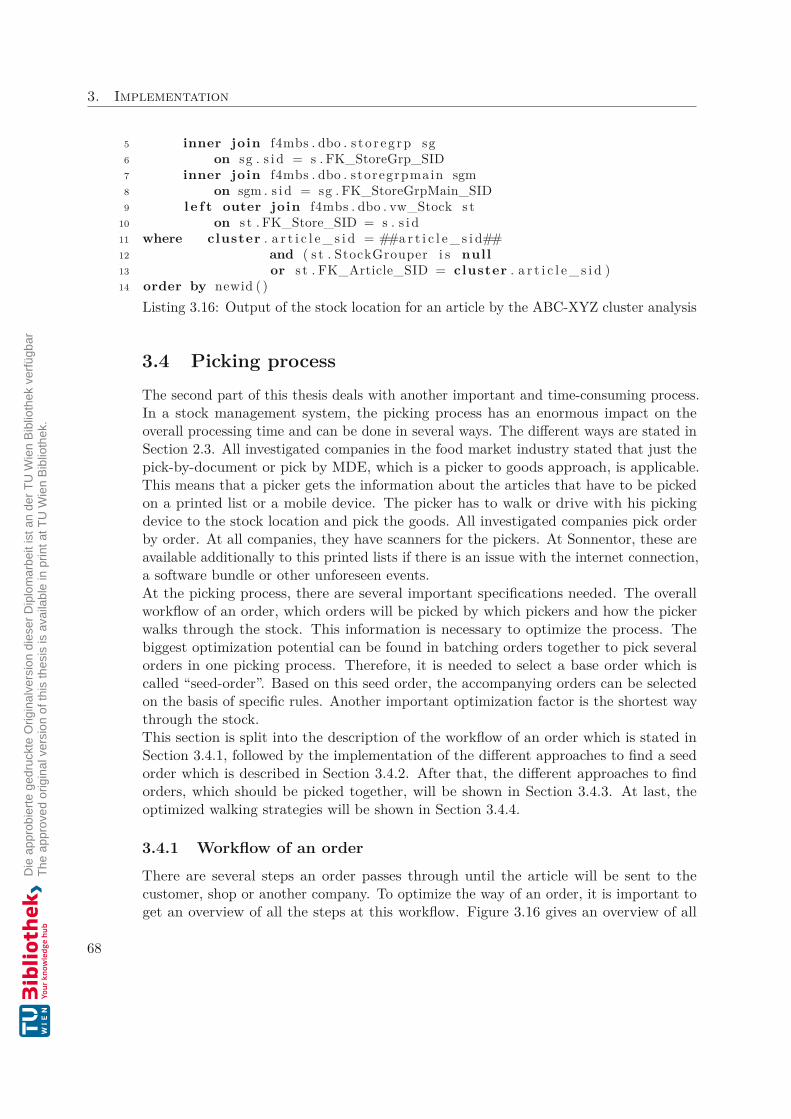
3. Implementation
5 inner join f4mbs . dbo . s t o r eg rp sg6 on sg . s i d = s . FK_StoreGrp_SID7 inner join f4mbs . dbo . storegrpmain sgm8 on sgm . s i d = sg . FK_StoreGrpMain_SID9 l e f t outer join f4mbs . dbo . vw_Stock s t
10 on s t . FK_Store_SID = s . s i d11 where cluster . a r t i c l e _ s i d = ##a r t i c l e _ s i d##12 and ( s t . StockGrouper i s null13 or s t . FK_Article_SID = cluster . a r t i c l e _ s i d )14 order by newid ( )
Listing 3.16: Output of the stock location for an article by the ABC-XYZ cluster analysis
3.4 Picking processThe second part of this thesis deals with another important and time-consuming process.In a stock management system, the picking process has an enormous impact on theoverall processing time and can be done in several ways. The different ways are stated inSection 2.3. All investigated companies in the food market industry stated that just thepick-by-document or pick by MDE, which is a picker to goods approach, is applicable.This means that a picker gets the information about the articles that have to be pickedon a printed list or a mobile device. The picker has to walk or drive with his pickingdevice to the stock location and pick the goods. All investigated companies pick orderby order. At all companies, they have scanners for the pickers. At Sonnentor, these areavailable additionally to this printed lists if there is an issue with the internet connection,a software bundle or other unforeseen events.At the picking process, there are several important specifications needed. The overallworkflow of an order, which orders will be picked by which pickers and how the pickerwalks through the stock. This information is necessary to optimize the process. Thebiggest optimization potential can be found in batching orders together to pick severalorders in one picking process. Therefore, it is needed to select a base order which iscalled “seed-order”. Based on this seed order, the accompanying orders can be selectedon the basis of specific rules. Another important optimization factor is the shortest waythrough the stock.This section is split into the description of the workflow of an order which is stated inSection 3.4.1, followed by the implementation of the different approaches to find a seedorder which is described in Section 3.4.2. After that, the different approaches to findorders, which should be picked together, will be shown in Section 3.4.3. At last, theoptimized walking strategies will be shown in Section 3.4.4.
3.4.1 Workflow of an orderThere are several steps an order passes through until the article will be sent to thecustomer, shop or another company. To optimize the way of an order, it is important toget an overview of all the steps at this workflow. Figure 3.16 gives an overview of all
68

3.4. Picking process
tasks and departments starting with the order in the online shop until the staff sends theparcel to the customer. The BPMN model shows the way of a B2C and B2B order atonce. The differentiation of the orders will be done after the order will be imported tothe ERP system.The customer order in the online shop is the first step of the whole process. At Sonnentor,there are two different online shops available. One is for B2C and one for B2B customers.The online shop and the ERP system are from different service providers and areinterlinked with an interface that exchanges the data cyclically. When the ERP systemreceives the data, all online shop orders will create one selling order in the system withthe customer information and the articles but without a department that will handlethis order. The department, which is shown as swim lanes in Figure 3.16, will be setto the orders when the customers are checked by the department “Auftragspruefung”.This department checks the customers’ liquidity and if there is no reason to deny thisorder, they create the call-off. During the creation of the call-off, an algorithm setsthe department of every call-off. The department depends on the customer group, theproduct group or the amount of the article. Currently, the B2B and B2C orders arehandled the same way. The picking persons get all orders on their scanner and haveto complete one after another. If an order contains a personalized article, the printingdepartment prints the corresponding label. The printing department also prints thelabels if the customer has a different language than German and English on demand.When the orders are picked from the warehouse, the parcel will be packed and sent tothe customer. At every point in time, the fill-up process can be done. Therefore, theperson sees the most urgent article to fill up in the warehouse on their scanner.Figure 3.17 shows the optimized version of the picking process. The way from the onlineshop through the department “checking orders” and creating of the call-off will be thesame. When every call-off has set the right department, the system should generatedifferent ways to handle B2B and B2C orders. B2B orders will be handled order byorder. This has to be done because the amount of the goods in these orders is too high topick more than one order simultaneously. The system generates, based on all open B2Corders, a predefined number of batch orders. This step will be done automatically every5 minutes by the system. The number of predefined batch orders in the system must beselected wisely. If the number of pre calculated batch orders is too high, it is possible thatsome orders are too long untouched in the system which may not be optimal regardingnew incoming orders. On the other hand if the number of pre calculated batch orders istoo short, it can be possible that picking persons have to wait until new batch orders areavailable. The turnover of batch orders needs to be high and should be calculated asoften as possible to include also the newest orders which comes to the system.
3.4.2 Seed orderTo create a batch order, it is necessary to have a base order, which forms the basis of sucha batch order. As stated in Section 2.4.1, there are different approaches available to selecta seed order. In the literature, there are many other approaches available. This thesiswill consider just the approaches which are relevant for a small or middle sized company
69

3. Implementation
Figure 3.16: The old workflow of an order at Sonnentor
70

3.4. Picking process
Figure 3.17: BPMN model of the new workflow of an order at Sonnentor
71

3. Implementation
in the food market industry. Other approaches can handle different stock locations ofone good. For all of the companies examined, this is not necessary because every goodhas just one stock location for picking at a time.The approaches which will be implemented and described in detail are:
• Random Rule
• Smallest/greatest number of picking locations (SNPL/GNPL)
• Smallest/greatest number of picking aisles (SNPA/GNPA)
Random rule
The random rule represents the simplest way to find a suitable seed order. Based on allopen selling contracts, one will be selected randomly as a seed order. This is the onlyapproach where the creator of the algorithm can not lead the system to an optimal batchorder. At some approaches to find accompanying orders, it can happen that orders witha special composition of goods can stay untouched in the system for a long time. Witha suitable approach of the seed order, this can be steered to an optimal way. At therandom approach, this can not be applied by the algorithm.Listing 3.17 shows the random selection of the seed order. Lines 5, 6, 7 and 9 restrictthe list of possible seed orders. These lines are responsible for checking whether theinvestigated order is already within a batch order. Lines 10 to 14 are a criterion ofexclusion to select just the right orders based on contract types, departments and datesof validity. Out of this list, in lines 15 to 17, the random selection will be made. In SQL,it is not possible to have a random selection within a function. Therefore, a new viewwhich returns a random number is provided.This listing returns a seed order in a return table. The return table can be used as abasis for the calculation of the accompanying orders in a later step.
1 DECLARE @sid int2 select top 1 @sid = c . s i d3 from f4mbs . dbo . CoPos cp4 inner join f4mbs . dbo . Contract c on c . SID=cp . fk_contract_sid5 l e f t outer join f4mbs . dbo . CoPos cpCol l ON6 cpCol l . SID = cp . f k_copos co l l e c t i on_s id7 AND cpCol l . FK_RecordState_SID = 08 where cp . FK_RecordState_SID=09 and cpCol l . SID IS NULL
10 and cp . FK_CoPosType_SID=211 and c . FK_ContractVersion_SID=500512 and i s n u l l ( c . FK_Department_SID,0)<>500613 and c . fk_enqstate_sid = 1014 and c . validFrom > ' 2019−01−01 '15 and c . s i d = (16 select s i d17 from f4mbs . dbo . vw_custmb_PickingSeedContract_NewID
72

3.4. Picking process
18 )Listing 3.17: Selection of a random seed order
Smallest/greatest number of picking locations
Another approach to finding a seed order is selecting the order with the smallest orgreatest number of picking locations. Selecting the seed order based on the smallestnumber of picking locations should not be used for a company with small and light goods.When taking the greatest number approach, it is easier to find similar orders which canbe batched. At the smallest number approach, it can happen that the orders with a highamount of different goods will stay untouched in the system because every time a usualorder comes in the system, it will match better to the seed order than an unexpectedorder. Therefore, for a company in the food market industry it is better to select thegreatest number of picking locations approach. This approach is shown in Listing 3.18.The structure is the same as in the random approach. Additionally to the randomselection, the GNPL approach selects just the order with the greatest number of differentstock locations. In the picking warehouse, every article has a separate stock location.Therefore, the SQL statement selects just the maximum number of different articles inthe order. This will be done by lines 17 to 31. The sub-select orders the list of openorders descending on the basis of the count of different articles. Line 18 returns the top 1order because more than one order may have the maximum number of different articles.
1 DECLARE @sid int23 select top 1 @sid = c . s i d4 from f4mbs . dbo . CoPos cp5 inner join f4mbs . dbo . Contract c on c . SID=cp . fk_contract_sid6 l e f t outer join f4mbs . dbo . CoPos cpCol l7 ON cpCol l . SID = cp . f k_copos co l l e c t i on_s id8 AND cpCol l . FK_RecordState_SID = 09 where cp . FK_RecordState_SID=0
10 and cpCol l . SID IS NULL11 and cp . FK_CoPosType_SID=212 and c . FK_ContractVersion_SID=500513 and i s n u l l ( c . FK_Department_SID,0)<>500614 and c . fk_enqstate_sid = 1015 and c . validFrom > ' 2019−01−01 '16 group by c . s i d17 having count ( cp . s i d ) = (18 select top 1 count ( distinct cp . s i d ) as MaxNumber19 from f4mbs . dbo . CoPos cp20 inner join f4mbs . dbo . Contract c on c . SID=cp . fk_contract_sid21 l e f t outer join f4mbs . dbo . CoPos cpCol l22 ON cpCol l . SID = cp . f k_copos co l l e c t i on_s id23 AND cpCol l . FK_RecordState_SID = 024 where cp . FK_RecordState_SID=0
73

3. Implementation
25 and cpCol l . SID IS NULL26 and cp . FK_CoPosType_SID=227 and c . FK_ContractVersion_SID=500528 and i s n u l l ( c . FK_Department_SID,0)<>500629 and c . fk_enqstate_sid = 1030 and c . validFrom > ' 2019−01−01 '31 group by c . s i d32 order by count ( cp . s i d ) desc33 )
Listing 3.18: Selecting a seed order by the GNPL approach
Smallest/greatest number of picking aisles
Similar to the GNPL approach is the smallest/greatest number of picking aisles func-tionality. The difference to the GNPL approach is that the number of different aislesis relevant for the calculation. In the literature, the smallest and greatest number ofpicking aisles are suitable approaches. Listing 3.19 shows the selection of a seed orderby the smallest number of picking aisles. The structure of the first 17 lines is similar tothe GNPL approach. In lines 18 to 38, the statement selects just these orders with theminimal number of different aisles a picker has to walk through when he has to pick thatorder. The ranking of the orders based on the different aisles is done in lines 21 and 22.These lines ranks the orders based on the column “flexstockcode2” which is the identifierfor the aisles in the database. It is possible to have more than one order with a minimumamount of different aisles. In that case, the system will pick the first one as a seed order.
1 DECLARE @sid int23 select top 1 @sid = c . s i d4 from f4mbs . dbo . CoPos cp5 inner join f4mbs . dbo . Contract c on c . SID=cp . fk_contract_sid6 inner join f4mbs . dbo . a r t i c l e a on a . s i d = cp . FK_Article_SID7 l e f t outer join f4mbs . dbo . CoPos cpCol l8 ON cpCol l . SID = cp . f k_copos co l l e c t i on_s id9 AND cpCol l . FK_RecordState_SID = 0
10 where cp . FK_RecordState_SID=011 and cpCol l . SID IS NULL12 and cp . FK_CoPosType_SID=213 and c . FK_ContractVersion_SID=500514 and i s n u l l ( c . FK_Department_SID,0)<>500615 and c . fk_enqstate_sid = 1016 and c . validFrom > ' 2019−01−01 '17 and c . s i d = (18 select top 1 x . s i d19 from (20 select c . s id ,21 dense_rank ( ) over22 ( order by count ( distinct a . f l e x s t o c k c o d e 2 ) )
74

3.4. Picking process
23 as ranking24 from f4mbs . dbo . CoPos cp25 inner join f4mbs . dbo . Contract c26 on c . SID=cp . fk_contract_sid27 inner join f4mbs . dbo . a r t i c l e a28 on a . s i d = cp . f k _ a r t i c l e _ s i d29 l e f t outer join f4mbs . dbo . CoPos cpCol l30 ON cpCol l . SID = cp . f k_copos co l l e c t i on_s id31 AND cpCol l . FK_RecordState_SID = 032 where cp . FK_RecordState_SID=033 and cpCol l . SID IS NULL34 and cp . FK_CoPosType_SID=235 and c . FK_ContractVersion_SID=500536 and i s n u l l ( c . FK_Department_SID,0)<>500637 and c . fk_enqstate_sid = 1038 and c . validFrom > ' 2019−01−01 '39 group by c . s i d40 ) x41 where x . ranking = 142 )
Listing 3.19: Selecting a seed order by the SNPA approach
The greatest number of picking aisles will be the same statement. Only the “order by”statement would change from ascending to descending. This will rank the maximumnumber of different aisles to the top.
Oldest order approach
After the first tests with the random, GNPL and SNPA approach, the results were notsatisfying enough. The companies examined promised the customers that the goodsarrive within three days. With the approaches above, it turned out that it is possiblethat an older order can stay untouched in the system. Therefore, an order may arrivelater than that promised three days at the customer’s address.The responsible stock managers from Sonnentor and the author of this thesis worked outthe oldest order approach. At this approach, the oldest order of the open selling contractswill be chosen as a seed order. This leads on the one hand to a good processing time ofthe orders and on the other hand, special orders with an unusual amount of goods orunusual goods will also be handled at a point in time and can not be lost.Listing 3.20 shows the SQL-script, which returns the oldest open order in the system,which is currently not picked. Line 10 checks if there is already an open collection ordercreated for this selling contract. Lines 11 and 12 ensure that just relevant positions willbe taken into account for the collection order, which must have a specific status. The lastline orders the contracts in an ascending order based on the creation date. This ensuresthe first-in-first-out principle and returns just the oldest contract. When selecting thefirst order of this ordered list, which is done in line 3, just one of the oldest orders will
75
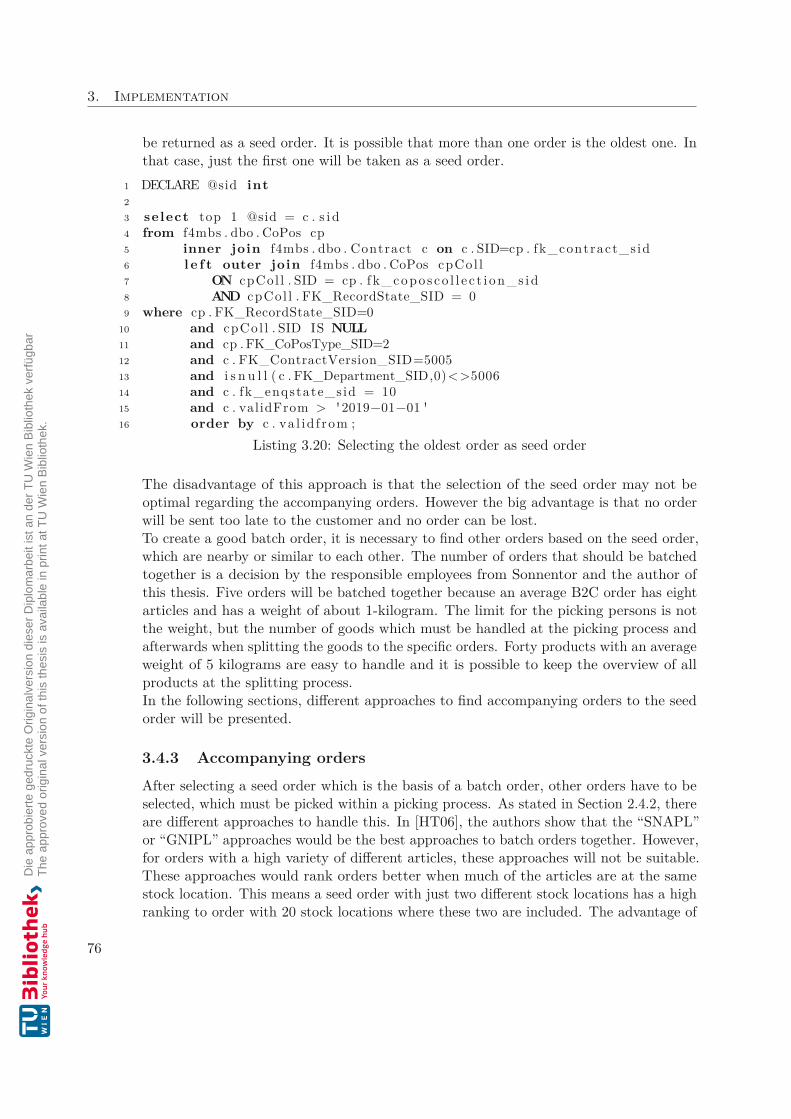
3. Implementation
be returned as a seed order. It is possible that more than one order is the oldest one. Inthat case, just the first one will be taken as a seed order.
1 DECLARE @sid int23 select top 1 @sid = c . s i d4 from f4mbs . dbo . CoPos cp5 inner join f4mbs . dbo . Contract c on c . SID=cp . fk_contract_sid6 l e f t outer join f4mbs . dbo . CoPos cpCol l7 ON cpCol l . SID = cp . f k_copos co l l e c t i on_s id8 AND cpCol l . FK_RecordState_SID = 09 where cp . FK_RecordState_SID=0
10 and cpCol l . SID IS NULL11 and cp . FK_CoPosType_SID=212 and c . FK_ContractVersion_SID=500513 and i s n u l l ( c . FK_Department_SID,0)<>500614 and c . fk_enqstate_sid = 1015 and c . validFrom > ' 2019−01−01 '16 order by c . va l id f rom ;
Listing 3.20: Selecting the oldest order as seed order
The disadvantage of this approach is that the selection of the seed order may not beoptimal regarding the accompanying orders. However the big advantage is that no orderwill be sent too late to the customer and no order can be lost.To create a good batch order, it is necessary to find other orders based on the seed order,which are nearby or similar to each other. The number of orders that should be batchedtogether is a decision by the responsible employees from Sonnentor and the author ofthis thesis. Five orders will be batched together because an average B2C order has eightarticles and has a weight of about 1-kilogram. The limit for the picking persons is notthe weight, but the number of goods which must be handled at the picking process andafterwards when splitting the goods to the specific orders. Forty products with an averageweight of 5 kilograms are easy to handle and it is possible to keep the overview of allproducts at the splitting process.In the following sections, different approaches to find accompanying orders to the seedorder will be presented.
3.4.3 Accompanying ordersAfter selecting a seed order which is the basis of a batch order, other orders have to beselected, which must be picked within a picking process. As stated in Section 2.4.2, thereare different approaches to handle this. In [HT06], the authors show that the “SNAPL”or “GNIPL” approaches would be the best approaches to batch orders together. However,for orders with a high variety of different articles, these approaches will not be suitable.These approaches would rank orders better when much of the articles are at the samestock location. This means a seed order with just two different stock locations has a highranking to order with 20 stock locations where these two are included. The advantage of
76

3.4. Picking process
the “GPLSR” approach is that the ratio of identical locations to the overall number ofarticles will be calculated. By calculating the ratio the number of different stock locationsin the seed and accompanying order will be taken into account too.The author of this thesis decided to implement and show the “Greatest picking-locationssimilarity ratio (GPLSR)” approach, which will be described in detail.
Greatest picking-location similarity ratio (GPLSR)
This approach calculates based on the seed order, which is selected by the oldest orderapproach, four accompanying orders. The workflow of an article gives the same stocklocations. For picking purposes, every article has exactly one stock location in the pickingwarehouse. Therefore, the different picking locations can be seen as different articlesin every order. This approach aims to find the most similar orders together based onthe number of different articles of the seed order and the number of same articles of theaccompanying order.This will be done by comparing all articles of the seed order to all articles of the openselling orders in the system. The higher the number of same goods and the higher theequality of the number of articles per order is, the higher the rating will be.
pts =nAi=0
mBi=0 f(Ai, Bi)tnpl
f(Ai, Bi) =1 Ai = Bi
0 Ai = Bi
Ai = articles from the seed orderBi = articles from the currently analysed order
n = number of articles in order Am = number of articles in order B
tnpl = total number of picking locations when order B is added the seed order
Listing 3.21 returns four orders with the highest number of the same articles based onthe base order. The statement is structured as a recursive function. In SQL, this is donewith the “with” table expression. This expression is split into two parts. The first partselects the whole list of possible orders, which can be batched to the seed order. Thispart is implemented in lines 1 to 17 of the Listing 3.21. The second part calculates, basedon the seed order and the list from the first part, the four best fitting orders. This isdone from lines 19 to 40. Line 33 and 35 take the seed order, which is stored at theparameter “@sid”. In line 35, the list of possible orders is joined to the seed order. Thecalculation, which order fits best to the seed order, is done in lines 28 to 31. These linescalculate the ratio of the number of same stock locations to the number of articles in theseed order. The result is a value that defines the percentage of identical articles, which is
77

3. Implementation
returned in column “pts”. All point ratings in column “pts” are ordered from highest tolowest. Line 22 returns the top four orders of this list.When the article identifier is the same in the seed order and the investigated order, thearticle and stock locations are identical.
1 with myCTE AS (2 select c . SID as SID ,3 cp . FK_Article_SID as FK_article_SID ,4 Count( cp . SID) over ( p a r t i t i o n by cp . FK_Contract_SID) as cnt5 from f4mbs . dbo . CoPos cp6 inner join f4mbs . dbo . Contract c on c . SID=cp . fk_contract_sid7 l e f t outer join f4mbs . dbo . CoPos cpCol l8 ON cpCol l . SID = cp . f k_copos co l l e c t i on_s id9 AND cpCol l . FK_RecordState_SID = 0
10 where cp . FK_RecordState_SID=011 and cpCol l . SID IS NULL12 and cp . FK_CoPosType_SID=213 and c . FK_ContractVersion_SID=500514 and i s n u l l ( c . FK_Department_SID,0)<>500615 and c . fk_enqstate_sid = 1016 and c . validFrom > ' 2019−01−01 '17 )1819 INSERT INTO @rtnTable ( s id , equals , pts )20 select B_SID, max( equa l s ) as equals , MAX( pts ) as pts21 from (22 select top 423 b . s i d AS B_SID,24 sum( case25 when A. FK_Article_SID = B. FK_Article_SID26 then 1 else 027 end) as equals ,28 100∗sum( case29 when A. FK_Article_SID = B. FK_Article_SID30 then 1 else 031 end)/A. cnt as pts32 , cast (b . SchedFinishDate as date ) as SchedFinishDate33 from myCTE A34 f u l l outer join myCTE B ON B. SID <> A. s i d35 where A. SID in ( @sid )36 and b . SchedFinishDate<GETDATE( )37 group by A. s id , B. s id , A. cnt , b . SchedFinishDate38 order by pts desc39 ) x40 group by B_SID
Listing 3.21: Selecting accompanying orders by the GPLSR approach
The limitation of this approach is that the grouped orders may always be one of thenewest ones. This leads to many orders in the system which will get older and older.
78

3.4. Picking process
Thus the customers may get the goods too late. Therefore, the approach will be extended,which is described in the following section.
Priority of older orders
To improve the “GPLSR” approach, it is necessary to change the disadvantages. Thebiggest disadvantage of the first approach is that older orders need to be more importantthan newer orders, since it is necessary to have a short processing time for every order.This can be done by extending the “GPLSR” approach by a rating. The system calculatesa rating out of the open orders and sorts it in descending order. Every day an order isnot picked and sent to the customer, the rating will be increased by a factor of 100. Thesystem takes the oldest order as the seed order and takes the other four orders based onthe rating. The base functionality of sum up the number of same articles stays the same.The height of the factor which has an impact on the rating is important. On the onehand, a factor too high leads to the fact that only old orders will be batched togetherwhen they do not fit the seed order, and on the other hand, a factor too low can lead tobatching only the newest orders together.The formula to calculate the pts value is extended by the difference to the current date.
pts =nAi=0
mBi=0 f(Ai, Bi) + DIF D·100
n
tnpl
f(Ai, Bi) =1 Ai = Bi
0 Ai = Bi
DIFD = difference of days from the current date to the date of the orderAi = articles from the seed order
Bi = articles from the currently analysed ordern = number of articles in order An = number of articles in order B
tnpl = total number of picking locations when order B is added the seed order
To adapt the difference of days, line 37 of Listing 3.22 is added. This line calculates thedifference between the current date to the date of the order. The difference in days willbe multiplied by the factor 100. Also, lines 3 to 11 were added, which return the orderdate to the second part. This date is used to calculate the difference of days. All otherlines stay the same. This ensures that an older order is ranked higher automatically. Atthis approach, a better fitting order can be ranked lower than an older order. The bigadvantage of this approach is that the orders arrives faster at the customer than in theusual approach.
1 with myCTE AS (2 select c . SID as SID ,
79
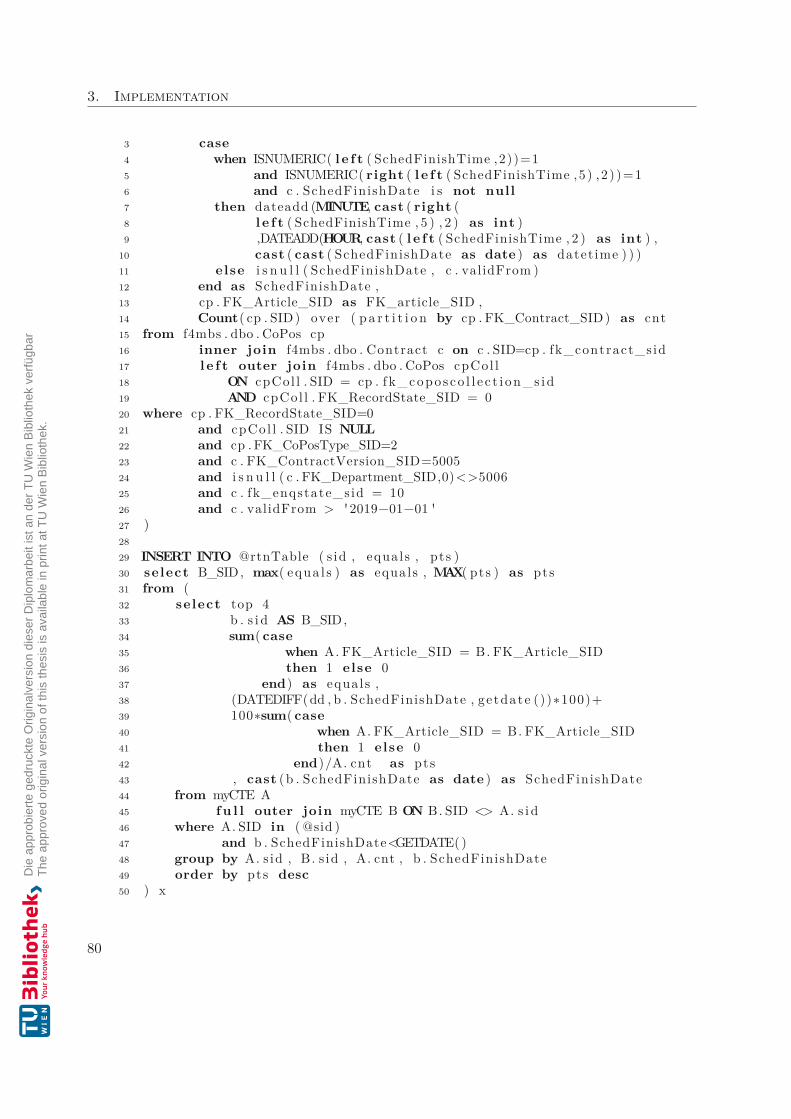
3. Implementation
3 case4 when ISNUMERIC( l e f t ( SchedFinishTime ,2))=15 and ISNUMERIC( right ( l e f t ( SchedFinishTime ,5 ) , 2 ) )=16 and c . SchedFinishDate i s not null7 then dateadd (MINUTE, cast ( right (8 l e f t ( SchedFinishTime , 5 ) , 2 ) as int )9 ,DATEADD(HOUR, cast ( l e f t ( SchedFinishTime , 2 ) as int ) ,
10 cast ( cast ( SchedFinishDate as date ) as datet ime ) ) )11 else i s n u l l ( SchedFinishDate , c . validFrom )12 end as SchedFinishDate ,13 cp . FK_Article_SID as FK_article_SID ,14 Count( cp . SID) over ( p a r t i t i o n by cp . FK_Contract_SID) as cnt15 from f4mbs . dbo . CoPos cp16 inner join f4mbs . dbo . Contract c on c . SID=cp . fk_contract_s id17 l e f t outer join f4mbs . dbo . CoPos cpCol l18 ON cpCol l . SID = cp . f k_copos co l l e c t i on_s id19 AND cpCol l . FK_RecordState_SID = 020 where cp . FK_RecordState_SID=021 and cpCol l . SID IS NULL22 and cp . FK_CoPosType_SID=223 and c . FK_ContractVersion_SID=500524 and i s n u l l ( c . FK_Department_SID,0)<>500625 and c . fk_enqstate_sid = 1026 and c . validFrom > ' 2019−01−01 '27 )2829 INSERT INTO @rtnTable ( s id , equals , pts )30 select B_SID, max( equa l s ) as equals , MAX( pts ) as pts31 from (32 select top 433 b . s i d AS B_SID,34 sum( case35 when A. FK_Article_SID = B. FK_Article_SID36 then 1 else 037 end) as equals ,38 (DATEDIFF(dd , b . SchedFinishDate , getdate ())∗100)+39 100∗sum( case40 when A. FK_Article_SID = B. FK_Article_SID41 then 1 else 042 end)/A. cnt as pts43 , cast (b . SchedFinishDate as date ) as SchedFinishDate44 from myCTE A45 f u l l outer join myCTE B ON B. SID <> A. s i d46 where A. SID in ( @sid )47 and b . SchedFinishDate<GETDATE( )48 group by A. s id , B. s id , A. cnt , b . SchedFinishDate49 order by pts desc50 ) x
80
3.4. Picking process
51 group by B_SIDListing 3.22: Selecting accompanying orders by the GPLSR approach and prior olderorders
After creating a batch order, it is necessary to think about the fastest way through thestock for the picking person. This leads to a more optimized picking workflow. Thedifferent approaches to walk through the stock will be described in the following section.
3.4.4 Shortest ways among articlesTo find an optimized way through the stock means that every picking person walksjust those distances that he/she needs to walk. The sequence of stock locations can beprovided by the system and leads the picker through the stock in an optimal way.There are many different ways to create an optimized way through the stock, which arestated in Section 2.6. Nevertheless, not only the approach how to walk through the stockis important. Also, the structure of the stock and company policies have an impact onthe approach. This information will be handled in Section 2.5. If there are aisles that arereserved for walking personnel only or the different aisles have a specified direction theapproach is another one than a stock, where every aisle has just one entrance and exit.All companies investigated stated that there is no restriction which persons or machinesare allowed in a specific aisle. Also, there is no direction given and the aisles are opento both sides. The picking and fill-up persons are allowed to use every aisle in everydirection.To achieve the different ways through the stock, it is necessary to train the employeeson the one hand where they have to walk and on the other hand to adapt the stockmanagement system.
S-shape strategy
For the “S-shape” strategy, a new picking order number is implemented. This newnumbering of the stock locations guides the employee through the stock. The employeehimself/herself needs to know whether or not to skip aisles. A stock management systemshows the employee the next stock location.For this strategy, the stock location will be ordered in the way the picker needs towalk. The new number does not take the level of stock location into account. In thepicking warehouse for B2C customers, all goods must be stored in levels a picking personcan reach without any mechanical support. The fill-up approaches ensure this. Thenumbering is shown in Figure 3.18.
The allocation of the numbers was done by the responsible persons from Sonnentortogether with the author of this thesis. This needs to be done once to create a usefulway through the stock. After that, the numbers were allocated to the stock locationsby creating a rank over the order number to fill up the positions. The difference to thisorder number is that it must be independent of the level of the stock location. In the
81

3. Implementation
Figure 3.18: Allocation of order numbers for the S-Shape strategy
picking warehouse for B2C customers, only the first few levels are reachable for a personwithout any mechanical assistance. This is already differentiated by the fill-up action.Listing 3.23 shows the allocation of the new order number for the “S-Shape strategy”.Lines 5 to 20 select just the necessary stock locations which are used by the B2C pickingaction. In line 6 a grouping information is created to delete the level of the stock location,which is given by the last letter. Line 2 and 3 return a number ordered by the ordernumber of the fill-up process. This listing returns a list from 1 to the number of stocklocations in the picking warehouse.
1 select s . s i d2 , dense_rank ( ) over3 ( order by x . minimumOrderNumberInventory ) as myRanking4 from (5 select dist inct6 l e f t ( s . aname , l en ( s . aname) − 1) as StoreLocat ion7 , min( s . orderNumberInventory )8 as minimumOrderNumberInventory9 from t ranspos tp
10 inner join t rans t11 on t . s i d = tp . fk_trans_sid12 and tp . FK_RecordState_SID = 013 and t . FK_Action_SID = 502514 inner join s t o r e s
82

3.4. Picking process
15 on s . s i d = tp . FK_Store_SID16 and s . FK_RecordState_SID = 017 inner join s t o r eg rp sg18 on sg . s i d = s . FK_StoreGrp_SID19 and sg . FK_RecordState_SID = 020 where tp . FK_RecordState_SID = 021 group by s . aname22 ) x23 inner join s t o r e s24 on l e f t ( s . aname , l en ( s . aname) − 1) = x . StoreLocat ion
Listing 3.23: Allocating the order numbers for the s-shape strategy
After the new order numbers are allocated, each picking process can guide the pickingperson through the stock based on this number. Listing 3.24 returns an ordered listbased on the new order numbers. The system gets this list for the currently investigatedcontract and shows this ordering on the scanner of the picking persons.
1 select c . s id , tmp . myRanking2 from cont rac t c3 inner join copos cp4 on cp . fk_contract_sid = c . s i d and cp . FK_RecordState_SID = 05 inner join a r t i c l e a6 on a . s i d = cp . FK_Article_SID7 inner join s t o r e s8 on s . aname = a . f l exStockCode1 + '− '9 + a . f lexStockCode2 + '− ' + a . f l exStockCode3
10 inner join Store_Order ingPicking tmp11 on tmp . s i d = s . s i d12 where c . fk_cont rac tve r s i on_s id = ##contract_s id##13 and c . FK_RecordState_SID = 014 order by tmp . myRanking
Listing 3.24: Ordered list of the orders based on the order numbers for the s-shapestrategy
Return methods
The return methods will not be described in detail because this approach is just forcompanies with an aisle with one entrance/exit available. No company interviewed hasa structure like this. Moreover, this warehouse design is very rare because of the highaccident probability at high access frequencies to the stock locations. The aisles alsohave to be wide to drive easily and safely with a stacker.
Mid-point heuristic
For the “mid-point” heuristic, another order number approach is necessary. An invisibleline in the middle of each aisle will be implemented. The picking persons are not allowed
83

3. Implementation
to cross this line. Figure 3.19 shows the approach to allocate the new order numbers tothe stock locations. The picking person starts with the upper half of the stock, wherethe numbers are starting from 1 to 16. When all articles are picked in the upper half,he/she will change to the other side. In the last aisle where the picker changes the sides,he/she can pick the goods from all stock locations in this aisle. Therefore, the numberingis continuous in the last aisle. The order numbers in the lower half are from 33 to 48 inthis example. At this implementation, the order numbers will be ordered from lowest tohighest, so every picking person will start at the upper half and end in the lower half ofthe stock where he/she starts to pick the goods.
Figure 3.19: Allocation of order numbers for the “mid-point” heuristic
In Listing 3.25, the allocation of the order numbers for the “mid-point” heuristic willbe shown. There are several steps to achieve this. The basis of this statement is theorder number from the “S-shape” strategy. Only the stock locations from the pickingwarehouse will be selected. This is done in lines 48 to 65. Every aisle will be split intothe first half and the second half. To achieve this, the mid-point of every aisle will becalculated by lines 22 to 31. In lines 11 to 14, every stock location gets the classificationin the first or the second half of the aisle. Lines 2 to 6 allocate the numbers to thestock locations by ordering the first half ascending and the second half descending. Thenumbering starts with one and ends with the number of stock locations in the pickingwarehouse.
1 select y . StoreLocat ion2 , y . numbering3 , y . minordernumberinventory
84

3.4. Picking process
4 , y . h a l f5 , dense_rank ( ) over ( p a r t i t i o n by y . h a l f6 order by case when y . h a l f = ' f i r s t ␣ h a l f '7 then y . minordernumberinventory end asc ,8 case when y . h a l f = ' second ␣ h a l f '9 then y . minordernumberinventory end desc )
10 as ranking11 from (12 select x . StoreLocat ion13 , x . numbering14 , x . minordernumberinventory15 , case16 when x . numbering <= x . AverageStoragePerAis le17 then ' f i r s t ␣ h a l f '18 else ' second ␣ h a l f '19 end as h a l f20 from (21 select distinct l e f t ( s . aname , l en ( s . aname) − 1)22 as StoreLocat ion23 , cast ( right ( l e f t ( s . aname , l en ( s . aname) − 1) , 3)24 as integer )25 as numbering26 , min( s . ordernumberinventory )27 as minordernumberinventory28 , (29 select avg ( cast ( l e f t ( s t . ashortname , 3) as int ) )30 as averageStore s31 from s t o r e s t32 inner join s t o r eg rp s tg33 on s tg . s i d = s t . FK_StoreGrp_SID34 and s tg . FK_RecordState_SID = 035 where s t . aname l ike concat ( l e f t ( s t . aname , 3 ) , '%' )36 and s t . FK_RecordState_SID = 037 and s tg . aname = sg . aname38 and i snumer i c ( l e f t ( s t . ashortname , 3 ) ) = 139 group by s tg . aname40 ) as AverageStoragePerAis l e41 from t ranspos tp42 inner join t rans t43 on t . s i d = tp . fk_trans_sid44 and tp . FK_RecordState_SID = 045 and t . FK_Action_SID = 502546 inner join s t o r e s47 on s . s i d = tp . FK_Store_SID48 and s . FK_RecordState_SID = 049 inner join s t o r eg rp sg50 on sg . s i d = s . FK_StoreGrp_SID51 and sg . FK_RecordState_SID = 052 where tp . FK_RecordState_SID = 0
85

3. Implementation
53 group by l e f t ( s . aname , l en ( s . aname) − 1) , sg . aname54 ) x55 where x . StoreLocat ion in56 ( select dist inct l e f t ( s . aname , l en ( s . aname) − 1)57 from (58 select distinct59 l e f t ( s . aname , l en ( s . aname) − 1)60 as StoreLocat ion61 from t ranspos tp62 inner join t rans t63 on t . s i d = tp . fk_trans_sid64 and tp . FK_RecordState_SID = 065 and t . FK_Action_SID = 502566 inner join s t o r e s67 on s . s i d = tp . FK_Store_SID68 and s . FK_RecordState_SID = 069 inner join s t o r eg rp sg70 on sg . s i d = s . FK_StoreGrp_SID71 and sg . FK_RecordState_SID = 072 where tp . FK_RecordState_SID = 0 and tp . source = 173 group by s . aname74 ) x75 inner join s t o r e s76 on l e f t ( s . aname , l en ( s . aname) − 1) = x . StoreLocat ion77 where i snumer i c ( l e f t ( s . aShortName , 3 ) ) = 178 )79 ) y
Listing 3.25: Allocating the order numbers to the stock location for the “mid-point”heuristic
Same as in the “S-shape” strategy, the system gets an ordered list based on the ordernumbers, which are defined for the “mid-point” heuristic. The scanner of the pickingperson gets this list and guides the picking person through the stock. This is shown inListing 3.24.
86

CHAPTER 4Evaluation
This chapter, on the one hand, gives an overview of the important parameters whichare evaluated at the qualitative analysis by interviewing the responsible stock managersfrom the companies Sonnentor, Kiennast and Kastner and, on the other hand, theoptimization potential of the fill-up and picking process. These both parts are the mosttime-consuming processes of a stock management system. The result will be shown indetail. The optimization potential reflects all parts of the implementation. I will analyseall steps to create a stock management system in an optimal manner.
4.1 Important parameters for fill-up and pickingprocesses
There are some important parameters of companies in the food market industry that aredifferent to other industries. These parameters are necessary for a fill-up and pickingprocesses. Some of these parameters are not only for the food market industry andcan also be taken for other industries. Most of the parameters are fixed and will notchange too often. Therefore, the stock management can expect that as fixed for thedifferent processes. During the interviews and implementation, the following parametersare identified:
Numbering of the stock locations
One of the most important things is the numbering of the stock locations. Based on thatorder number, the stock management guide the picking persons through the stock. Forevery different way strategy, there is another order number approach implemented atthe stock management system. This order of stock locations also defines the priority ofa stock location. If the order number of the stock location is low, the stock location iscloser to the packing tables than a stock location with a higher order number.
87

4. Evaluation
Cluster of the stock locations
Every stock location needs to also have a cluster. This is needed for the ABC, XYZ orthe combined ABC-XYZ fill-up approach. At the ABC and XYZ approach, the clusterhas just one letter. At the combined approach, the cluster of the stock location musthave two letters. The classification of the stock location also defines the priority of astock location to the company. Compared to the order number, this priority has fixedthresholds where one cluster ends and the next begins.
Availability of an external warehouse
This information is needed when implementing the order numbers of the stock locations.When there is an external warehouse available, the order numbers must manage these“costs” to bring goods from one warehouse to another. When implementing the prototype,the number between the different warehouses will differentiate by 106. Nevertheless, notonly this order number is essential for the most needed article. Also, the expiration datehas an impact on that. If the expiration date is lower than the batches in the main stock,this batch will appear for the fill-up process. The fill-up person does not drive to theother warehouse but will inform the stock manager to plan the truck. This good will belocked for the upcoming fill-up processes.
Working time
The working time is only needed to lower the burden of the servers. When nobody isworking, the pre-calculation of some steps is not needed. On the other side, when allpeople are working, the system has to provide enough batch orders for all picking persons.
Investigated time period into past
This is a decision that needs to be made by the responsible stock managers. At theimplementation of the prototype, it turned out that the orders of the past year shouldbe taken into account. Based on that data, the seasonal fluctuations can be minimized.This data can be used for the fill-up approach to calculate the priority of and forecast forthe different articles. If the main part of the customers is B2C clients, the variation ofthe orders will be by month and not by days or weeks. Therefore, a time horizon startingwith one month for forecasting is needed to include all fluctuations into the calculations.
Way strategy
When optimizing the ways of picking persons, it is necessary to provide the wanted waystrategy to the system. This is needed to take the right order numbers into account whenhaving different strategies implemented.
88
4.1. Important parameters for fill-up and picking processes
Partition of the stock
The partition of the stock means that some companies in the food market industrydifferentiate between the main warehouse and the warehouse for picking purposes only.This part of the warehouse is just available for B2C customers’ orders and holds justthe stock for one or two days. At Sonnentor, this part of the warehouse has a separatedescription.
Type of the racking system
When filling up or picking goods from a stock location, there is a difference in the rackingsystem. At a pallet rack, the fill-up and picking persons access the stock location fromthe same side. A flow rack will be filled on the backside and picked from the front. Theorder numbers must handle this circumstance for the different processes.
Amounts per stock location
Different amounts per stock location have an impact on the calculation of the mostneeded article to fill up. The maximum amount of a stock location defines the maximumamount of an article that can be held at this stock location. This number is fixed andcan not be changed without any remodelling of the racks. The minimum amount is athreshold that defines when the good must be filled up. At the implementation, thedifference between the actual amount and the minimum amount is also taken into accountto create a ranking of the needed articles. The actual stock amount is also important.These parameters must be provided by the system and show the number of actuallystored articles in that stock location.
Status of the stock location
The status of the stock location is for companies in the food market industry. It canhappen that a batch does not reach the quality standards or have unhealthy ingredients.Therefore, the stock location must be quarantined or locked. No person can pick or fill upon this stock location until the quality department unlocks this batch or stock location.The status defines if this stock location is only for locked batches or not.
Article in quarantine
If a quarantined article is allowed on all stock locations, the information is essential forthe processes if a batch is locked. If the quality department finds some abnormalities inthe articles, it will lock the batch. No person is allowed to pick or send the goods to thecustomers.
Expiration date
One of the most important parameters is the expiration date of the batch. This differen-tiates from other industries because this parameter can cause problems when not taken
89

4. Evaluation
into account. The expiration date is relevant for all processes in the company.
Packing units
The different articles can be packed in different packing units. At Sonnentor, the mainpacking units are 1, 6 and 41 pieces per unit, but special goods can also have otherpacking units. This information is needed when calculating the number of filled-uparticles per stock location of which article packages must be picked for a specific customerorder.
Language
Every article of the companies examined is available in different languages. The workflowhow to handle this circumstance is different within the companies. One possibility tohandle this is to have a separate stock location. The other one is to store unlabelledarticles and label them when the order arrives. For both workflows, the stock managementsystem must know where to get an article for the specific language.
Actual open orders
When calculating a forecasting demand or the priority of an article, the stock managementsystem has to know the open orders which are already in the system. These are B2Corders which have a smaller amount of articles and must be sent as fast as possible, andB2B orders which can be planned a month or a year in advance.
Growing rates
For the forecasting functionality, it is needed to define growth rates. These growthrates will be taken into account when calculating the demand for the upcoming periods.Growing rates can be defined for articles, product groups, partners, partner groups orpartners for a specific product. As fall back, every article should have a predefinedstandard growing rate, which will be considered when no specific growth rate is defined.
Clustering method
To fill-up the right articles into the right stock location, the stock management systemmust know, which clustering method will be used. This can be different from companyto company. The clustering method is needed for creating the right clusters through thestock.
Status of the picking process
It may be possible that a picking process can not be finished. This can happen whenthe article is not available at the stock location, which it should be. When a pick-ing person accidentally picks a higher amount than needed for one order, a difference
90
4.2. Fill-up process
between the amount of the stock management system and the real stock amount can occur.
These parameters are important factors for implementing a semi-autonomous stockmanagement system. The optimization potential of such processes will be shown in thenext steps of this thesis.
4.2 Fill-up processTo reach the goal of an optimized fill-up action, it is necessary to classify all stock locationsinto specific classes. Therefore, every stock location will get a specific classificationpresented in the specific clustering approach. Over 2,500 stock locations of the mainstock of Sonnentor are classified in this step. There are more stock locations available atSonnentor, but the classification should be done separately in every stock unit. A stockunit can be the part of the warehouse that holds the greige goods or where all commercialarticles will be stored. At Sonnentor, this type of stock is different. At companies withoutdifferentiation between commercial articles and greige goods, the partitioning of thewarehouse will be done by defining different zones with different temperature levels. Thisis also the workflow, how the goods will enter the company. Different articles will also bedelivered by trucks with different temperature levels. No supplier or farmer will bringdifferent types of goods to the company.The frequency of the calculation is also important and influences the results. There areapproaches to create the classification just once per predefined period. This time periodmay not be too long. A too long time period leads to non-useful data. The author ofthis thesis designed the calculation of the classification in a way that every fill-up actionwill calculate the classification new. This leads to data in real-time and will provide thebest possible data for filling up. When the fill-up actions and the sales data increase, thedata should be pre-calculated. This can be done once a day.
4.2.1 ABC-analysisThe ABC cluster analysis shows if an article is significant or insignificant to the company.This will be done by defining a classification A, B or C for every article. The significantarticles get the A and an insignificant article has the rating of C. Based on the demandof previous periods, it is possible to create this classification. It is important which timeperiod will be taken into account for the calculation of the classification. A time periodtoo short leads to a less useful classification. The seasonal fluctuation will not be takeninto account when evaluating the last month. A time period too long is also not usefulbecause the article will be abandoned over time. If the time period of the last ten yearswill be taken into account to classify the articles, most of the articles will not have arating because most of the articles have only been active for a few years. Therefore, thetime period of one year will be taken into account. This ensures the correct handling ofseasonal fluctuations of specific articles and that most of the articles will get a usefulrating over time.
91

4. Evaluation
For the ABC analysis, the stock location will split into three parts. The classificationwas done by the responsible stock manager of Sonnentor and the author of this thesis.By having a plan of the whole stock, every stock location or whole corridor was specifiedinto one of the three classes. This leads to the distribution of stock locations throughthe different classes, which are shown in Figure 4.1. The specific partitions of the wholestock will be shown graphically in Figure 3.14.
Figure 4.1: Distribution of Stock locations through the classification A, B and C
Based on the previous year’s demand for every article, the author was able to classify thearticles into A, B and C articles. Therefore, the demand for every article will be sortedin descending order and will split into three same-sized partitions. Thus, it is no surpriseto get the distribution of the articles through the classifications that have the same size.Figure 4.2 shows, on the one hand, how many articles are available in every class and,on the other hand, the thresholds for reaching the next higher class. To get a A rating,the article must be sold over 1,117 times in one year. This figure is also interesting tocompare the demands of the articles in the different classes. The article with the highestdemand is sold over 116,000 times per year. On the other end of the A scale, it is alsopossible to get an A rating, just with 1,117 sales per year.
Figure 4.2: Distribution of Articles through the classification A, B and C
The figures above show that there are more articles in class A than stock locationsavailable. This can happen all the time. A functionality must ensure that an A articlethat has no stock location within class A must be stored in the next class B and a Barticle must be stored in C if there is no suitable stock location available. The goalshould be that there is enough free stock location available in every group at any pointin time. This can be done by extending the stock.Based on the data above it is possible to show the significance of an A article for Sonnentor.94.4 percent of the articles which will be sold have the classification A, 5.4 percent havethe classification B and only 0.2 percent of the articles have a C rating. This data willbe shown in Table 4.1 and is based on the sales amount of commercial articles for thelast year.Another statistic can be done with the invoicing data of these articles. Based on thetotal turnover with this articles, it is possible to calculate the ratio of the classes based
92

4.2. Fill-up process
Class PercentageA 94.4%B 5.4%C 0.2%
Table 4.1: Distribution of articles based on the classification based on overall sales ofcommercial articles
Class PercentageA 82.8%B 9.2%C 8.0%
Table 4.2: Distribution of articles based on the classification based on total turnover ofcommercial articles
on the total turnover. Table 4.2 shows that over 80 percent of the total turnover will beachieved with articles within class A, 9.2 percent with B articles and articles within classC will generate 8 percent of the total turnover.
4.2.2 XYZ-analysisAnother classification method is the XYZ analysis. The difference to the ABC approachis that the XYZ analysis shows the predictability of an article. An X article has highreliability, whereas a Y article has a moderate and a Z article has a low predictionaccuracy for the upcoming time. This means that an article with a steady course basedon the sales amount during a predefined time period will be ranked as X article and anarticle with a high seasonal fluctuation will be ranked as Z article. Articles without anysales or where the forecasting can not be calculated will be ranked as Z automatically.The XYZ analysis will be influenced, on the one hand, by the demand of previous periodsand, on the other hand, the forecasting demand. The forecasting demand for every articleincludes the demand of previous periods, the open selling contracts in the system, thepredicted growth rates for a specific customer and a predicted growth rate for a specificarticle.Also, at the XYZ analysis, the time period has a big impact on the data. Same as inthe ABC analysis, a time period too short can lead to seasonally unadjusted data. Asan example the advent calendar can be provided, which is only sold in November andDecember. When having a look at the XYZ rating in January within a time periodof one month, the advent calendar will appear as a X article. But in January, theadvent calendars will not be sold any more. When taking a whole year into account, thecalculation will be based on the selling data of one whole year and this will smooth theseasonal fluctuation. Therefore, one year will be taken into account when calculating anXYZ analysis for an article.Same as in the ABC analysis, the stock location were classified as XYZ places by the
93

4. Evaluation
responsible persons from Sonnentor together with the author of this thesis. This leads tothe distribution, which is shown in Figure 4.3.
Figure 4.3: Distribution of Stock locations through the classification X, Y and Z
Different from the ABC approach, fixed thresholds will split the data into three parts.The calculation based on the previous demand and forecasting amount will be done forevery month for every article of the last year. Based on this list, the standard deviationof every article will be calculated. If the standard deviation is between 0 and 25, thearticle is ranked as a X article, between 25 and 50 the article will be ranked as Y andover 50 the article will be classified as a Z article. Figure 4.4 shows how many article willbe classified in which specific partition and which standard deviation an article needs toget in a specific class.
Figure 4.4: Distribution of Articles through the classification X, Y and Z
Same as in the ABC cluster analysis, there are more articles in the classes X and Z thanthere are stock locations. There are four ways to fix that:
1. Extending the stock and provide more stock locations for all classes.
2. Shift the fixed thresholds to other values to ensure that there are enough stocklocations available. This does not ensure that this situation does not happen again.
3. Reduce the number of articles that will be sold over one year.
4. New articles should not be classified as Z articles and store them based on thechaos principle if there is no experience available.
Figure 4.5 shows the ratio of articles in a specific class. This leads to the questions, whythe Y classification takes just a small part of the whole articles and how this can bechanged. Removing all new articles will lead to the data given in Figure 4.6.
This shows that the ratio of Y and Z articles will be approximately the same, but the Xarticles will increase because the number of articles will decrease, and the number of X
94

4.2. Fill-up process
Figure 4.5: Distribution of Articles through the classification X, Y and Z
Figure 4.6: Distribution of Articles through the classification X, Y and Z without newarticles
articles stays the same. As seen in the data, it is no reasonable approach to remove thenew articles.
Another way is to shift the thresholds of the standard deviation. When all articles with astandard deviation between 0 and 3 will be classified as X, between 3 and 50 are rankedas Y and over 50 the article will be rated as an Z article, the distribution looks balanced.In this approach, the new articles will be classified as Z articles to lose no data. The datashows that there are many articles with nearly no deviation from the average. This meansthat most articles are not affected by seasonal fluctuations and are consequently morereliable for future calculations. Figure 4.7 shows the data with the shifted thresholds,followed by Figure 4.8, which shows the number of articles in the different classifications.
To get an overview how the selling amounts of an X, Y and Z article look like, Figures4.9, 4.10 and 4.11 show the deviation of an article over a year in the different classes.The X-axis shows the months and the Y-axis the selling amount in the specific month.In each class are three articles shown for the specific classification as representatives.
The calculation of the different classes X, Y and Z is based upon the data of previous
95

4. Evaluation
Figure 4.7: Distribution of Articles through the classification X, Y and Z with shiftedthresholds
Figure 4.8: Ratio of Articles through the classification X, Y and Z with shifted thresholds
Figure 4.9: Deviation over the year in class X
96
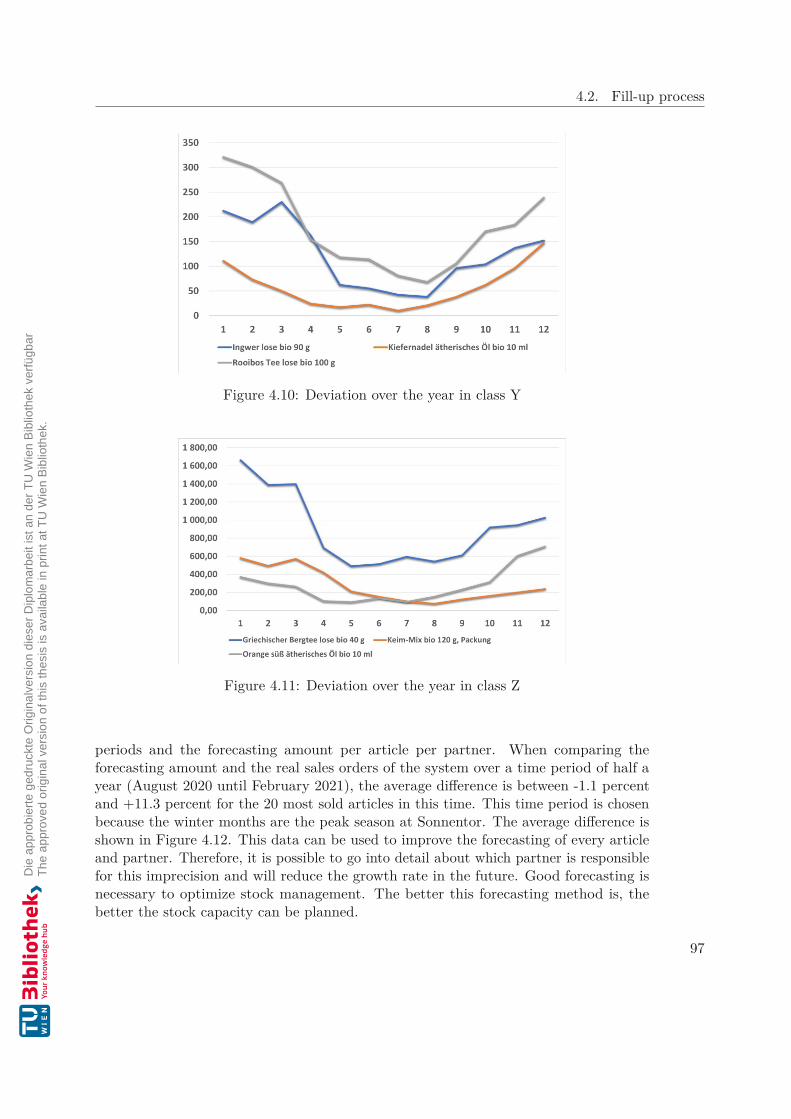
4.2. Fill-up process
Figure 4.10: Deviation over the year in class Y
Figure 4.11: Deviation over the year in class Z
periods and the forecasting amount per article per partner. When comparing theforecasting amount and the real sales orders of the system over a time period of half ayear (August 2020 until February 2021), the average difference is between -1.1 percentand +11.3 percent for the 20 most sold articles in this time. This time period is chosenbecause the winter months are the peak season at Sonnentor. The average difference isshown in Figure 4.12. This data can be used to improve the forecasting of every articleand partner. Therefore, it is possible to go into detail about which partner is responsiblefor this imprecision and will reduce the growth rate in the future. Good forecasting isnecessary to optimize stock management. The better this forecasting method is, thebetter the stock capacity can be planned.
97
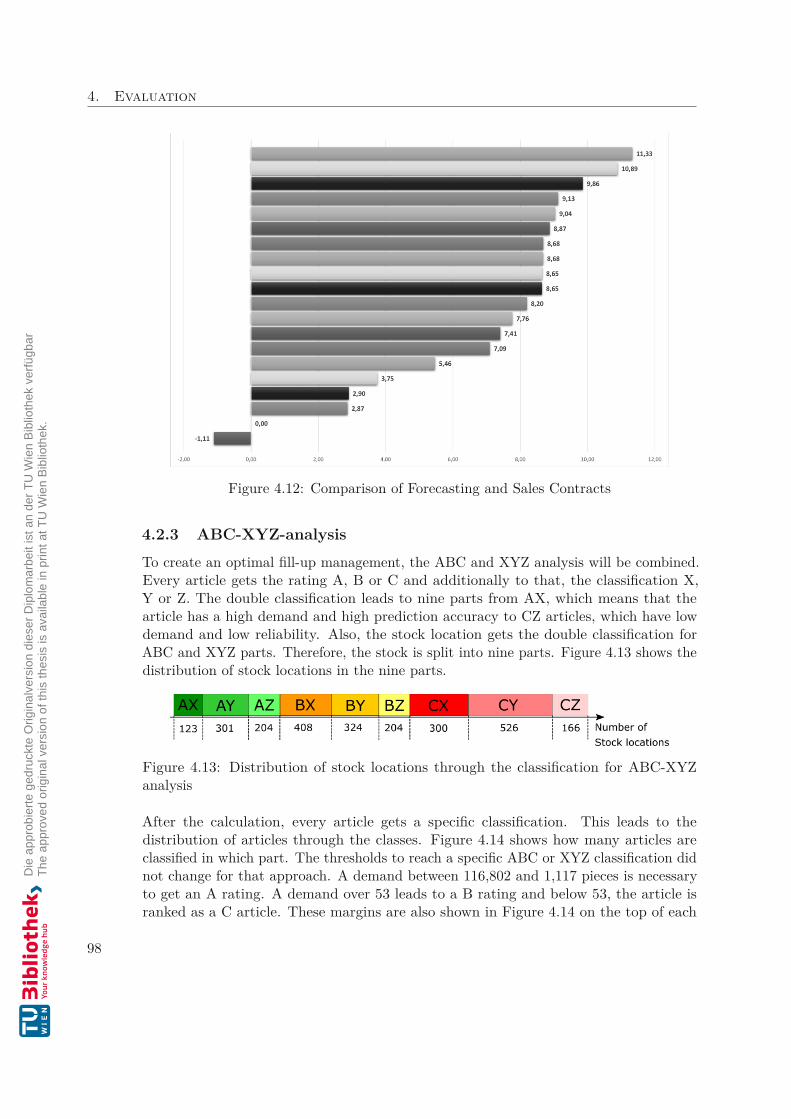
4. Evaluation
Figure 4.12: Comparison of Forecasting and Sales Contracts
4.2.3 ABC-XYZ-analysisTo create an optimal fill-up management, the ABC and XYZ analysis will be combined.Every article gets the rating A, B or C and additionally to that, the classification X,Y or Z. The double classification leads to nine parts from AX, which means that thearticle has a high demand and high prediction accuracy to CZ articles, which have lowdemand and low reliability. Also, the stock location gets the double classification forABC and XYZ parts. Therefore, the stock is split into nine parts. Figure 4.13 shows thedistribution of stock locations in the nine parts.
Figure 4.13: Distribution of stock locations through the classification for ABC-XYZanalysis
After the calculation, every article gets a specific classification. This leads to thedistribution of articles through the classes. Figure 4.14 shows how many articles areclassified in which part. The thresholds to reach a specific ABC or XYZ classification didnot change for that approach. A demand between 116,802 and 1,117 pieces is necessaryto get an A rating. A demand over 53 leads to a B rating and below 53, the article isranked as a C article. These margins are also shown in Figure 4.14 on the top of each
98

4.2. Fill-up process
ABC class. The thresholds for the deviation stay the same. An X article must have adeviation lower than 3. Between 3 and 50, the article gets the ranking Y and over 50 asZ.
Figure 4.14: Distribution of articles through the classification for ABC-XYZ analysis
To see that within another scope, Figure 4.15 shows the ratio of each partition of everyclassification. Based on this figure, the massive class AZ can be identified. This meansthat most of the articles with high demand in previous periods also have a low predictionaccuracy. There are only 18 new articles within the group AZ. The articles with thehighest turnover in the stock have a high seasonal fluctuation.When comparing this data with the stock locations in Figure 4.13, a functionality isneeded to store the article in the next lower or higher class.
Figure 4.15: Ratio of articles in the specific classes for the XYZ analysis
This knowledge can lead to several actions in the future:
1. Expanding the stock and provide more stock locations.
2. Shift the classification of the stock locations to get a better distribution.
99

4. Evaluation
Just shifting the classification will probably only postpone the problem to a later pointin time. Therefore, the enlargement of the stock should be the preferable approach.Figure 4.17 shows all empty stock locations in the specific classes. This must be seen asa snapshot and can change over time. This data can cause problems because too fewstock locations can be provided in the different classes. The prototype can select nostock location at one point in time because there is no empty stock location available.Therefore, the classifications of the stock locations must be reallocated after the stock isexpanded.
Figure 4.16: Empty stock location through the classifications for ABC-XYZ analysis
Figure 4.17 shows the ratio of the empty stock locations of the different parts graphically.Group CY excites attention. The reason for this is that, on the one hand, there are nearlyno articles within this group that will fill up these stock locations and, on the other hand,these stock locations are used as a buffer if they need pallet places after production fast.
Figure 4.17: Empty stock locations through the classifications for ABC-XYZ analysis
The actual stock assignment of the articles in the stock, which the stock managers andfill-up persons did, can be compared to the ABC-XYZ analysis. Actually, there are 1,768batches stored in the main part of the stock which will be examined in this master thesis.Out of these 1,768 batches, 557 articles are at the same classification as in the ABCanalysis, 443 are the same as in the XYZ analysis and 185 are identical to the ABC-XYZanalysis. This data is shown in Table 4.3 in the column 0.Not only the identical stock locations are interesting, but also the different ones should
100

4.2. Fill-up process
be investigated. Therefore, Table 4.3 and Figure 4.18 show the differences of the actualstock to the specific approaches. The difference will be given as a comparison from theactual stock location classification and the article partitioning calculated by the specificapproach. When the article is actually stored in an A location, but the ABC analysiscalculates that this article must be in class B, there is a difference of 1. When thecalculation results in class C, the difference is two. The same structure can be applied tothe ABC-XYZ analysis. In this approach, the difference can vary up to 8 because thereare nine different classes available.
Class Difference by0 1 2 3 4 5 6 7 8
ABC 557 878 333 - - - - - -XYZ 443 808 517 - - - - - -ABC-XYZ 185 527 397 200 220 162 31 36 10
Table 4.3: Differences of stock location classification to the different approaches
What can be seen in Figure 4.18 is that the identical classifications are indirectlyproportional. This means that if there are more classes available, the number of identicalclassifications decrease.What also gains attention in the figure is that over 80 percent of the articles which arecalculated with the ABC approach are identically or have a difference by 1. For the XYZapproach, the number decreases to 70 percent and for the ABC-XYZ approach, there are40 percent identical or differenced by 1. Based on that data and on the fact that nearlyno articles differ by five or more, the stock managers and fill-up persons work withoutsupport by the system nearly like the different approaches. The different approachesreflect the work of the responsible persons very well.
Nevertheless, the stock management system can improve and automatise the work,which is now done by the stock managers. This leads to a stock that is not managedby experience. The semi-automated system at the fill-up process can improve theoptimization potential of the daily work, and save costs by storing the right articles nearthe packing tables and reduce the ways of the workers.The optimization potential can be shown by comparing the current data from theproductive system to the data which the prototype can apply. At the fill-up approach, thesaved ways at the picking process later are important. Every stock location has an ordernumber, which is also used as the way through the stock. This order number can be usedto calculate saved ways from the stock location where the good is currently located tothe stock location, which the prototype would apply. The applied stock location will bea random location in the area of the result of the ABC-XYZ analysis. When the actualstock location is in the partition BZ, and the ABC-XYZ analysis will rank the articleas a BX article, the difference between a random stock location of BX and the currentstock location in BZ will be calculated. When calculating the random stock location inthe destination partition will be done, the article must be stocked in the same height
101

4. Evaluation
Figure 4.18: Differences of the actual stock and the specific approaches
level as in the actual stock location. This needs to be done because the order numbersdefine the costs to reach a specific stock location. A stock location in level A or B costsless than a stock location in level D or E. Therefore, the level of the stock locations mustbe at the same level to get a useful result of the optimization potential.For the calculation of the optimization potential, a query is created, which calculatesthe difference based on the order numbers and calculates the difference out of this inseconds, minutes and hours. Therefore, the average walking speed of 3 kilometers perhour or 0.83 meters per second is assumed. Every pallet or stock location has an averagewidth of 1 meter. The actual data include all picking processes of the 1,620 lots, whichare currently free to sell to the customers at the warehouse of Sonnentor. The author ofthis thesis decided to use this type of evaluation because a lot of data is needed to get ameaningful factor of optimization. Several test data which would be created by userswould be too less and just give a direction how the potential can look like.Thereby, the data of the stock location given by the ABC-XYZ approach are randomlygenerated, the testing environment runs 20 times to get a dataset that can be analysed.Table 4.4 shows the result of all 20 runs of the evaluation algorithm.
The given data in Table 4.4 can be seen as the potential of improvement by the life cycleof a batch of a selling product. This life cycle is defined as the difference between thedate the lot is entered into the stock and the date where this lot is removed from thestock completely. The calculation takes working days into account to have a useful result.Based on the data from the productive system of Sonnentor, there is an average batch lifecycle of 15 days. This means that the improvement potential of the ABC-XYZ analysisis 4.2 hours every 15 days.
102

4.3. Picking process
Difference byNumber ofRun Seconds Minutes Hours1 17,499.75 291.6625 4.8610416672 15,063 251.05 4.1841666673 10,689 178.15 2.9691666674 9,537.75 158.9625 2.6493755 15,909 265.15 4.4191666676 7,524 125.4 2.097 15,879.75 264.6625 4.4110416678 22,545.75 375.7625 6.2627083339 11,000.25 183.3375 3.05562510 16,280.75 271.3458333 4.52243055611 12,693.75 211.5625 3.52604166712 13,708.5 228.475 3.80791666713 20,817.75 346.9625 5.78270833314 12,518.25 208.6375 3.47729166715 22,671 377.85 6.297516 15,506.25 258.4375 4.30729166717 10,620.75 177.0125 2.95020833318 17,314.5 288.575 4.80958333319 25,593.75 426.5625 7.10937520 10,047.5 167.4583333 2.790972222Average 15,171.05 252.8508333 4.214180556
Table 4.4: Saved time of a life cycle of a lot when follow the ABC-XYZ approach
4.2.4 Optimized ways through the stockThe reduction of the ways based on the new stock locations of the articles can not beseen at every fill-up action but has an impact on the picking process. But there is anoptimization potential at every fill-up process available when guiding the workers throughthe stock, which is described in Section 3.3.2. In the stock a lot of people work together.Therefore, it is necessary to have a real-time optimization without any pre-calculation.This will be done by minimizing the way between every article within one fill-up action.
4.3 Picking processThe picking process is the second part to be optimised in this thesis. After the fill-upprocess, all goods should be stored in the most optimal stock location with a view ofthe picking process. Therefore, the fill-up process should optimise the daily work of theworkers, and the picking process should increase the number of picked goods. The criticalpath of the picking activities is the distances a picking person has to walk through thewarehouse. Therefore, the optimised picking process creates one batch order so that
103

4. Evaluation
a picking person picks more than one customer order at once and optimises the waythrough the stock. A batch order aims to find a way to group those orders togetherwhich have a high similarity of articles. This leads to short ways for the picking persons.For that batch order, the seed orders indicate the basis to find four similar orders. Afterselecting a seed order, four accompanying orders will be grouped to this seed order.These four orders should be similar to the seed order in the perspective of minimizingthe way through the stock for the picking person. In the following sections, the differentapproaches to find a seed order and the accompanying orders will be evaluated.
4.3.1 Batch ordersThere are different approaches available in the literature to select a seed order. In Section2.4.1, all possible approaches are shown. The most suitable approaches are implementedto the test system of Sonnentor and are described in Section 3.4.2. At first, every approachto select the seed order will be evaluated with the “GPLSR” approach to batch orderstogether. This is necessary to have the same basis for comparing the results. At 9 am,noon and 3 pm the five different approaches “Random”, “Greatest number of pickinglocations”, “Smallest number of picking aisles”, “Greatest number of picking aisles” andthe new “Oldest order” approaches are executed, and the data is written into a file. Thedata is collected from the productive system of Sonnentor to have a high turnover of neworders in the system. The evaluation results are shown in the following sections.
Random selection
At the random approach, the seed order will be chosen randomly based on all openselling contracts in the system which are untouched at the moment. The system can notinfluence to find a similar batch order or the part of the picking warehouse which will befocused on. Based on the 65 orders which are batched to the seed order, on average 12.4percent of the articles of the accompanying order were equal to the seed order. At theinvestigated orders, there was in average, 10.3 different articles. Therefore, on averageonly 1.29 articles per order were equal to an article in the seed order. Also, an importantfactor of a method is the average number of articles in the seed order. At the “Random”approach, there are 8.8 articles per seed order. Compared to the other methods, this isan average value.Figure 4.19 shows the ratio of the average number of articles to the equal articles inthe accompanying orders against the seed order. The seed order is selected by therandom selection approach and the accompanying orders are batched with the “GPLSR”approach.
Greatest number of picking locations
Another approach is the “Greatest number of picking locations (GNPL)”. This approachcounts all different stock locations of an order. The higher the amount of different pickinglocations is, the higher the rating is. An advantage of having a high amount of different
104

4.3. Picking process
Figure 4.19: Ratio of equal articles using the random selection approach compared tothe “GPLSR” approach
picking locations is that the batch order can be found easier. When the seed ordercontains just one article, the batch order has a smaller similarity to this than to an orderwith many different stock locations. Also, the probability of batching an order with ahigh amount of different stock locations to a seed order is low.When selecting the seed order with the “GNPL” approach, 3.55 articles are the samein the accompanying orders, which are 25 percent. On average, an order of the dataexamined has 13.7 articles. At the “GNPL” approach, the seed order has, with an averageof 25.8, the highest number of different articles. Figure 4.20 shows the ratio of equalarticles of the accompanying orders to the seed order.
Smallest/greatest number of picking aisles
The “Smallest/greatest number of picking aisles (SNPA/GNPA)” is another way to finda seed order. This approach counts the different aisles a picker has to walk when theinvestigated order is used as seed order. At the “SNPA” approach the smallest and atthe “GNPA” approach the highest number of different picking aisles will lead to a highrating. Based on this decision, the system can manage whether just a small or a big partof the warehouse should be focused on. When deciding to find a seed order based onthe “SNPA” approach, the picking action will be focused on a picking process at a smallpart of the warehouse. When deciding to select this based on the “GNPA” approach, thepicking activity will be spread through a bigger part of the warehouse.The “SNPA” approach is the worst approach regarding similarity to the accompanyingorders. Only 0.28 articles in the accompanying orders were the same as in the seed orders,which are just 3.55 percent. One reason for that is that at this approach, orders withjust one article are selected as seed orders. Based on 20 selected seed orders, the average
105

4. Evaluation
Figure 4.20: Ratio of equal articles using the “GNPL” approach compared to the “GPLSR”approach
number of articles of such an order is 1.8 articles. When selecting the accompanyingorders with the “GPLSR” approach, the similarity ratio is high because there is a highprobability of finding the same article in another order. The number of equal articles inthe orders is low when there is just one article to compare with. The average number ofarticles of the whole batch order is also just 7.86. Therefore, the “SNPA” approach isthe worst of all selection methods examined.Figure 4.21 shows the ratio of equal articles of the batch order to the seed order.
Figure 4.21: Ratio of equal articles using the “SNPA” approach compared to the “GPLSR”approach
106

4.3. Picking process
The other aisle-based approach is called “GNPA”. This approach selects the seed orderbased on the highest number of different picking aisles. The “GNPA” approach has thehighest number of articles of a batch order. A batch order selected with the “GNPA” and“GPLSR” approaches includes, on average, 15 different articles. On average 18 articlesare in the seed order which is also very high. After the “GNPL” approach, this methodhas the highest amount of equal articles in the accompanying orders. On average, 2.35articles or 15 percent of the articles are equal in the seed order and the accompanyingorders.In Figure 4.22, the ratio of equal articles of the batch order compared to the seed orderis shown.
Figure 4.22: Ratio of equal articles using the “GNPA” approach compared to the “GPLSR”approach
Oldest order
The author of this thesis described a new approach. The “oldest order approach” justtakes the oldest order in the system as seed order. This is done because with this approachno order can be lost in the high amount of selling contracts in the system. The oldestorder approach will be needed when the pickers can not pick all open orders within oneday. In the system, the number of orders will increase and stays in the system. With thisapproach, every customer gets his/her goods as fast as possible. When not taking theincoming date of order into account, it can happen that an order can stay in the systemfor a long time. At this approach, there are only 4.6 articles in the seed order, which isthe second-lowest value. Also, seven different articles of the batch order are one of thelowest values. Therefore, it is not surprising that only 0.48 articles or 6.8 percent of thearticles of the seed order and the accompanying order are the same.Figure 4.23 illustrates the number of equal articles of the seed order to the accompanyingorders graphically.
107

4. Evaluation
Figure 4.23: Ratio of equal articles using the “oldest order” approach compared to the“GPLSR” approach
Overall result to find a batch order
In Table 4.5, the differences in the approaches to create a batch order are shown. Allvalues in this table are based on calculating the different approaches within one week andare average values. The best method to create a batch order concerning the similarity ofthe articles is to use the “GNPL” approach, followed by “GNPA”, “Random”, “Oldestorder” and “SNPA”. Based on the data, it can be seen that a high similarity of thedifferent orders depends on the number of articles in the seed order. The more articlesthe seed orders have, the higher the ratio of equal articles to the accompanying ordersis. A high number of different articles can explain this as the basis of the selection ofthe accompanying orders. The number of articles in the seed order and the number ofarticles in the accompanying orders have no impact on the similarity of the orders, whichcan be seen by the fourth line of Table 4.5.
4.3.2 Way through the stockBased on the new “GNPL” approach and the “GPLSR” approach with a priority of theoldest orders, a batch order consisting of 5 orders is created. The seed order and fouraccompanying orders are included in this batch order. Based on this order, there aredifferent ways to walk through the stock. This should be done in an optimized manner.Therefore, the “S-shape” and the “Mid-point” heuristic will be compared. This shouldlead to the decision, which type of order numbers and walking strategies will be appliedin the future at Sonnentor when the batch orders are created. The data of all differentapproaches was the same, just the ordering of the stock locations was different. Thisordering guides the picking person through the warehouse. At the different evaluationsteps, the average walking speed of 1 meter per second is assumed. This is a bit slower
108
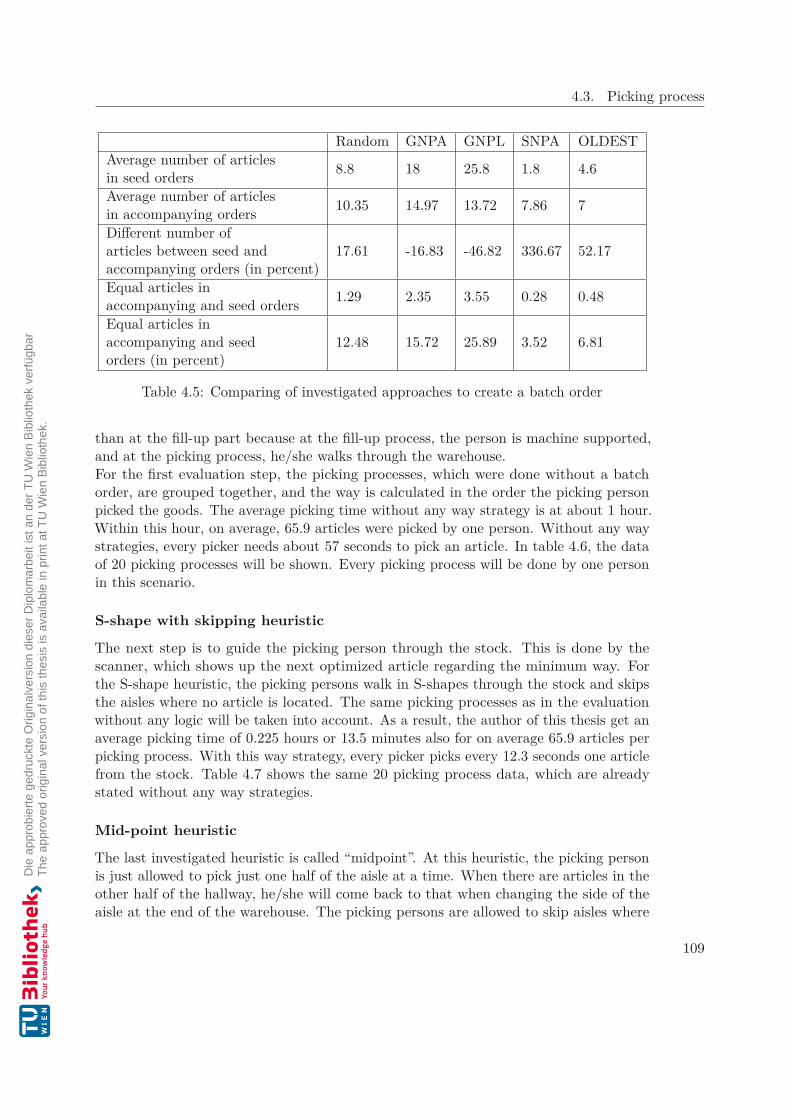
4.3. Picking process
Random GNPA GNPL SNPA OLDESTAverage number of articlesin seed orders 8.8 18 25.8 1.8 4.6
Average number of articlesin accompanying orders 10.35 14.97 13.72 7.86 7
Different number ofarticles between seed andaccompanying orders (in percent)
17.61 -16.83 -46.82 336.67 52.17
Equal articles inaccompanying and seed orders 1.29 2.35 3.55 0.28 0.48
Equal articles inaccompanying and seedorders (in percent)
12.48 15.72 25.89 3.52 6.81
Table 4.5: Comparing of investigated approaches to create a batch order
than at the fill-up part because at the fill-up process, the person is machine supported,and at the picking process, he/she walks through the warehouse.For the first evaluation step, the picking processes, which were done without a batchorder, are grouped together, and the way is calculated in the order the picking personpicked the goods. The average picking time without any way strategy is at about 1 hour.Within this hour, on average, 65.9 articles were picked by one person. Without any waystrategies, every picker needs about 57 seconds to pick an article. In table 4.6, the dataof 20 picking processes will be shown. Every picking process will be done by one personin this scenario.
S-shape with skipping heuristic
The next step is to guide the picking person through the stock. This is done by thescanner, which shows up the next optimized article regarding the minimum way. Forthe S-shape heuristic, the picking persons walk in S-shapes through the stock and skipsthe aisles where no article is located. The same picking processes as in the evaluationwithout any logic will be taken into account. As a result, the author of this thesis get anaverage picking time of 0.225 hours or 13.5 minutes also for on average 65.9 articles perpicking process. With this way strategy, every picker picks every 12.3 seconds one articlefrom the stock. Table 4.7 shows the same 20 picking process data, which are alreadystated without any way strategies.
Mid-point heuristic
The last investigated heuristic is called “midpoint”. At this heuristic, the picking personis just allowed to pick just one half of the aisle at a time. When there are articles in theother half of the hallway, he/she will come back to that when changing the side of theaisle at the end of the warehouse. The picking persons are allowed to skip aisles where
109

4. Evaluation
Time per picking processNumber ofpicked items Seconds Minutes Hours64 4230 70.500 1.175118 4824 80.400 1.34074 5356 89.267 1.48864 1778 29.633 0.49494 5072 84.533 1.40996 4392 73.200 1.22064 2329 38.817 0.64760 5145 85.750 1.42940 2386 39.767 0.66356 3297 54.950 0.91666 3902 65.033 1.08460 4110 68.500 1.14268 6264 104.400 1.74048 4194 69.900 1.16554 3695 61.583 1.02648 2296 38.267 0.63844 2242 37.367 0.62376 4343 72.383 1.20660 1064 17.733 0.29664 4948 82.467 1.374Average 3793.350 63.223 1.054
Table 4.6: Time per picking process without any way strategy
no article can be picked. At this approach, the average picking time per process will bedecreased to 0.118 hours which is about 7 minutes. This means that a picking personwill pick an article every 6.5 seconds. Table 4.8 shows the data of the 20 investigatedpicking processes.
Based on this data, the optimization potential for a company can be shown. In thelast year, the employees of Sonnentor started 99 picking processes per day. This wasdone by an average of ten different picking persons. On an average day, they picked6,016 articles all in all. All this data is based on persons without any guidance from theIT system. Based on the “GNPL” approach to select a seed order and the “GPLSR”approach to find an appropriate accompanying order, then full-time picking personscould pick over 670 picking processes per day when they have no waiting times. Thiscan not be compared one by one to the 99 picking processes of the past year because thepeople at Sonnentor split the batch order into the five customer orders when picking allgoods. Also, the number of packing tables is limited. Due to space limitations, thereare only eight packing tables available for up to 15 picking persons. After the pickingprocess, the picked goods will be packed and sent to the customer on average within
110
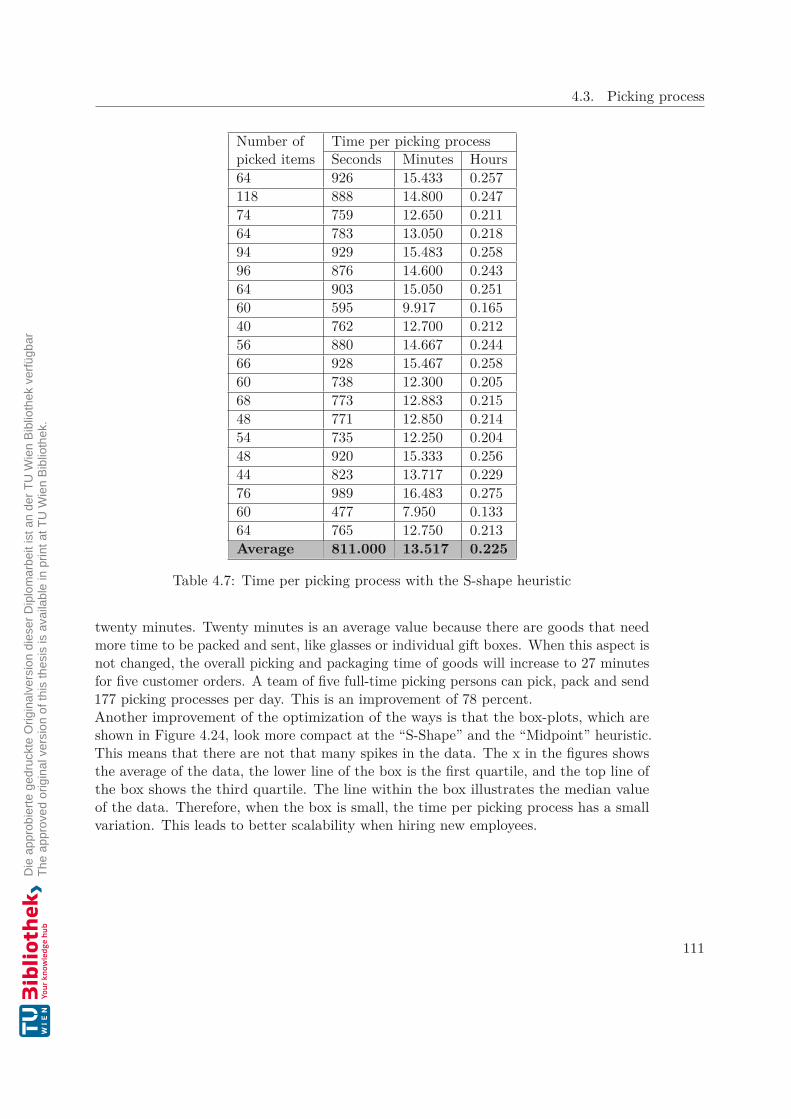
4.3. Picking process
Time per picking processNumber ofpicked items Seconds Minutes Hours64 926 15.433 0.257118 888 14.800 0.24774 759 12.650 0.21164 783 13.050 0.21894 929 15.483 0.25896 876 14.600 0.24364 903 15.050 0.25160 595 9.917 0.16540 762 12.700 0.21256 880 14.667 0.24466 928 15.467 0.25860 738 12.300 0.20568 773 12.883 0.21548 771 12.850 0.21454 735 12.250 0.20448 920 15.333 0.25644 823 13.717 0.22976 989 16.483 0.27560 477 7.950 0.13364 765 12.750 0.213Average 811.000 13.517 0.225
Table 4.7: Time per picking process with the S-shape heuristic
twenty minutes. Twenty minutes is an average value because there are goods that needmore time to be packed and sent, like glasses or individual gift boxes. When this aspect isnot changed, the overall picking and packaging time of goods will increase to 27 minutesfor five customer orders. A team of five full-time picking persons can pick, pack and send177 picking processes per day. This is an improvement of 78 percent.Another improvement of the optimization of the ways is that the box-plots, which areshown in Figure 4.24, look more compact at the “S-Shape” and the “Midpoint” heuristic.This means that there are not that many spikes in the data. The x in the figures showsthe average of the data, the lower line of the box is the first quartile, and the top line ofthe box shows the third quartile. The line within the box illustrates the median valueof the data. Therefore, when the box is small, the time per picking process has a smallvariation. This leads to better scalability when hiring new employees.
111

4. Evaluation
Time per picking processNumber ofpicked items Seconds Minutes Hours64 471 7.850 0.131118 480 8.000 0.13374 397 6.617 0.11064 416 6.933 0.11694 468 7.800 0.13096 468 7.800 0.13064 490 8.167 0.13660 401 6.683 0.11140 460 7.667 0.12856 468 7.800 0.13066 429 7.150 0.11960 383 6.383 0.10668 417 6.950 0.11648 428 7.133 0.11954 351 5.850 0.09848 405 6.750 0.11344 443 7.383 0.12376 424 7.067 0.11860 316 5.267 0.08864 394 6.567 0.109Average 425.450 7.091 0.118
Table 4.8: Time per picking process with the Mid-point heuristic
112

4.3. Picking process
(a) (b) (c)
Figure 4.24: Box-plots of the different way optimization strategies
113

CHAPTER 5Conclusion and future work
This thesis aims to create a dynamic fill-up and picking process for small and middlesized companies in the food market industry. Therefore, it was shown in detail how thedifferent methods work and can be implemented into an ERP system. For a dynamicstock management system, it is important to have a look at all workflows. Also, in thisthesis, it is shown that one workflow depends on another one in the same system. Thepicking process can be more optimal when there is an underlying fill-up process before.This means, when a fill-up process is accessing the best selling goods near the packingtables, the picking process can be more optimal because of the short ways between thestock locations and the packing tables.When optimising the workflows, the same question arrives every time: “Is this possiblein real-time or should the data be pre-calculated?”. Most workflows in this thesis are inreal-time. With an increasing number of customer orders, simultaneously working people,size of the warehouse and more complex workflows, the number of pre-calculated stepswill also increase. The only reason why the pre-calculation is not wanted is the qualitywhich may decrease.It is hard to create one description, how to create a dynamic stock management system fora company in the food market industry because every company is different and has otherrequirements and circumstances. With the prototype described in this thesis and theimplementation shown, some parts can be used for every company. The fill-up approachesABC, XYZ or the combined ABC-XYZ approach which are described in [Nev14] arethe same for different companies, but how to work with the results can differ. Also, theinvestigated companies work differently and would need different approaches. Kiennastand Kastner would need the ABC analysis which is described in Section 2.2.1 to fill upthe stock locations because they have the goods ordered on stock. At Sonnentor, thecombined ABC-XYZ approach which is described in Section 2.2.3 is needed because theyhave to forecast the amounts [SRHMB12] of the future periods because they also work asa producer. This forecasting is implemented in Section 3.3.3 and is necessary to buy the
115

5. Conclusion and future work
ingredients from suppliers and farmers and produce them before the main season startsfor the specific product without knowing how much they will sell in the main season. Theforecasting amounts from the system can be seen as approximate values and can differ tothe real sales amount. This can seen in Figure 4.12 where the deviation is between -1.1%and +11.3% compared to the real selling amounts.In the future, the functionality should be provided where a specific ratio of the stocklocations should be free and available for the fill-up process every time. This is necessarybecause the different approaches to fill up articles, which are shown by Listings 3.9, 3.11and 3.13 return one stock location per article. If there is no empty stock location availablefor an article in a specific sector of the stock, the approaches can not work in an optimalmanner. Also to fill up new articles, empty stock locations must be available. Whenit is impossible to apply a functionality like this, the fill-up process must find a stocklocation in the next part of the warehouse. If there is no empty stock location withinclass A available, the stock management system must store it in a stock location withclassification B. For the implementation of such a fill-up process, it is advisable to createthe article classification first and the classification of the stock locations later on. As myevaluation has shown in Section 4.2.3 123 stock locations are applied to the class AX.When classifying the articles, only 4 articles are grouped as an AX article. On the otherhand side, 301 stock locations are classified to the group AZ. The implemented prototypeclassified 617 articles to class AZ. When knowing the distribution of the articles throughthe classes in advice, the classification of the stock locations can be done with the samedistribution. Figures 4.13 and 4.14 show the distributions of stock locations and articlesthrough the classes graphically.When analysing the processes within a company and choosing the right approaches, alot of optimization potential is available. At Sonnentor, the optimization potential atthe fill-up process is not that high as expected but leads to a more optimized pickingprocess. The picking process can be improved by about 78% to the current state atSonnentor. This factor is possible with the current circumstances of picking persons, thegiven number of stock locations and packing tables. The actual bottleneck at Sonnentoris the amount of packing tables. There are just eight packing tables available for up to 15picking persons where the picker and goods wait several minutes for packing and sendingto the customer. When this waiting time is decreased, the optimization potential willincrease automatically. The most important part to create a high optimization factor isto apply several unique order numbers to every stock location. At the fill-up process,this order number is necessary to find the next optimal stock location to fill up an articleas described in Section 3.2.1 and shown in Figure 3.3.2. At the picking process, the ordernumber defines the way through the stock for the picking person. These order numbersare different from each other and can differ between the different approaches as seenin the implemented prototype when applying the order numbers for the different waystrategies through the stock in Section 3.4.4.Also, some limitations were detected when implementing the prototype on the stockmanagement system from Sonnentor. The forecasting method works better if it has aspecific continuity or seasonality. This is not the case when the main part of the customers
116
are private persons or smaller shops. When detecting this circumstance, it is not usefulto create forecasting for a short period in time, like hours or days. This limitation of theforecasting is shown in Section 3.3.3. When implementing a dynamic fill-up approachbased on forecasting values, it is necessary to check if there is any continuity available bycomparing the selling articles of specific weeks in different years.The final prototype offered the fill-up process that calculates the ABC analysis [Nev14]based on the access frequency from the previous year in Listing 3.8 and the XYZ analysis[Nev14], which calculates the prediction accuracy done by calculating the forecastingdemand [SRHMB12] of every article. The combination of both approaches was imple-mented in Section 3.3.3 and evaluated in Section 4.2.3. The responsible stock managersand the fill-up persons work similarly to the prototype as shown in Table 4.3. This tableidentifies the differences of the prototype to the actual distribution of the articles to thestock locations. Out of 1,768 articles more than half of the articles are placed in thesame class, in the next class or two classes away of the results the prototype returns.Therefore, the optimization factor of just 4.2 hours every 15 days which is shown in Table4.4 is quite modest.For the picking process, the creation of a batch order [HT06] was done. This creationof a batch order starts by selecting a seed order. The different approaches to select aseed order are shown in Section 2.4.1. As my evaluation has shown, the selection ofa meaningful seed order is crucial for the accompanying orders. The best approachto select the seed order is the “Greatest number of picking locations” (GNPL) [HT06]approach which leads to the accordance of the same articles in the seed order and theaccompanying orders of 25%. This result is shown in Section 4.3.1. Based on the seedorder, four accompanying orders are selected which are similar to the seed order. Asthe literature shows, the “Greatest picking location similarity ratio” (GPLSR) [HT06]approach to batch orders is the best one. Therefore, all different approaches to select aseed order are compared to the GPLSR approach. The result that the combination ofselecting the seed order with the GNPL approach and selecting the accompanying orderswith the GPLSR approach is the best one as shown in Table 4.5.After that, two different way heuristics [ADO09] are implemented to evaluate the mostoptimal way through the stock. As my evaluation has shown in Section 4.3.2, the im-plemented Mid-point heuristic which is described in Section 2.6 creates an optimizationpotential of about 78%.In summary, the fill-up process does not improve the daily work that much. Nevertheless,it is necessary for an optimal picking process with the highest optimization potential ofthe investigated processes. When optimizing these processes, it is essential to have agood insight into the processes to choose the right approaches for the requirements ofthe investigated company.
117

List of Figures
2.1 ABC-Pareto principle based on [CLL08] . . . . . . . . . . . . . . . . . . . 92.2 ABC-clustering at a stock described in [Nev14] . . . . . . . . . . . . . . . 102.3 Compare of classification frequencies [SRHMB12] . . . . . . . . . . . . . . 122.4 Quality of forecasting [SRHMB12] . . . . . . . . . . . . . . . . . . . . . . 132.5 Planned customer orders over time [SRHMB12] . . . . . . . . . . . . . . . 132.6 Different types stock structures defined by the author of this thesis . . . . 202.7 S-shape strategy without skipping [Nev14] . . . . . . . . . . . . . . . . . . 222.8 S-shape strategy with skipping [Nev14] . . . . . . . . . . . . . . . . . . . . 232.9 The return method without repetition [Nev14] . . . . . . . . . . . . . . . 242.10 The return method with repetition [Nev14] . . . . . . . . . . . . . . . . . 252.11 The mid-point heuristic [Nev14] . . . . . . . . . . . . . . . . . . . . . . . . 25
3.1 Flow rack at the picking warehouse at Sonnentor . . . . . . . . . . . . . . 293.2 High level pallet racks at Sonnentor . . . . . . . . . . . . . . . . . . . . . 303.3 Overview of the main Warehouse of Sonnentor . . . . . . . . . . . . . . . . 313.4 Structure of stock with alternating numbers and ways through the stock . 373.5 Structure of stock with constant numbers and ways through the stock . . 373.6 Order numbers for different type of workers . . . . . . . . . . . . . . . . . 403.7 Order numbers for a single type of worker . . . . . . . . . . . . . . . . . . 403.8 Costs between different warehouses . . . . . . . . . . . . . . . . . . . . . . . 413.9 Orders per day from October 2018 to January 2020 selected from Sonnentor 433.10 Fill up activities per day from November 2018 to November 2020 . . . . . 453.11 Duplicate functionality on the scanner surface . . . . . . . . . . . . . . . . 543.12 Orders of selected articles per week . . . . . . . . . . . . . . . . . . . . . . 573.13 Orders of selected articles per week . . . . . . . . . . . . . . . . . . . . . . 583.14 Split stock into three parts for ABC or XYZ clustering . . . . . . . . . . . . 613.15 Split stock into three parts for ABC-XYZ clustering . . . . . . . . . . . . . 613.16 The old workflow of an order at Sonnentor . . . . . . . . . . . . . . . . . 703.17 BPMN model of the new workflow of an order at Sonnentor . . . . . . . . . 713.18 Allocation of order numbers for the S-Shape strategy . . . . . . . . . . . . 823.19 Allocation of order numbers for the “mid-point” heuristic . . . . . . . . . 84
4.1 Distribution of Stock locations through the classification A, B and C . . . 924.2 Distribution of Articles through the classification A, B and C . . . . . . . 92
118

List of Figures
4.3 Distribution of Stock locations through the classification X, Y and Z . . . 944.4 Distribution of Articles through the classification X, Y and Z . . . . . . . 944.5 Distribution of Articles through the classification X, Y and Z . . . . . . . 954.6 Distribution of Articles through the classification X, Y and Z without new
articles . . . . . . . . . . . . . . . . . . . . . . . . . . . . . . . . . . . . . . 954.7 Distribution of Articles through the classification X, Y and Z with shifted
thresholds . . . . . . . . . . . . . . . . . . . . . . . . . . . . . . . . . . . . 964.8 Ratio of Articles through the classification X, Y and Z with shifted thresholds 964.9 Deviation over the year in class X . . . . . . . . . . . . . . . . . . . . . . 964.10 Deviation over the year in class Y . . . . . . . . . . . . . . . . . . . . . . 974.11 Deviation over the year in class Z . . . . . . . . . . . . . . . . . . . . . . . 974.12 Comparison of Forecasting and Sales Contracts . . . . . . . . . . . . . . . 984.13 Distribution of stock locations through the classification for ABC-XYZ analysis 984.14 Distribution of articles through the classification for ABC-XYZ analysis . 994.15 Ratio of articles in the specific classes for the XYZ analysis . . . . . . . . 994.16 Empty stock location through the classifications for ABC-XYZ analysis . 1004.17 Empty stock locations through the classifications for ABC-XYZ analysis . 1004.18 Differences of the actual stock and the specific approaches . . . . . . . . . 1024.19 Ratio of equal articles using the random selection approach compared to the
“GPLSR” approach . . . . . . . . . . . . . . . . . . . . . . . . . . . . . . . 1054.20 Ratio of equal articles using the “GNPL” approach compared to the “GPLSR”
approach . . . . . . . . . . . . . . . . . . . . . . . . . . . . . . . . . . . . 1064.21 Ratio of equal articles using the “SNPA” approach compared to the “GPLSR”
approach . . . . . . . . . . . . . . . . . . . . . . . . . . . . . . . . . . . . 1064.22 Ratio of equal articles using the “GNPA” approach compared to the “GPLSR”
approach . . . . . . . . . . . . . . . . . . . . . . . . . . . . . . . . . . . . 1074.23 Ratio of equal articles using the “oldest order” approach compared to the
“GPLSR” approach . . . . . . . . . . . . . . . . . . . . . . . . . . . . . . . 1084.24 Box-plots of the different way optimization strategies . . . . . . . . . . . . 113
119
List of Tables
2.1 Results of combination of ABC-clustering and XYZ-analysis [Nev14] . . . 122.2 Overview of Advantage and Disadvantage of different picking approaches
[tHSB11] . . . . . . . . . . . . . . . . . . . . . . . . . . . . . . . . . . . . 16
4.1 Distribution of articles based on the classification based on overall sales ofcommercial articles . . . . . . . . . . . . . . . . . . . . . . . . . . . . . . . 93
4.2 Distribution of articles based on the classification based on total turnover ofcommercial articles . . . . . . . . . . . . . . . . . . . . . . . . . . . . . . . 93
4.3 Differences of stock location classification to the different approaches . . . . 1014.4 Saved time of a life cycle of a lot when follow the ABC-XYZ approach . . 1034.5 Comparing of investigated approaches to create a batch order . . . . . . . 1094.6 Time per picking process without any way strategy . . . . . . . . . . . . . 1104.7 Time per picking process with the S-shape heuristic . . . . . . . . . . . . . 1114.8 Time per picking process with the Mid-point heuristic . . . . . . . . . . . 112
120

Bibliography
[ABA+19] Esra Agca Aktunc, Meltem Basaran, Gozde Ari, Mumin Irican, and SahnaGungor. Inventory Control Through ABC/XYZ Analysis. In Fethi Calisir,Emre Cevikcan, and Hatice Camgoz Akdag, editors, Industrial Engineeringin the Big Data Era, pages 175–187, Cham, 2019. Springer InternationalPublishing.
[ADO09] Tamer F. Abdelmaguid, Maged M. Dessouky, and Fernando Ordóñez.Heuristic approaches for the inventory-routing problem with backlogging.Computers and Industrial Engineering, 56(4):1519–1534, 2009.
[Ber97] Rainer Bernnat. Grundlagen der Kommissionierung, pages 5–17. DeutscherUniversitätsverlag, Wiesbaden, 1997.
[CLL08] Ye Chen, Kevin W. Li, and Sifeng Liu. A comparative study on multicriteriaABC analysis in inventory management. In Proceedings of the IEEEInternational Conference on Systems, Man and Cybernetics, Singapore,12-15 October 2008, pages 3280–3285. IEEE, 2008.
[DCR07] Pankaj Dutta, Debjani Chakraborty, and A.R. Roy. An inventory model forsingle-period products with reordering opportunities under fuzzy demand.Computers and Mathematics with Applications, 53(10):1502 – 1517, 2007.
[DJ20] Mohamed Radhouane Douissa and Khaled Jabeur. A non-compensatoryclassification approach for multi-criteria ABC analysis. Soft Comput.,24(13):9525–9556, 2020.
[DKW17] Christian F. Durach, Joakim Kembro, and Andreas Wieland. A newparadigm for systematic literature reviews in supply chain management.Journal of Supply Chain Management, 53(4):67–85, 2017.
[DMM09] Fabrizio Dallari, Gino Marchet, and Marco Melacini. Design of orderpicking system. The international journal of advanced manufacturingtechnology, 42(1-2):1–12, 2009.
[DSAS18] Dida Diah Damayanti, Erlangga Bayu Setyawan, Luciana Andrawina, andBudi Santosa. Warehouse picking model for single picker routing problem
121

in multi dimensional warehouse layout using genetic algorithm approachto minimize delay. In Rozaida Ghazali, Mustafa Mat Deris, Nazri MohdNawi, and Jemal H. Abawajy, editors, Recent Advances on Soft Computingand Data Mining, pages 124–134, Cham, 2018. Springer InternationalPublishing.
[GK08] Yeming Gong and Rene De Koster. A polling-based dynamic order pickingsystem for online retailers. IIE Transactions, 40(11):1070–1082, 2008.
[HT06] Y.-C. Ho and Y.-Y. Tseng. A study on order-batching methods of order-picking in a distribution centre with two cross-aisles. International Journalof Production Research, 44(17):3391–3417, 2006.
[Ign17] P. Ignaciuk. Base-stock distributed inventory management in continuous-review logistic systems — control system perspective. In 2017 22nd Inter-national Conference on Methods and Models in Automation and Robotics(MMAR), pages 1027–1032, Aug 2017.
[IJ14] K. Ilavarasi and K. S. Joseph. Variants of travelling salesman problem: Asurvey. In International Conference on Information Communication andEmbedded Systems (ICICES2014), pages 1–7, 2014.
[Nev14] Nikolaj Nevmyvako. Operative grundlage für die strategische ausrichtungder manuellen kommissionierung. 2014.
[RA18] Niklas Richter and Eingereichte Abschlussarbeit. Einführung einer scan-nergeführten beleglosen kommissionierung am imperial standort lan-gelsheim. 2018.
[See05] Stefan Seemüller. Durchsatzberechnung automatischer kleinteilelager imumfeld des elektronischen handels. 2005.
[SRHMB12] Bernd Scholz-Reiter, Jens Heger, Christian Meinecke, and JohannBergmann. Integration of demand forecasts in abc-xyz analysis: Prac-tical investigation at an industrial company. International Journal ofProductivity and Performance Management, 61:445 – 451, 04 2012.
[SZ16] David Schlögl and Helmut Zsifkovits. Manuelle kommissioniersysteme unddie rolle des menschen. BHM Berg- und Hüttenmännische Monatshefte,161(5):225–228, May 2016.
[tHSB11] Michael ten Hompel, Volker Sadowsky, and Maria Beck. Optimierung vonkommissioniersystemen. pages 91–125, 2011.
[vGRCdK18] Teun van Gils, Katrien Ramaekers, An Caris, and René B.M. de Koster.Designing efficient order picking systems by combining planning problems:State-of-the-art classification and review. European Journal of OperationalResearch, pages 1 – 15, 2018.
122

Appendix A
SonnentorSonnentor1 is an Austrian company which was founded in 1988 from Johannes Gutmannas a sole trader business. Nowadays, they are producing herbage, tees, spicery, coffeeor cacao. They have more than 400 employees and sell about 900 different products.Sonnentor works based on the “welfare economy” strategy. This means to work for thewelfare and surrounding instead of optimizing their profit. They have their own farmersto produce the regional goods. For all products which are not available in Austria theyhave a network of suppliers from Romania, Albania, Nicaragua, Tanzania, China, NewZealand, Spain, Kosovo, Greece, Germany and Czech Republic. They sell their productsin 25 shops in Austria, Germany and Czech Republic and on-line in more than 50 differentcountries.
1https://www.sonnentor.com/de-at
123


Appendix B
Interview with SONNENTOR Kräuterhandels GMBH
1. Which properties can your articles have? Sonnentor only work with spice,teas, snacks and herbages so they don’t have any cooled products. This type ofproducts can be strong smelling and can accept the aroma of other goods. So theyhave to find a way to store these types of products that a product doesn’t influenceanother product. This will be ensured by spatial distribution of such products.There is also a restriction of stacking goods. It’s not possible to stack big bags or50 kg bags over each other in a structural way.
2. Do you trade your product to different countries with different lan-guages? The teas, herbages, spice and snacks from Sonnentor will be traded to50 different countries. Product description and ingredients will be translated into23 different languages. They have their products in german, which are the mainlanguage and without any description. When they receive orders from differentcountries they print the new descriptions and ingredients in their own printingoffice and label their products right before shipping.
3. Which package types do you have in your company? The main packagingunits are 1, 6 and 42 pieces. But for special products it can happen, that there areother sizes of the packaging units are available.
4. Which packaging units did you have in your company? This dependson the article. Products will be packed in different box sizes. There are singlepackaging units for B2C customers and there are boxes with e.g. 24, 40, 60 up to1200 packages inside for bigger orders.
5. Do you have any special products like vouchers which are not on stock?Yes, there are also individual products available in the shop (e.g. vouchers, individualteas, products with personal dedication). These types of products will be printedin the office. The stock management system has to ensure that the picker gets thisorders with a delay of 1-3 hours that the printing office can prepare these products.
6. Which types of storage racks do you have? Different parts of the stock hasdifferent types of racks. The picking part of the stock has flow racks which holds
125

the demand of one day. This racks will be taken for B2C customers and includesjust smaller packaging sizes. The second type is the pallet shelf. This part of thestock only holds the articles for B2B customers and to fill-up the flow racks. Thelast type is the rack for small part articles. Products in this part of the stock arefor example single pieces of a product to fill-up the shop or marketing stuff likeposters.
7. Do you have shifts for your stock employees? No. Fill-up and pickingpersons have a predefined working time. When the main season in winter starts itmay happen, that persons have to do some overtime.
8. Is there a relation between number of orders and number of pickers?When the main season around Christmas starts some seasonal workers will helpour fill-up and picking persons.
9. Do you have different types of stocks? (e.g. Stock for picking, externalstock, main stock, ... Yes, there are 3 different types of stores. For picking theB2C orders the pickers have the picking store. This type of store is next to thepackaging tables and ensure short ways of the pickers when they collect the B2Corders which are the main part of the orders. The second type is the pallet store.This is the main stock and contains the a high amount of the articles for B2Borders and fill-up of the picking store. The last type is the small part articles whichis just for fill-up purposes of the store and marketing articles like posters. There isalso an external warehouse in Waldhausen. This warehouse is just a few minutesaway from Sprögnitz and is for fill-up of the main stock.
10. When do you fill up the stock? The stock at Sonnentor will be filled up when aprocessing step finishes or goods arrive from the external warehouse in Waldhausen.A processing step can be cleaning after delivery from the farmers, drying, mixingor packing.
11. Do you have a processing/production hall next to the storage? Yes thereis a production hall next to the stock. At this production halls there will be differentactivities. After the delivery of the farmers the goods will be give on stock fordrying. When the goods are dry enough the laboratory tests the goods whichquality die farmers delivered. Based on that laboratory report the goods will becleaned, mixed and packed in predefined packaging units.
12. Is it usual to have different articles at one stock place? No. Every articlehas his own stock place. This type of data will be stored at the article master data.
13. Which types of customers do you have? (B2B, B2C or both?) Sonnentortrades with B2C customers in their own Shops and the Webshop. Before the pickercan start to collect the goods for B2C there is an other department which checksthe customer. They also have B2B customers like bigger companies and also the 25franchise shops which orders a high amount of the goods.
126

14. Which picking type do you prefer in your company? Picking and fill-upprocesses will be by terminal. All involved persons has a handheld device wherethey get all important information.
15. Are you differentiating between orders to give them a different priority?Not directly a priority. Some orders just have to wait until a specific action. Ifthere is a voucher at the order, this will be printed in the office. So order has towait some time until the voucher is printed to pack all goods together. Currentlythere is a delay of about 3 hours until the order will be grouped together to acollection order.
16. Are there some corridors for a specific value? There are experiments todefine driving directions and corridors for a specific purpose. At the picking stock,the fill-up persons will be separated from the picking persons. Every group ofpersons must use the specific corridor. This is possible because at this part thereare flow shelves.
17. How does picker and fill-up persons carry their articles? The Fill-upprocess and picking of B2B orders will be handled with a stacker because of thehigh amount of the articles. B2C orders will be collect by hand or with smallershopping carts.
18. Are there different persons for picking and fill-up process? No. If theamount of a good is low within a stock place, every person can start a fill-upprocess.
19. How often do you receive articles for fill-up of the main stock? This differevery day. One fill-up activity can have more than one article.
20. Information about the company
• Name of the company: SONNENTOR Kräuterhandelsgesellschaft mbH• Number of employees in the company: There are about 320 employees in
Austria. Sonnentor plays also attention to hire people with a disability orpermanent unemployed persons.
• Number of orders per day: Sonnentor have on average 215 orders per day(B2B and B2C).
• Number of articles on stock: There are 1800 active products on stock. Thisnumber includes all variants of a product (e.g. spicery with 50 g and 100 gare 2 products). Sonnentor have about 800 base articles.
127


Appendix C
Interview with KASTNER GroßhandelsgesmbHThe interview was held with Franz Vogler stock manager of fresh goods in the centralstock in Zwettl on 27th of February.
1. Which properties can your articles have? At Kastner Gruppe are manydifferent types of articles. There are different categories of products with similarproperties. The categories are deep frozen, dry products, fruits and vegetables andthe category ”fresh“ which means meat and sausages. This categories are separatedto guarantee the different properties (e.g. the different degrees of cold). The articlescan be cooled, strong smelling, accept the aroma of other goods, easily perishable,article aren’t allowed to stack, touch-sensitive, toxic, acidly and have sometimesstatutory regulations. Regulation by law can be for example to cool the fish downto one degree Celsius or to cool the fresh assortment to six degrees Celsius.
2. Do you trade your product to different countries with different lan-guages? Not now. The Kastner Gruppe has plans to label their products indifferent languages because they have also customers in different countries. Becausethey have no own machine for labelling, they will send the labels in the differentlanguages to the customers to source that part of work out to the customer.
3. Which package types do you have in your company? This is completelydifferent and depends on the product and the customer. They have sacks, pawnboxes, single-use boxes or loose items. If the customer orders a different packagingsize than a usual unit, the article will be packed in pawn boxes.
4. Do you have any special products like vouchers which are not on stock?They call this type of products ”providers“ which means, that these type of productsare not on stock like a special kind of a good. The Kastner Gruppe orders thesespecial goods at their suppliers and send them to the customer. This process willtake more time than the normal orders so the customer will get an informationwhen the articles will be delivered.
129

5. Which types of storage racks do you have? At the whole store they havedifferent rack systems. They have a flow rack for smaller products with a highturnover ratio like meat, a pallet storages for products with a bigger amount and ahigh turnover ratio like fruits and vegetables, a high rack storage area for the dryassortment with a big amount and buffer and a stock for small pieces for articleswhich will be sold in small amounts.
6. Do you have shifts for your stock employees? There are two shifts. Thefirst starts at 6 am and ends after 8 hours when they achieve the aim to pick allspecified customers. Shift two starts at 4 pm and ends also after 8 hours. About25 persons works per shift to collect all orders of the customers. At the two shiftsthe pickers collect nearly the same amount of orders.
7. Do you have a incentive system for your pickers and fill up persons? Yes,every person has his own scanner which is directly connected to the IT-System.The system can create a statistic to show, how much picks a picker accomplishper minute in one month. If the picker manage to pick more than 2 goods perminute he will get a financial reward. There are different buckets of classes wherethe reward will increase.
8. Is there a relation between number of orders and number of pickers?The responsible persons have the experience, that Mondays and Tuesdays are worsethan the other days. On the basis of customer orders they also can regulate thenumber of pickers and fill-up persons.
9. How many orders do you have on average and how many articles doesan order have (average)? The number of orders has a seasonal deviation. On20th of February they had 344 orders from customers which a overall amount ofarticles of 35748. For this amount of articles they need roll containers.
10. Do you have different types of stocks? (e.g. Stock for picking, externalstock, main stock, ... The different types of stocks in central stock in Zwettl arebased on the different product categories like in question one described. Kastneralso has external warehouses in Vienna (South and North), Eisenstadt, Jennersdorf,Krems, Amstetten and a envelope stock in Wallern.
11. Do you have packaging tables/areas? Yes at this predefined areas the pickerregisters all roll containers and pawn boxes which will be sent to the customer andcontrol and finish the goods.
12. When do you fill up the stock? The racks will be filled up when the goodsarrive at the landing area or if the picking racks has no goods available. To orderthe right amount of goods the IT-System will create a suggestion and the authorisedagent can overrule the system.
13. Do you have a processing/production hall next to the storage? No.
130

14. Is it usual to have different articles at one stock place? Yes it’s possibleto store at one pallet store two or more different products. This will be ensured bythe bar code at every stock place.
15. Which types of customers do you have? (B2B, B2C or both?) Only B2Bcustomers. On the one hand the shops which are integrated in the Kastner Gruppeand on the other hand gastronomy.
16. Are you differentiating between orders to give them a different priority?No every order has the same priority. The only thing is, that orders with articlesfrom the small articles stock has to wait until this articles are picked. This is causedby the layout of the stock.
17. Which picking type do you prefer in your company? Every picker andfill up person has his own scanner. So the preferred picking method is ”pick-by-terminal“. The system automatically sort the goods of an order from heavy to lightand group the goods based on the product families.
18. Are there some corridors for a specific value? No. Pickers and fill-up stackerare working in the same corridors.
19. Is there a standard place for the articles? Yes every article has his own place.The places changes over time by the experience of the managing people. How oftenthe standard places change will be decided regarding the seasonal availability ofthe products and the turnover ratio. Articles of fresh assortment will be changedevery month and the dry articles will change just once a year.
20. How does the picker carry the goods? The picker use rolling containers andpicking vehicles.
21. How does fill up persons carry the goods? Fill-up persons use forklift tocarry the pallets from the goods entry zone to the stock place.
22. Are there specific persons for picking and fill-up? Yes the teams are sep-arated. One team are the pickers and do only picking the whole day. The otherteam only fill-up the racks. There are more pickers than fill-up persons.
23. How often do you get goods for fill-up? This depends on the product family.The fresh articles will be delivered once a day, fruits and vegetables twice a weekand the dry goods once a week. This depends on the demand of articles andseasonal deviations.
24. Does the Kastner Gruppe also have a production hall? No there is noproduction hall. All articles will be delivered packed.
25. Is is possible to store more than one article at a stock place? Yes this ispossible. At the pallet stock there are also pallets with different articles on it.
131
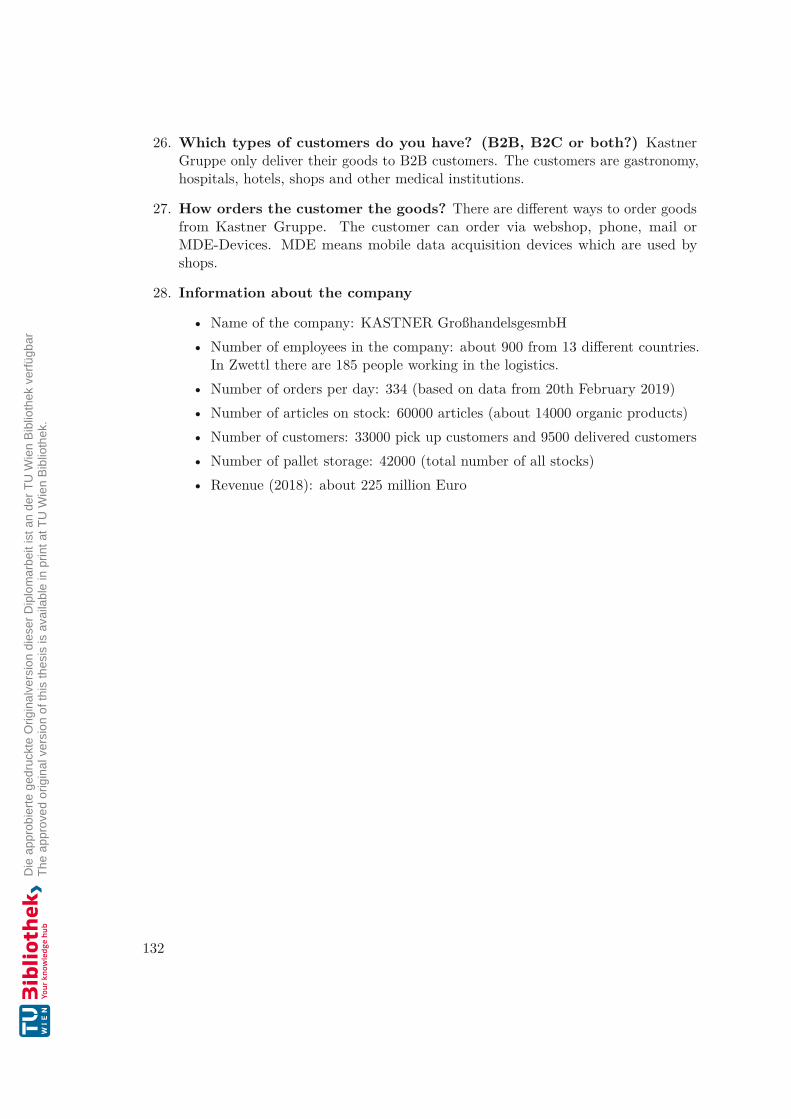
26. Which types of customers do you have? (B2B, B2C or both?) KastnerGruppe only deliver their goods to B2B customers. The customers are gastronomy,hospitals, hotels, shops and other medical institutions.
27. How orders the customer the goods? There are different ways to order goodsfrom Kastner Gruppe. The customer can order via webshop, phone, mail orMDE-Devices. MDE means mobile data acquisition devices which are used byshops.
28. Information about the company
• Name of the company: KASTNER GroßhandelsgesmbH• Number of employees in the company: about 900 from 13 different countries.
In Zwettl there are 185 people working in the logistics.• Number of orders per day: 334 (based on data from 20th February 2019)• Number of articles on stock: 60000 articles (about 14000 organic products)• Number of customers: 33000 pick up customers and 9500 delivered customers• Number of pallet storage: 42000 (total number of all stocks)• Revenue (2018): about 225 million Euro
132

Appendix D
Interview with JULIUS KIENNASTLEBENSMITTELGROSSHANDELS GMBHThe interview was held with Thomas Vit assistant of the stock manager at the logisticscenter in Gars am Kamp on 21st of March.
1. Which properties can your articles have? Kiennast trade with all levels oftempered goods started from -22° Celsius frozen products up to the dry productswhich will be on stock at about +20° Celsius. They also trade with easily perishableproducts which can stacked over each other because Kiennast just acts as a traderand will sell all products (except meat) as they get it. Some products are touch-sensitive so they have to take care when they give these type of products on stock.They also have non-food articles like cleaning powder or laundry detergent. Theseproducts are at a separate part of the stock.
2. Do you trade your product to different countries with different lan-guages? Yes. They have to fulfil some regulations to have different levels oftempered stocks. The different tempered stocks are -20° Celsius for frozen products,0° Celsius for fresh meat, +2° for leafy vegetables, +11° for fruit and vegetables,+15° Celsius for exotic fruits and +20 degrees for their dry assortment. Anotherregulation are the different certificates. Regarding their MSC (certified sustainableseafood MSC) and ASC (aquaculture stewardship council) they have to stock thecertified fish not next to the fish without a certificate.
3. Do you sell the articles in different languages? All articles will be sold inGerman. They also sell 4 articles with Turkish language but these articles aren’tavailable in German. So no special requirement are given for stock management.
4. Which package types do you have in your company? Kiennast sell theirproducts in bags, boxes, cans and loose products packed in boxes.
5. Do you have any special products like vouchers which are not on stock?Not all products are on stock because this would be too much. In Gars there areabout 12500 different products and other 20000 products can be ordered. These
133

products are rare or ordered just a few times per month. This products will beordered by the suppliers of Kiennast and will be delivered after some days.
6. Which types of storage racks do you have? They have different stock types.The most important are pallet storages, flow racks for meat and high rack storages.
7. Do you have shifts for your stock employees? No.
8. Do you have a incentive system for your pickers and fill up persons? Yes.The system calculates the time for every order which a picker has to handle andadd a default value for printing the documents and packaging. When the pickerundercuts a specific value, he or she gets a bonus. This will be calculated per order.
9. Is there a relation between number of orders and number of pickers?When they know there are many orders per day, they have the possibility to havemore people for picking and fill-up.
10. Do you have different types of stocks? (e.g. Stock for picking, externalstock, main stock, ... There is just the main stock in Gars. This logistics centerwill be split up into two halls. One hall is for packing the orders from judicialinstitutions and the main stock is for gastronomy, gas stations and shops.
11. Do you have packaging tables/areas? This will be handled directly at thegoods issue place. At this area the goods will be packed at the roller containersand labelled for the customer.
12. When do you fill up the stock? At Kiennast this task is a challenging one. Onthe one hand they must look at past orders from the last years and on the otherhand based on the open orders.
13. Do you have a processing/production hall next to the storage? They getall articles packed and they just act as a retailer. The only exception is the butcherdepartment. The whole killed animals arrives at this department and the butcherdisperse these into smaller pieces for the customers.
14. Is it usual to have different articles at one stock place? Yes this is possibleat the logistics centre Kiennast in Gars. At one stock place it’s possible to storemore than one article at the same time.
15. Which types of customers do you have? (B2B, B2C or both?) The maincustomers are B2B. For judicial institutions they pack all goods for every person ina separate box.
16. Are you differentiating between orders to give them a different priority?Yes the IT-System has a priority function implemented so the departmental managercan give different customers different priority. At Kiennast the own shop in Garsam Kamp is every day the first customer which gets the goods. So the priorityfrom this shop is the highest one.
134

17. Which picking type do you prefer in your company? They have two differentpicking types at the same time. Pick-by-terminal for scanning the product and feedthe IT-System and Pick-by-document for an overview of all goods which will bepicked. The picker can decide with which article he or she will start because theIT-System don’t know which articles are heavy and should be picked at first.
18. Are there some corridors for a specific value? No every person can use everycorridor. They just have a driving direction.
19. Is there a standard place for the articles? Every article has his standardplace and if there are new goods they will be placed at the first free place. This islike a chaos approach but with a standard place if the article has his fixed place.
20. How does the picker carry the goods? With picking vehicles and a rollercontainer.
21. How does fill up persons carry the goods? With a stacker.
22. Are there specific persons for picking and fill-up? There are predefinedteams for picking and fill-up. When there are vacations or if persons are ill theteam can vary for a specific time.
23. How often do you get goods for fill-up? It depends on the goods which areneeded. The goods receiving starts at 8 am and ends at 4 pm.
24. How orders the customer the goods? This will be handled in different ways.The selling department accept E-Mail, Fax, Webshop orders or orders via theBest-friend order system.
25. Information about the company
• Name of the company: Julius Kiennast Lebensmittelgroßhandels GmbH• Number of employees in the company: there have about 220 employees overall.
Of theses 220 employees there are about 130 at the logistics center.• Number of orders per day: They supply about 1100 customers per day.• Number of articles on stock: 12500 articles overall (8200 dry assortment, 4300
fresh produce) and over 20000 additional special products• Number of customers: 2400 customers and their own shop with about 1700
customers per day• Number of pallet storage: 10000 pallets spaces in the stock• Revenue (2018): 82.5 million Euro
135