Diffusible iodine-based contrast-enhanced computed tomography ...
Upload
nguyenthuanCategory
view
226download
0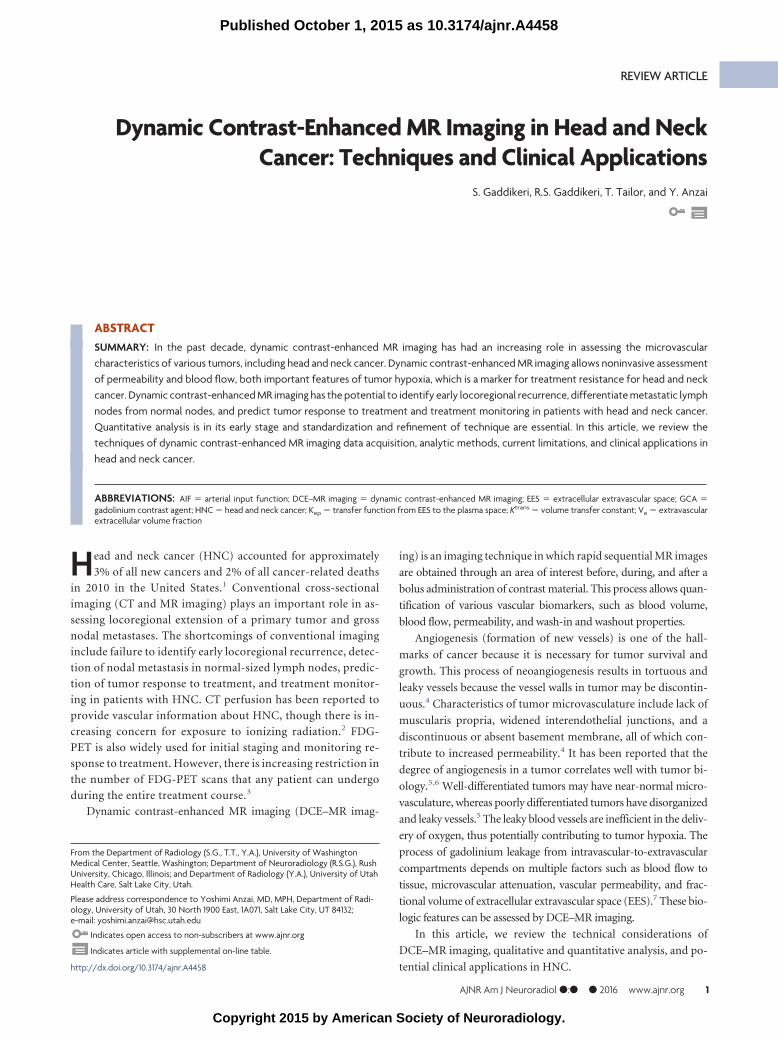
REVIEW ARTICLE
Dynamic Contrast-Enhanced MR Imaging in Head and NeckCancer: Techniques and Clinical Applications
S. Gaddikeri, R.S. Gaddikeri, T. Tailor, and Y. Anzai
ABSTRACTSUMMARY: In the past decade, dynamic contrast-enhanced MR imaging has had an increasing role in assessing the microvascularcharacteristics of various tumors, including head and neck cancer. Dynamic contrast-enhanced MR imaging allows noninvasive assessmentof permeability and blood flow, both important features of tumor hypoxia, which is a marker for treatment resistance for head and neckcancer. Dynamic contrast-enhanced MR imaging has the potential to identify early locoregional recurrence, differentiate metastatic lymphnodes from normal nodes, and predict tumor response to treatment and treatment monitoring in patients with head and neck cancer.Quantitative analysis is in its early stage and standardization and refinement of technique are essential. In this article, we review thetechniques of dynamic contrast-enhanced MR imaging data acquisition, analytic methods, current limitations, and clinical applications inhead and neck cancer.
ABBREVIATIONS: AIF � arterial input function; DCE–MR imaging � dynamic contrast-enhanced MR imaging; EES � extracellular extravascular space; GCA �gadolinium contrast agent; HNC � head and neck cancer; Kep � transfer function from EES to the plasma space; Ktrans � volume transfer constant; Ve � extravascularextracellular volume fraction
Head and neck cancer (HNC) accounted for approximately
3% of all new cancers and 2% of all cancer-related deaths
in 2010 in the United States.1 Conventional cross-sectional
imaging (CT and MR imaging) plays an important role in as-
sessing locoregional extension of a primary tumor and gross
nodal metastases. The shortcomings of conventional imaging
include failure to identify early locoregional recurrence, detec-
tion of nodal metastasis in normal-sized lymph nodes, predic-
tion of tumor response to treatment, and treatment monitor-
ing in patients with HNC. CT perfusion has been reported to
provide vascular information about HNC, though there is in-
creasing concern for exposure to ionizing radiation.2 FDG-
PET is also widely used for initial staging and monitoring re-
sponse to treatment. However, there is increasing restriction in
the number of FDG-PET scans that any patient can undergo
during the entire treatment course.3
Dynamic contrast-enhanced MR imaging (DCE–MR imag-
ing) is an imaging technique in which rapid sequential MR images
are obtained through an area of interest before, during, and after a
bolus administration of contrast material. This process allows quan-
tification of various vascular biomarkers, such as blood volume,
blood flow, permeability, and wash-in and washout properties.
Angiogenesis (formation of new vessels) is one of the hall-
marks of cancer because it is necessary for tumor survival and
growth. This process of neoangiogenesis results in tortuous and
leaky vessels because the vessel walls in tumor may be discontin-
uous.4 Characteristics of tumor microvasculature include lack of
muscularis propria, widened interendothelial junctions, and a
discontinuous or absent basement membrane, all of which con-
tribute to increased permeability.4 It has been reported that the
degree of angiogenesis in a tumor correlates well with tumor bi-
ology.5,6 Well-differentiated tumors may have near-normal micro-
vasculature, whereas poorly differentiated tumors have disorganized
and leaky vessels.5 The leaky blood vessels are inefficient in the deliv-
ery of oxygen, thus potentially contributing to tumor hypoxia. The
process of gadolinium leakage from intravascular-to-extravascular
compartments depends on multiple factors such as blood flow to
tissue, microvascular attenuation, vascular permeability, and frac-
tional volume of extracellular extravascular space (EES).7 These bio-
logic features can be assessed by DCE–MR imaging.
In this article, we review the technical considerations of
DCE–MR imaging, qualitative and quantitative analysis, and po-
tential clinical applications in HNC.
From the Department of Radiology (S.G., T.T., Y.A.), University of WashingtonMedical Center, Seattle, Washington; Department of Neuroradiology (R.S.G.), RushUniversity, Chicago, Illinois; and Department of Radiology (Y.A.), University of UtahHealth Care, Salt Lake City, Utah.
Please address correspondence to Yoshimi Anzai, MD, MPH, Department of Radi-ology, University of Utah, 30 North 1900 East, 1A071, Salt Lake City, UT 84132;e-mail: [email protected]
Indicates open access to non-subscribers at www.ajnr.org
Indicates article with supplemental on-line table.
http://dx.doi.org/10.3174/ajnr.A4458
AJNR Am J Neuroradiol ●:● ● 2016 www.ajnr.org 1
Published October 1, 2015 as 10.3174/ajnr.A4458
Copyright 2015 by American Society of Neuroradiology.

Technique
Basic Principles of DCE–MR Imaging. Following intravenous ad-
ministration, gadolinium contrast agent (GCA) travels through
the microvasculature and leaks from the intravascular compart-
ment to the EES by passive diffusion, altering signal intensity of
the tissue by changing the relaxation rates of water protons. The
changes in relaxation and signal depend on how GCA distributes
within the tissues. The transfer function from plasma to EES is
commonly referred to as volume transfer constant (Ktrans) (Fig 1).
As the concentration of intravascular GCA decreases, GCA starts
moving from the EES back into the plasma space. The transfer
function from EES to the plasma space is referred to as (Kep) (Fig
1).8 DCE–MR imaging uses rapid T1-weighted imaging to mea-
sure the relaxivity changes resulting from gadolinium leakage in
and out of the EES. T1-relaxation is generally assumed to be propor-
tional to the degree of concentration of GCA in the EES.9 The time-
concentration curve often reveals the dynamics of GCA accumula-
tion and washout across time. With the knowledge of concentration
of GCA (signal intensity) in the EES and vascular compartment (ar-
terial input function [AIF]) with time, DCE MR imaging allows
quantitative assessment of vascular function in HNC.
Data AcquisitionThe DCE-MR image acquisition consists of 3 steps: 1) a baseline
T1 mapping before administration of GCA, 2) dynamic data ac-
quisition, and 3) arterial input function assessment.
Baseline T1 Mapping. To obtain accurate kinetic fitting of
DCE–MR imaging data, T1 mapping is critical.10 The basic as-
sumption for pharmacokinetic modeling of DCE–MR imaging
data is that tissue T1 relaxivity (and hence the signal intensity of
tissue) at each time point is directly proportional to the tissue
concentration of GCA.11 However, this relationship is not always
linear because it is influenced by the T1 characteristics of the na-
tive tissue.12 To compensate for this nonlinear relationship be-
tween signal intensity and tissue GCA concentration, baseline T1
mapping and equilibrium magnetization at each imaging time
point are essential.12,13 The T1 values calculated on a voxel-by-
voxel basis are termed the T10 map.
Various techniques of imaging data acquisition for T1 mapping
are described in the literature, such as variable flip angle techniques
(double flip angle versus multiple flip angle),14,15 the inversion re-
covery technique,16,17 and the Look-Locker technique.18,19 Origi-
nally, the Look-Locker technique was reported to have a high degree
of accuracy and precision20,21 within a reasonable acquisition time,22
compared with the conventional inversion recovery technique.23
More recently, it has been reported that the multiple flip angle tech-
nique provides more accurate and robust T1 mapping and kinetic
parameter estimation than the double flip angle technique. Further-
more, T1 mapping by using multiple flip angles can be obtained with
a short scan time without sacrificing signal-to-noise ratio. As such,
multiple flip angle T1 mapping is the preferable method of choice for
DCE–MR imaging in HNC.24
Dynamic Data Acquisition. The dynamic data acquisition follows
immediately after baseline T1 mapping. The images are acquired
before, during, and after intravenous gadolinium administration.
The critical component of high-quality DCE–MR imaging is high
FIG 1. Flow chart demonstrating a typical quantitative method of data analysis. The information from the T1 mapping and dynamic data is usedto estimate the changes in T1 relaxivity during the dynamic scan, which, in turn, provides the information of tissue gadolinium concentration. Byfitting the tissue gadolinium concentration and arterial input function data in to commonly used “2-compartment” models (extended Toft oradjusted Brix model), various parameters can be assessed. The difference between the Toft and extended Toft model is the inclusion ofassessment of blood plasma volume per unit tissue volume in the later version.
2 Gaddikeri ● 2016 www.ajnr.org

temporal resolution (2– 4 seconds). This allows accurate assess-
ment of the hemodynamic process as GCA passes through the
microvasculature in the tissue of interest. Higher temporal reso-
lution may compromise SNR and/or coverage (number of sec-
tions). The trade-offs among temporal resolution, SNR, and spa-
tial resolution need to be carefully balanced because a reasonable
SNR and spatial resolution (in-plane resolution, 0.5–1.7 mm) are
required for adequate assessment of tumor vascular function.25
The dynamic sequence can be tailored depending on the planned
method for data analysis. For example, high spatial resolutionwith reasonable temporal resolution imaging is sufficient for a“semiquantitative” time-intensity curve analysis, whereas a veryhigh temporal resolution with reasonable spatial resolution iscritical for “quantitative” kinetic analysis.
The application of DCE–MR imaging has been reported with
both 1.5T and 3T scanners.26-30 Various types of fast 2D and 3D
T1-weighted sequences have been described, including fast spin-
echo T1WI,31-34 FISP35-40 fast-spoiled gradient recalled acquisi-
tion,29,41-44 turbo fast-field echo,28,45-47 and turbo FLASH.48,49
Application of parallel imaging for DCE–MR imaging has in-
creased temporal resolution by severalfold,50 and thus fast 3D
acquisitions are gradually replacing 2D acquisitions in DCE–MR
imaging. Details of the dynamic sequence practiced at the Univer-
sity of Washington are summarized in Table 1.
Arterial Input Function. Another crucial component of DCE–MR
imaging is the assessment of an AIF. The AIF estimates the rate of
change in the concentration of contrast in the plasma (vascular
space) with time. An accurate AIF is essential for quantitative
analysis of dynamic data by using any of the currently available
analytic methods. Generally, AIF is commonly obtained from
the dynamic dataset.51-53 The changes in signal intensity dur-
ing the passage of GCA can be measured simultaneously in
both the blood vessels and the tissue of interest. AIF allows
conversion of the blood plasma signal intensity to intravascu-
lar contrast agent concentration on implementation of a cali-
bration algorithm. Any visible large artery within an area of
interest can be selected for AIF with the dynamic dataset. For
HNC imaging with DCE–MR imaging, the carotid and verte-
bral arteries are well-suited for AIF selection because they run
along the long axis of the neck and are of relatively large
caliber.54
Table 1: Dynamic sequence at the University of Washington is performed on a 3T scannerParameters Philipsa Siemensb GEc
Coil 16-Channel neurovascular coilParallel imaging SENSE iPAT ASSETSequence 3D-T1WI FFE 3D-T1WI FISP or
3D-T1WI FLASH3D-T1WI FSPGR
TR/TE for T1 mapping 5.2/2.5 msMFA for T1 mapping 30°, 20°, 15°, 10°, and 2°TR/TE/FA for dynamic imaging 5.2/2.5 ms/5°FOV 212 � 149 mm2
Voxel 0.95/0.95/3.00 mm3
Section thickness 3 mmSignal averaging NSA: 1 ACQ: 1 NEX: 1Number of sections per dynamic scan/section
orientation20/Axial
Temporal resolution 3.6 secondsTotal T1 mapping acquisition time 26.5 secondsTotal dynamic acquisition time 6.10 minutesFat saturation NoContrast injection Single dose of 20-mL gadoteridol (ProHanced)
injected at a rate of 5 mL/s through aperipheral arm vein, followed by a 20-mLsaline flush with a power injector
Note:—FFE indicates fast-field echo; FSPGR, fast-spoiled gradient recalled; MFA, multiple flip angles; SENSE, sensitivity encoding; iPAT, integrated parallel acquisition technique;ASSET, array spatial sensitivity encoding technique; NSA, number of signal averages; ACQ, acquisitions; FA, flip angle.a Phillips Healthcare, Best, the Netherlands.b Siemens, Erlangen, Germany.c GE Healthcare, Milwaukee, Wisconsin.d Bracco Diagnostics, Princeton, New Jersey.
Table 2: Commonly used model-free (semiquantitative) parameters for DCE-MRI analysisParameter Definition Units
Area under curve Area under the signal intensity or gadolinium dynamic curve a.u.min or mmol.min/LRelative signal intensity St/S0 NAInitial slope or enhancement slope/rate Maximum or average slope in the initial enhancement a.u/minWashout slope/rate Maximum or average slope in the washout phase a.u/minPeak enhancement ratio or maximum signal
enhancement ratio(Smax � S0)/S0 NA
Tmax or time to peak Time from contrast arrival to peak SMaximum intensity–time ratio PER/Tmax S�1
Note:—St indicates MR signal intensity at time t; S0, precontrast signal intensity; Smax, maximum signal intensity; a.u, arbitrary unit; min, minute; PER, peak enhancement ratio;Tmax, time to maximum enhancement; NA, not applicable; S, seconds.
AJNR Am J Neuroradiol ●:● ● 2016 www.ajnr.org 3

Data AnalysisDCE–MR imaging is commonly analyzed with semiquantitative
analysis or quantitative analysis.
Semiquantitative MethodThe semiquantitative method is a model-free analysis by using
the observed data points on a time-intensity curve. It
is a simple and easily implementable method by using commer-
cially available software.31,35-41,44,55-58 Commonly calculated pa-
rameters on the time-intensity curve are
listed in Table 2. The time-intensity
curve obtained following placement ofan ROI on the tumor provides a roughestimate of how fast the GCA enters andexits the tumor. It has been reported thatmalignant tumors have a longer time topeak and lower relative maximum en-hancement compared with benign le-sions in the head and neck.59 The pro-longed time to peak and lower relativemaximum enhancement were alsonoted in metastatic lymph nodes com-pared with benign lymph nodes amongpatients with HNC.42 The limitation ofthis semiquantitative analysis is that thesemiquantitative parameters do notnecessarily have physical correlates;rather, they may represent mixed mea-sures. For example, the area under curveis a combination of tissue blood flowvascular permeability and fractional in-terstitial space and is, therefore, not anaccurate estimate of blood volume.Therefore, the physiologic meanings ofthese parameters remain ambiguousas to what biologic property theyrepresent.25
Quantitative MethodsQuantitative analysis of DCE–MR imag-
ing data is based on the generalized phar-
macokinetic models. The 2 most impor-
tant assumptions of these models are the
following: 1) GCA is distributed in �1
compartment of the human body, and 2)
distribution of the contrast agent in a par-
ticular compartment is uniform.
A typical quantitative method of data
analysis is outlined in the flow chart (Fig
1). The most frequently used pharmaco-
kinetic models in head and neck
DCE–MR imaging data analysis include
the Toft and Kermode model (Toft
model),29,30,45,60,61 the Brix model,28,34
and their modifications (Fig 1). These
are based on the assumption of a “2-
compartment model,” in which the
GCA is distributed into the “central”
and “peripheral” compartments. The
central compartment consists of intravascular extracellular
volume fraction (blood plasma), and the peripheral compart-
ment consists of extravascular extracellular volume fraction
(Ve). The Toft model generally requires the knowledge of AIF
and T1 mapping for accurate assessment of quantitative pa-
rameters. Fitting the DCE–MR imaging data into 1 of these
models allows estimation of various model-base parameters,
which potentially aids in the understanding of tumor physiol-
FIG 2. A 57-year-old male patient with T2N3bM0 undifferentiated nasopharyngeal cancer. Pre-treatment gadolinium-enhanced axial T1-weighted MR imaging of the neck demonstrates meta-static right level IIb lymph nodes (A). Parametric maps (C, D, and E) show higher volume transferconstant (Ktrans � 0.26/min), Kep, and area under curve, respectively. Axial contrast-enhancedneck CT at 6 months post-chemoradiation treatment demonstrates a favorable response totreatment (B).
Table 3: Commonly used quantitative parameters in the DCE-MRI pharmacokinetic analysisParameter Definition UnitsKtrans Volume transfer constant between EES and blood plasma Min�1
Ve EES volume per unit tissue volume NAVp Blood plasma volume per unit tissue volume NAKep or K21 Rate constant from EES to blood plasma Min�1
Kpe or K12 Rate constant from blood plasma to EES Min�1
Kel Elimination rate constant Min�1
Amp or AH Amplitude of the normalized dynamic curve NA
Note:—Amp or AH, amplitude of the normalized dynamic curve; NA, not applicable; Min, minute.
4 Gaddikeri ● 2016 www.ajnr.org

ogy and pathology.62 Frequently used parameters that can be
obtained from quantitative DCE–MR imaging data are sum-
marized in Table 3.
Quantitative methods of data analysis provide parameters
quantifying microvasculature physiology and tumor biology. Ad-
ditionally, the model-based parameters are more precise and re-
producible and are reported to be independent of scanners and
tissue type.63 Hence, these parameters may be potentially useful
for sequential follow-up to determine treatment response in an
individual patient and also as biologic markers for predicting and
monitoring the therapeutic efficacy in multicenter trials.
Clinical Applications of DCE–MR Imaging in Head andNeck CancerOne of the most exciting aspects of DCE–MR imaging application
in HNC is its potential to serve as an imaging biomarker for hyp-
oxia. The abnormal tumor vessels are inefficient in the delivering
oxygen or chemotherapy drugs to the
tissue. In addition, this inefficiency
causes increased interstitial fluid pres-
sure, which ultimately reduces tumor
perfusion, further facilitating tumor
hypoxia.64 Although a study by New-
bold indicated that tumors with higher
Ktrans were associated with hypoxia de-
fined by pimonidazole and carbonic an-
hydrase staining, and hence poor out-
come,46 others reported that tumors
with lower Ktrans were associated with
poor response.27,29,61,65 Ktrans generally
reflects a combination of perfusion and
permeability. Lower Kep is also reported
to correlate with poor response to treat-
ment.61 A tumor with higher Ktrans,
highly perfused tumor has higher oxy-
genation, better delivery of chemo-
therapeutic drugs, likely explaining
improved treatment response.66-67
Skewness of Ktrans is also reported to
predict treatment response, that a tumor
with larger skewed Ktrans has a worse
prognosis potentially reflecting tumor
heterogeneity.29
DCE–MR imaging has been reported
to be useful for various applications in
HNC imaging, such as differentiating
squamous cell carcinoma from lym-
phoma and undifferentiated carcino-
mas,68 detecting metastatic lymph
nodes,42 assessing tumor cell prolifera-
tion and microvessel attenuation,55,69
and predicting early treatment response
and treatment outcome.27-29,41,46,61
We searched MEDLINE, PubMed,
and Google for the literature published
during the most recent 6-year interval
(2008 –2013) containing all of the fol-
lowing: DCE–MR imaging, HNC, and
quantitative (model-based) analysis of dynamic data for pretreat-
ment assessment and/or monitoring treatment response. The On-
line Table summarizes various studies in the literature and their
respective contributions to DCE–MR imaging of HNC by using
various quantitative methods. Early assessment of treatment re-
sponse is critical for advanced head and neck cancers. The ques-
tion remains as to whether pretreatment measures of DCE pa-
rameters suffice to address the treatment response or it is
necessary to measure changes in DCE parameters to access
treatment response. Figs 2 and 3 demonstrate 2 patients with
HNC with nodal metastasis exhibiting different responses to
chemoradiation.
ChallengesDCE–MR imaging of HNC is clearly in its early stage. Substantial
variability exists in quantification methods, parameter choice,
FIG 3. A 52-year-old male patient with squamous cell carcinoma of the right palatine tonsil. Pretreat-ment axial contrast-enhanced neck CT demonstrates metastatic right level II lymph nodes (A). Para-metric maps (C, D, and E) show a lower volume transfer constant (Ktrans � 0.06/min), Kep, and areaunder curve, respectively. Gadolinium-enhanced axial T1-weighted MR imaging of the neck at 12months post-chemoradiation treatment demonstrates an unfavorable response to treatment (B).
AJNR Am J Neuroradiol ●:● ● 2016 www.ajnr.org 5

and analytic methods. Many factors in the data acquisition and
analysis can affect the reliability of results in DCE–MR imaging
studies. For example, the accuracy and precision of the pharma-
cokinetic parameter estimates are largely determined by SNR,
temporal resolution of the MR image, AIF, and estimation of
T1 mapping.70 Systematic errors can be introduced from var-
ious sources, such as the breakdown of linearity in the gado-
linium concentration calibration curve and inaccuracy of T1
mapping.71,72
Standardization of data acquisition and analysis will facilitate
the translation of DCE–MR imaging to clinical settings, in partic-
ular to multicenter clinical trials.73 The DCE–MR imaging sub-
committee of the Radiological Society of North America Quanti-
tative Imaging Biomarkers Alliance initiative provides guidelines
for data acquisition, analysis, and quality control on 1.5T systems.
The image intensity should be converted to gadolinium concen-
tration through the use of a multiple flip angle precontrast T1 map
after corrections for patient motion, B1 field inhomogeneity, and
coil sensitivity.74 The pharmacokinetic parameter Ktrans (Toft
model) and area under curve (model-free parameter) are recom-
mended as standard quantitative end points that should be used
in clinical trials and practice.
Another challenge with DCE–MR imaging parameters is vali-
dation with tumor histology and hypoxia. A potential reason in-
cludes tumor heterogeneity at the subvoxel level. Therefore, some
authors suggest that DCE–MR imaging parameters may be better
validated with immunohistochemical measurements averaged
over several fields randomly picked from the ROI.73
CONCLUSIONSAlthough DCE–MR imaging has the potential to provide biologic
information of tumor angiogenesis and vascular function in
HNC, its technical development is still in an early stage. The stan-
dardization of image acquisition and data analysis is critical to
moving forward with a multicenter head and neck tumor registry
and in determining the clinical role of DCE–MR imaging in head
and neck oncologic imaging.
Disclosures: Tina Tailor—RELATED: Grant: American Society of Head and Neck Ra-diology, William N. Hanafee Award.
REFERENCES1. Jemal A, Bray F, Center MM, et al. Global cancer statistics. CA Can-
cer J Clin 2011;61:69 –90 CrossRef Medline2. Razek AA, Tawfik AM, Elsorogy LG, et al. Perfusion CT of head and
neck cancer. Eur J Radiol 2014;83:537– 44 CrossRef Medline3. Bussink J, van Herpen CM, Kaanders JH, et al. PET-CT for response
assessment and treatment adaptation in head and neck cancer. Lan-cet Oncol 2010;11:661– 69 CrossRef Medline
4. Carmeliet P, Jain RK. Angiogenesis in cancer and other diseases.Nature 2000;407:249 –57 CrossRef Medline
5. Kaur B, Tan C, Brat DJ, et al. Genetic and hypoxic regulation ofangiogenesis in gliomas. J Neurooncol 2004;70:229 – 43 CrossRefMedline
6. Patankar TF, Haroon HA, Mills SJ, et al. Is volume transfer coeffi-cient (K(trans)) related to histologic grade in human gliomas?AJNR Am J Neuroradiol 2005;26:2455– 65 Medline
7. Paldino MJ, Barboriak DP. Fundamentals of quantitative dynamiccontrast-enhanced MR imaging. Magn Reson Imaging Clin N Am2009;17:277– 89 CrossRef Medline
8. Knopp MV, Weiss E, Sinn HP, et al. Pathophysiologic basis of con-trast enhancement in breast tumors. J Magn Reson Imaging 1999;10:260 – 66 Medline
9. Cheng HL. Investigation and optimization of parameter accuracyin dynamic contrast-enhanced MRI. J Magn Reson Imaging 2008;28:736 – 43 CrossRef Medline
10. Di Giovanni P, Azlan CA, Ahearn TS, et al. The accuracy of pharma-cokinetic parameter measurement in DCE-MRI of the breast at 3 T.Phys Med Boil 2010;55:121–32 CrossRef
11. Brix G, Semmler W, Port R, et al. Pharmacokinetic parameters inCNS Gd-DTPA enhanced MR imaging. J Comput Assist Tomogr1991;15:621–28 CrossRef Medline
12. Evelhoch JL. Key factors in the acquisition of contrast kineticdata for oncology. J Magn Reson Imaging 1999;10:254 –59 Medline
13. Leach MO, Brindle KM, Evelhoch JL, et al; Pharmacodynamic/Phar-macokinetic Technologies Advisory Committee, Drug DevelopmentOffice, Cancer Research UK. The assessment of antiangiogenic andantivascular therapies in early-stage clinical trials using magneticresonance imaging: issues and recommendations. Br J Cancer 2005;92:1599 – 610 CrossRef Medline
14. Wang HZ, Riederer SJ, Lee JN. Optimizing the precision in T1 relax-ation estimation using limited flip angles. Magn Reson Med 1987;5:399 – 416 CrossRef Medline
15. Deoni SC, Rutt BK, Peters TM. Rapid combined T1 and T2 mappingusing gradient recalled acquisition in the steady state. Magn ResonMed 2003;49:515–26 CrossRef Medline
16. Jahng GH, Stables L, Ebel A, et al. Sensitive and fast T1 mappingbased on two inversion recovery images and a reference image. MedPhys 2005;32:1524 –28 CrossRef Medline
17. Ogg RJ, Kingsley PB. Optimized precision of inversion-recovery T1measurements for constrained scan time. Magn Reson Med 2004;51:625–30 CrossRef Medline
18. Karlsson M, Nordell B. Analysis of the Look-Locker T(1) mappingsequence in dynamic contrast uptake studies: simulation and invivo validation. Magn Reson Imaging 2000;18:947–54 CrossRefMedline
19. Freeman AJ, Gowland PA, Mansfield P. Optimization of the ultrafastLook-Locker echo-planar imaging T1 mapping sequence. MagnReson Imaging 1998;16:765–72 CrossRef Medline
20. Brix G, Schad LR, Deimling M, et al. Fast and precise T1 imagingusing a TOMROP sequence. Magn Reson Imaging 1990;8:351–56CrossRef Medline
21. Kay I, Henkelman RM. Practical implementation and optimizationof one-shot T1 imaging. Magn Reson Med 1991;22:414 –24 CrossRefMedline
22. Henderson E, McKinnon G, Lee TY, et al. A fast 3D Look-Lockermethod for volumetric T1 mapping. Magn Reson Imaging 1999;17:1163–71 CrossRef Medline
23. Crawley AP, Henkelman RM. A comparison of one-shot and recov-ery methods in T1 imaging. Magn Reson Med 1988;7:23–34 CrossRefMedline
24. Yuan J, Chow SK, Yeung DK, et al. Quantitative evaluation of dual-flip-angle T1 mapping on DCE-MRI kinetic parameter estimationin head and neck. Quant Imaging Med Surg 2012;2:245–53 CrossRefMedline
25. Yankeelov TE, Gore JC. Dynamic contrast enhanced magnetic res-onance imaging in oncology: theory, data acquisition, analysis, andexamples. Curr Med Imaging Rev 2009;3:91–107 Medline
26. Chawla S, Kim S, Dougherty L, et al. Pretreatment diffusion-weighted and dynamic contrast-enhanced MRI for prediction oflocal treatment response in squamous cell carcinomas of the headand neck. AJR Am J Roentgenol 2013;200:35– 43 CrossRef Medline
27. Chawla S, Kim S, Loevner LA, et al. Prediction of disease-free sur-vival in patients with squamous cell carcinomas of the head andneck using dynamic contrast-enhanced MR imaging. AJNR Am JNeuroradiol 2011;32:778 – 84 CrossRef Medline
28. Chikui T, Kawano S, Kawazu T, et al. Prediction and monitoring ofthe response to chemoradiotherapy in oral squamous cell carcino-
6 Gaddikeri ● 2016 www.ajnr.org

mas using a pharmacokinetic analysis based on the dynamic con-trast-enhanced MR imaging findings. Eur Radiol 2011;21:1699 –708CrossRef Medline
29. Shukla-Dave A, Lee NY, Jansen JF, et al. Dynamic contrast-enhancedmagnetic resonance imaging as a predictor of outcome in head-and-neck squamous cell carcinoma patients with nodal metastases.Int J Radiat Oncol Boil Phys 2012;82:1837– 44 CrossRef
30. Wang P, Popovtzer A, Eisbruch A, et al. An approach to identify,from DCE MRI, significant subvolumes of tumors related to out-comes in advanced head-and-neck cancer. Med Phys 2012;39:5277– 85 CrossRef Medline
31. Yabuuchi H, Fukuya T, Tajima T, et al. Salivary gland tumors: diag-nostic value of gadolinium-enhanced dynamic MR imaging withhistopathologic correlation. Radiology 2003;226:345–54 CrossRefMedline
32. Yabuuchi H, Matsuo Y, Kamitani T, et al. Parotid gland tumors: canaddition of diffusion-weighted MR imaging to dynamic contrast-enhanced MR imaging improve diagnostic accuracy in character-ization? Radiology 2008;249:909 –16 CrossRef Medline
33. Tunca F, Giles Y, Salmaslioglu A, et al. The preoperative exclusion ofthyroid carcinoma in multinodular goiter: dynamic contrast-en-hanced magnetic resonance imaging versus ultrasonography-guided fine-needle aspiration biopsy. Surgery 2007;142:992–1002;discussion 1002.e1001–1002 CrossRef Medline
34. Juan CJ, Chen CY, Jen YM, et al. Perfusion characteristics of lateradiation injury of parotid glands: quantitative evaluation with dy-namic contrast-enhanced MRI. Eur Radiol 2009;19:94 –102 CrossRefMedline
35. Asaumi J, Hisatomi M, Yanagi Y, et al. Assessment of ameloblasto-mas using MRI and dynamic contrast-enhanced MRI. Eur J Radiol2005;56:25–30 CrossRef Medline
36. Asaumi J, Yanagi Y, Hisatomi M, et al. The value of dynamic con-trast-enhanced MRI in diagnosis of malignant lymphoma of thehead and neck. Eur J Radiol 2003;48:183– 87 CrossRef Medline
37. Asaumi J, Yanagi Y, Konouchi H, et al. Application of dynamic con-trast-enhanced MRI to differentiate malignant lymphoma fromsquamous cell carcinoma in the head and neck. Oral Oncol 2004;40:579 – 84 CrossRef Medline
38. Hisatomi M, Asaumi J, Yanagi Y, et al. Assessment of pleomorphicadenomas using MRI and dynamic contrast enhanced MRI. OralOncol 2003;39:574 –79 CrossRef Medline
39. Matsuzaki H, Hara M, Yanagi Y, et al. Magnetic resonance imaging(MRI) and dynamic MRI evaluation of extranodal non-Hodgkinlymphoma in oral and maxillofacial regions. Oral Surg Oral MedOral Pathol Oral Radiol 2012;113:126 –33 CrossRef Medline
40. Unetsubo T, Konouchi H, Yanagi Y, et al. Dynamic contrast-en-hanced magnetic resonance imaging for estimating tumor prolifer-ation and microvessel density of oral squamous cell carcinomas.Oral Oncol 2009;45:621–26 CrossRef Medline
41. Agrawal S, Awasthi R, Singh A, et al. An exploratory study into therole of dynamic contrast-enhanced (DCE) MRI metrics as predic-tors of response in head and neck cancers. Clin Radiol 2012;67:e1–5CrossRef Medline
42. Fischbein NJ, Noworolski SM, Henry RG, et al. Assessment of meta-static cervical adenopathy using dynamic contrast-enhanced MRimaging. AJNR Am J Neuroradiol 2003;24:301–11 Medline
43. Noworolski SM, Fischbein NJ, Kaplan MJ, et al. Challenges in dy-namic contrast-enhanced MRI imaging of cervical lymph nodes todetect metastatic disease. J Magn Reson Imaging 2003;17:455– 62CrossRef Medline
44. Yuan Y, Kuai XP, Chen XS, et al. Assessment of dynamic contrast-enhanced magnetic resonance imaging in the differentiation of ma-lignant from benign orbital masses. Eur J Radiol 2013;82:1506 –11CrossRef Medline
45. Chikui T, Kitamoto E, Kawano S, et al. Pharmacokinetic analysisbased on dynamic contrast-enhanced MRI for evaluating tumor re-sponse to preoperative therapy for oral cancer. J Magn Reson Imag-ing 2012;36:589 –97 CrossRef Medline
46. Newbold K, Castellano I, Charles-Edwards E, et al. An exploratorystudy into the role of dynamic contrast-enhanced magnetic reso-nance imaging or perfusion computed tomography for detection ofintratumoral hypoxia in head-and-neck cancer. Int J Radiat OncolBoil Phys 2009;74:29 –37 CrossRef Medline
47. Yuan J, Chow SK, Yeung DK, et al. A five-colour colour-coded map-ping method for DCE-MRI analysis of head and neck tumours. ClinRadiol 2012;67:216 –23 CrossRef Medline
48. Støre G, Smith HJ, Larheim TA. Dynamic MR imaging of mandibu-lar osteoradionecrosis. Acta Radiol 2000;41:31–37 CrossRef Medline
49. Van Cann EM, Rijpkema M, Heerschap A, et al. Quantitative dy-namic contrast-enhanced MRI for the assessment of mandibularinvasion by squamous cell carcinoma. Oral Oncol 2008;44:1147–54CrossRef Medline
50. Tsao J, Boesiger P, Pruessmann KP. k-t BLAST and k-t SENSE: dy-namic MRI with high frame rate exploiting spatiotemporal corre-lations. Magn Reson Med 2003;50:1031– 42 CrossRef Medline
51. Port RE, Knopp MV, Hoffmann U, et al. Multicompartment analysisof gadolinium chelate kinetics: blood-tissue exchange in mammarytumors as monitored by dynamic MR imaging. J Magn Reson Imag-ing 1999;10:233– 41 Medline
52. van Osch MJ, Vonken EJ, Viergever MA, et al. Measuring the arterialinput function with gradient echo sequences. Magn Reson Med2003;49:1067–76 CrossRef Medline
53. McIntyre DJ, Ludwig C, Pasan A, et al. A method for interleavedacquisition of a vascular input function for dynamic contrast-en-hanced MRI in experimental rat tumours. NMR Biomed 2004;17:132– 43 CrossRef Medline
54. Kim YR, Rebro KJ, Schmainda KM. Water exchange and inflow af-fect the accuracy of T1-GRE blood volume measurements: implica-tions for the evaluation of tumor angiogenesis. Magn Reson Med2002;47:1110 –20 CrossRef Medline
55. Konouchi H, Asaumi Ji, Yanagi Y, et al. Evaluation of tumor prolif-eration using dynamic contrast enhanced-MRI of oral cavity andoropharyngeal squamous cell carcinoma. Oral Oncol 2003;39:290 –95 CrossRef Medline
56. Matsuzaki H, Yanagi Y, Hara M, et al. Minor salivary gland tumorsin the oral cavity: diagnostic value of dynamic contrast-enhancedMRI. Eur J Radiol 2012;81:2684 –91 CrossRef Medline
57. Matsuzaki H, Yanagi Y, Hara M, et al. Diagnostic value of dynamiccontrast-enhanced MRI for submucosal palatal tumors. Eur J Ra-diol 2012;81:3306 –12 CrossRef Medline
58. Yuan Y, Yue XH, Tao XF. The diagnostic value of dynamic contrast-enhanced MRI for thyroid tumors. Eur J Radiol 2012;81:3313–18CrossRef Medline
59. Furukawa M, Parvathaneni U, Maravilla K, et al. Dynamic contrast-enhanced MR perfusion imaging of head and neck tumors at 3 Te-sla. Head Neck. 2013;35:923–29 CrossRef Medline
60. Jansen JF, Schoder H, Lee NY, et al. Tumor metabolism and perfu-sion in head and neck squamous cell carcinoma: pretreatment mul-timodality imaging with 1H magnetic resonance spectroscopy, dy-namic contrast-enhanced MRI, and [18F]FDG-PET. Int J RadiatOncol Boil Phys 2012;82:299 –307 CrossRef
61. Jansen JF, Schoder H, Lee NY, et al. Noninvasive assessment of tu-mor microenvironment using dynamic contrast-enhanced mag-netic resonance imaging and 18F-fluoromisonidazole positronemission tomography imaging in neck nodal metastases. Int J Ra-diat Oncol Boil Phys 2010;77:1403–10 CrossRef Medline
62. Taylor JS, Tofts PS, Port R, et al. MR imaging of tumormicrocirculation: promise for the new millennium. J Magn ResonImaging 1999;10:903– 07 Medline
63. Jackson A, O’Connor JP, Parker GJ, et al. Imaging tumor vascularheterogeneity and angiogenesis using dynamic contrast-enhancedmagnetic resonance imaging. Clin Cancer Res 2007;13:3449 –59CrossRef Medline
64. Fukumura D, Jain RK. Tumor microenvironment abnormalities:causes, consequences, and strategies to normalize. J Cell Biochem2007;101:937– 49 CrossRef Medline
AJNR Am J Neuroradiol ●:● ● 2016 www.ajnr.org 7

65. Kim S, Loevner LA, Quon H, et al. Prediction of response to chemo-radiation therapy in squamous cell carcinomas of the head andneck using dynamic contrast-enhanced MR imaging. AJNR Am JNeuroradiol 2010;31:262– 68 CrossRef Medline
66. Tofts PS, Brix G, Buckley DL, et al. Estimating kinetic parametersfrom dynamic contrast-enhanced T(1)-weighted MRI of a diffus-able tracer: standardized quantities and symbols. J Magn Reson Im-aging 1999;10:223–32 Medline
67. Miller JC, Pien HH, Sahani D, et al. Imaging angiogenesis: applica-tions and potential for drug development. J Natl Cancer Inst 2005;97:172– 87 CrossRef Medline
68. Lee FK, King AD, Ma BB, et al. Dynamic contrast enhancement mag-netic resonance imaging (DCE-MRI) for differential diagnosis in headand neck cancers. Eur J Radiol 2012;81:784–88 CrossRef Medline
69. Tuncbilek N, Karakas HM, Altaner S. Dynamic MRI in indirect estimationof microvessel density, histologic grade, and prognosis in colorectal ade-nocarcinomas. Abdom Imaging 2004;29:166–72 CrossRef Medline
70. Henderson E, Rutt BK, Lee TY. Temporal sampling requirements
for the tracer kinetics modeling of breast disease. Magn Reson Im-aging 1998;16:1057–73 CrossRef Medline
71. Larsson HB, Stubgaard M, Søndergaard L, et al. In vivo quantifica-tion of the unidirectional influx constant for Gd-DTPA diffusionacross the myocardial capillaries with MR imaging. J Magn ResonImaging 1994;4:433– 40 CrossRef Medline
72. Tofts PS. Modeling tracer kinetics in dynamic Gd-DTPA MR imag-ing. J Magn Reson Imaging 1997;7:91–101 CrossRef Medline
73. Yang X, Knopp MV. Quantifying tumor vascular heterogeneitywith dynamic contrast-enhanced magnetic resonance imaging: areview. J Biomed Biotechnol 2011;2011:732848 CrossRef Medline
74. Singh A, Haris M, Rathore D, et al. Quantification of physiologicaland hemodynamic indices using T(1) dynamic contrast-enhancedMRI in intracranial mass lesions. J Magn Reson Imaging 2007;26:871– 80 CrossRef Medline
75. Jansen JF, Carlson DL, Lu Y, et al. Correlation of a priori DCE-MRI and(1)H-MRS data with molecular markers in neck nodal metastases: ini-tial analysis. Oral Oncol 2012;48:717–22 CrossRef Medline
8 Gaddikeri ● 2016 www.ajnr.org