Dynamic concept maps as knowledge representation tools for ...
98
DYNAMIC CONCEPT MAPS AS KNOWLEDGE REPRESENTATION TOOLS FOR LEARNING Olusola 0 . Adesope PGD, Ladoke Akintola University of Technology, 1999 HND, Yaba College of Technology, 1994 THESIS SUBMITTED IN PARTIAL FULFILLMENT OF THE REQUIREMENTS FOR THE DEGREE OF MASTER OF SCIENCE In the Faculty of Applied Sciences School of Interactive Arts and Technology O Olusola Adesope 2005 SIMON FRASER UNIVERSITY Summer 2005 All rights reserved. This work may not be reproduced in whole or in part, by photocopy or other means, without permission of the author
Transcript of Dynamic concept maps as knowledge representation tools for ...

DYNAMIC CONCEPT MAPS AS KNOWLEDGE REPRESENTATION TOOLS FOR LEARNING
Olusola 0 . Adesope PGD, Ladoke Akintola University of Technology, 1999
HND, Yaba College of Technology, 1994
THESIS SUBMITTED IN PARTIAL FULFILLMENT OF THE REQUIREMENTS FOR THE DEGREE OF
MASTER OF SCIENCE
In the
Faculty of Applied Sciences School of Interactive Arts and Technology
O Olusola Adesope 2005
SIMON FRASER UNIVERSITY
Summer 2005
All rights reserved. This work may not be reproduced in whole or in part, by photocopy
or other means, without permission of the author

Approval
Name: Olusola 0 . Adesope
Degree: Master of Science
Title of Thesis: Dynamic Concept Maps as Knowledge Representation Tools for Learning
Examining Committee:
Chair: Dr. John Bowes Professor, Interactive Arts & Technology
Dr. John C. Nesbit Senior Supervisor Associate Professor of eLearning
Dr. Janet McCracken Supervisor Assistant Rofessor of eLearning
Dr. David Kaufman External Examiner Professor of Education and Director, Learning and Instructional Development Centre
Date Defended: July 26,2005

SIMON FRASER UNIVERSITY
PARTIAL COPYRIGHT LICENCE
The author, whose copyright is declared on the title page of this work, has granted to Simon Fraser University the right to lend this thesis, project or extended essay to users of the Simon Fraser University Library, and to make partial or single copies only for such users or in response to a request from the library of any other university, or other educational institution, on its own behalf or for one of its users.
The author has further granted permission to Simon Fraser University to keep or make a digital copy for use in its circulating collection.
The author has further agreed that permission for multiple copying of this work for scholarly purposes may be granted by either the author or the Dean of Graduate Studies.
It is understood that copying or publication of this work for financial gain shall not be allowed without the author's written permission.
Permission for public performance, or limited permission for private scholarly use, of any multimedia materials forming part of this work, may have been granted by the author. This information may be found on the separately catalogued multimedia material and in the signed Partial Copyright Licence.
The original Partial Copyright Licence attesting to these terms, and signed by this author, may be found in the original bound copy of this work, retained in the Simon Fraser University Archive.
W. A. C. Bennett Library Simon Fraser University
Burnaby, BC, Canada

The author, whose name appears on the title page of this work, has
obtained human research ethics approval from the Simon Fraser
University Office of Research Ethics for the research described in
this work, or has conducted the research as a member of a project
or course approved by the Ethics Office.
A copy of the approval letter has been filed at the Theses Office of
the University Library at the time of submission of this thesis or
project.
The original application for ethics approval and letter of approval
is filed with the Office of Research Ethics. Inquiries may be
directed to that Office.
Bennett Library Simon Fraser University
Burnaby, BC, Canada

Abstract
The purpose of this thesis is to extend research on educational node-link
displays with animated multimedia presentation. The thesis focuses on an
empirical study of the learning effectiveness of a dynamic concept map
synchronized with audio presentation. 133 undergraduates, who were randomly
assigned to four groups, participated in this experiment. The two experimental
groups viewed plain and graphically enhanced concept maps that were
semantically equivalent to the narration. These animated concept maps were
synchronized with the audio track. The two control groups viewed text versions
of the narration, one synchronized with the audio track and another version
preceding the audio track. All visual presentations were incremental and
cumulative. Both map groups outperformed the text groups on a free recall test.
The plain map group outperformed the text groups on a comprehension test.
Implications of this work are discussed with respect to cognitive and multimedia
theories of learning.
iii

Dedication
To qod; who gave me the strength and
wisdom to compbte the we,
To my wlfe and two daughters who
endured my time away from home to
comphte this thesis.
To my parents, who prayedfor me.

Acknowledgements
Now, I can breathe a sigh of relief and move unto other challenges of life but with
great thanks and appreciation to those who have contributed to the completion of the
study. This thesis would not have been possible without my senior supervisor, Dr. John
Nesbit. He was very inspirational to the design of the study and gave me valuable support
and guidance throughout my program. Thank you, John. I can never forget what you have
done for me. I also thank my other supervisor, Dr. Janet McCraken who also stood by me
in the graduate school. Both of these supervisors supported my quest for knowledge and
gave me a chance when least expected. I would also like to thank the other members of
my examining committee, Dr. David Kaufman and Dr. John Bowes for their critical
evaluation and suggestions to improve the work.
To my dearest wife, Tolulope and my 2 daughters, Florence and Felicia, I say
thank you for bearing with my "I can't do that now because of my thesis". It is a great joy
to see this not only as a product of my effort but also your relentless support all through
my pursuit of this degree. I would like to thank my mother for being a great supporter,
taking care of the kids during the time of writing this thesis. We appreciate you so much
Mum and thanks for being there for us. To Dad, the younger ones and all other family
members who prayed along, I also say "thank you". I am most grateful for the great
support given me by all my family members.
Kindest regards to all my church folks and those who have supported my pursuits
over the years. I thank you all for your invaluable assistance, encouragement and most

importantly prayers for me as I ventured into this 'unknown territory. I am glad that we
can all share this success together and thank God for answered prayers.
I appreciate the enthralling academic environment provided by the School of
Interactive Arts and Technology (SIAT), Simon Fraser University. I thank the faculty
members, staff and fellow graduate students of the school. I especially thank Ben, Dan
and David for all the roles they played to make this work a success. I would continue to
cherish the memories of good things we graduate students have all achieved together in
the school. We have been product of change and the change has brought out the best of
us. It is indeed true that there is nothing as constant as change and the way we respond to
it shows our true character. We have all made the best use of the situation and would be
glad we did in years to come. The school has taught us not only academic lessons but also
important life lessons. I am very grateful for this.
Most importantly, I will like to thank God for giving me the strength to do this
work. I will forever be grateful for all the Lord has done for me.

Table of Contents . .
Approval ............................................................................................................................ 11
... Abstract ........................................................................................................................ 111 Dedication ......................................................................................................................... iv
Acknowledgements ........................................................................................................... v ..
Table of Contents ...................................................................................................... VII
List of Figures .................................................................................................................. ix
List of Tables ..................................................................................................................... x
List of Acronyms ............................................................................................................ xi
1 Introduction ............................................................................................................... 1 1.1 Background ......................................................................................................... 3
.................................................................................... 1.2 Statement of the Problem 5 ............................................................................................. 1.3 Research Questions 6
.................................................................................... 1.4 Significance of the Study 8
2 Literature Review ..................................................................................................... 9 ....................................................................................... 2.1 Theoretical Framework 9
........................................................................................... 2.1.1 Concept Maps 14 ...................................................................................... 2.1.2 Knowledge Maps 17
................................................................................... 2.1.3 Semantic Networks 19
................................................................................... 2.1.4 Graphic Organizers 20 ........................................................ 2.2 Meta-analysis of Concept Mapping Tools 22
......................... 2.3 Related Work - Computer-based Concept Mapping Research 28 .................................................................. 2.4 The Role of Animation in Learning 29
........................................................................................... 3 Research Methodology 32 ................................................................................... 3.1 Participants and Settings 32
3.2 Materials ........................................................................................................... 33 ......................................................................................... 3.3 Dependent Variables 38
........................................................................................................... 3.4 Procedure 38
...................................................................................................................... 4 Results 41 .................................................................................. 4.1 Scoring the Free Recall 4 1
........................................................................................................... 4.2 Covariate 42 4.3 Result of Free Recall Test ........................................................................... 43
4.3.1 Central Idea Recall .................................................................................... 44 4.3.2 Detail Idea Recall ...................................................................................... 46
4.4 Result of Multiple-choice Test ........................................................................ 47 4.5 Result of Interview ........................................................................................... 50 4.6 Discussion ...................................................................................................... 52
......................................................................... 4.6.1 Findings with Free Recall 53 ................................................................. 4.6.2 Findings with Multiple-choice 56
vii

5 Conclusion .......................................................................................................... 58 5.1 Summary and Implications ........................................................................... 58 5.2 Limitations and Recommendations for Future Research .................................. 59 5.3 Conclusion ......................................................................................................... 61
References ........................................................................................................................ 62
Appendices ....................................................................................................................... 69 Appendix A . Publication in Node-Link Displays ........................................................ 69 Appendix B . Multiple Choice Test .............................................................................. 70 Appendix C . Screenshot of Introductory Page ............................................................ 75 Appendix D . Screenshot of Review Page ................................................................ 76 Appendix E . Screenshot of "Start Test" ...................................................................... 77 Appendix F . Screenshot of "Free Recall Web Form" .................................................. 78 Appendix G . Screenshot of "web questionnaire logon page" ...................................... 79 Appendix H . Screenshot of "Web Questionnaire Multiple-choice Page" .................. 80 Appendix I . Excerpts from Interview .......................................................................... 81 Appendix J . Idea Units Developed for Scoring the Attribution Theory Passage ........ 83

List of Figures
Figure 1 . Concept Map showing overview of the study ...................................................... 2
.............. Figure 2 . Publication trends in concept. knowledge and node-link map research 3
................................................................. Figure 3 . General model of dual coding theory 12
Figure 4 . A concept map showing information about Nigeria .......................................... 16
Figure 5 . A knowledge map showing information about Nigeria ..................................... 18
................................................................... Figure 6 . Components of a semantic network 19
Figure 7 . Hierarchy of node-link spatial displays .............................................................. 21
Figure 8 . Graphic organizer showing layout of thesis ....................................................... 22
Figure 9 . Distribution of 63 effect sizes obtained from 49 studies .................................... 25
Figure 10 . Screenshot of the pMap material ............................................................... 36
Figure 11 . Screenshot of the sText material ................................................................ 37
Figure 12 . Adjusted mean scores for each group on comprehension and free recall . . 49

List of Tables
Table 1 . Results of Searches Conducted March. 2005 .................................................... 23
Table 2: Effect sizes of motivational or attitudinal outcomes ......................................... 26
Table 3 . Weighted Mean Effect Sizes for Participants and Settings ............................... 27
Table 4 . Weighted Mean Effect Sizes for Treatment Features ........................................ 27
Table 5 . Weighted Mean Effect Sizes for Outcome Constructs ...................................... 28
Table 6 . Weighted Mean Effect Sizes for Methodological Features ............................... 28
Table 7 . Structure of Material .......................................................................................... 34
Table 8 . Free Recall Performance of the Four Treatment Groups .................................. 43
.................... Table 9 . Free Recall Performance of Synchronized Text and Map Groups 44
Table 10 . Central Recall Performance .............................................................................. 45
....................... Table 11 . Performance of Synchronized Text and Map Groups (Central) 46
............................................................................. . Table 12 Detail Recall Performance 4 7
. Table 13 Performance of Synchronized Text and Map Groups (Detail) .......................... 47
Table 14 . Comprehension Performance of the Four Treatment Groups ........................... 48
....... Table 15 . Comprehension Performance of the Synchronized Text and Map Groups 49

List of Acronyms
CALL:
CI:
C-Map:
CRH:
DCT:
ES:
ESL :
gMap:
GO:
k-Map:
N :
nText :
pMap:
SE:
SLA:
sText:
TCU:
Computer Aided Language Learning
Confidence Interval (lower and upper bounds - in meta-analysis)
Concept map
Conjoint Retention Hypothesis
Dual coding theory
Effect size
English as a Second Language
Graphically enhanced map
Graphic organizer
Knowledge map
Number of studies (in meta-analysis), sample size (in single study)
Non-synchronized text
Plain map
Standard Error
Second Language Acquisition
Synchronized text
Texas Christian University

1 Introduction
This thesis is divided into 5 chapters. Chapter 1 is a statement of the motivation
for this research and the problem being addressed. Also discussed in this chapter are the
research questions driving this work and the significance of the study with respect to
node-link mapping research. Chapter 2 provides a review of relevant literature starting
with the theoretical framework of concept and knowledge map as well as a description
and results of a meta-analysis of the literature on concept mapping and learning. Chapter
3 outlines the methodology of the research and highlights the participants of the study,
the setting under which it was conducted, the multimedia materials used, the dependent
variables and the procedure for the study. Chapter 4 reports and discusses the results of
the study and Chapter 5 concludes with findings and limitations of the study and
recommendations for future research. The general overview of the study is shown in
Figure 1 in a concept map format.

Fig
ure
1.
Con
cept
Map
sho
win
g ov
ervi
ew o
f the
stud
y

1 . Background
Over the last three decades, researchers have demonstrated increasing interest in
the instructional use of node-link spatial tools such as concept maps (Novak, 1990a;
1990b) and knowledge maps (O'Donnell, Dansereau & Hall, 2002; Dansereau &
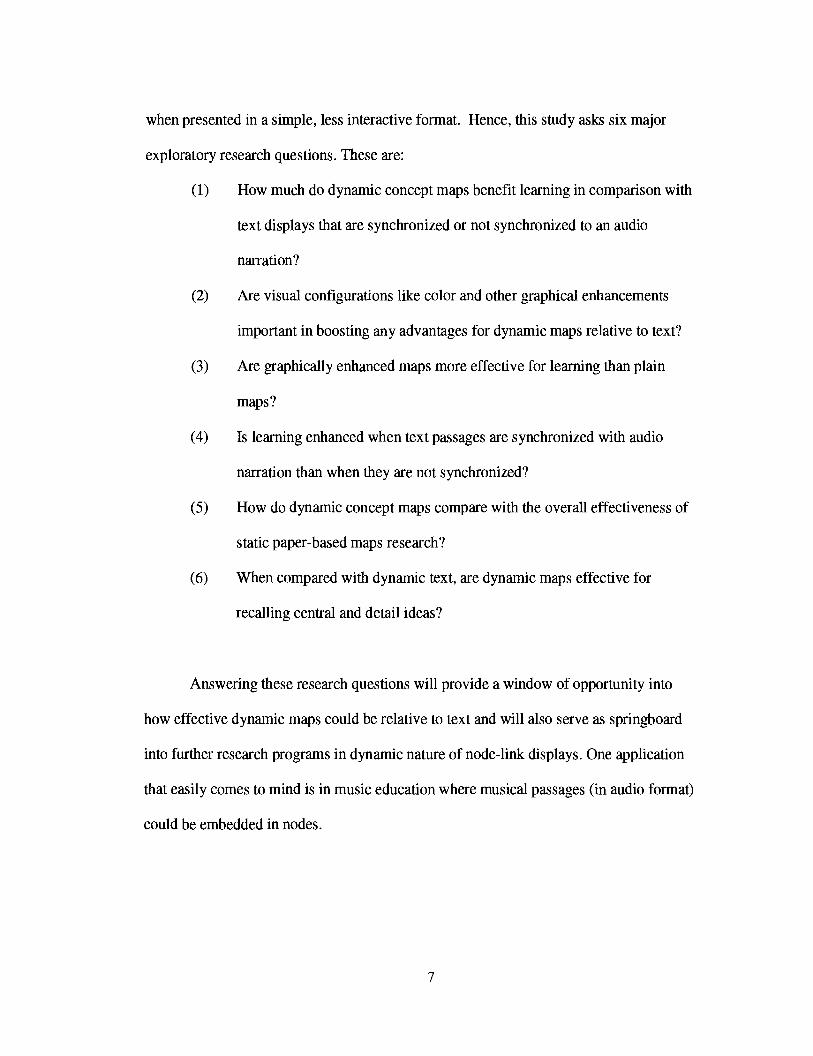
Newbern, 1997). Figure 2, constructed from data in Appendix A, shows the historical
account of literature on node-link displays since 1970. This figure reveals that interest in
this area of research has grown since the early 80s with Novak & Gowin's (1984)
publication on learning how to learn.
Concept & Knowledge Map Literature
Year
Figure 2. Publication trends in concept, knowledge and node-link map research. The graph shows studies retrieved with the search term (concept or knowledge or node- link) map* in March 2005.

There has been widespread use of node-link spatial tools for learning. Research
has extensively showed that these tools can promote learning because of their inherent
characteristics. One of the reasons attributed to the effectiveness of node-link maps is its
minimum use of text, which makes it easier for students to scan for information in spatial
tools than in texts (Plotnick, 1997). Furthermore, there are several empirical studies that
have validated the hypothesis that node-link spatial tools are effective because of
reduction in the amount of verbiage in comparison to typical text (07Donnell &
Dansereau, 2002; Blankenship & Dansereau, 2000). Compared with typical academic
language, node-link maps offer a relatively consistent and simple syntax (node-link-
node). They may be easier to comprehend for learners with lower verbal ability or
learners studying in a second language. Also, unlike texts that have only one processing
fashion, i.e. top-down and left-right; node-link spatial tools have different processing
routes (Lambiotte et al., 1989). This is very useful for cognitive processing and could
facilitate meaningful learning. Irrespective of these advantages of node-link maps over
conventional text, there are few shortcomings that may reduce the efficiency of these
node-link displays.
One of these shortcomings is commonly known as map shock (Dansereau, Dees
& Simpson, 1994), which occurs when learners are overwhelmed by the complexity of
map display. When learners are presented with a static map with many nodes and linking
labels, they may be overwhelmed by the map, especially if they are not regular users of
concept maps. Map shock could lead to ineffective processing of map elements and could
also lead to lack of motivation to process the map. An approach to eliminate map shock
was proposed by Blankenship & Dansereau (2000) where students were presented with

animated node-link maps projected onto a screen. However, this approach poses another
problem as students did not have control of the animation. For some students, the
animation might have been too fast and for some, it might have been too slow. While
Blankenship et al. approach was intended to eliminate map shock, it might have
introduced negative affective reactions in low motivation to studying the material.
Another problem with static node-link display is poor visual configuration.
Wiegmann, Dansereau, McCagg, Rewey & Pitre (1992) proposed that concept maps may
be less effective if they fail to use node proximity to signal semantic similarity. Wallace,
West and Ware (1998) found that learners who studied plain concept maps attained only
a .35 standard deviation advantage over learners who studied a text passage; while
learners who studied a concept map enhanced with colors, node shapes and structural
arrangements to emphasize semantic relatedness attained a 1.1 standard deviation
advantage over the text group.
1.2 Statement of the Problem
The huge volume of literature in node-link tools has shown the effectiveness of
concept and knowledge maps as tools for improving learning. However, since most of
these findings were observed from paper-based medium research, more studies should be
conducted in a computer-based environment. While some authors have theorized that
node-link display could be a powerful learning medium when implemented as interactive
software (Canas et al., 2003; Novak, 2002), our meta-analysis of node-link map research
(Nesbit & Adesope, 2005) found only four methodologically sound, published studies
that investigated computer-based concept map applications (Blankenship & Dansereau,

2000; Chang, Sung & Chen, 2002; Reynolds, Patterson, Skaggs & Dansereau, 1991;
Reynolds & Dansereau, 1990). The small number of studies indicates the need for further
methodologically sound research on node-link displays using computers.
Furthermore, only one of these studies tested the effect of animation in learning
through mapping. Animation, if effectively implemented, can enhance learning. Thus, we
would like to test the effect of animated node-link maps with self-paced control. Lastly,
none of these four computer-based studies or any of the node-link research has ever
addressed the effectiveness of audio narration with concept mapping. This is one
opportunity that computer-based node-link tools can afford. Explanations have been
suggested for the positive effects of concept maps on learning that refer to their dual,
visual-verbal format. Viewing or constructing maps may produce dual coding, that is,
cognitive representation of the information in both verbal and visual memory (Paivio,
1986). In other contexts, presenting integrated pictorial and verbal representations has
been shown to enhance knowledge retention and transfer (Mayer, 2001). If concept maps
are partially processed by the visual channel of working memory, they may avoid
overloading the verbal channel and consequently improve learning. Therefore, this study
will attempt to test the effectiveness of dual coding (through audio narration) with
concept maps over texts.
1.3 Research Questions
Drawing largely from the body of literature we have in knowledge representation
through node-link maps, we found out that there are still a number of issues that need to
be addressed. Before we advance to complex, interactive designs with dynamic concept
maps, we believe it is important to establish that dynamic maps can function effectively
when presented in a simple, less interactive format. Hence, this study asks six major
exploratory research questions. These are:
How much do dynamic concept maps benefit learning in comparison with
text displays that are synchronized or not synchronized to an audio
narration?
Are visual configurations like color and other graphical enhancements
important in boosting any advantages for dynamic maps relative to text?
Are graphically enhanced maps more effective for learning than plain
maps?
Is learning enhanced when text passages are synchronized with audio
narration than when they are not synchronized?
How do dynamic concept maps compare with the overall effectiveness of
static paper-based maps research?
When compared with dynamic text, are dynamic maps effective for
recalling central and detail ideas?
Answering these research questions will provide a window of opportunity into
how effective dynamic maps could be relative to text and will also serve as springboard
into further research programs in dynamic nature of node-link displays. One application
that easily comes to mind is in music education where musical passages (in audio format)
could be embedded in nodes.

1.4 Significance of the Study
While it is true that the huge literature on node-link displays has proved their
effectiveness as learning tools, there is only one study on animated node-link maps. This
study is an attempt to contribute to research on node-links maps in the following ways:
First, this study sets out to seek a deeper understanding of whether audio narration
synchronized with node-link displays will produce a better learning effect than
synchronized text. This will be the first study to investigate audio narration in node-link
research and will open up another dimension in this area of research.
Moreover, the study will not only contribute to the body of research in node-link
displays but also extend the research base on computer-based mapping tools. Nesbit and
Adesope (2005) observed that there are only four published methodologically sound
empirical studies on computer-based concept maps. Hence, this will be another big step
towards enhancing the effectiveness of concept maps through the use of the computer.
Finally, this study has the potential to extend the design of knowledge
management tools we currently have (e.g. Inspiration, CMapTools, etc). With the result
of the research, there are possibilities that providing learners with dynamic mapping tools
could enhance learning. Thus, the study has both social and conceptual justifications for
it to be conducted.

2 Literature Review
This chapter will review literature on node-link displays. It consists of four parts.
The first part reviews theoretical frameworks of concept maps by examining their origins
in work by Novak and his research associates, based on Ausube17s assimilation theory of
meaningful learning. Another theory driving this study is Paivio's dual-coding
hypothesis. There is also a brief review of schema theory. The second part of the
literature review deals with the meta-analysis of empirical research in node-link literature
while the third part is a review of computer-based mapping literature. The last part
highlights the role of animation in learning with respect to node-link literature.
2.1 Theoretical Framework
The cognitive revolution of the 1960s paved the way for several theories which
led to the development of spatial learning tools that mimic the way information is stored
in human memory. Novak and Gowin (1984) traced the history of the development of
concept map to Ausubel's assimilation theory of cognitive learning which states that new
information is linked to relevant, preexisting aspects of cognitive structure and both the
newly acquired information and the preexisting structure are modified in the process to
form a more highly differentiated cognitive structure (Ausubel, 1963; 1968). Ausubel
asserts that the most important factor influencing learning is what the learner already
knows. In Novak7s quest to better understand "what the learner already knows", he and
his research team faced the arduous task of determining how changes in children's
knowledge of science were occurring in first and second grades students over a period of
12 years. As reported in Novak and Musonda (1991), this study eventually led to the
development of the concept mapping tool. Node-link diagrams have been used for
education since at least the 13th century, as depicted in the "Tree of Porphyry" (Sowa,
2000). However, Novak appears to be the first author to use the term "concept map" for
such diagrams.
Closely related to Ausubel's assimilation theory is schema theory, which
emphasizes the importance of prior knowledge to learning. A schema is a structure that
portrays the way knowledge is represented and processed in memory. Schema theorists
(Rumelhart, 1980; Norman & Rumelhart, 1981) have posited that schemas are dynamic,
and existing schemas can be modified or expanded as new schemas are constructed or
added to the existing ones. It is common for people to use their schemas constructed from
previously experienced situations to interpret new, related experiences. Integration and
assimilation of new information with prior knowledge and experiences help people to
obtain more generalized structures and make new sense of situations and information as
they get integrated with prior information. For example, my personal experience of
grocery shopping before I came to North America was purely that of an open market
system where there is price haggling during grocery shopping. That was what I had as
schema of shopping based on my prior knowledge and experience. However, when I
came to North America, my shopping schema was expanded to include mall shopping
and other forms of fixed-price shopping which were not originally parts of my shopping
schema. Some cognitive theorists have worked on network models to explain how
semantic information is organized in the memory. One such theorist is Quillian (1968)
who researched node-link representations of long-term memory called semantic

networks. He suggested that human memory may be organized as a network-like
structure consisting of nodes, which correspond to concepts, and links, which represent
the relations between the concepts.
Stoyanova & Kommers (2002) noted that an important advantage of concept
mapping is that it models the way the human memory organizes knowledge and also
offers close correspondence between psychological constructs and their external mode of
representations. It appears that spatial displays that conform to this node-link
representation seem to benefit learning because learners are more capable of encoding
and retrieving information in that format.
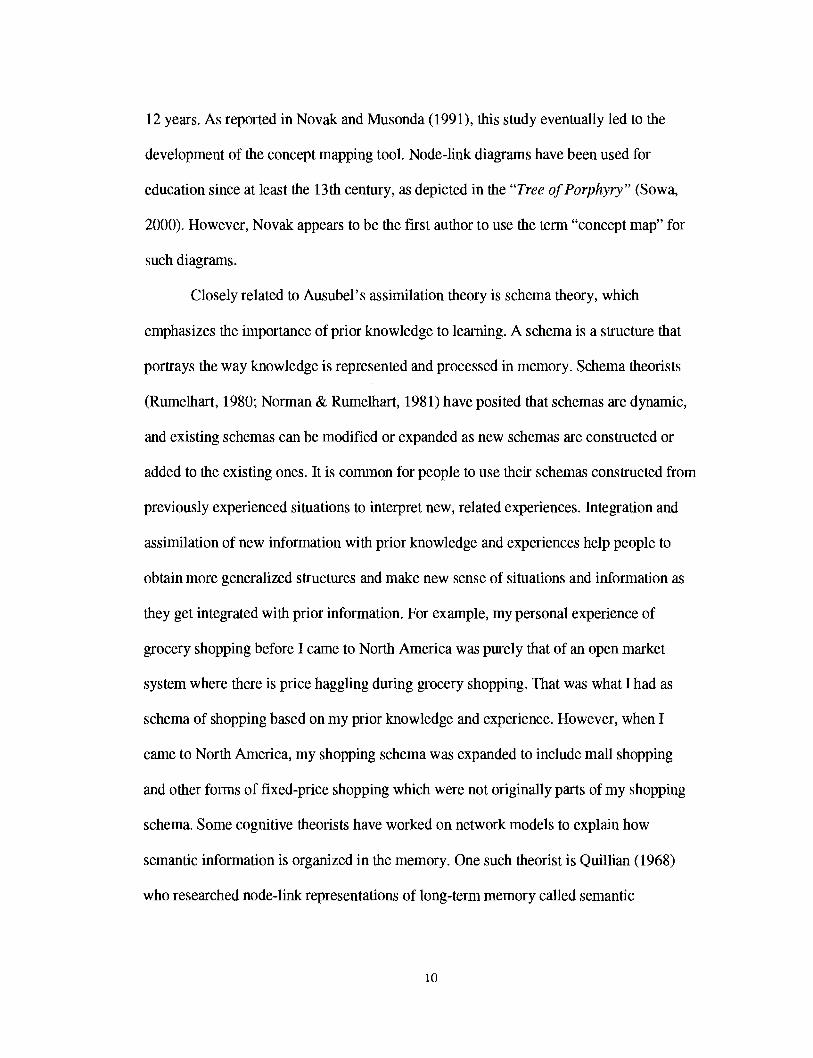
Another important theory supporting this work is Paivio's dual coding theory,
popularly called DCT (Paivio, 1986; 1991). As shown in Figure 3, Paivio theorized that
there are two different memory representations for verbal and visual information and that
connection between these representations afford easier retrieval of information and
consequently leads to improved learning. Because short-term memory is limited in
capacity, information processing can deteriorate when dealing with too much
information. The big challenge then is finding ways by which we can organize
information for increased attention and encoding. Dual-coding theory plays a huge role in
this attempt by supporting the effectiveness of multiple-channel communication. Viewing
or constructing maps in conjunction with text or spoken presentations of the same
information may support dual coding. Although dual coding may not be effective for
depicting abstract knowledge, the theory has thrived in the representation of concrete
knowledge or objects. For example, while it may be challenging to code the abstract word

"honest" as an image, it is easier to code the word "bird". Nevertheless, it is a theory
which is relevant to this concept map research.
Figure 3. General model of dual coding theory
Paivio contends that information supported by both aural and visual cues have the
potential to increase retention. Empirical studies have shown that visual information
helps to process and remember verbal information and vice versa (Mayer & Anderson,
1991). Multiple-channel communication is very prevalent in our society today with the
advent of several technologies like cell phones, television, movies and games. We often
see people using cell-phone in parallel with typing on the computer and doing other
things. Even in face- to-face communication, we simultaneously process verbal and non-

verbal information. Thus, we know, to a certain extent, that multiple-channel
communication and dual-coding could play a great role in learning. However, the
effectiveness of dual-coding in node-link displays like concept maps using audio
narration has not been studied. If concept maps are partially processed by the visual
channel of working memory, they may avoid overloading the verbal channel and
consequently improve learning. Understanding concept maps may require translation
between visual and verbal information and thus promote cognitive processing.
Although some concept mapping software allows users to represent each node as
an image, none of the literature reviewed examined this idea of 'mimetic' icons, i.e.
pictures that help the learners to retrieve prior knowledge about the concept and code the
concept as an image. We know that when information is referenced in a text and
accompanying map, they are encoded both verbally (as in a text or spoken text) and
spatially (as in a map) and thus offer a dual-coding advantage for storing and retrieval of
such information (Paivio, 1986). This extension of dual-coding theory is called the
conjoint retention hypothesis (CRH) because both the map and the text are "conjointly
retained (Kulhavy, Lee & Caterino, 1985).
While it is true that this work is not rooted in research in mental imagery, it has
derived inspiration from it. Kosslyn's (1989) work on understanding charts and graphs,
especially the important laws in graphical displays is worthy of mention. However,
untangling the inconclusiveness of mental imagery research debate (Kosslyn,
1994; Pylyshyn, 1994) is outside the scope of this work.
Although node-link representational systems were originally developed to provide
models of semantic memory structures and mental processing (Rumelhart & Norman,

1985); they have since afforded researchers the opportunity for developing spatial
learning tools using this framework. Given an understanding of the way learners
represent information internally, the major steps then was to find learning tools that can
boost this internal representation. Based on Ausubel's theory of assimilation, schema
theory, node-link models, and the assumption that effective and efficient learning
strategies encourage learners to construct structures that parallel actual mental processing
(Holley & Dansereau, 1984), major spatial learning strategies have been developed,
including Dansereau's knowledge mapping (Rewey et al., 1989; Holley & Dansereau,
1984) and Novak's concept mapping (Novak & Gowin, 1984). Concept and knowledge
maps can either be presented to students (Cliburn, 1986; Lambiotte & Dansereau, 1992)
or constructed by students (Chang, Chen & Sung, 2002; McCagg & Dansereau, 1991).
It would be ambitious to attempt to describe all the literature pertaining to these
node-link spatial tools. For brevity and clarity, we describe a few selected papers that are
relevant to this work. Extensive review of literature in concept and knowledge maps
could be found in Novak (1990a; 1990b) and O'Donnell, Dansereau & Hall (2002)
respectively. A brief highlight of these node-link spatial learning tools is given below.
2.1.1 Concept Maps
Concept maps are visuo-spatial formats that facilitate the organization,
presentation, processing and acquisition of knowledge. Their development is grounded in
cognitive learning theory. Building on Ausubel's theories of assimilation and
subsumption (Ausubel, 1968), seminal work by Novak (1977) from Cornell University
emphasized the potential of concept mapping for constructing new knowledge in relation
to prior knowledge. Ausubel(1968, pg. 34) contended that "the most important single

factor influencing learning is what the learner already knows. Ascertain this and teach
him accordingly. " A primary process in learning is subsumption in which new material is
related to relevant ideas in the existing cognitive structures. Concept maps were
developed in the course of Novak's research in which he sought to understand changes in
children's knowledge of science.
A concept map consists of nodes that contain a concept or item and links
connecting the nodes. Links, which show relationships between the nodes, can be non-
directional or uni-directional and can also be labeled or unlabelled. An example of a
concept map showing information about Nigeria is shown in Figure 4. The figure below
is also an example of a uni-directional concept map. Labels can be used in a variety of
ways to illustrate the semantic relationship between the nodes. For example, the figure
below shows that Nigeria "is in" West Africa and it "is part of' Africa.

Figure 4. A concept map showing information about Nigeria
As previously discussed, Novak and Musonda (1991) reported that a 12-year
longitudinal study of children's concept development led to the invention of concept
mapping tool. In that study, concept map was used to monitor changes in conceptual
understanding of science students over a 12-year period. Thereafter, concept map has
been refined and used also as a tool for studying because of its summarization ability.
They have also been used as advance organizers (Willerman & MacHarg, 1991); as
assessment tools (Ruiz-Primo & Shavelson, 1996; Schmid & Telaro, 1990); cooperative
learning tools (Stoyanova & Kornmers, 2002); as anxiety reduction tools (Czerniak &
Haney, 1998; Jegede, Alaiyemola & Okebukola, 1990) and as communication tools for
organizing ideas and promoting problem solving strategies (Okebukola, 1992).

2.1.2 Knowledge Maps
Dansereau, Holley, and their colleagues from Texas Christian University (TCU)
developed a node-link representational system called knowledge map (Holley &
Dansereau, 1984). In knowledge maps, learners are given a set of fixed named links (e.g.
"P" for part of, "L" for leads to, "C" for characteristics) to identify important concepts in
the material and represent interrelationships and structures in the form of a network map.
Knowledge maps are diagrams that use a spatial arrangement of nodes and links to
communicate about concepts and to specify the multiple relationships among concepts in
a given knowledge domain (Larnbiotte, Dansereau, Cross & Reynolds, 1989; Lambiotte
& Dansereau, 1992; Rewey, Dansereau, Dees, Skaggs & Pitre, 1992; Rewey, Dansereau
& Peel, 1991). Knowledge maps are mostly generated by experts rather than by novices
(students) and have been found to facilitate recall when used in conjunction with other
learning strategies such as summarization (Rewey et al., 1991) and cooperative learning
(Rewey et al., 1992). Knowledge maps have also been used for drug abuse counseling
(Dansereau, Joe & Simpson, 1993; 1995).
Figure 5 shows a transformation of information about Nigeria in Figure 4 into a
knowledge map. There have been consis tent findings in knowledge map research over
the years. Studies have shown that knowledge maps enhance performance on delayed
free recall, especially for main ideas (Hall & O'Donnell, 1996; Larnbiotte & Dansereau,
1992; Rewey, Dansereau & Peel, 1991). Furthermore, knowledge maps have aided
learning for users with low prior knowledge and low verbal ability (Patterson, Dansereau
& Wiegrnann, 1993; Lambiotte & Dansereau, 1992). Researchers have also studied the
affective outcomes of maps (Bahr & Dansereau, 2001; Hall & O'Donnell, 1996).

Figure 5. A knowledge map showing information about Nigeria
In summary, concept and knowledge maps are diagrams showing
interrelationships among concepts as node-link assemblies. Research has explored the use
of such diagrams as the focus of constructive activities, and as communication aids in
lectures, study materials and collaborative learning (Canas et al., 2003). The only major
difference between a concept map and a knowledge map is the use of fixed links in
knowledge maps. With this minor difference, we will henceforth use the term concept
map for both concept and knowledge maps because of their similarities.

2.1.3 Semantic Networks
Some researchers have loosely used the term semantic network to mean concept
maps (Jonassen, 2000; Jonassen, Reeves, Hong, Harvey & Peters, 1997). However,
semantic networks are somewhat different from concept maps in that semantic networks
are knowledge representation schemes (and not tools) involving nodes and links. As in
concept maps, the nodes represent concepts and the links represent relations between
nodes. However, the links in semantic networks are directed and labeled; thus, a semantic
network could be termed as a directed graph. Apart from concepts being linked by
relations, one other component of a semantic network is called an instance. An instance
of a relation is the occurrence of two concepts linked by that relation. One of the early
theorists of semantic memory structure hinted that human memory can be organized in
node-link-node format (Quillian, 1968). Since then, researchers have extended this idea.
Semantic networks as representation of knowledge are now being used in artificial
intelligence (AI) research for human reasoning and ontological work.
Figure 6. Components of a semantic network

Although there are other types of node-link spatial displays like pathfinder
networks, which are node-link network displays originally used to analyze and model
patterns in proximity data (Schvaneveldt, Durso & Dearholt, 1989), we have only
described the above three node-link spatial displays (concept map, knowledge map and
semantic network) because they have been used extensively in the mapping literature.
The next type of display we describe is the graphic organizer. It is not a node-link
display but is presented here because it has also been used as spatial display for learning.
2.1.4 Graphic Organizers
Another type of spatial display of text information is the graphic organizer (GO).
Graphic organizers show relationships among concepts by two-dimensional visual
devices like spatial position, connecting lines, and intersecting figures (Winn, 1991).
According to Katayama & Robinson (2000), GOs are similar to knowledge and concept
maps because they use two-dimensional space to communicate concept relations. Figure
7 below shows the relationships between graphic organizers and other types of spatial
displays that we have previously described.

Graphic Organizers
1
Semantic Networks
I
1 Pathfinder Networks 1
[ nowl ledge Maps 1
Figure 7. Hierarchy of node-link spatial displays
Graphic organizers can be regarded as a category that subsumes concept maps,
tables, and timelines, and flowcharts, because they spatially represent abstract knowledge
that is not inherently visual. GOs were inspired by Ausubel's theory of meaningful
learning (Ausubel, 1968) and initially designed as advance organizers to activate prior
knowledge and show its relationship with new concepts being learned. Concept map is a
type of graphic organizer that is distinguished by the use of labeled nodes and links. We
also view knowledge maps as a form of concept maps because they both spatially use
"node-link-node" syntax to depict knowledge.
GOs are spatial displays of text information that can be provided to students as
study aids (i.e., adjunct displays) that accompany text. However, GOs do not use labeled
links to show relationships among concepts but rather use only the relative spatial
locations of words. Several researchers have found that when students are provided with

GOs to study along with text, they perform better (e.g., Robinson & Kiewra, 1995;
Robinson & Schraw, 1994, Katayama & Robinson, 2000). A review by Moore &
Readance (1984) shows that GOs are effective when they follow the presentation of
content while a recent study by (Robinson, Corliss, Bush, Bera & Tomberlin, 2003)
suggests that multiple GOs might be presented as a set before the text is presented so as
to learn more macrolevel, concept related text information effectively. A layout of this
thesis in a graphical organizer format is shown in Figure 8.
Figure 8. Graphic organizer showing layout of thesis
1. Introduction
2. Literature Review
3. Methods
4. Results
5. Conclusion
In summary, we know that all the tools discussed so far are spatial and are used to
organize knowledge for proper encoding and retrieval. The next section reports our work
on integrative review or meta-analysis of two of these spatial tools, i.e. concept and
knowledge maps.
Effect size of free recall = .94
Effect size of comprehension = .65
2.2 Meta-analysis of Concept Mapping Tools
Meta-analysis, developed by Gene Glass, is an integrated review of literature in a
specific domain. In meta-analysis, research results, and not people, are summarized,

integrated and interpreted (Lipsey & Wilson, 2001). Initial aggregation of empirical
research of concept mapping tools was conducted by Horton et al. (1993). In this work,
18 classroom-based concept map studies were meta-analyzed. None of the studies
investigated the effect of computer-based maps on learning. They were mainly studies
conducted with paper-based maps. These researchers only aggregated the results of
classroom-based studies but did not look into laboratory studies. A more comprehensive
meta-analysis was done by Nesbit & Adesope (2005). Compared with the meta-analysis
by Horton et al., we expanded the inclusion criteria to cover laboratory studies in which
learners volunteered as research participants and the learning outcomes were not used for
grading purposes. Although such studies have lower ecological validity they are usually
better controlled and, as it happens, include many studies in which maps are presented
rather than constructed.
This meta-analysis reviews experimental and quasi-experimental studies in which
students learned by constructing, modifying or viewing node-link diagrams. We searched
the databases listed in Table 1 using the search query: "concept map*" OR "knowledge
map*" OR "node-link map*".
Table 1. Results of Searches Conducted March, 2005
database number of studies
ERIC 837 Web of Science 500 Ps ycInfo (empirical studies) 359 Ps yc ARTICLES 326 Academic Search Elite 23 6 Digital Dissertations 159
Apart from searches from online databases, we did physical search for relevant
papers by looking into the reference sections of a few comprehensive review papers
(Canas et al., 2003; Horton et al., 1993; Novak, 1990b; O'Donnell, Dansereau & Hall,
2002). In the selection phase, I, as one of the researchers, read the abstract or online text
of each study found in the search. If the abstract did not provide sufficient information to
exclude the study according to our selection criteria, the researcher scanned the methods,
procedure and data collection parts of the paper to retain or exclude the paper. Borderline
cases were retained for further inspection. For each thesis found through the Digital
Dissertations database, the researcher read the first 24 pages to determine eligibility for
inclusion. Studies identified as not meeting the selection criteria were eliminated,
resulting in a list of 103 studies for which full text copies were obtained.
Following a preliminary examination of empirical studies and reviews, we formed
criteria to capture studies with research designs testing the educational and learning
effects of concept maps. To be included in the meta-analysis, studies were required to
have: (a) contrasted effects of map studying, construction or manipulation with other
learning activities. Contrasting groups must have activities designed to promote learning;
(b) measured cognitive or motivational outcomes such as recall, problem solving transfer,
learning skills, interest or attitude; (c) reported sufficient data to allow an estimate of
standardized mean difference effect size; (d) assigned participants to groups prior to
differing treatments; (e) randomly assigned participants to groups, or used a pretest or
other prior variable correlated with outcome to control for pre-existing differences among
groups. Studies reporting a pretest effect size outside the range -.40 < d < .40 were
excluded from the meta-analysis.
Following an exhaustive search for studies meeting specified design criteria, 97
standardized mean difference effect sizes were extracted from 50 studies involving 5,141

participants who learned in domains such as science, psychology, stat.istics, and nursing
with an inter-coder agreement of 96.2%. A mean effect size was obtained for each set of
statistically dependent effect sizes by averaging over different outcome conskucts and
treatments, yielding 63 effect sizes. Figure 9 shows the distribution of these effect sizes.
Unbiased effect size
Figure 9. Distribution of 63 effect sizes obtained from 49 studies ( M = .43, SD = .49, Mdn = .41)
Generally, we found that students like concept maps because they derive greater
satisfaction in the use of maps. As shown in Table 2, six accepted studies measured
students' self-report outcomes. These affective outcomes were tagged as affect (anxiety,
fiuskation with learning, satisfaction), self-efficacy, motivation, and perceived use of

learning strategies. Due to limited number of studies measuring self-report outcomes, we
decided not to meta-analyze them. Instead, these six studies, as shown in Table 2, portray
vividly, students' perception of their use of concept map for learning.
Table 2: Effect sizes of motivational or attitudinal outcomes Effect sizes for concept map studies that obtained self reports of affect, self-efficacy, motivation, and use of learning strategies.
Study, treatments, sample size and outcome construct Effect size
Bahr and Dansereau (2001), studying bilingual maps versus lists, N = 64 ease of learning satisfaction with presentation format motivation and concentration confidence in future performance
Chulerut and De Backer (2004), mapping versus teacher-led discussions, N = 79 use of self-monitoring strategies use of knowledge acquisition strategies English as a second language self-efficacy
Czerniak and Haney (1998), cooperative mapping versus lecture, N = 118 anxiety toward teaching and learning (sign reversed)
Jegede and Alaiyemola (1990), mapping versus lectures, N = 51 anxiety (sign reversed)
Reynolds and Dansereau (1990), studying hypermaps versus hypertext, N = 38 satisfaction frustration and confusion (sign reversed)
Reynolds et al. (1991), studying hypermaps versus hypertext, N = 38 satisfaction frustration and confusion (sign reversed)
The remaining studies measured outcomes such as retention, transfer and mixed
retention & transfer. In a variety of settings the use of concept maps was associated with
moderate and statistically significant increments in knowledge retention, and under some
conditions greater knowledge transfer. We found that studies comparing learning from

concept maps to learning from text passages show that studying maps offers gains in
learning outcomes averaging about d=.36 standard deviations. Tables 3 to 6 below from
our meta-analysis (Nesbit & Adesope, 2005) show the summary of the effect of
constructing or studying with concept maps.
Table 3. Weighted Mean Effect Sizes for Participants and Settings
Maps Constructed or Modified Maps Studied n mean SE CI Qs n mean SE CI Q~
Educational level Intermediate (4-7) Secondary (8-12) Postsecondary
Setting; Laboratory Classroom
Location US and Canada Nigeria Asia
Table 4. Weighted Mean Effect Sizes for Treatment Features
Maps Constructed or Modified Maps Studied n mean SE (3.95 n mean SE (3 .95
Treatment Duration Less than 90 rnin. 2 .86* .17 .53 o 1.18 26 .27* .05 .17 o .37 Greater than 90 min. 13 .94* .07 .81 o 1.08 14 SO* .06 .38 o .62
Student Interaction Individual 9 .42* .07 .27 o .56 32 .36* .04 .28 o .45 Collaborative 2 .83* .16 .51 o 1.15 7 .24* .ll .02 o .46 Mixed 10 .88* .08 .72o1 .04 0 -
Adjunct Materials No adjunct materials 1 .36 15 .43* .06 .31 o .54 Text 19 .44* .05 .38 o .54 18 .26* .06 .14 o .38
Control Task Text 3 .75* .13 S O o 1.01 26 .35* .05 .26 o .45 Outline or list 3 .05 .09 -.I2 o .22 12 .30* .08 .15 .44 Lecture or discussion 12 .92* .07 .78 o 1.05 1 .68 Other 7 .32* .01 . I3051
Animation 0 - 2 .76* .17 .42 o 1.09

Table 5. Weighted Mean Effect Sizes for Outcome Constructs
Maps Constructed or Modified Maps Studied n mean SE CI.95 n mean SE CI.95
Retention only 6 .44* .10 .24 o .65 31 .35* .04 .26 o .43 Mixed retention and transfer 15 SO* .05 .40 o .61 3 .28 .17 -.05 o .60 Transfer only 1 1.23 - 3 .16 .15 - .14o .45 Learning skills 2 .65* .16 .33 0 . 9 7 0 -
Table 6. Weighted Mean Effect Sizes for Methodological Features
Constructed or Modified Studied n mean SE CI.95 n mean SE CI.95
Confidence in ES LOW 4 .14 .10 -.05 <> -33 1 .43 Medium 10 .30* .07 .17 o .43 6 .30* .10 . 1 1 0 . 4 8 High 11 1.10* .07 .9601.25 31 .35* .05 .27 o .44
Treatment Fidelitv LOW 4 .09 .09 -.08 0.27 1 -.lo Medium 6 .77* .12 .54 o .99 9 .34* .09 .17 o .52 High 15 .69* .06 .58 o .81 28 .36* .05 .27 o .45
Random Assignment Yes 7 .81* .10 .6001.01 35 .33* .04 .24 o .40 No 18 .49* .05 .40 o .59 3 .48* .ll .26 o .70
* p < .OS
2.3 Related Work - Computer-based Concept Mapping Research
Our meta-analysis revealed that there are only four methodologically sound,
published empirical studies that investigated computer-based concept map applications
(Blankenship & Dansereau, 2000; Chang, Sung & Chen, 2002; Reynolds, Patterson,
Skaggs & Dansereau, 1991; Reynolds & Dansereau, 1990) in spite of researchers'
observations that concept maps may be a powerful learning medium when implemented
as interactive software (Canas et al., 2003; Novak, 2002). Also, only the Blankenship &

Dansereau (2000) study investigated the effect of animation on learning through maps.
Chang et al. (2002) studied 126 elementary students using educational concept mapping
software and a text passage to correct or complete a concept map provided by the teacher.
The software provided feedback indicating the degree of correctness of the map. In
comparison with simply studying the text, students in the map correction condition
showed a mean gain in comprehension ability of approximately one standard deviation.
In a study by Blankenship and Dansereau that tested the effect of animated node-link
displays on information recall, 37 students were given an animated node-link map
presentation while 27 studied animated text presentation. Two days later, participants
recalled more main-idea information from animated node-link maps than from animated
text. This study is the most related work with respect to our research because of the use of
animation. However, the animation used was not designed to be controlled by the
students. All the subjects in the map group only saw projected animated map from a
slide. This research will not only allow self-paced animated maps but will also include
audio narration.
In Reynolds et al. (1990; 1991) studies, subjects worked with computer-based
hypermaps and hypertext. Both studies showed that hypermaps were not superior to
hypertext for learning but students reported greater satisfaction and less frustration and
confusion with hypermaps.
2.4 The Role of Animation in Learning
Animation has been defined as a series of rapidly changing computer screen
displays that represent the illusion of movement (Rieber & Rannafin, 1988). Over the

years, some researchers have had success using animation to support learning (Mayer,
2001; Szabo & Poohkay, 1996; Rieber, 1990).
Recent technological advances have helped in the use of animation for learning
purposes. However, the use of animation has been consistently questioned in the
literature. Rieber (1996) argues that animation could distract from learning when it is
used as a 'cosmetic function' to make the material more attractive or aesthetically
appealing. There are tendencies that learners' attention could be drawn away from the
actual learning material to the 'cosmetic' part of the animation thereby resulting in less
cognitive processing of the material and consequently in less meaningful learning. This
could be explained by the information processing theory of learning, which infers that
students' attention could be easily distracted as a result of stimuli competing for the
attention of students. This theory was taken into consideration in the design of animation
in this study on animated concept maps. The animated maps and texts were designed only
to convey the material and not for 'cosmetic' purpose.
Recently, Tversky, Morrison and Betrancourt (2002) argued that animation
violates the apprehension principle of good graphics, which states that graphics should be
accurately perceived and appropriately conceived. These authors further contend that
animations are often too complex and too fast to be accurately perceived and thus could
be detrimental to learning.
We propose that this shortcoming of animation may be minimized or even
resolved when learners can control the speed and also review the animation. In the
concept mapping studies we reviewed, none followed this self-paced principle of learning
with studying animated maps. Blankenship & Dansereau (2000) projected their map onto

a screen. Node and links were formed with an average interval of about 3 seconds
between the appearance of new nodes and links. In this research, we designed the
presentations to be controlled by the students, so that they are more able to integrate the
process into their cognitive structure.

3 Research Methodology
This chapter consists of five parts. The first part describes the setting in which the
experiment took place as well as the participants. The next part gives an overview of the
multimedia materials used for the study. The third part is about the instructional
treatments while the last two sections are about the dependent variables and the entire
procedure of the main thesis study.
3.1 Participants and Settings
Of the 240 students enrolled in an introductory undergraduate course in
educational psychology, 133 consented to participate in the experiment. Students who
chose not to participate used the lab computers to work on an unrelated course
assignment. The participants who consented had the option of withdrawing from the
study at any time.
The study was conducted at Simon Fraser University, Canada. Over a period of
eight weeks prior to the experiment, students who attended all lectures were presented
with 22 concept maps in course lectures and online. In assignments completed three
weeks prior to the experiment, each student constructed two concept maps depicting
selected course topics. The graphical conventions used in the research materials were
similar to those used in lectures and assignments. Students were very familiar with
constructing and studying with concept maps. The experimental data were collected over
a period of one week at the normally scheduled tutorial sessions.

3.2 Materials
The multimedia presentations were Macromedia Flash animations constructed
from a 347-word passage on attribution theory from the course textbook (Woolfolk,
Winne & Perry, 2002, pp. 358-359). The audio narration was a recording of a human
voice reading the passage. Prior research guided the format and style of the presentation
of the material (Tversky, Morrison & Betrancourt, 2002; Rieber, 1996; Graesser,
Hoffman & Clark, 1980; Hooper & Hannafin, 1986). The text presentation was left
justified because research has affirmed that left justified text can be read faster than full
justified ones (Hooper & Hannafin, 1986). Font and other style characteristics were
legible.
The presentations were constructed such that the participant could advance
through the content by clicking on a "next" button. Table 7 shows the structure of the
presentations. For the plain map (pMap), graphically enhanced map (gMap), and
synchronized text (sText) materials, the animations were synchronized to the audio
narration such that a node-link-node structure, or sentence in the case of the sText
material, appeared on the screen at approximately the same time that the participant heard
the audio segment to which it corresponded. For the non-synchronized text (nText)
material, participants first advanced through the display of sentences in the text passage
before the audio narration was presented.

Table 7. Structure of Material
Material Properties Colour Audio Synchronized with audio
Animated No Yes Yes presentation synchronized to audio narration
Semantically Yes Yes Yes related nodes shaded with same color Animated presentation synchronized to audio narration
Animated text No Yes Yes presentation synchronized to audio narration
Animated text No Yes No presentation not synchronized to audio narration. Text displayed before audio Audio segments played contiguously with no learner control
The design of the materials reflects the kind of research questions we set out to
answer. With this design, we were able to compare the effectiveness of maps with text,
plain map with enhanced map and synchronized text with non-synchronized text.

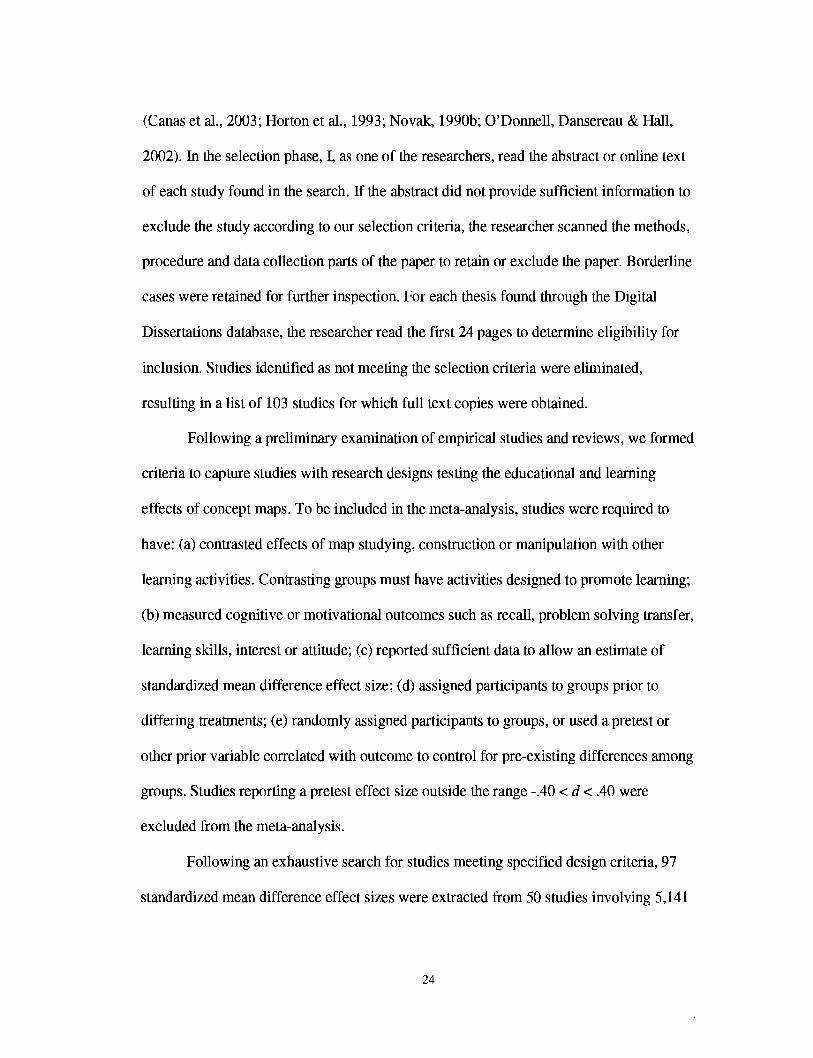
For all materials, visual contents remained on the screen while subsequent content
was introduced. Screen shots from the pMap and sText animation are shown below in
Figures 10 and 11. Note that in Figure 1 1, the information with audio is displayed in
sentential format - one at a time until the whole passage is displayed


m s
sm
ns
s>:nqullr! IIJWIS
e &
(08
6~
~aula&
*,) m
sa
pas pus su
cq
wa
o! pa
iela
~ ?q
zw
a1 'a@
wexa
lo1 m3Q
JP
~~
~~
IXI~
:JP
UB
IUI
WL
u
31
eh
p~
i m
j smnleqdw
~ wuwodulr g
ney suosucurrp a
so
q s
wr1
3q
sum
lJI lA
?rffilNodsar) p
a!jon
m eq Lu-
PUB W$lq
u:s) e
lqe
nlp
am
n
[SW
li lewalra si y
m aic'w
xe mj

3.3 Dependent Variables
The two dependent variables were free recall and multiple choice tests. A 25-item
multiple choice test, shown in Appendix B, was designed to assess recall, understanding
and application (Anderson & Krathwohl, 2001) of the attribution theory passage. These
tests used four-alternative multiple choice questions at the knowledge, comprehension,
and application levels. The test was delivered through an online web form after
participants had completed the free recall task. This multiple choice test was designed
using a questionnaire research tool called "Web Questionnaire" which is being developed
as part of a large research project. It allowed participants to answer the questions and
students' responses were saved into a database format that was exported to SPSS, a
statistical analysis package.
In order to measure retention after the treatment, participants engaged in an
immediate written free recall of the attribution theory passage. Free recall has been used
as a dependent measure in many studies of this nature because it provides a sensitive
measure of retained information. After presentation of the material, participants were
instructed to enter as much information as they could remember in an open text web
form. They were allowed 10 minutes to complete the recall task. None of the subjects
indicated a need for additional time.
3.4 Procedure
This study was conducted for a whole week. Prior to the treatment session,
subjects were duly briefed and randomly assigned to four experimental conditions. The

study was conducted in an instructional computer lab with participants seated in front of a
computer monitor and wearing headphones. Each participant attended one session lasting
for 50 minutes. Before the students started studying, the researcher emphasized the
importance of studying very well within the time allotted. Participants were encouraged
to study the material as if they were studying for a final examination. They were told that
after the presentation, they would be tested based on the material. They were instructed to
advance through the multimedia presentation within 8 minutes and then review it for 2
minutes (see review page in Appendix D). Informal observation by the researcher showed
that students heeded these instructions as much as possible. There was also an
introductory page, as shown in Appendix C, explaining the sequence of the presentation.
After 10 minutes of the multimedia presentation, participants were logged out and
presented with a "START TEST" screen, shown in Appendix E. Participants were asked
to click "start test" and then were presented with the free recall open text web form (see
Appendix F) which contained the student name, id and free form area and asked to recall
any information from the multimedia material presented. They were told that they could
recall the information in any format without preference for the order of the presentation.
The recall session lasted 10 minutes and none of the subjects indicated need for more
time to recall. When they finished the recall, they clicked the submit button and then
each subject's typed information was sent to the researcher. After the recall session,
participants were presented with a 25-item multiple-choice test. The test used four-
alternative multiple choice questions at the knowledge, comprehension, and application
levels and was delivered online. Subjects logged on to the test site using their usual IDS
(see logon screen in Appendices G and H). Subjects were not allowed access to the

multimedia materials during the test. After the multiple choice test was completed by the
students, we conducted debriefing sessions where participants were thanked for their
participation in the study. Subjects were further invited to participate in an interview
session held the following week. Subjects were interviewed based on their experiences of
using the dynamic tools and also their ability to recall information fiom the material.
Although 20 subjects agreed to participate in the interview session, only 4 turned up. The
interview was semi-structured such that participants were able to express themselves
based on a set of questions that were not constrained. Follow-up questions came up based
on subjects' responses. Appendix I shows excerpts of questions and answers fiom two of
the subjects interviewed.
Results of the study are shown in the next chapter.

Results
This chapter presents and describes the general results of the study conducted in
Chapter 3 and is divided into five sections. The first section focuses on the methods used
in scoring the fiee recall data. The second section gives a brief overview of the covariate
used with the study. The third section presents the result of the fiee recall while the fourth
section focuses on the result of the multiple-choice test. The last section of this chapter
discusses the results of the study in the context of node-link research. The data gathered
in the study were analyzed using the SPSS ver. 13 statistical software package.
4.1 Scoring the Free Recall
The subjects had their fiee recall tests sent through a web form to the researcher's
e-mail address. A propositional scoring method was used to score the fiee-recall test. The
original passage was divided into 67 idea units that consist of simple fact stated in a
declarative sentence (see Appendix J for these idea units). A scorer who was blind to the
treatment conditions determined the fiee recall scores for all the participants drawing
largely fiom scoring techniques by Dansereau et al. (1 979) and Meyer (1975). The
scoring technique used in this study is a modification of Dansereau's scoring technique.
For each of the participants, the scorer assigned a score for each idea unit. Depending on
the accuracy of the match, participants received a score ranging fiom 0 to 2, where:
0 represents idea unit absent or totally inaccurate,
1 represents idea unit partially present or partially accurate, and
2 represents idea unit entirely present and accurate.

We determined the overall fi-ee recall scores by summing scores for all statements
with a score of 1 and 2. This was done so that credit would be given to statements that
have at least some accurate information. Scoring reliabilities were established by having
another experienced scorer score 15 randomly selected samples of the free recalls,
yielding r = 0.9 1.
4.2 Covariate
In order to statistically control for prior differences between the randomly
assigned treatment groups, a midterm examination was used as covariate. The midterm
examination was given two weeks prior to this study and consisted of 48 multiple choice
items at the knowledge, comprehension, and application levels. It did not cover the
textbook chapter that included the attribution theory passage.
The internal consistency reliability of the midterm exam scores was a=.77.
Pearson's correlations of the midterm scores with free recall (r = .24, p = .009) and
comprehension (r =.53,p < .001) were statistically significant. ANOVA was used to
determine that differences between treatment groups on the midterm exam were not
statistically significant (F1,129 = 2 . 1 4 , ~ = -099). Two outliers were identified in the
midterm scores: a high score (z = +2.69) belonging to a member of the graphically
enhanced map group (gMap), and a low score (z = -2.97) belonging to the non-
synchronized text group (nText). Because ANOVA without the two outliers found
reduced prior differences between treatment groups on the midterm (F1,127= 1 S 5 , p =
.204), the two participants with outlying scores were eliminated from all subsequent
analyses (Tabachnick & Fidell, 2001).

4.3 Result of Free Recall Test
The descriptive statistics for the free recall measure showing the observed and
covariate-adjusted means, standard deviation and sample size for each of the treatment
groups are presented in Table 8. Analysis of covariance using the midterm exam scores
as the covariate found a statistically significant effect due to treatment (F3,, 12 = 1 1.06, p <
-001). Bonferroni-adjusted multiple comparisons found differences for gMap vs. sText (d
= 1 . 1 2 , ~ < .001), gMap vs. nText (d= 1 . 2 5 , ~ < .001),pMap vs. sText (d= .81,p =
.019), and pMap vs. nText (d = .92,p = .025). No statistically significant differences
were found for gMap vs. pMap (d = .34,p = .678), and sText vs. nText (d = .02,p >
.999).
Table 8. Free Recall Performance of the Four Treatment Groups
Treatment Observed Mean SD Adjusted Mean Sample size
m a p 52.50
P M ~ P 44.22
sText 32.13
nText 30.75
Total 40.16 16.82 40.29 117
Because we were primarily interested in the difference between the synchronized
map and text treatments, and no significant difference was found between the two map
groups, we reanalyzed the free recall data as a comparison of the sText group with the
pooled map groups (pMap and gMap). Table 9 shows the means and standard deviations
for this comparison. An analysis of covariance using the midterm exam as the covariate

found a statistically significant difference between the sText and pooled map groups
(F=19.19, p < .001) with a standardized mean difference effect size d = .94.
Table 9. Free Recall Performance of Synchronized Text and Map Groups
Treatment Observed Mean SD Adjusted Mean Sample size
gMap and pMap 48.71
(pooled)
sText 32.13 18.10 3 1.69 3 0
This result shows that animated maps are better for learning that text on a test of
free recall.
4.3.1 Central Idea Recall
In order to be able to answer the sixth research questions, we divided the free recall
scores into central (main) and detail ideas. For the central idea recall, the inter-rater
reliability for the 15 free recall responses that were scored by two raters was (I= .91).
Heterogeneity of variance among the treatment groups was not detected ( L e ~ e n e ~ , ~ 13 =.44,
p = .726).
Table 10 shows the free recall means (observed and covariate-adjusted), standard
deviation and sample size for each of the treatment groups. Analysis of covariance using
the midterm exam scores as the covariate found a statistically significant effect due to
treatment (F3,1 12 = 5.02, p < .003). The partial q 2 was .l2, indicating that 12% of central
idea recall variance could be attributed to treatment. Bonferroni-adjusted multiple
comparisons found differences for gMap vs. sText (d = .71,p = .014). No statistically

significant differences were found for gMap vs. nText (d = .70, p = .054), pMap vs. sText
(d = .69, p = .05), pMap vs. nText (d = .69, p = .139), gMap vs. pMap (d = .O8, p > .999),
and sText vs. nText (d = -.09,p > .999).
Table 10. Central Recall Performance
Treatment Observed Mean SD Adjusted Mean Sample size
P M ~ P
sText
nText
Total 59.58 19.32 - 117
Because we were also interested in the difference between the synchronized map and
text treatments, we reanalyzed the free recall data as a comparison of the sText group
with the pooled map groups @Map and gMap). Table 11 shows the means and standard
deviations for this comparison. An analysis of covariance using the midterm exam as the
covariate found a statistically significant difference between the sText and pooled map
groups (F=11.13, p = .001, partial q2 = .12), with a standardized mean difference effect
size d = .73.

Table 11. Performance of Synchronized Text and Map Groups (Central)
Treatment Observed Mean SD Adjusted Mean Sample size
gMap and pMap (pooled)
66.10 17.64 65.93 59
sText 53.06 20.99 52.29 30
4.3.2 Detail Idea Recall
For detail idea recall, the inter-rater reliability for the 15 free recall responses that
were scored by two raters was high (I= .89). Heterogeneity of variance among the
treatment groups was not detected (Levene3~ 13 =2.00, p = .118).
Table 12 shows the free recall means (observed and covariate-adjusted), standard
deviation and sample size for each of the treatment groups. Analysis of covariance using
the midterm exam scores as the covariate found a statistically significant effect due to
treatment (F3,Il2 = 10.257,~ < .001). The partial q2 was .22, indicating that 22% of detail
idea recall variance could be attributed to treatment. Bonferroni-adjusted multiple
comparisons found differences for gMap vs. sText (d = 1.10, p < .001), gMap vs. nText
(d = 1.24, p < .001), and pMap vs. nText (d = .78, p <.05). No statistically significant
differences were found for pMap vs. sText (d = .68, p = .05 I), gMap vs. pMap (d = .42, p
= .48), and sText vs. nText (d = .O 1, p > .999).

Table 12. Detail Recall Performance
Treatment Observed Mean SD Adjusted Mean Sample size
P M ~ P
sText
nText
Total 23.51 14.64 - 117
Again we reanalyzed the detail free recall data as a comparison of the sText group
with the pooled map groups. Table 13 shows the descriptive statistics for this
comparison. An analysis of covariance using the midterm exam as the covariate found a
statistically significant difference between the sText and pooled map groups (F=16.41, p
< .001, partial r12 = .16), with a standardized mean difference effect size d = .88.
Table 13. Performance of Synchronized Text and Map Groups (Detail)
Treatment Observed Mean SD Adjusted Mean Sample size
gMap and pMap (pooled)
sText 17.64 13.1 1 17.22 30
4.4 Result of Multiple-choice Test
The internal consistency of the comprehension scores was a=.64. The descriptive
statistics of comprehension test showing the observed and covariate-adjusted means,
standard deviation and sample size for each of the treatment groups are presented in
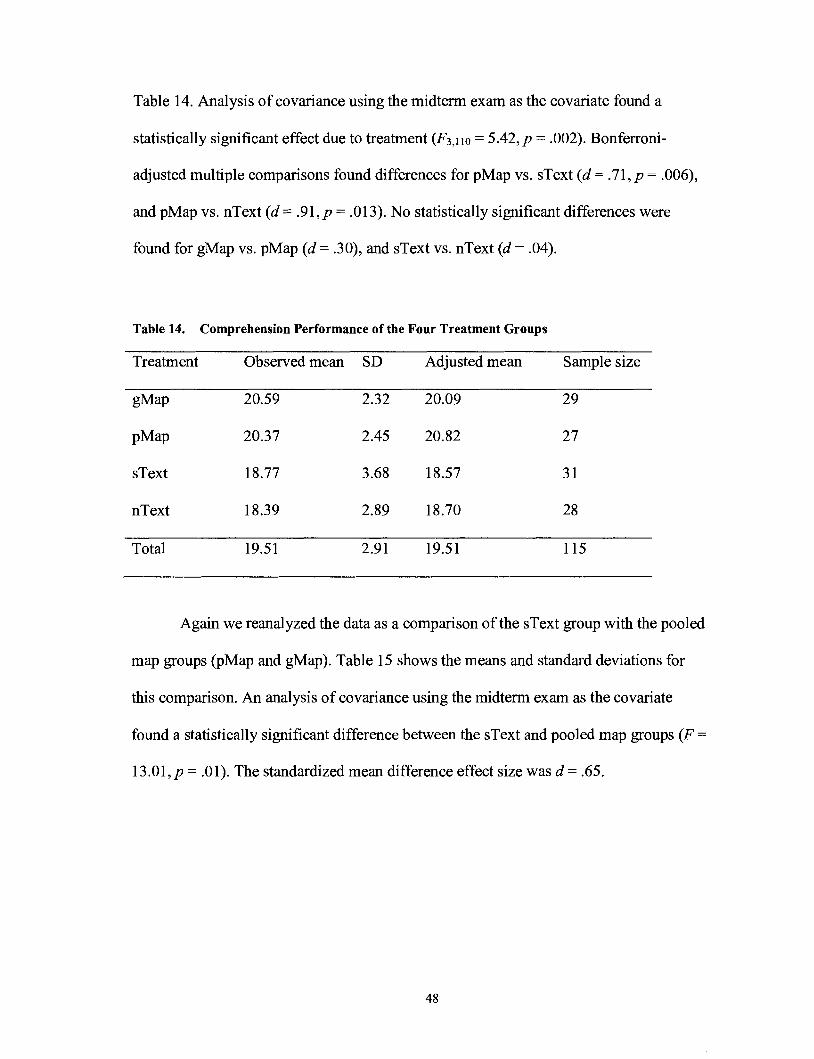
Table 14. Analysis of covariance using the midterm exam as the covariate found a
statistically significant effect due to treatment (F3,110 = 5 . 4 2 , ~ = .002). Bonferroni-
adjusted multiple comparisons found differences for pMap vs. sText (d = .71, p = .006),
and pMap vs. nText (d = .91, p = .013). No statistically significant differences were
found for gMap vs. pMap (d = .30), and sText vs. nText (d = .04).
Table 14. Comprehension Performance of the Four Treatment Groups
Treatment Observed mean SD Adjusted mean Sample size
20.59 2.32 20.09 29
P M ~ P 20.37 2.45 20.82 27
sText 18.77 3.68 18.57 3 1
nText 18.39 2.89 18.70 28
Total 19.51 2.91 19.51 115
Again we reanalyzed the data as a comparison of the sText group with the pooled
map groups @Map and gMap). Table 15 shows the means and standard deviations for
this comparison. An analysis of covariance using the midterm exam as the covariate
found a statistically significant difference between the sText and pooled map groups (F =
13.01, p = .01). The standardized mean difference effect size was d = .65.

Table 15. Comprehension Performance of the Synchronized Text and Map Groups
Treatment Observed mean SD Adjusted Mean Sample size
gMap and pMap 20.48
(pooled)
Figure 12 below shows the mean score for each group on comprehension and free
recall tests
Comprehension Free Recall
Figure 12. Adjusted mean scores for each group on comprehension and free recall.

As shown in the tables above, animated maps are good for learning. The section
below discusses the qualitative aspect of this research.
4.5 Result of Interview
The interview data was divided into categories showing students' preferences and
suggestions for improving the presentations. One common theme that ran across the
interview data was the fact that subjects considered these dynamic maps and texts as a
form of learning. Three of the four interviewed participants were of the opinion that tools
like the dynamic maps could help reduce cognitive load associated with reading.
Several studies have shown researchers quest to effectively manage cognitive
load, especially extraneous cognitive load, so that it will not impede learning (Paas,
Renkl & Sweller, 2003; Sweller, Merrienboer & Paas, 1998; Mayer, 2001; Mousavi, Low
& Sweller, 1995). Dynamic map presentations might play a good role towards achieving
this educational objective. Those interviewed said that audio narrated presentations
helped them in the encoding process. They also commented that dynamic maps helped to
reduce being overwhelmed with map shock and also useful in summarizing the main
points of the passage. The following interview excerpts show that students believe that
they benefited fiom the presentation.
"I found the dynamic map very useful. I love the fact that you can go back and review it and also the fact that audio goes closely with the formation of the knowledge. I also love the way it (the map) showed important concepts. It relieved me of the mental effort because it helped me summarize. 9 ,

"For me, I've used a bit of concept map this term and umm. Concept map can be really confusing and overwhelming but I could make a sense of it in the bit- pieces it was presented. This concept map is fairly well laid out. Concept maps work for me when I am able to make the links between major and minor points as I normally do in outline"
From the excerpts of the interview below, we could infer that maps are good for
macrostructure or main idea retention as in previous studies (Blankenship & Dansereau,
2000; Hall & O'Donnell, 1996).
"I got the overall picture, so that was really helpful. I couldput more time into actually learning it instead of summarizing and learning. I think that we should use more dynamic concept maps like this in tutorials so as to help students understand concepts. It would be really helpful in chemistry and biology but not so much in Maths. "
One other interesting finding in the interview is that when learners are able to
convert information from one format to another, there is possibility that they are more
able to cognitively process the information. Translating information between a text
format and a node-link-node format requires that learners process meaning more
thoughtfully than if they read text. According to this view, learners benefit from receiving
information in a text format and converting it to a map format, or visa versa. The
statement below supports the notion.
"When the map was revealed to me, I changed it in my mind to the outline form that I am familiar with. It really helped me make sense of the material in my head. "

However, because of limited interviews, we would not be able to generalize the
effect of dynamic tools for learning based on these interviews. Instead, the interview data
suggests further research into this area and conduct of more interviews or qualitative
inquiries along this area of research. One such area is the involvement of students in
recording audio narration of texts they want to study. If tools that allow students to record
text passages and convert to spatial node-link formats are available, this will engage
students in more constructive process of learning. In another context, this idea has
flourished in Computer Aided Language Learning (CALL) programs, especially in
teaching of speaking skills or tone drills for tonal languages. Students are encouraged to
record their own voice with a list of words or sentences and compare with instructor's
pre-recorded voice until they reach mastery level. It is promising that self-paced dynamic
maps could foster learning by reducing cognitive load associated with overwhelming
information.
4.6 Discussion
The discussion of the result is divided into three sections. One section discusses
the result of the free recall test. Findings related to the comprehension test are discussed
in the second section. The last section briefly highlights the result of the interview with
cautionary notes. One overall interesting finding is that there is great promise for the use
of animated concept maps for learning. In a recent review, Tversky, Morrison &
Betrancourt (2002) contended that animations are ineffective because they are often too
complex or too fast to be accurately perceived. These researchers conclude that for
animation to be useful, learners need to be in control of the speed of animation and can
view and review it. Our user-regulated dynamic concept maps with animation have
adequately addressed the issue raised by these researchers. More than resolving the
problem of animation, our dynamic maps have also reduced or completely eliminated
map shock. According to Dansereau, Dees & Simpson (1994), students tend to be
overwhelmed by the scale and complexity of a map when presented with static maps.
These researchers described several problems that may arise when students experience
map shock. One is incomplete processing of map elements (i.e., nodes and links) and
their relationships to each other. Map shock may also result in a lack of motivation to
process the map. Such a reaction may arise from a feeling of bewilderment of not
knowing where to start or how to penetrate the topography of the map. Dynamic concept
maps used in this study might help reduce map shock in node-link displays.
4.6.1 Findings with Free Recall
Our first research question seeks to know if dynamic concept maps could benefit
learning in comparison with text displays that are synchronized or not synchronized to an
audio narration. On a test of free recall of materials presented, the graphically enhanced
map group as well as the plain map group performed better than both the synchronized
and non-synchronized text groups. When pooled together, the map groups still performed
better than the synchronized text group. This result confirms previous findings that have
demonstrated the superiority of studying with concept maps over text on free recall test
(Blankenship & Dansereau, 2000; Hall & O'Donnell, 1996, Hall & Sidio-Hall, 1994;
Hall, Dansereau & Skaggs, 1992; Moreland, Dansereau & Chmielewski, 1997; Patterson,
1993; Patterson, Dansereau & Newbern, 1992; Rewey et al., 1992, Rewey et al., 1989;
Wachter, 1993; Wallace, West & Ware, 1998; Wiegmann, 1992).

Another research question seeks to know how effective dynamic concept maps
are when compared with the overall effectiveness of static paper-based maps research.
One very interesting finding with this research is that we found a statistically significant
difference with a mean difference effect size of .94 between the map groups and
synchronized text group. Drawing from our meta-analysis result (Nesbit & Adesope,
2005), the mean effect size of .94 found in this study is much higher than published
research that compared the study of concept maps with text. Only few studies where
participants were presented with static maps have larger effect sizes than the one obtained
from this thesis (Wallace et al, 1998; Wiegrnann, 1992) This offers a promising result for
the use of dynamic maps for learning and also extends previous findings by
demonstrating that participants are able to recall more information presented in a
dynamic map than they can when studying with text. While it is true that the process of
learning is far more than recalling information, it is still very vital to accurately recall
information before such information can be transferred into other learning contexts.
Our third research question asks if graphically enhanced maps are more effective
for learning than plain maps. This study did not find any statistically significant
differences between graphically enhanced map and plain map on recall. The failure to
detect a significant advantage for graphically enhanced map is inconsistent with previous
research which showed great significant advantage for the use of graphically enhanced
maps (Wallace, West & Ware, 1998). Wallace et al. had a huge effect size of 1.1 for
delayed recall favoring enhanced maps. One possible reason for this discrepancy is that
the significant advantage of enhanced maps found in the Wallace et al. study might be
due to structural differences between the plain and enhanced maps which characterized

their study but not this. They reported that their enhanced map had different shapes
denoting specific relationships between nodes.
The fourth research questions seeks to know if learning is enhanced when text
passages are synchronized with audio narration than when they are not synchronized.
There was no significant difference between the synchronized and non-synchronized text
presentations. This might be so because the time between the presentation of the text and
the narration is short. Mayer (2001) cautions that temporal contiguity principle, which
states that students tend to learn better when corresponding words and pictures are
presented simultaneously rather than successively, may not be clearly evident if the time
between hearing a sentence and seeing the corresponding portion of animation is short
because learners may still be able to build connections between verbal and visual
representations. This is exactly what happened in the study described in Chapter 3, where
there was a considerably short period of time between the presentation of the text and the
hearing of the animation in the non-synchronized group. This might have accounted for
the non-difference effect between this group and the group with synchronized text. Thus,
both the synchronized and non-synchronized control presentations as well as the plain
and enhanced experimental group presentations followed the rules of spatial contiguity
principles of multimedia learning (Mayer, 2001). With spatial contiguity principle,
students tend to learn better when corresponding words and pictures are presented near
rather than far from each other.
The sixth research question asks if dynamic maps effective for recalling central
and detail ideas when compared with dynamic text. This study shows that students
recalled a greater proportion of the central ideas than the detail ideas. However, unlike

prior research that compared the retention of central and detailed ideas in maps versus
text (Lambiotte & Dansereau, 1992; Rewey, Dansereau & Peel, 1991), this study found
greater advantage for concept maps in presenting detail ideas than main ideas. Possibly,
the sequential presentation of map information obscures cues signaling idea
superordination. Since these previous studies on central and detail ideas used static maps,
it may also be that participants focused more on central ideas than detailed ones.
However, in this thesis, the sequential presentation of animated maps might not allow for
idea superordination.
4.6.2 Findings with Multiple-choice
The multiple choice questions tested students at comprehension and application
levels. The plain map group outperformed both the synchronized and non-synchronized
text groups with statistically significant differences. When pooled together, the map
groups still performed better than the synchronized text group. This result further
confirms previous findings that learning from concept maps is better than learning from
text on objective item test (Willerman & MacHarg, 1991; Zittle, 2001). A mean
difference effect size of .65 between the map groups and the synchronized text group
found in this study is also very interesting and points to the positive effect of using maps
over text. Previous controlled research with objective test items yielded lower effect size
(Willerman & MacHarg, 1991). Thus, the study has addressed the first research question
about comparing the effect of dynamic maps with texts.

There were no significant differences between the plain and enhanced map groups
and also between the synchronized and non-synchronized text groups. The same
explanation in free recall could have accounted for the non significant effect.

5 Conclusion
This chapter provides a summary of the research as well as its implications and
limitations. It concludes with recommendations for future research in node-link displays.
5.1 Summary and Implications
This study shows that dynamic maps are effective for learning. This finding has
important implications for node-link mapping research. It offers evidence that concept
maps may be superior to text as synchronized, incrementally expanding visual
accompaniment to an audio narration. One other promising note of this research is that
comparing this study with those where maps were statically presented to students,
animated maps seem to benefit learners more. This is corroborated in the study by
Blankenship and Dansereau (2000) where the effect of animated knowledge map was
compared with text. However, this study has extended research in node-link displays by
investigating not only animation but also audio narration with concept maps. Animation
and audio narration seem to lend learning support to those who studied with maps. A self-
paced approach to presenting the material has also helped in alleviating the problems
often reported with animation for learning purposes (Tversky, Morrison & Betrancourt,
2001). This initial research study shows that dynamic concept maps work and could be
used by teachers and instructional designers. When they are combined with audio
narration, as experimented in this study, they may replace prose text.

5.2 Limitations and Recommendations for Future Research
While this research opens up a new dimension in node-link literature, it is not
devoid of limitations. One of the limitations is that, as usual with most preliminary
studies, we exercise caution as to the generalization of the result of this study to other
learning contexts. Our research plan is to be able to take this notion of dynamic maps into
other disciplinary contexts. We would like to test the effect of dynamic maps in second
language acquisition (SLA) especially in English as a Second Language (ESL), biology,
and other sciences. We would also like to know if dynamic maps are useful as reading
support for students with learning disabilities as well as children in early reading
education. Since we already know that dynamic concept maps work, it would be
interesting to know the situation and contexts in which they will be most beneficial for
learning. Our research agenda is inspired by that of Dansereau's TCU knowledge
mapping system where the effectiveness of these maps has been tested over a range of
subjects and people. Nevertheless, this does not jeopardize the internal and external
validity of this study. Subjects were randomly assigned to groups with researcher not
having prior knowledge of the subjects. Also, the animated materials studied by students
were controlled by the computer clock such that all the students spent exactly the same
amount of time in studying the material. Subjects in this study represent a fairly large
sample of students with different majors, thus suggesting that, to a certain extent, this is a
representative student sample. However, a replication of this study with more stringent
controls would increase the validity of the research.
Another limitation of the study has to do with the brief time and content limits. It
will be interesting to see the outcome if subjects are given longer passages with more
time to study them. Future studies should investigate the effects of altering these two
variables on dynamic maps and texts.
This study found greater advantage for concept maps in presenting detail ideas
than central ideas. This does not concur with literature that has produced consistent
findings in this area (Blankenship & Dansereau, 2000; Hall et al., 1992; Rewey et al.,
1991) where students with maps recalled more central information than detailed one. It
will be interesting to research further why the result of animated concept map in this
study differs from those of the static maps in other studies, with respect to central and
detail idea.
Finally, a constructivist epistemological view of learning suggests that students
learn more when they construct knowledge themselves. Although concept maps were
presented to students in this study, characteristics of the maps like animation and self-
paced control afford students to cognitively process the information. This increased
processing may lead to more effective encoding of information which ultimately
engenders learning. Students' attention were drawn towards the generation of the map as
the maps are generated node-by-node and not presented to the students in a static form.
However, our research agenda in future will investigate the effect of learner constructed
dynamic concept maps over text.
To further establish the viability of dynamic concepts maps as effective tools for
communication and learning, researchers should investigate the effectiveness of dynamic
concept maps in comparison with static concept maps. Although we noticed that
difference between the two types of maps in this study was too small, future research
should confirm whether graphically enhanced maps are better than plain maps as in

Wallace et al. (1998) or if there is no difference between the two as in this study. Future
works should also investigate temporal and spatial contiguity principles of multimedia in
node-link displays.
5.3 Conclusion
This study was a preliminary effort to investigate the effect of dynamic maps on
learning. In the study, we compared the effectiveness of dynamic maps with that of
dynamic text. Results obtained from the study provide promising line of research for
audio narration with concept maps and thus promotes the idea that dual-coding (audio
narration with map display) could help in meaningful learning.
The result further shows the potential role for animation and audio narration to
manage intrinsic cognitive load inherent in study materials. As shown in the result and
discussion sections of this work, students who were presented with dynamic maps
outperformed those who studied with incrementally presented text with statistically
significant differences. The fusion of maps with animation flavored with self-paced
learning principles, as demonstrated in this research, has moved node-link research to
another level of inquiry. The present results leave us with no doubt that dynamic concept
maps may be another pedestal for meaningful learning. It remains to be seen whether
dynamic maps can replace textbooks in future. What we can conclude from this study is
that dynamic maps can serve as supplements to textbooks, especially for visual learners
who tend to benefit most from visual display of maps.

References Anderson, L. W., & Krathwohl, D. R. (Eds.) (2001). A taxonomy for learning teaching
and assessing: A revision of Bloom 's taxonomy of educational objectives. New York: Addison, Wesley, Longman.
Ausubel, D. P. (1963). The psychology of meaning;ful verbal learning. New York: Grune & Stratton.
Ausubel, D. P. (1968). Educational Psychology: A Cognitive View. New York: Holt, Rinehart and Winston.
Bahr, G. S., & Dansereau, D. F. (2001). Bilingual knowledge maps (BiK-Maps) in second-language vocabulary learning. Journal of Experimental Education, 70,5- 24.
Blankenship, J., & Dansereau, D. F. (2000). The effect of animated node-link displays on information recall. The Journal of Experimental Education, 68,293-308.
Canas, A. J., Coffey, J. W., Carnot, M. J., Feltovich, P., Hoffman, R. R., Feltovich, J., & Novak, J. D. (2003). A summary of literature pertaining to the use of concept mapping techniques and technologies for education and performance support. Report from The Institute for Human and Machine Cognition, Pensacola, FL.
Chang, K., Sung, Y ., & Chen, I. (2002). The effect of concept mapping to enhance text comprehension and summarization. Journal of Experimental Education, 71,5-23.
Cliburn, J. W. Jr. (1986). An Ausubelian approach to instruction: The use of concept maps as advance organizers in a junior college anatomy and physiology class. Doctoral Dissertation, University of Southern Mississippi. Dissertation Abstracts International, 47, 852A.
Czerniak, C. M., & Haney, J. J. (1998). The effect of collaborative concept mapping on elementary preservice teachers' anxiety, efficacy, and achievement in physical science. Journal of Science Teacher Education, 9, 303-320.
Dansereau, D. F., Collins, K. W., McDonald, B. A., Holley, C. D., Garland, J. C., Diekhoff, G., & Evans, S. H. (1979). Development and evaluation of a learning strategy program. Journal of Educational Psychology, 71,64-73.
Dansereau, D. F., Dees, S. M., & Simpson, D. D. (1994). Cognitive modularity: Implications for counseling and the representation of personal issues. The Journal of Counseling Psychology, 41, 51 3-523.
Dansereau, D. F., Joe, G. W., & Simpson, D. D. (1993). Node-link mapping: A visual representation strategy for enhancing drug abuse counseling. Journal of Counseling Psychology, 40, 385-395.

Dansereau, D. F., Joe, G. W., & Simpson, D. D. (1995). Attentional difficulties and the effectiveness of a visual representation strategy for counseling drug-addicted clients. International Journal of the Addictions, 30, 371-386.
Dansereau, D. E, & Newbern, D. (1 997). Using knowledge maps to enhance teaching. In W. E. Campbell & K. A. Smith (Eds.), New paradigms for college teaching (pp. 125- 147). Edina, MN: Interaction Book Company.
Graesser, A. C., Hoffman, N. L., & Clark, L. F. (1980). Structural components of reading time. Journal of Verbal Learning and Verbal Behavior, 19, 135-1 51.
Hall, R. H., Dansereau, D. F., & Skaggs, L. P. (1 992). Knowledge maps and the presentation of related information domains. Journal of Experimental Education, 61, 5-18.
Hall, R.H., & O'Donnell, A.M. (1 996). Cognitive and affective outcomes of learning from knowledge maps. Contemporary Educational Psychology. 21, 94- 10 1.
Hall, R. H., & Sidio-Hall, M. A. (1 994). The effect of color enhancement on knowledge map processing. Journal of Experimental Education, 62,209-2 17.
Holley, C., & Dansereau, D. (1 984). Spatial learning strategies. New York: Academic Press.
Hooper, S., & Hannafin, M. J. (1 986). Variables affecting the legibility of computer generated text. Journal of Instructional Development, 9, 22-28.
Horton, P. B., McConney, A. A., Gallo, M., Woods, A. L., Senn, G. J., & Hamelin, D. (1993). An investigation of the effectiveness of concept mapping as an instructional tool. Science Education, 77,95- 1 1 1.
Jegede, 0. J., Alaiyemola, F. F., & Okebukola, P. A. (1990). The effect of concept mapping on students' anxiety and achievement in biology. Journal of Research in Science Teaching, 2 7,95 1-960.
Jonassen, D.H. (2000). Computers as Mindtools for Schools. Engaging Critical Thinking, 2nd Edition, NJ: Prentice Hall.
Jonassen, D. H., Reeves, T. C., Hong, N., Harvey, D., & Peters, K. (1997). Concept mapping as cognitive learning and assessment tools. Journal of Interactive Learning Research, 8,289-308.
Katayama, A. D., & Robinson, D. H. (2000). Getting students "partially" involved in note-taking using graphic organizers. Journal of Experimental Education, 68, 119-133.
Katayama, A. D., & Robinson, D. H., Dubois, N. F., & Devaney, T. (1998). Interactive effects of graphic organizers and delayed review on concept application. Journal of Experimental Education, 67, 17-3 1.

Kosslyn, S. M. (1989). Understanding charts and graphs. Applied Cognitive Psychology, 3, 185-226.
Kosslyn, S. M. (1 994). Image and Brain: The resolution of the imagery debate. Cambridge. MA: MIT Press.
Kulhavy, R. W., Lee, J. B., & Caterino, L. C. (1985). Conjoint retention of maps and related discourse. Contemporary Educational Psychology, 10, 28-3 7.
Lambiotte, J. G., Dansereau, D. F., Cross, D. R., & Reynolds, S. B. (1989). Multirelational semantic maps. Educational Psychology Review, 1,33 1-367
Lambiotte, J. G., & Dansereau, D. F. (1992). Effects of knowledge maps and prior knowledge on recall of science lecture content. Journal of Experimental Education, 60, 1 89-201.
Lipsey, M. W., & Wilson, D. B. (2001). Practical meta-analysis. Applied Social Research Methods Series (Vol. 49). Thousand Oaks, CA: SAGE Publications.
Mayer, R. E. (2001). Multimedia learning. Cambridge, UK: Cambridge University Press.
Mayer, R. E., & Anderson, R.B. (1991). Animations need narrations: An experimental test of a dual-coding hypothesis. Journal of Educational Psychology, 83, 484-490.
McCagg, E. C., & Dansereau, D. F. (1991). A convergent paradigm for examining knowledge mapping as a learning strategy. Journal of Educational Research, 84, 3 17-324
Meyer, B. J. (1 975). The organization ofprose and its effects on memory. New York: American Elsevier Publishing Company, Inc.
Moore, D. W., & Readance, J. F. (1 984). A Quantitative and Qualitative Review of Graphic Organizer Research. Journal of Educational Research, 78, 1 1 - 17.
Moreland, J. L., Dansereau, D. F., & Chrnielewski, T. L. (1997). Recall of descriptive information: The roles of presentation format, annotation strategy, and individual differences. Contemporary Educational Psychology, 22,52 1-533.
Mousavi, S., Low, R., & Sweller, J. (1995). Reducing cognitive load by mixing auditory and visual presentation modes. Journal of Educational Psychology, 87, 3 19-334.
Nesbit, J. C., & Adesope, 0 . 0 . (2005). Learning with concept and knowledge maps: A meta-analysis. Annual Conference of the American Educational Research Association, Montreal, Canada.
Norman, D. A., & Rumelhart, D. E. (1 98 1). The LNR approach to human information processing. Cognition, 10, 235-240.
Novak, J. D. (1977). A theory of education. Ithaca, New York: Cornell University Press.
Novak, J. D. (1 990a). Concept maps and vee diagrams: Two metacognitive tools to facilitate meaningful learning. Instructional Science, 19, 29-52.

Novak, J. D. (1990b). Concept mapping: A useful tool for science education. Journal of Research in Science Teaching, 27, 937-949.
Novak, J. D. (2002). Meaningful learning: The essential factor for conceptual change in limited or inappropriate propositional hierarchies leading to empowerment of learners. Science Education, 86, 548-57 1.
Novak, J. D., & Gowin, D. B. (1984). Learning How to Learn. New York and Cambridge, UK: Cambridge University Press.
Novak, J. D., & Musonda, D. (1991). A twelve-year longitudinal study of science concept learning. American Educational Research Journal, 28, 1 17- 153.
Okebukola, P.A.(l992). Can good concept mappers be good problem solvers in Science? Educational Psychology, 12, 1 13- 129.
O'Donnell, A. M., Dansereau, D. F., & Hall, R. H. (2002). Knowledge maps as scaffolds for cognitive processing. Educational Psychology Review, 14, 7 1 -86.
Paas, F., Renkl, A., & Sweller, J. (2003). Cognitive load theory and instructional design: Recent developments. Educational Psychologist, 38, 1-4.
Paivio, A. (1 986). Mental representations: A dual coding approach. Oxford, UK: Oxford University Press.
Paivio, A. (1991). Dual coding theory: Retrospect and current status. Canadian Journal of Psychology, 45, 255-287.
Patterson, M. E. (1 993). Conceptual analysis of spatial-semantic display processing (knowledge maps). Doctoral Dissertation, Texas Chstian University. Dissertation Abstracts International.
Patterson, M. E., Dansereau, D. F., & Newbern, D. (1992). Effects of communication aids and strategies on cooperative teaching. Journal of Educational Psychology, 84,453-461.
Patterson, M. E., Dansereau D. F., & Wiegmann, D. A. (1993). Receiving Information during a cooperative episode: effects of communication aids and verbal ability. Learning and Individual Differences, 5, 1 - 1 1.
Plotnick, E. (1 997). Concept Mapping: A graphical system for understanding the relationship between concepts. ERIC document, June 1997, EDO-IR-97-05
Pylyshyn, Z. W. (1994). Review of "Image and Brain: The resolution of the imagery debate" by Stephen Kosslyn. Nature, 372(17).
Pylyshyn, Z. W. (2003). Return of the Mental Image: Are there really pictures in the brain? Trends in Cognitive Sciences, 7, 1 13 - 1 18.
Quillian, M. (1 968). Semantic Memory, in M. Minsky (ed.), Semantic Information Processing, pp. 227-270, MIT Press.

Reynolds, S., & Dansereau, D. (1990). The knowledge hypermap: An alternative to hypertext. Computers in Education, 14,409-4 16.
Reynolds, S. B., Patterson, M. E., Skaggs, L. P., & Dansereau, D. F. (1991). Knowledge hypermap and cooperative learning. Computers in Education, 16, 167- 173.
Rewey, K., Dansereau, D., Dees, S., Skaggs, L., & Pitre, U. (1992). Scripted cooperation and knowledge map supplements: Effects on the recall of biological and statistical information. The Journal of Experimental Education, 60, 93-107.
Rewey, K. L., Dansereau, D. F., & Peel, J. L. (1991). Knowledge maps and information processing strategies. Contemporary Educational Psychology, 16,203-2 14.
Rewey, K. L., Dansereau, D. F., Skaggs, L. P., Hall, R. H., & Pitre, U. (1989). Effects of scripted cooperation and knowledge maps on the processing of technical material. Journal of Educational Psychology, 81,604-609.
Rieber, L. R. (1990). Using computer animated graphics in science instruction with children. Journal of Educational Psychology, 82, 1 3 5- 1 40.
Rieber, L. R. (1996). Animation as a distractor to learning. International Journal of Instructional Media, 23, 53 -57.
Rieber, L. P., & Hannanfin, M. J. (1988). Effects of textual and animated orienting activities and practice on learning from computer-based instruction. Computer in Schools, 5, 77-89.
Robinson, D. H., Corliss, S. B., Bush, A. M., Bera, S. J., & Tomberlin, T. (2003). Optimal presentation of graphic organizers and text: A case for large bites? Educational Technology, Research, & Development, 51, 25-41.
Robinson, D. H., & Kiewra, K. A. (1995). Visual argument: Graphic organizers are superior to outlines in improving learning from text. Journal of Educational Psychology, 87, 455-467.
Robinson, D. H., & Schraw, G. (1 994). Computational efficiency through visual argument: Do graphic organizers communicate relations in text too effectively? Contemporary Educational Psychology, 19, 399-4 15.
Ruiz-Primo, M., & Shavelson, R. (1996). Problems and issues in the use of concept maps in science assessment. Journal of Research in Science Teaching, 33, 569-600.
Rumelhart, D. E. (1980). Schemata: The building blocks of cognition. In R. J. Spiro, B. C. Bruce & W. F. Brewer (Eds.), Theoretical issues in reading comprehension. Hillsdale, NJ: Erlbaum.
Rumelhart, D. E., & Norman D. A. (1985). Representation of knowledge. In A. M. Aitkenhead & J. M. Slac (Eds.), Issues in cognitive modeling. Lawrence Erlbaum Associates.

Schmid, R. F., & Telaro, G. (1990). Concept mapping as an instructional strategy for high school biology. Journal of Educational Research, 84, 78-85.
Schvaneveldt, R., Durso, F., & Dearholt, D. (1989). Network structures in proximity data. The Psychology of Learning and Motivation, 24, 249-284.
Sowa, J. F. (2000). Knowledge representation: Logical, philosophical, and computational foundation. Pacific Grove, CA: Brooks Cole.
Stoyanova, N., & Kornrners, P. (2002). Concept mapping as a medium of shared cognition in computer supported collaborative problem solving. Journal of Interactive Learning Research, 13, 1 1 1 - 13 3.
Sweller, J., Van Merrienboer, J., & Paas, F. (1 998). Cognitive Architecture and Instructional Design. Educational Psychology Review, 10, 25 1-296.
Szabo, M., & Poohkay, B. (1996). An experimental study of animation, mathematics achievement, and attitude toward computer-assisted instruction. Journal of Research on Computing in Education, 28,390-402.
Tabachnick, B. G., & Fidell, L. S. (2001). Using multivariate statistics (4th ed). Boston: Allyn & Bacon.
Tversky, B., Morrison, J. B., & Betrancourt, M. (2002). Animation: Does it facilitate? International Journal of Human-Computer Studies, 57, 247-262.
Wachter, L. N. (1 993). An investigation of the effects of hierarchical concept mapping as a prefatory organizer on fourth-grade students' comprehension and retention of expository prose. Doctoral Dissertation, The Pennsylvania State University. Dissertation Abstracts International.
Wallace, D. S., West, S. W. C., & Ware, A. (1998). The effect of knowledge maps that incorporate gestalt principles on learning. Journal of Experimental Education, 67, 5-16.
Wiegmann, D. A. (1 992). On the dual processing of spatial-graphic and verbal information. Doctoral Dissertation, Texas Christian University. Dissertation Abstracts International.
Wiegmann, D. A., Dansereau, D. F., McCagg, E. C., Rewey, K. L., & Pitre, U. (1992). Effects of knowledge map characteristics on information processing. Contemporary Educational Psychology, 1 7, 1 36- 1 55.
Willerman, M., & Mac Harg, R. A. (1991). The concept map as an advance organizer. Journal ofResearch in Science Teaching, 28,705-712.
Winn, W. (1991). Learning from maps and diagrams. Educational Psychology Review, 3, 2 1 1-247.
Woolfolk, A. E., Winne, P. H., & Perry, N. E. (2002). Educational psychology (2nd ed.). Toronto: Pearson.

Zittle, F. J. (2001). The effect of web-based concept mapping on analogical transfer. Doctoral Dissertation, University of New Mexico. Dissertation Abstracts International.

Appendices
Appendix A. Publication in Node-Link Displays
Dissertation Year Web of Science ERIC PsycINFO PsycARTICLES Abstract

Appendix B. Multiple Choice Test
Please choose the BEST answer.
1. Attribution theory explains motivation by a. one set theory, with clear cut boundaries. b. a collection of theories, which can often be controversial. c. trying to understand successes and failures. d. Attributing instructional design principles as a factor that leads to success.
2. Students attribute their successes and failures to a. one factor which could be luck. b. Several factors that do not include luck. c. Only two factors - luck and ability. d. Several factors.
3. One major theorist who relates attribution theory to school learning is: a. David Jonassen. b. Lev Vygotsy. c. Bernard Weiner. d. Joseph Novak.
4. Every cause to which students attribute successes or failures is characterized using how many dimensions?
a. Five. b. Three. c. One. d. Several.
5. The dimensions of attribution are a. Locus and stability. b. Stability and possibility. c. Ability, locus and stability. d. Locus, stability and responsibility.
6. The internallexternal locus is closely related to a. Emotions and self-esteem. b. Emotions and self-dependence. c. Emotions and stability. d. Stress.
7. Florence has just passed her programming course with an A+. Her success made her proud and consequently increased her motivation to take more programming courses. What kind of factor is responsible for her success?

a. External factors. b. Internal factors. c. aandb. d. None.
8. Which dimension is related to emotions such as anger, pity & gratitude? a. Stability. b. Locus. c. Responsibility d. Ability.
9. Which dimension is closely related to expectations about the future a. Ability. b. Locus. c. Responsibility d. Stability.
10. Jennifer failed her Biology test by just 2 marks. She feels she is very unlucky because she made few mistakes in the test. What is the likely outcome if Jennifer takes the course again next semester?
a. She will hope to perform better. b. She will expect to fail because she does not know Biology very well. c. She can perform worse of the stability d. None.
1 1. A fellow student states that he missed class because of injuries received in an automobile accident. When you hear this you think to yourself that he seems like the kind of person who would be careless, exceed the speed limit, and not wear a seatbelt. Your attributions for this event are
a. internal b. stereotypic c. self-serving d. situational
12. A friend of yours tells you she was fired from her job. Your judgement is that she was probably fired because of downsizing in her area of expertise. What kind of attribution are you making?
a. internal b. external c. personality-based d. biased
13. The professor is returning tests. Two students receive failing grades, but no one else does. The professor is likely to attribute this to
a. uncomfortable factors such as bad luck.

b. lack of motivation and disinterest on the part of the students. c. the unfairness of the test. d. the poor teaching performance of the instructor.
14. Felicia has just passed a very difficult examination that she never thought she could pass. When the teacher announced the scores in the class, she got the highest mark while many other students did not do well. She is likely to attribute her success to:
a. her excellent job. b. her hard work. c. favor from the teacher. d. being lucky.
15. What are students likely to attribute their successes and failures to? a. over-eating, ability & luck. b. over-speeding, effort & help. c. ability, effort & interest. d. None.
16. In a situation where failure is attributed to lack of effort and effort is controllable, the ultimate sequence of events will lead to:
a. Excellent performance. b. Improved performance. c. Decline in performance. d. Fluctuating performance.
17. If a student fails because of lack of ability and ability is not controllable, the ultimate chain of events leads to:
a. Excellent performance. b. Improved performance. c. Decline in performance. d. Fluctuating performance.
18. Nathaniel feels he is very much in control of learning his Maths 801. The mid-term home work was extremely difficult. What do you think Nathaniel's attitude will be to the homework?
a. He will apply more efforts. b. He will back out. c. He will persist in solving the problem. d. a and c.

19. What is the likely outcome of a student's self-esteem if he thinks he cannot control his study time?
a. Will diminish. b. Will increase with time. c. Will diminish and then increase if his attitude remains the same . d. None
20. Sasha failed woefully in her test. She realized her mistakes and worked very hard the following Semester. What do you think will happen to Sasha's performance, if all other factors remain the same?
a. Will diminish. b. Will improve. c. Will remain the same because all factors remain the same . d. None
2 1. Pride or shame for one's own actions is likely to be felt most strongly by those who attribute their actions to
a. unstable causes. b. stable causes. c. externalcauses. d. internal causes
22) According to attribution theory, students who see the causes of their failures as internal and controllable will react to those failures by
a. exhibiting confusion and anxiety. b. berating themselves for their failure. c. finding strategies to succeed the next time. d. assuming things will work out better in the future.
23) Pat believes that the reason for her success in reading is because she puts so much effort into it. Pat is reflecting what type of locus of control?
a. stable. b. external. c. internal. d. transitional
24) As Jim looks at his report card, he remarks to Judy, "I got that B because I really didn't work hard in Mr. Widell's calculus class." On the basis of this one statement, we might guess that Jim has a(n)
a. external locus of control. b. positive self-concept. c. moderate need to achieve. d. internal locus of control

25) Several students in Mr. Chung's educational psychology class "forgot" to study for the midterm examination and ended up at the bottom of the test score distribution. Weiner would attribute the cause of these failures to what combination of factors?
a. external-unstable-controllable. b. external-stable-uncontrollable. c. internal-stable-uncontrollable. d. internal-unstable-controllable

Appendix C. Screenshot of Introductory Page
L E A R N I N G A C T I V I T Y 0 N
A T T R I B U T I O N T H E O R Y
MS Explorer frame, Microsoft@ screen shot reprinted with permission from Microsoft Corporation

Appendix D. Screenshot of Review Page
MS Explorer frame, Microsoft@ screen shot reprinted with permission from Microsoft Corporation

Appendix E. Screenshot of "Start Test"
MS Explorer frame, MicrosoftB screen shot reprinted with permission from Microsoft Corporation

Appendix F. Screenshot of "Free Recall Web Form"
Login Name:
Student Name:
Free Recall Message:
MS Explorer frame, Microsoft@ screen shot reprinted with permission from Microsoft Corporation

Appendix G. Screenshot of "web questionnaire logon pages'
Web QI
Web Ouc new quec qulcldyek,, ,AW.tVYJ'). LIGaLeU I_("GaLIVIIIIa11G3.
and dlslribute [hem m respondents using a variety of methods Responses are colletred and mallable to the designer from one e%y to manage locahon
I Zl t a=*] 5 f 3 L)~H*W I eJC\DoElmrasads& .! @ ~ ~ h m m a d ~ s l t l n . . . I w I W e ~ ~ o * ~ _ L ] , ~ ~ - r r 9 PM -
MS Explorer frame, MicrosoftB screen shot reprinted WI th permission from Microsoft Corporation

Appendix H. Screenshot of "Web Questionnaire Multiple-Choice Page"
Q 1. Attribution theory explains motivation by ' (a) one set theory, with clear cut boundaries (h) a conectron of theones. whrch can of€m be controversiat (c) lrying to understand successes and frulures (d) Attrbutmg ulsCruchonal des~gn pnnt~pl? as a hctor that leads to success
Q2. How confident are you that your answer is correct? <- 0 = I tooka wild mess ------. 100 = I am caiain I am ri@t ->
f 00 -_-_ r-olyou
(c) Only two factors a? luck and ahdity (d) Several factors. -
Q4 How confident are you that your answer is correct? c- 0 = I took a wild guess ------- 100 - I sm ceiain I am nght ->
0 0 100 No( al all g- T N ~ of you
trueolyar
QS. One major theorid who relates attribution theory to sch~oZleamhg is (a) Damd Jmssen (b) Lev Vygotsy (c) Bernard Wmer (d) Joseph N o d -
MS Explorer frame, MicrosoftO screen shot reprinted with permission from Microsoft Corporation
80

Appendix I. Excerpts from Interview
S 1 = Student 1 S2 = Student 2 R = Researcher
R : S1:
R: S l :
R:
Sl :
R: S l :
R : Sl :
R: S1:
R : S1:
Excerpts from interview 1
What is your understanding of attribution theory? Good question. Ummm. What you attribute to your learning - maybe to your success.
And may also be for failure too That's true
Is there anything in t material? Quite honestly, what I did when it (the material) was being revealed to me on the computer screen what that I just remembered as much as I could based on the concept map structure, going from the bigger concept to the parts that make up the concepts and examples.
Did that aid your retention of the material? The map presentation aided retention very easily. When the map was revealed to me, I changed it in my mind to the outline form that I am familiar with.
Did the map with audio helped in understanding of the material? I think it was helpful to me. I was a little bit surprised that I did well in the information afterward. When I was recalling the information, I remembered it just in the form as I saw it on the screen.
What would you like changed in the dynamic tool you were given? I would have loved an outline which I like to use but of course everyone likes something different but having said that the concept map presentation does a fairly good job of categorizing the main points and helped me to internalize the learning as supposed to just memorizing it. It really helped the internal process. It's a kind of an outline itself. It really helped me make sense of the material in my head.
Is there any other thing that did not work for you in the tool? For me, I've used a bit of concept map this term and umm. Conc really confusing and overwhelming but I could make a sense of it in the bit-pieces it was presented. This concept map is fairly well laid out. Concept maps work for me when I am able to make the links between major and minor points as I normally do in outline.

Excerpts from interview 2
R: What is attribution theory S2: Aahh! let me just remem
asking how you do certain things and why you have succeeded or failed. What type of learning did you do and what you did to prepare for certain situation.
R: You mean what actually contributed to. . . S2: What contributed to your personal success or failure in that situation.
R: What's your impression of that learning activity? Did the map really help you at all? If so, how did it help?
S2: It did. The map was really helpful. Seeing it laid out in spatial form helped me to understand the concepts better. Having the layout helped a lot.
R: Then would you love a tool that can convert text into map? S2: Yes, I really would. It gives you a view of important concepts unlike when you're
reading the textbook when whole lots of things are lumped together. I'll consider myself as a visual learner.
R: Did the dynamic nature of the map with audio help. How? S2: I found it very useful. I love the fact that you can go back and review it. I love the
fact that audio goes closely with the formation of the knowledge and I also love the way it showed important concepts.
R: What did that do for you? S2: It relieved me of the mental effort because it helped me summarize. I got the
overall picture, so that was really helpful. I could put more time into actually learning it instead of summarizing and learning.
R: Do you see this as a good practice? S2: I think that we should use more dynamic concept maps like this in tutorials so as
to help students understand concepts. It would be really helpful in chemistry and biology but not so much in Maths.

Appendix J. Idea Units Developed for Scoring the Attribution Theory Passage
1. Attribution theory asks WHY.
2. Asking WHY helps understand our successes
3. Asking WHY helps understand our failures
4. "Why did I flunk my mid-term?" is an example of Asking why I failed
5. "Why did I do so well this grading period?" is an example of Asking why I succeeded
6. Successes could result from ability
7. Successes could result from effort
8. Successes could result from mood
9. Successes could result from knowledge
10. Successes could result from luck
1 1. Successes could result from help
12. Successes could result from interest
13. Successes could result from clarity of instructions
14. Successes could result from the interference of others
15. Successes could result from unfair policies
16. Failures could result from ability
17. Failures could result from effort
18. Failures could result from mood
19. Failures could result from knowledge
20. Failures could result from luck
21. Failures could result from help
22. Failures could result from interest
23. Failures could result from clarity of instructions
24. Failures could result from the interference of others
25. Failures could result from unfair policies
26. Attribution theory is related to motivation.
27. Bernard Weiner is an attribution theorist

28. Attribution theory is related to school learning
29. Weiner states that students attribute successes or failures to three dimensions
30. Students attribute successes or failures to LOCUS
3 1. Students attribute successes or failures to STABILITY
32. Students attribute successes or failures to RESPONSIBILITY
33. Locus is the location of the cause
34. Location of the cause could be internal
35. Location of the cause could be external
36. Stability is whether the cause stays the same or can change with context
37. Responsibility is whether the person can control the cause
38. Luck is external
39. Luck is unpredictable
40. Luck cannot be controlled
41. The internal locus is closely related to emotions and self-esteem
42. The external locus is closely related to emotions and self-esteem
43. For example, "If a student attributes success or failure to internal factors, success leads to feelings of pride and increased motivation, but failure lowers self-esteem"
44. The stability dimension is closely related to expectations about the future
45. The responsibility dimension is related to emotions such as anger
46. The responsibility dimension is related to emotions such as pity
47. The responsibility dimension is related to emotions such as gratitude
48. The responsibility dimension is related to emotions such as shame
49. For example, "If students feel responsible for their failures, they may feel guilt"
50. "If they feel responsible for successes, they may feel proud"
5 1. For example, "Failing at a task we cannot control can lead to shame or anger toward the person or institution that is in control"
52. "Succeeding at uncontrollable tasks leads to feelings of gratefulness or being lucky"
53. When failure is attributed to lack of ability and the student considers ability to be uncontrollable, the sequence of motivation is:
54. Failure as a result of Lack of Ability
55. Lack of Ability is seen as uncontrollable
56. Uncontrollable leads to not responsible
57. Not responsible leads to shame

58. Shame leads to embarrassment
59. Embarrassment leads to withdraw
60. Withdraw leads to Performance decline
61. When failure is attributed to lack of effort, the sequence is:
62. Failure as a result of lack of effort
63. Lack of effort seen as controllable
64. Controllable leads to being responsible
65. Responsibility leads to guilt
66. Guilt leads to engagement
67. Engagement leads to Performance Improvement