Dynamic Characteristics of the New Curved Cable-stayed ... · Dynamic characteristics of the new...
10
Dynamic characteristics of the new curved cable-stayed bridge in Porto Marghera (Venice, Italy) from ambient vibration measurements Carmelo Gentile' & Enzo Siviero2 'Associate Prof., Dept. of Structural Engineering., Milan Polytechnic, Milan, Italy 2Prof., Dept. of Architecture Construction, IUAV, Venice University Venice, Italy E-mail: gen%ile~~slrl/.polimi.i"i ABSTRACT The paper summarizes the results of recent ambient vibration tests and operational modal analyses carried out on the new curved cable-stayed bridge erected in the Commercial Harbour of Porto Marghera (Venice, Italy). The ambient vibration tests were carried out as a part of the reception tests of the bridge before its opening and included the recordings of the system response in selected points of deck, tower and stays due to either micro- tremors and wind or "simulated" traffic excitation. Full details on the experimental procedures, instrumentation, data analysis techniques and the dynamic characteristics obtained with output-only modal identification techniques are presented and discussed. 1 INTRODUCTION In the last decades, the efficient utilisation of traditional structural materials and the introduction of new materials, the innovation in the architectural concepts, the advances in the design procedures and in the construction technologies induced an increasing popularity of cable-stayed bridges in the bridge engineering community and a large number of these bridge was erected world wide [I]. Almost all existing cable-stayed bridges are straight and only few have a curved deck superstructures; examples of known curved cable-stayed bridges are the Rhine bridge near Schaffhausen (Switzerland) [2], the Safti Link bridge in Singapore [3], the twin bridges at the Malpensa airport (Milan, Italy) [4]-[5] and the Katsushika bridge (Japan); furthermore, a long-span curved cable- stayed bridge with a single canted tower was recently proposed as a possible replacement for the existing East Bay Crossing of the San Francisco-Oakland Bay Bridge [6]. The special structural arrangement of these bridges added significant difficulties in both accurate structural analysis and assessment of "as built" behaviour. , .. . Figure 1. Views of the new curved cable-stayed bridge in Porto Marghera (Venice, Italy) The paper focuses on the dynamic behaviour of the new curved cable-stayed bridge (Figure 1) recently erected in Porto Marghera (Venice, Italy). The special geometric layout of the deck and of the inclined tower have motivated:
Transcript of Dynamic Characteristics of the New Curved Cable-stayed ... · Dynamic characteristics of the new...

Dynamic characteristics of the new curved cable-stayed bridge in Porto Marghera (Venice, Italy) from ambient vibration measurements
Carmelo Gentile' & Enzo Siviero2 'Associate Prof., Dept. of Structural Engineering., Milan Polytechnic, Milan, Italy 2Prof., Dept. of Architecture Construction, IUAV, Venice University Venice, Italy
E-mail: gen%ile~~slrl/.polimi.i"i
ABSTRACT The paper summarizes the results of recent ambient vibration tests and operational modal analyses carried out on the new curved cable-stayed bridge erected in the Commercial Harbour of Porto Marghera (Venice, Italy). The ambient vibration tests were carried out as a part of the reception tests of the bridge before its opening and included the recordings of the system response in selected points of deck, tower and stays due to either micro- tremors and wind or "simulated" traffic excitation. Full details on the experimental procedures, instrumentation, data analysis techniques and the dynamic characteristics obtained with output-only modal identification techniques are presented and discussed.
1 INTRODUCTION
In the last decades, the efficient utilisation of traditional structural materials and the introduction of new materials, the innovation in the architectural concepts, the advances in the design procedures and in the construction technologies induced an increasing popularity of cable-stayed bridges in the bridge engineering community and a large number of these bridge was erected world wide [I]. Almost all existing cable-stayed bridges are straight and only few have a curved deck superstructures; examples of known curved cable-stayed bridges are the Rhine bridge near Schaffhausen (Switzerland) [2], the Safti Link bridge in Singapore [3], the twin bridges at the Malpensa airport (Milan, Italy) [4]-[5] and the Katsushika bridge (Japan); furthermore, a long-span curved cable- stayed bridge with a single canted tower was recently proposed as a possible replacement for the existing East Bay Crossing of the San Francisco-Oakland Bay Bridge [6]. The special structural arrangement of these bridges added significant difficulties in both accurate structural analysis and assessment of "as built" behaviour.
,
.. .
Figure 1. Views of the new curved cable-stayed bridge in Porto Marghera (Venice, Italy)
The paper focuses on the dynamic behaviour of the new curved cable-stayed bridge (Figure 1) recently erected in Porto Marghera (Venice, Italy). The special geometric layout of the deck and of the inclined tower have motivated:

a) extensive studies developed during the design and the construction phases aimed to adequately define static and dynamic behaviour; b) the execution of extensive tests on the materials during the construction phase; c) the execution of careful reception (static and dynamic) tests before the bridge opening; d) the permanent installation of a monitoring system (based on fiber optic deformation sensors).
The Venice University was consulted in this context, at the beginning of the project, with the purpose of controlling the construction procedures and of developing a static and dynamic study of the bridge; successively, before the reception tests, also the Milan Polytechnic was consulted and dynamic test of the bridge was developed by the authors. The experimental investigation involved ambient vibration survey of the bridge, including the measurements of cable vibrations. The main objectives of the tests were: a) to fully understanding the three- dimensional dynamic characteristics of the bridge (determined in principle by the deck curvature and by the inclined tower); b) to provide a sound basis for the validation of a detailed finite element (F.E.) model developed during the construction of the bridge (in order to ensure that the model can be treated as the baseline F.E. model and is suitable for long term monitoring of the structure); c) to provide a proper baseline for the future monitoring and a validation of the results of the monitoring system.
2 THE CURVED CABLE-STAYED BRIDGE IN PORT0 MARGHERA (VENICE, ITALY)
The investigated cable-stayed bridge belongs to the new roadway viaduct that crosses the West Industrial Canal of the commercial harbour (Porto Marghera) of Venice. The viaduct (Figure 2) generally curves with a radius of 175 m and includes six spans (42 m + 105 m + 126 m + 30 m + 42 m + 42 m) for a total length of 387 m. The two longer curved spans are suspended by cable-stays from an inclined tower. An elevation and a plan view of the viaduct are presented in Figure 2.
The cable-stayed bridge consists of an inclined triangularly-shaped concrete tower, single-plane cables and a composite deck. The curved deck has a centreline length of 231 m, with two different side spans and 9 cables supporting each side span.
PLAN 'P3
ELEVATION
Figure 2. Plan and elevation of the investigated bridge (dimensions in cm) �
�������.���)����%�����������"��#�����!������%�&��%���+%���!��!���$�-�

DECK CROSS-SECTION
^"I
Figure 3. Deck cross-sections and tower elevation of the investigated bridge (dimensions in cm)
The cross-section of the bridge (Figure 3) consists of three steel girders, 185 cm high; the outer girders are wide flange sections while the central one is of box section. The girders are framed by floor beams 5.00 m spaced. Girders and floor beams are all composite with a 30.0 cm concrete slab. The total width of the deck is 23.70 m for two traffic lanes and three pedestrian walkways.
The cast-in-place inclined tower is 75 m high (Figure 3) and was prestressed to reduce the eccentricity of the vertical dead load due to the deck curved layout and to the tower geometry itself. The tower is a visually memorable landmark and acts as a gateway to the commercial harbour. Hence, the bridge gives an unique appearance to the industrial area and architectural concerns played a determining role in the conceptual and executive design.
3 AMBIENT VIBRATION TEST DESCRIPTION
The ambient vibration tests of the Port0 Marghera cable-stayed bridge were carried out using a 16-channel data acquisition system (NI DAQ Card AI-16XE-50) with 14 uniaxial WR 731A piezoelectric accelerometers; each WR 731A sensor (capable of measuring accelerations of up to k0.50 g with a sensitivity of 10 V/g) was connected with a short cable (1 m) to a WR P31 power unit/amplifier providing the constant current needed to power the accelerometer's internal amplifier, signal amplification, selective filtering and signal integration to yield velocity output signals. Two-conductor cables connected the power supplies to a computer workstation with the data acquisition board.
In the ambient vibration tests of the cable-stayed bridge, accelerations were measured in 34 selected points of the deck while only one cross-section of the tower (up-rising the deck of about 15 m, see Figure 4) was instrumented; in addition, accelerometers were placed also on all the 9 stays of the Mestre side of the bridge (Figure 4). Figure 5 shows a schematic of the sensor layout. The tests were performed in a total of 4 set-ups, as it is shown in Figure 6. From the 14 available sensors, 2 were considered as reference sensors and remained at the same points during all the set-ups, while the remaining sensors were placed in the other points, changing their position from set-up to set-up. It should be noticed that the last set-up (Figure 6d) included also the accelerometers on the ca ble-stays.
Since the ambient vibration tests were performed before the bridge was opened to the traffic, two different series of ambient vibration data were recorded for each set-up: in the first series, the excitation was only provided by the

� � �
�������4���)�!��������"��#��!�!��!�%������#����!�!�
�
�������5�����!��!���$����!��%�%���$����"����#��&��%�����!��
�������6��� 78���������!���8!�"����#��&��%�����!��
���������� �����������
� ��������� �����������
wind and the micro-tremors coming from the neighbouring roadways while in the second series the traffic excitation was achieved by means of two-axle trucks (with 400 kN gross weight each), crossing the bridge with symmetric and eccentric passages and velocities in the range of 10 to 50 km/h. In the following, these two different series of ambient vibration data will be referenced to as AVI (micro-tremors and wind) and AV2 (simulated traffic condition). For each channel and for each type of ambient excitation, the ambient acceleration-time histories were recorded for 3000 s with a sampling frequency of 400 Hz, so that the well-known rule of thumb (see e.g. [7]) about the length of the time windows acquired (that should be 1000 to 2000 times the period of the structure's fundamental mode) is largely satisfied.
The data, originally sampled at 400 Hz, was decimated 20 times and high-pass filtered to remove any offset and drift. After decimation, the number of samples in each record was of 60000 with a sampling interval of 0.05 s, corresponding to a Nyquist frequency of 10 Hz. Subsequently, data was processed in order to estimate the spectral matrix by using the modified periodogram method [8]; according to this approach an average is made over each recorded signal, divided into M frames of 2n samples, where windowing and overlapping is applied. In the present application smoothing is performed by 1024-points Hanning-windowed periodograms that are transformed and averaged with 66.7% overlapping, so that a total number of 173 spectral averages was obtained. Since the re-sampled time interval is 0.05 s, the resulting frequency resolution is 1/(1024x0.05) = 0.0195 Hz.
4 DYNAMIC CHARACTERISTICS OF THE BRIDGE
4.1 Global dynamic behaviour
The extraction of modal parameters from ambient vibration data was carried out by using two complementary output-only techniques: the Frequency Domain Decomposition (FDD) [9] in the frequency domain and the data driven Stochastic Subspace ldentification (SSI) [ I 01-[I I ] ; these techniques are available in the commercial program ARTeMlS [12].
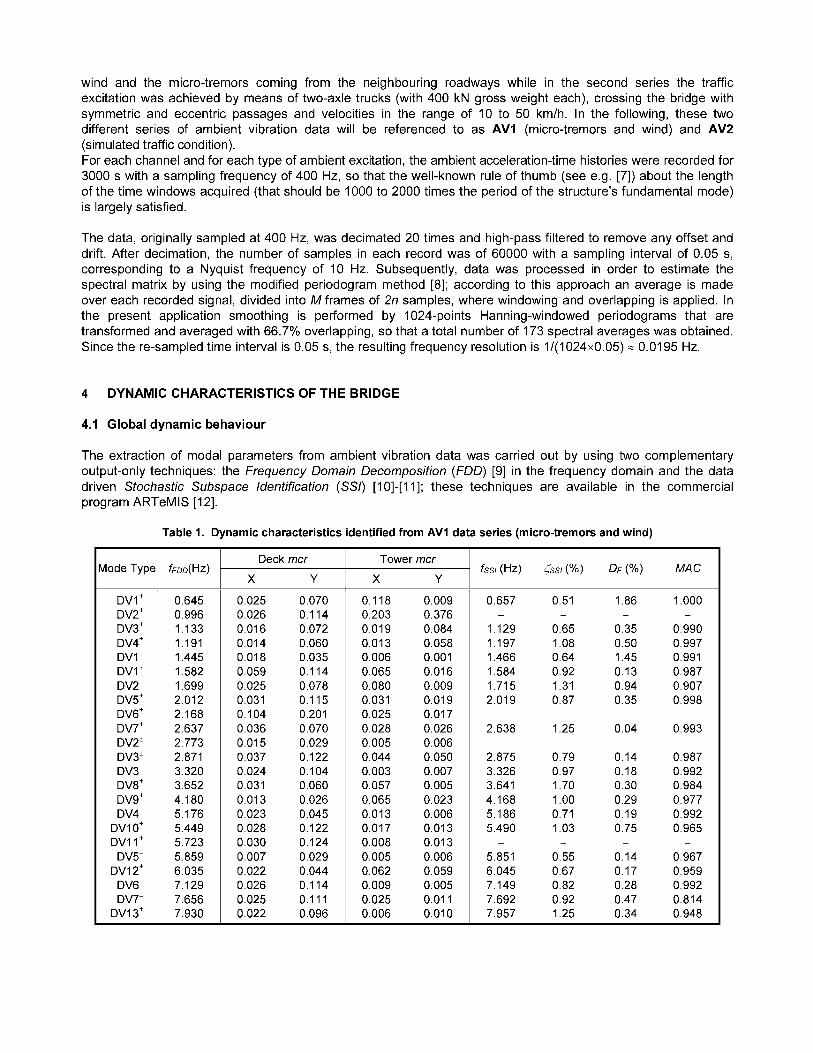
Table 1. Dynamic characteristics identified from AVI data series (micro-tremors and wind)
Aode Type
DVI' DV2' DV3' DV4' DV1- DVI DV2 DV5' DV6' DV7' DV2' DV3' DV3 DV8' DV9' DV4-
DVI 0' DVI 1' DV5-
DV12' DV6- DV7-
DVI 3'
0.645 0.996 1.133 1.191 1.445 1.582 1.699 2.012 2.168 2.637 2.773 2.871 3.320 3.652 4.180 5.176 5.449 5.723 5.859 6.035 7.129 7.656 7.930
Deck rncr X Y
0.025 0.070 0.026 0.1 14 0.016 0.072 0.014 0.060 0.018 0.035 0.059 0.1 14 0.025 0.078 0.031 0.115 0.104 0.201 0.036 0.070 0.015 0.029 0.037 0.122 0.024 0.104 0.031 0.060 0.013 0.026 0.023 0.045 0.028 0.122 0.030 0.124 0.007 0.029 0.022 0.044 0.026 0.1 14 0.025 0.1 11 0.022 0.096
fss / (Hz) <ss/(%) DF(%) MAC
0.118 0.009 0.203 0.376 0.019 0.084 0.013 0.058 0.006 0.001 0.065 0.016 0.080 0.009 0.031 0.01 9 0.025 0.01 7 0.028 0.026 0.005 0.006 0.044 0.050 0.003 0.007 0.057 0.005 0.065 0.023 0.013 0.006 0.017 0.01 3 0.008 0.01 3 0.005 0.006 0.062 0.059 0.009 0.005 0.025 0.01 1 0.006 0.01 0
0.657
1.129 1.197 1.466 1.584 1.715 2.019
2.638
2.875 3.326 3.641 4.168 5.186 5.490
5.851 6.045 7.149 7.692 7.957
~
~
~
~
0.51
0.65 1.08 0.64 0.92 1.31 0.87
1.25
0.79 0.97 1.70 1 .oo 0.71 1.03
0.55 0.67 0.82 0.92 1.25
~
~
~
~
1.86
0.35 0.50 1.45 0.13 0.94 0.35
0.04
0.14 0.18 0.30 0.29 0.19 0.75
0.14 0.17 0.28 0.47 0.34
~
~
~
~
1.000
0.990 0.997 0.991 0.987 0.907 0.998
0.993
0.987 0.992 0.984 0.977 0.992 0.965
0.967 0.959 0.992 0.814 0.948
~
~
~
~

The two sets of mode shapes resulting from the application of FDD and SSI techniques were compared using the Modal Assurance Criterion (MAC) [ 131.
As it has to be expected, several vibration modes were identified in the investigated frequency range from both the AVI and AV2 data series. Figures 7 and 8 show, for instance, the average of normalized Singular Values of the spectral matrices of all data sets obtained from data series AVI and AV2, respectively. Inspection of Figure 7 shows that 23 modes are reasonably well represented in the AVI data series, while few peaks in the first Singular Value are lost or less clearly detected in the AV2 data series (Figure 8). Furthermore, the inspection of Figure 7 and Figure 8 clearly highlights the correspondence of the natural frequencies between the two AVI and AV2 series, with the resonant peaks of Figure 8 being placed practically at the same frequencies of those in Figure 7.
Owing to the curvature of the bridge girder and to tower geometry, all mode shapes are in principle three- dimensional. The degree of coupling between vertical and transverse motion of the deck at each mode was investigated simply by computing the ratio mcr [14], [5] between the maximum absolute modal displacements of structural component in one direction divided by the maximum vertical modal displacement of the deck. The same index was calculated for the tower modal displacements in order to evaluate the degree of participation (and the direction of bending) of the tower to the global motion.
Figure 9 shows a selected number of mode shapes identified by applying the FDD algorithm to AVI data series. Table 1 summarizes the modal parameters identified from the same AVI series by the FDD and SSI methods, the
50
40
30
s 'FI 20 > u)
10
0
-1 0 3 6 !
Frequency (Hz)
Figure 7. FDD: Average of normalized Singular Values (SV) of the spectral matrix of all data sets (micro-tremors and wind)
50
40
30 5- = 20 2
10
0
-1 0
-20
Frequency (Hz)
Figure 8. FDD: Average of normalized Singular Values (SV) of the spectral matrix of all data sets (traffic)

���������������� ���������������� ��������������
� � �������������� ��������������� ���������������
� � ���������������� ��������������� ���������������
� � ����������������� ���������������� ���������������
� � ����������������� ���������������� ���������������
� � ���������������� ���������������� ����������������
� � ��
���������������� ����������������
� �
�������=�������$��%���&��������%�!��%���"��%�"������&������&���������!������!�+���,���$��'������!��%� �%-�
mcr ratios (evaluated for both deck and tower from the FDD estimate) and the mode classification. Furthermore, Table 1 compares the corresponding mode shapes and scaled modal vectors obtained from the two different identification procedures through the frequency discrepancy DF = I(fFDD-fssl)/fFDDI and the MAC.
Inspection of Fig. 9 and Table 1 clearly highlights that for the deck the ratio mcr is less than 0.20 for all vibration modes; hence, although slight coupling in the longitudinal and transverse direction is always present, the vertical components (either bending or torsion) strongly dominate the identified modal behaviour. This conclusion is also supported by the peaks of the response time-histories. The observed modes can be basically arranged as follows: 1. Bending-dominate modes (DVf). These modes are dominated by the vertical bending of the bridge deck,
with anti-symmetric deck modes generally involving a greater longitudinal participation of the tower than the symmetric ones. The first bending mode is an anti-symmetric half sine wave of the deck with a frequency of 0.65 Hz. Due to the curved layout of the deck and to the transverse slope, DVf modes are characterised by different displacements of the internal and the external borders of the girder; Torsional-dominate modes (DV-). These modes are dominated by the torsion behaviour of the deck and are usually coupled with transverse displacement of the deck; Mixed modes (DV'), where bending and torsion behaviour of the deck are simultaneously present. These modes generally involve a significant transverse deformation of the cross-section (see e.g. the mode placed at 2.77 Hz in Fig. 9).
2.
3.
Inspection of the correlation values listed in Table 1 shows a very good agreement between the FDD and the SSI techniques in terms of natural frequencies, with the frequency discrepancy being usually less than 1 %, except for the torsion modes DVl f and DV1-. A similar correspondence is generally found also for most mode shapes, except for the torsion modes DV2-and DV7-. A similar correspondence is detected also for the estimates obtained from the operational modal analysis of AV2 data series.
A further comment is needed about the identification of damping ratios. The measurement-based estimates of the damping ratios identified by the SSI technique, shown in Table 1, generally range between 0.51 % and 1.70% which are usual values for composite structures.
4.2 Stay-Cables behaviour
R
Frequency (Hz)
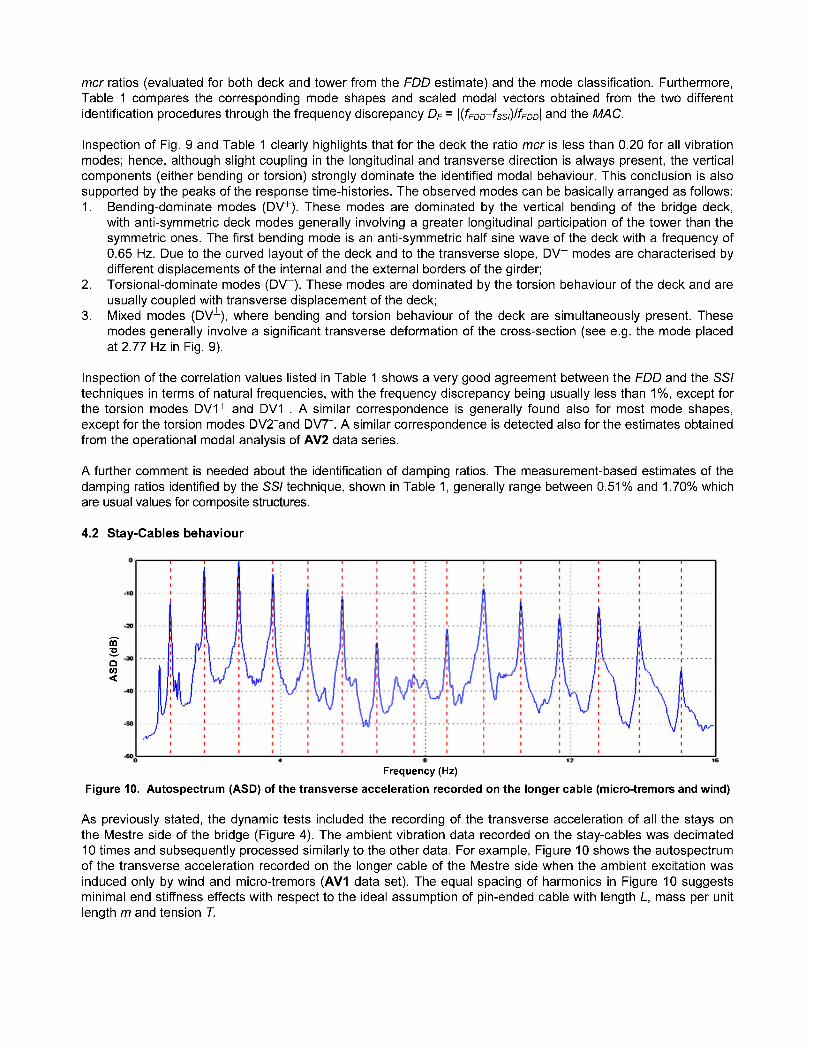
Figure I O . Autospectrum (ASD) of the transverse acceleration recorded on the longer cable (micro-tremors and wind)
As previously stated, the dynamic tests included the recording of the transverse acceleration of all the stays on the Mestre side of the bridge (Figure 4). The ambient vibration data recorded on the stay-cables was decimated 10 times and subsequently processed similarly to the other data. For example, Figure 10 shows the autospectrum of the transverse acceleration recorded on the longer cable of the Mestre side when the ambient excitation was induced only by wind and micro-tremors (AVI data set). The equal spacing of harmonics in Figure 10 suggests minimal end stiffness effects with respect to the ideal assumption of pin-ended cable with length L, mass per unit length m and tension T.

By numbering the stay-cables of the Mestre side in descending order (Le. the longer cable is referred to as "Stay- cable n. 1" while the shorter is referred to as "Stay-cable n. 9"), the following fundamental frequencies of the stays were identified from both AVI and AV2 data series:
Stay-cable n. 1 fl = 0.957 Hz Stay-cable n. 2 fl = 1.094 Hz Stay-cable n. 3 fl = 1.230 Hz Stay-cable n. 4 fl = 1.270 Hz Stay-cable n. 5 fl = 1.348 Hz Stay-cable n. 6 fl = 1.484 Hz Stay-cable n. 7 fl = 1.582 Hz Stay-cable n. 8 fl = 1.133 Hz Stay-cable n. 9 fl = 1.230 Hz
Beyond the traditional use of the above values for estimating the tension T in the stay-cables, it should be noticed that the lower global modes of the bridge (i.e. 0.996 Hz, 1.133 Hz, 1.191 Hz, 1.445 Hz and 1.582 Hz) occur at stay cable frequencies or very close to stay-cable frequencies.
5 CONCLUSIONS
Experimental investigation of a curved cable-stayed bridges has been presented and discussed. The following main conclusions can be drawn: 1. Within the frequency range 0-10 Hz, more than 20 (global) vibration modes were identified by using the FDD
and the SSI techniques. The ambient levels of excitation, induced either by wind and micro-tremors or by the passage of few two-axle trucks, were sufficient to produce reasonably strong and uncontaminated signals, enabling clear output-only modal identifications to be performed;
2. Notwithstanding the curved layout of the bridge deck, slight coupling between vertical and transverse vibration of the deck was observed at the low level of vibration that existed during the tests. For each vertical mode, either bending or torsion, the vertical component exceeds the transverse one by at least a factor of 5;
3. Few mixed bending+torsion modes were identified and such modes generally involve a significant transverse deformation of the deck cross-section;
4. some global modes of the bridge were found to occur at (or very close to) the fundamental frequencies of the stay-cables.
As a final remark, the identified dynamic characteristics of the bridge will provide a sound basis either for the structural identification part of the study (validation and updating of the baseline F.E. model of the bridge) or for the future monitoring.
ACKNOWLEDGEMENTS
The research was supported by M.I.U.R. (under grant VINCES-Cofin04) and by the Venice Harbour Administration. The authors are indebted with Eng. A. Pietrogrande; without his involvement, this research would not have been possible. The valuable help of N. Gallino in the signal analysis and output-only modal identification is gratefully acknowledged. Sincere thanks are also due to the technical personnel (M. Antico and M. Cucchi) from the Laboratories of the Department of Structural Engineering, Milan Polytechnic who assisted the first author in conducting the field tests.
REFERENCES
[ I ] Virlogeux M. "Recent evolution of cable-stayed bridges", Engineering Structures, 21, 737-755, 1999. [2] Deger Y., Cantieni R., deSmet C.A.M. and Felber A.J. "Finite element model optimization of the new Rhine
bridge based on ambient vibration testing", Roc. Eurodyn '96, 817-822, 1996. [3] Brownjohn J.M.W. and Xia P.Q. "Dynamic assessment of curved cable-stayed bridge by model updating",
J. Structural Engineering, ASCE, 126, 252-260, 2000. [4] Martinez y Cabrera F. and lmparato V. "Access bridges for Milan's "Malpensa 2000" air station", L'lndustria
ltaliana del Cemento, LXX, 634-661, 1999. [5] Gentile C. and Martinez y Cabrera F. "Dynamic performance of twin curved cable-stayed bridges",
Earthquake Engineering & Structural Dynamics, 33, 15-34, 2004. [6] Astaneh-As1 A. and Black R.G. "Seismic and structural engineering of a curved cable-stayed bridge", J.

171
181
191
11 01
11 11
11 21 11 31
1141
Bridge Engineering, ASCE, 6, 439-450, 2001. Cantieni R. "Experimental methods used in system identification of civil engineering structures", Proc. 7'' lnt. Operational Modal Analysis Conference (IOMAC), Copenag hen, 2005. Welch, P.D. "The use of Fast Fourier Transform for the estimation of Power Spectra: a method based on time averaging over short modified periodograms", /E€€ Transactions, AU-15, 70-73. 1967. Brincker R., Zhang L.M. and Andersen, P. "Modal identification from ambient responses using Frequency Domain Decomposition", Proc. Is" lnt. Modal Analysis Conference (/MAC), San Antonio, 2000. Peeters B. and De Roeck G. "Reference-based stochastic subspace identification for output-only modal analysis", Mechanical Systems and Signal Processing, 6(3), 855-878, 1999. Van Overschee P. and De Moor B. Subspace identification for linear systems: Theory, implementation, applications, Kluwer Academic Publishers, 1996. ARTeMlS Extractor 4.0 Program Overview, h l l ~ : , ! / ~ ~ ~ ~ ~ ~ ~ . s \ ~ . i b s . c r ~ r n , 2006. Allemang R.J. and Brown D.L. "Correlation coefficient for modal vector analysis". Proc. fst lnt. Modal Analysis Conf. (/MAC), 11 0-1 16, 1983. Wilson J.C. and Liu T. "Ambient vibration measurements on a cable-stayed bridge", Earthquake Engineering & Structural Dynamics, 20, 723-747, 1991.