Dynamic Buckling of Continuous Welded Rail Track:...
16
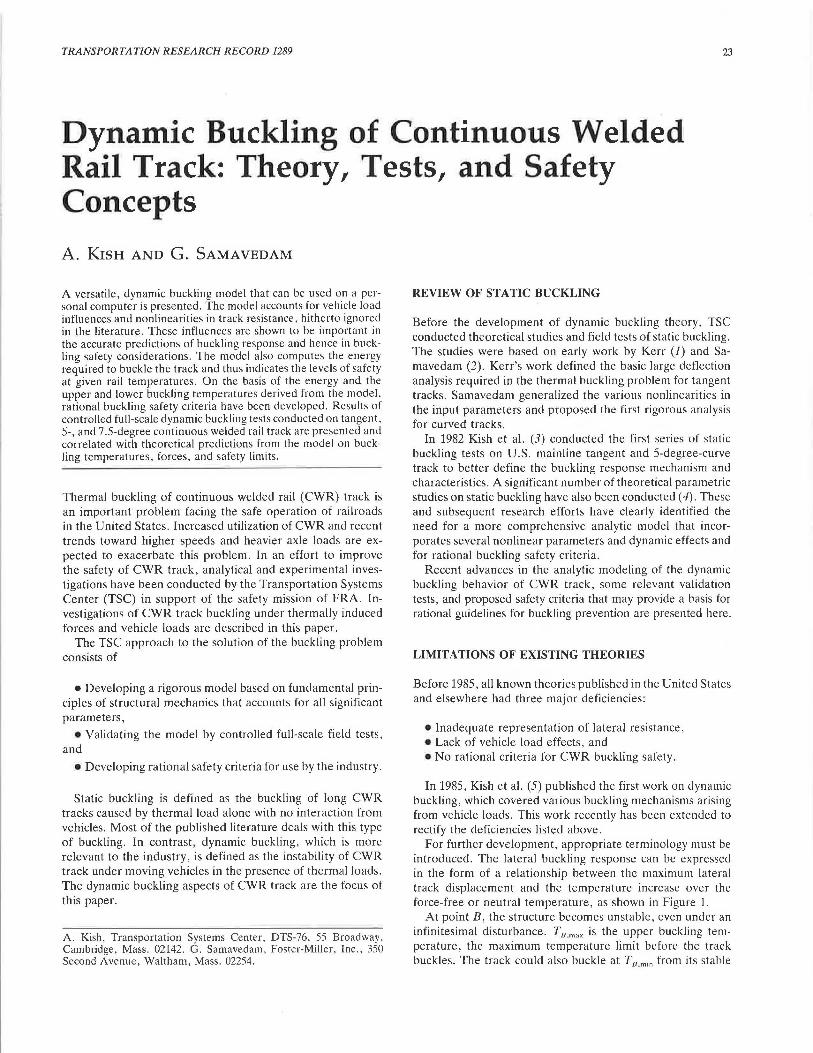
TRANSPORTATION RESEARCH RECORD 1289 23 Dynamic Buckling of Continuous Welded Rail Track: Theory, Tests, and Safety Concepts A. KISH AND G. SAMAVEDAM A versatile, dynamic buckling model that can be used on a per- sonal computer is presented. The model accounts for vehicle load influences and nonlinearities in track resistance, hitherto ignored in the literature. These influences are shown to be important in the accurate predictions of buckling response and hence in buck- ling safety considerations. The model also computes the energy required to buckle the track and thus indicates the levels of safety at given rail temperatures. On the basis of the energy and the upper and lower buckling temperatures derived from the model, rational buckling safety criteria have been developed. Results of controlled full-scale dynamic buckling tests conducted on tangent. 5-, and 7.5-degree continuous welded rail track are presented and correlated with theoretical predictions from the model on buck- ling temperatures, forces, and safety limits. Thermal buckling of continuous welded rail (CWR) track is an important problem facing the safe operation of railroads in the United States. Increased utilization of CWR and recent trends toward higher speeds and heavier axle loads are ex- pected to exacerbate this problem. In an effort to improve the safety of CWR track, analytical and experimental inves- tigations have been conducted by the Transportation Systems Center (TSC) in support of the safety mission of FRA. In- vestigations of CWR track buckling under thermally induced forces and vehicle loads are described in this paper. The TSC approach to the solution of the buckling problem consists of • Developing a rigorous model based on fundamental prin- ciples of structural mechanics that accounts for all significant parameters, • Validating the model by controlled full-scale field tests, and •Developing rational safety criteria for use by the industry. Static buckling is defined as the buckling of long CWR tracks caused by thermal load alone with no interaction from vehicles. Most of the published literature deals with this type of buckling. In contrast, dynamic buckling, which is more relevant to the industry, is defined as the instability of CWR track under moving vehicles in the presence of thermal loads. The dynamic buckling aspects of CWR track are the focus of this paper. A. Kish, Transportation Systems Center, DTS-76, 55 Broadway, Cambridge, Mass. 02142. G. Samavedam, Foster-Miller, Inc., 350 Second Avenue, Waltham, Mass. 02254. REVIEW OF STATIC BUCKLING Before the development of dynamic buckling theory, TSC conducted theoretical studies and field tests of static buckling. The studies were based on early work by Kerr (J) and Sa- mavedam (2). Kerr's work defined the basic large deflection analysis required in the thermal buckling problem for tangent tracks. Samavedam generalized the various nonlinearities in the input parameters and proposed the first rigorous analysis for curved tracks. In 1982 Kish et al. (3) conducted the first series of static buckling tests on U.S. mainline tangent and 5-degree-curve track to better define the buckling response mechanism and characteristics. A significant number of theoretical parametric studies on static buckling have also been conducted ( 4). These and subsequent research efforts have clearly identified the need for a more comprehensive analytic model that incor- porates several nonlinear parameters and dynamic effects and for rational buckling safety criteria. Recent advances in the analytic modeling of the dynamic buckling behavior of CWR track, some relevant validation tests, and proposed safety criteria that may provide a basis for rational guidelines for buckling prevention are presented here. LIMIT A TIO NS OF EXISTING THEORIES Before 1985, all known theories published in the United States and elsewhere had three major deficiencies: • Inadequate representation of lateral resistance, • Lack of vehicle load effects, and • No rational criteria for CWR buckling safety. In 1985, Kish et al. (5) published the first work on dynamic buckling, which covered various buckling mechanisms arising from vehicle loads. This work recently has been extended to rectify the deficiencies listed above. For further development, appropriate terminology must be introduced. The lateral buckling response can be expressed in the form of a relationship between the maximum lateral track displacement and the temperature increase over the force-free or neutral temperature, as shown in Figure 1. At point B, the structure becomes unstable, even under an infinitesimal disturbance. Tn.m"x is the upper buckling tem- perature, the maximum temperature limit before the track buckles. The track could also buckle at T n. min from its stable
Transcript of Dynamic Buckling of Continuous Welded Rail Track:...
TRANSPORTATION RESEARCH RECORD 1289 23
Dynamic Buckling of Continuous Welded Rail Track: Theory, Tests, and Safety Concepts
A. KISH AND G. SAMAVEDAM
A versatile, dynamic buckling model that can be used on a personal computer is presented. The model accounts for vehicle load influences and nonlinearities in track resistance, hitherto ignored in the literature. These influences are shown to be important in the accurate predictions of buckling response and hence in buckling safety considerations. The model also computes the energy required to buckle the track and thus indicates the levels of safety at given rail temperatures. On the basis of the energy and the upper and lower buckling temperatures derived from the model, rational buckling safety criteria have been developed. Results of controlled full-scale dynamic buckling tests conducted on tangent. 5-, and 7 .5-degree continuous welded rail track are presented and correlated with theoretical predictions from the model on buckling temperatures, forces, and safety limits.
Thermal buckling of continuous welded rail (CWR) track is an important problem facing the safe operation of railroads in the United States. Increased utilization of CWR and recent trends toward higher speeds and heavier axle loads are expected to exacerbate this problem. In an effort to improve the safety of CWR track, analytical and experimental investigations have been conducted by the Transportation Systems Center (TSC) in support of the safety mission of FRA. Investigations of CWR track buckling under thermally induced forces and vehicle loads are described in this paper.
The TSC approach to the solution of the buckling problem consists of
• Developing a rigorous model based on fundamental principles of structural mechanics that accounts for all significant parameters,
• Validating the model by controlled full-scale field tests, and
•Developing rational safety criteria for use by the industry.
Static buckling is defined as the buckling of long CWR tracks caused by thermal load alone with no interaction from vehicles. Most of the published literature deals with this type of buckling. In contrast, dynamic buckling, which is more relevant to the industry, is defined as the instability of CWR track under moving vehicles in the presence of thermal loads. The dynamic buckling aspects of CWR track are the focus of this paper.
A. Kish, Transportation Systems Center, DTS-76, 55 Broadway, Cambridge, Mass. 02142. G. Samavedam, Foster-Miller, Inc., 350 Second Avenue, Waltham, Mass. 02254.
REVIEW OF STATIC BUCKLING
Before the development of dynamic buckling theory, TSC conducted theoretical studies and field tests of static buckling. The studies were based on early work by Kerr (J) and Samavedam (2). Kerr's work defined the basic large deflection analysis required in the thermal buckling problem for tangent tracks. Samavedam generalized the various nonlinearities in the input parameters and proposed the first rigorous analysis for curved tracks.
In 1982 Kish et al. (3) conducted the first series of static buckling tests on U.S. mainline tangent and 5-degree-curve track to better define the buckling response mechanism and characteristics. A significant number of theoretical parametric studies on static buckling have also been conducted ( 4). These and subsequent research efforts have clearly identified the need for a more comprehensive analytic model that incorporates several nonlinear parameters and dynamic effects and for rational buckling safety criteria.
Recent advances in the analytic modeling of the dynamic buckling behavior of CWR track, some relevant validation tests, and proposed safety criteria that may provide a basis for rational guidelines for buckling prevention are presented here.
LIMIT A TIO NS OF EXISTING THEORIES
Before 1985, all known theories published in the United States and elsewhere had three major deficiencies:
• Inadequate representation of lateral resistance, • Lack of vehicle load effects, and • No rational criteria for CWR buckling safety.
In 1985, Kish et al. (5) published the first work on dynamic buckling, which covered various buckling mechanisms arising from vehicle loads. This work recently has been extended to rectify the deficiencies listed above.
For further development, appropriate terminology must be introduced. The lateral buckling response can be expressed in the form of a relationship between the maximum lateral track displacement and the temperature increase over the force-free or neutral temperature, as shown in Figure 1.
At point B, the structure becomes unstable, even under an infinitesimal disturbance. Tn .m"x is the upper buckling temperature, the maximum temperature limit before the track buckles. The track could also buckle at T n .min from its stable

24
w rJJ <I: w ~~ ~ g: w:::::J a: w :::::iZ
~ a: (( ~ TB.MIN
:f 0 ::;; w f-
0
FIGURE 1
LATERAL DISPLACEMENT
Typical buckling response.
equilibrium position A to S, if given sufficient external disturbance, such as forces developed by a moving train. TB.min is defined as the lower buckling temperature, which, as seen later, may or may not equal a safe allowable temperature.
Lateral Resistance Characteristic
TSC performed a large number of track lateral resistance evaluation tests. Both panel pull and single-tie push tests (STPTs) were executed and the results were correlated. As described by the authors in another paper in this Record. a special portable test fixture for individual tie resistance evaluation has been developed. Typical results for U.S. track are shown in Figure 2. The results identify two salient points, F,, and FL, which are the peak resistance and the limiting resistance. Except in the case of extremely weak tracks, the resistance has a "softening" characteristic after reaching the peak value. The full characteristic is important in the buckling analysis because at temperatures equal to or greater than the lower buckling temperature (TB.min) the resulting deflections are large. Many existing works considered only the peak resistance in the determination of the buckling response and significantly overestimated the values of Tu.min' the implications of which will be discussed later.
w 0 z ~ rJJ (/j w a: _J
<I: a: w s
STRONG [F, - 150 lbs/in]
MEDIUM [F, - 100 lbs/in]
WEAK [F, - 50 lbs/in]
LATERAL DEFLECTION
FIGURE 2 Typical single-tie push test results.
TRANSPORTATION RESEARCH RECORD 1289
Vehicle Load Effects
Research conducted by the French National Railway (SNCF) indicates that most track buckling is caused by vehicle passage (6). According to a survey by the Association of American Railroads, 68 percent of derailment-inducing buckling occurred under the train consist; 6 percent occurred in front of the locomotive (7). Tests conducted by the Hungarian State Railways indicated that vehicle traffic can reduce the buckling strength by 20 to 30 percent (8,9). These data and the results of testing by TSC, which will be presented later, indicate the importance of including vehicle effects in buckling analyses.
Work by Kish et al. (5) contains a review of literature on vehicle effects published before 1985. The following mechanisms were identified to be important in constructing an appropriate dynamic buckling theory:
1. Uplift of the track due to precession/recession and central bending waves can reduce the lateral resistance and, hence, buckling strength.
2. Lateral forces generated on the track due to wheel/rail interaction (especially in the presence of lateral imperfections), in combination with many passes of the vehicle, can increase the size of the imperfection and therefore reduce the buckling strength.
3. Braking, traction, and flanging forces can also increase compressive forces and hence reduce buckling strength.
4. Track vibration caused by passage of a vehicle can cause loss of lateral ballast resistance.
Detailed calculations on Mechanism l are presented in work by Kish et al. (5). The central bending wave for long cars and the precession wave for locomotives are generally important in buckling evaluation, as shown in Figure 3. The work presented in this paper accounts for the loss of lateral resistance caused by the uplift of the track, allowing for self-weight of the track. The uplift mechanism has been previously identified as one of the principal causes of buckling by European researchers, including Eisenmann (JO). An experimental proof of the effect of this mechanism will be provided later.
The effect of the ratio of truck lateral to vertical loads (LIV), as implied in Mechanism 2, was considered by Kish et al., who concluded that LIV becomes critical if it exceeds the friction coefficient between tie and ballast (5). The same conclusion was reached earlier by SNCF (6). Limited studies have been performed to date on Mechanism 3, and no work has been done in the United States on Mechanism 4. The TSC approach is to combine the influence of those dynamic factors into a dynamic margin of safety, which will be discussed later.
Basis for Buckling Safety Criteria
Previous works recommend the lower buckling temperature as the safe allowable limit for CWR track. As shown later. this approach can be conservative in some cases. An optimum safe allowable temperature must therefore be established. This can be done through energy considerations presented here.
At the upper buckling temperature, the external energy required to buckle the track is zero. This temperature cannot practically be reached without buckling the track under dy-

Kish and Samavedam 25
DIRECTION OF TRAVEL
CENTRAL WAVE
INITIAL LATERAL IMPERFECTION
P ~ p _,., 1-1r-"""----=-----=-~----.-, -L L L L
ASSUMED LATERAL BUCKLING MODE
FIGURE 3 Typical track deflections caused by GP38-2 locomotive and hopper car.
namic conditions because trains always cause some finite disturbance. Nevertheless, the energy required to buckle the track at the lower buckling temperature may be considerably greater than that generated by moving trains. The track's buckling potential at different rail temperatures for given parameters can be evaluated through calculation of the energy required for buckling. As shown later, energy calculations provide a rational basis for defining operational temperatures with a given level of safety.
TSC BUCKLING MODEL
A buckling model has been developed by TSC using the differential equations described in the next section. It has the following features:
• It applies to tangent and curved tracks. •Lateral alignment defects are included . •It accounts for any nonlinearity in the lateral resistance,
including the softening behavior referred to previously. The individual contributions of tie bottom, crib, and shoulder to the lateral resistance become important in the model.
• Linear or nonlinear longitudinal resistance can be incorporated.
• It considers vehicle load influences and accounts for lateral resistance loss or variation under the cars. Car parameters such as truck center spacing and wheel load are included , as are track modulus and tie-ballast friction coefficient.
• It calculates the external energy required for an explosive (sudden) buckling and thus indicates the potential risk of buckling at a given rise in rail temperature.
•It can be run on a personal computer (PC), with simple user-friendly inputs. It can be operated as an expert system , requiring no kn owledge of the theoretical equations involved. The program has default options and automatically assumes missing input if not provided by the operator.
• The output can be in the form of buckling response curves, with printout of upper and lower buckling temperatures, energy, and risk factors.
• Within the limitations of the physical assumptions, the model is extremely accurate , relying on differential equations and fast converging Fourier series solution.
Buckling Response Determination
A basic formulation for tangent track has been provided by Samavedam et al. (J J). Here, the formulation for curved track not presented in earlier work is given . The following assumptions are made:
• The two rails can be combined into a single beam of known cross-sectional area A and flexural rigidity El.
• The torsional stiffness in rail-tie fasteners may be neglected, which is reasonable for the majority of wood-tie tracks with tie plate-cut spike construction in the United States.
• The buckled zone with lateral disp lacements is confined to a finite length. This has been confirmed by tests (12,13). The longitudinal resistance offered by the ballast to the longitudinal movement of the rail beam can be neglected in the buckled zone, which will simplify the solution of the resulting differential equations .
•The adjoining zone experiences only longitudinal movement, and the rail force at infinity is PL = AEaT, where T is the increase in temperature over the stress-free temperature and a is the rail steel's coefficient of thermal expansion. The longitudinal resistance can be linear or nonlinear. As shown by Samavedam (2), there are no theoretical difficulties in handling the nonlinearity in the resistance . For simplicity, linear idealization will be used here because it appears to be adequate, on the basis of recent field test data .
The lateral resistance is idealized as follows .
Partial "softening" lateral resistance :
F[w(x)] = FAk + (1 - k)exp(-µ 2w)) (1.1)

26
Full "softening" lateral resistance:
F[w(x)] = Fp(l - exp( - µ 1w)] { k + (1 - k)
x exp [ - µ 2 ( w - :,) ] }
(1.2)
where
FP = value of the peak lateral re. istance, k = ratio of reduced to peak lateral resistance,
µ 1 and µ 2 = stiffness parameters that define the initial and softening behavior of the assumed lateral resistance function, and
w = lateral or radial track deflection.
Examples of the idealizations are shown in Figure 4. For the case in which vehicle load ing is present, the peak
resistance (Fp) is a function of the longitudinal distance along the track:
- {[F µQ] for uplift Fp[w(x)] = [F,'. + µR,(x)] otherwise
where
FP = peak value of static lateral resistance, µ = tie to ballast coefficient of friction, Q = self-weight of the entire track, and
(2)
Rv(x) = vertical deflection profile produced by the vehicle wheel loads on the track .
The vertical deflection profile can be calculated from the classical theory for beams on elastic foundation. Uplift o curs when the sum of the vertical deflection and the self-weight of the track is less than zero ([Q + R,.(x)] < 0).
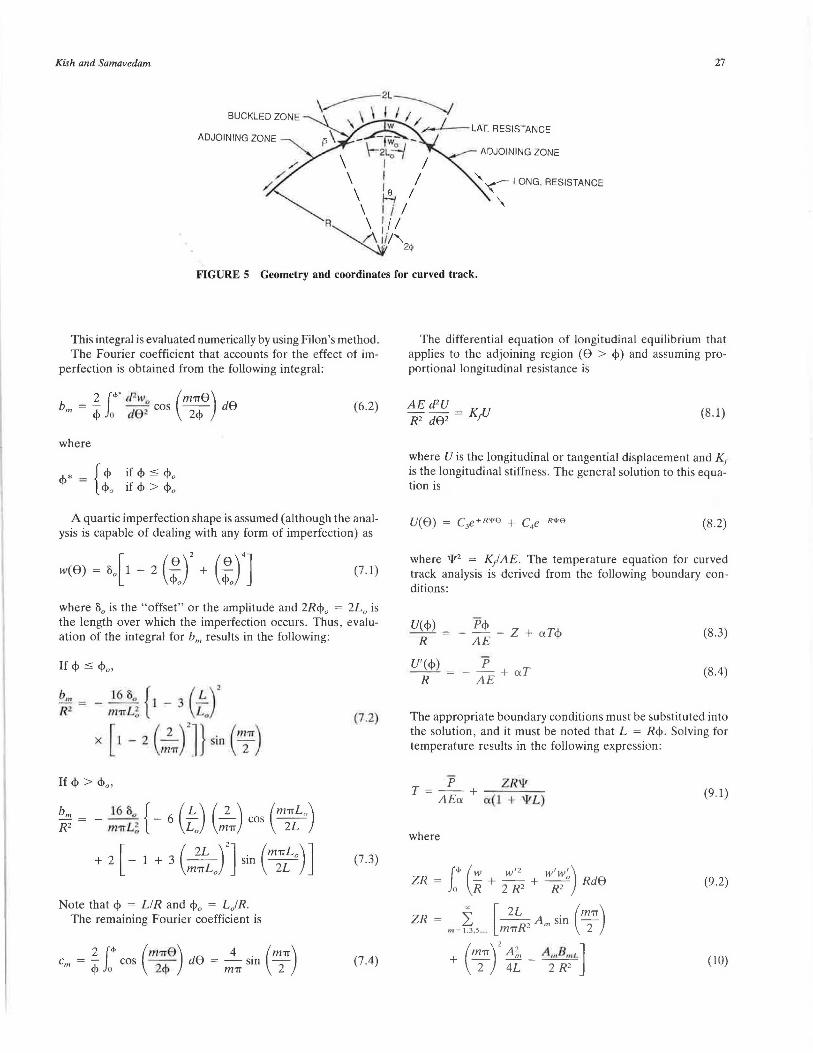
Governing Equations for Curved Track Analysis
For the geometry and coordinate system shown in Figure 5, the governing differential equation in the buckled zone (0 ..,; 8 ..,; <!>) for curved track is given by Samavedam (2) as
.,; g LL
2000
500
0.5 1.5
TRANSPORTATION RESEARCH RECORD 1289
El,, d·'w P d2w P P d~w" R4 d'"""i + R2 d82 = - F[w(S)] + R - R2 cl i (3)
where
El,, = flexural rigidity of both rails in the lateral plane,
P = rail compressive force, w = lateral or radial displacement,
w0 = initial misalignment, and F = the lateral resistance.
The Fourier method originally given by Samavedam (2) is used for the solution of Equation 3:
w(8) ~ (m'lT8) L; Am cos --m = 1,3,5... 2<j>
x
2: m = 1.3,5 . .
F[w(x)] m =~.5 .. am cos (m2~8) p
R ~ (m'lT8)
m=B.5 .. Cm COS ~
Using the differential equation, it can be shown that
A,,,
(4.1)
(4.2)
(4.3)
(4.4)
(5)
The Fourier coefficient that accounts for the effects of lateral resistance in the curved track case is derived from
2 l"' (m'lT8) a,,. = ~ 0
F(w(8)] cos ~ d8
2
----- TEST DATA
-- FULL SOFTENING Fp= 1750, K = 0.706 µ, = 10, µ, = 1.25
-•-PARTIAL SOFTENING K = 0.706, µ, = 1.25
(6.1)
DISPLACEMENTS (in.)
FIGURE 4 Lateral resistance test data and idealizations.
Kish and Samavedam
BUCKLED ZONE
ADJOINING ZONE
ADJOINING ZONE
"'-. < LONG. RESISTANCE
\
27
FIGURE 5 Geometry and coordinates for curved track.
This integral is evaluated numerically by using Filon's method. The Fourier coefficient that accounts for the effect of im
perfection is obtained from the following integral:
2 ("'. rPw (m7T0) bm = -;j; Jo d ; COS ~ d0
where
<!>* = { cp if cp $ <Po <Po if cp > <Po
(6 .2)
A quartic imperfection shape is assumed (although the analysis is capable of dealing with any form of imperfection) as
(7 .1)
where 80 is the "offset" or the amplitude and 2Rcp0 = 2L0 is the length over which the imperfection occurs . Thus, evaluation of the integral for b,,, results in the following:
If cp $ <P0 ,
(7 .2)
If<!> > <P 0 ,
~~ ,~,:~! { - 6 (tJ (~1T) COS ( m;t 0
)
+ 2 [ - 1 + 3 (m~LL0rJ sin (m;t 0
) J (7 .3)
Note that <P = LIR and cp0 = LJ R. The remaining Fourier coefficient is
2 ("' (m.1Te) 4 . (m7T) cm = -;j; Jo cos ~ d0 = m7T sm 2 (7.4)
The differential equation of longitudinal equilibrium that applies to the adjoining region (0 > <P) and assuming proportional longitudinal resistance is
AEd2U Ji2 de2 = Kp (8.1)
where U is the longitudinal or tangential displacement and K1 is the longitudinal stiffness. The general solution to this equa~ tion is
(8.2)
where '¥2 = K/AE. The temperature equation for curved track analysis is derived from the following boundary conditions:
U(cp) = P <P (8.3) - - - Z + cx Tcp
R A E
U'(<P) = p (8.4) -- -+ cxT
R AE
The appropriate boundary conditions must be substituted into the solution, and it must be noted that L = Rep. Solving for temperature results in the following expression:
T = P + ZR'lt A Ecx af l + 'i'L)
(9.1)
where
f"' (w w'2 w'w' ) ZR = - + - + --0 Rd0 o R 2 R2 R2
(9.2)
~ [ 2L . (m7T) ZR= L; --2
A,,, sm -,,.~ u ,s_ m'TTR 2
+ (m7T)2 A;,, _ A,,,8,,,L]
2 4L 2 R2 (10)

28
l!:nergy Required for Buckling
The prebuckling state is represented by Position 1 in Figure 1, and the postbuckling unstable branch is represented by Position 2. It is assumed that if the track can be brought into Position 2, it will automatically move to Position 3.
The following factors are defined:
V1 = strain energy in the rails at stable equilibrium Position 1,
V2 = strain energy in the rails at unstable equilibrium Position 2,
W = work done against resistances by moving track from Position 1 to Position 2, and
0. = energy required to move track from Position 1 to Position 2.
By an energy balance
0. = (V2 - V,) + W (11)
The strain energy components are given by the following integrals :
(12)
where P x = -AEa.T. Here, for simplicity, the energy caused by bending in the prebuckling state is neglected:
1 lx pz EI,, lx (d2 w) 2
V =- -dx+- - dx 2 2 o AE 2 o dx2 (13)
In the curved track case, the longitudinal force distribution becomes
{
p P = 1 du
AE (- - - a.T) Rd8
for 0:::: 8 :::: <j>
for 8 > cjJ (14)
The work components are given by the following integrals:
rx rw(x) W1 = Jo Jo F[w(x)]dw·dx (15)
W2 = r rxl f[u(x)]dwdx (16)
Thus, the total work done against ballast resistance (lateral and longitudinal) is
(17)
The difference in strain energy is calculated from the following equation:
V - V = ! (x ~ - P: dx + EI,, (x (d2w)2 dx (18) 2 1 2 Jo A E 2 Jo dx 2
TRANSPORTATION RESEARCH RECORD 1289
This equation shows that the total strain energy is the sum of two components: one caused by compressive axial force and the other caused by beam bending. The evaluation of these integrals is performed with the aid of the Fourier analysis . Under the assumption of proportional longitudinal resistance, the difference in strain energy can be expressed in a "closed form":
a.T] +-'I'
(19)
The work done against lateral resistance can be evaluated from Equation 15 once the lateral resistance function is expressed mathematically . For the partial softening lateral resistance characteristics considered in the Fourier analysis section, the work done against lateral resistance is
W1 = 2 r F/x) [ kw(x)
+ { (l :2
k) 1 - exp[ - µ 2w(x)]}] dx (20.1)
Full softening lateral resistance is
(1-k) 4µ + --exp-2{1 - exp[-µ2w(x)]} J.L2 µl
(1 - k) 4µ ') - ---exp-2 {1 - exp[ - (µ,, + µ 2)w(x)} dx µ , + µ 2 µ,,
(20.2)
This integral is evaluated numerically . The work done against longitudinal resistance ,
- _&_ ( p )2 Wz - 4 'Jl3 AE - a.T (21)
Illustrotivc Numerical Examples
Effect of Softening Lateral Resistance
The dynamic buckling response of 7.5-degree CWR curved track with both constant and softening lateral resistance characteristics is shown in Figure 6. The constant resistance idealization significantly overestimates the lower buckling temperature (77°F) compared with the softening characteristic (50°F) . The buckling responses are also significantly different.

Kish and Samavedam 29
6 T (0 F} eo ....-~~~~~~~~~~~~~~~~~--------~-~~~~---,
CONSTANT RESISTANCE\ __ •• • --------·
--- --------------·~--,,,,-70
60
50
40
30
20
10
7.5 Deg CURVE, 13611 RAIL
NONLINEAR RESISTANCE
Fp = 88.9 lb/in; SLAG BALLAST Kr = 200 lbnn/in S0 = 1.351n; Lo= 16ff
LOADED HOPPER CAA
TRUCK CENTER SPACING = 506 in AXLE SPACING = 70 in
v = 32,875 fb Kv = 6000 psi
o -1--~.-1-~..--~~~-.-~....-~-.-~--.-~-r-~-.~-.-~-r~-1
0 2 4 6 B 10 12
LATERAL DEFLECTION (inches)
FIGURE 6 Influence of constant versus nonlinear resistance on buckling response.
Effect of Vehicle Loads
The theoretical buckling response of the 7.5-degree CWR curved track under hopper car loads is shown in igure 7. The results for the ·tatic case without the vehicle are also hown. Oecause ft.he vehicle influence, the upper buckling
temperature is reduced from 75° to 62°F.
Energy Required for Buckling
Figures 8 and 9 sh w the theoretical external energy required to buckle the tangent and 5-degree curved track with assumed parametes . This energy is cl arty zero at the uppe r buckling temperature ; hence, the track will buckle al ihi temperature. Buckling at the lower temperature require a finite amount of energy. The energy required to buckle the track drops significantly with increased curvature and with line defects. The figures also indicate a rapid decrease in energy required with an increase in rail temperature above the I wer buckling temperature.
BUCKLING SAFETY CONCEPTS
In order to assess buckling safety, temperature-deflection and temperature-buckling energy relation hips from the TS dynamic buckling m del are required. Buckling can be '"expl · ive (snap-through) or " progres ive ' (gradual displace
ments). F r explosive buck.Jing, distinct uppe~ and lower buckling tempera lure are identified (see points Tu ...... and To.min in Figure I) . For progre ive buckling, thee two point coalesce at an inflection point (a "knee ·on the curve). Thjs knee can be con trued t be a progre sive buckling temperature (TP)' becaus beyond thi value larger di placement occur.
Margin of Safety Definition and Buckling Response Classification
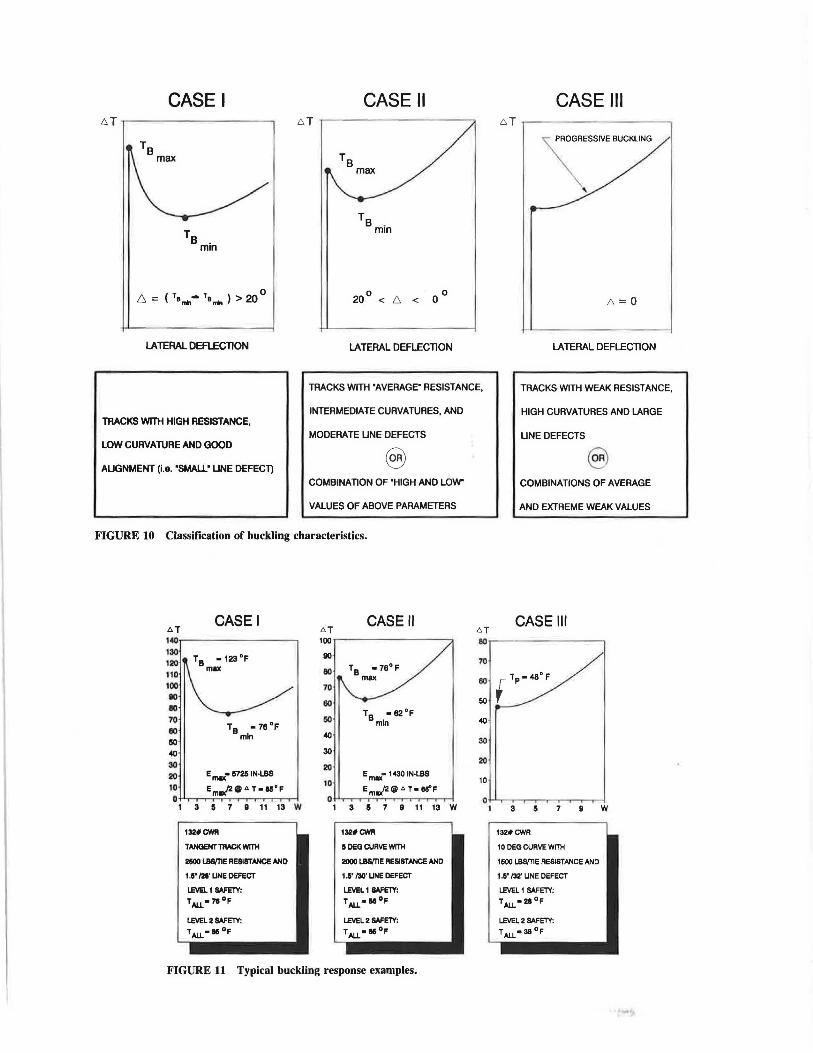
A di cu ·ed previ usly buckljng can occur at any temperature between Tn ....... and T0 ·'""" depending on the en rgy imparted to the track by the moving train. Defining 6 = T8 .,,,.,. - 7"0 ,11111,, it can be ·h wn that the buckling energy increa es as 6 increa ·e .. hence , 6 can b construed a a margin of safety against buckling. U ing this definition , the buckling re pon e characteristics can be classified into three ca e · a. shown in Figure 10:
• Case I represents tracks exhibiting a buckling response for which 6. > 20°F,
• ase II represents tracks exhibiting a buckling response for which 20°F > 6. > 0, and
• a e III represents tracks exhibiting a progressive buckling re ponse, 6. = 0.
Figure 11 how specific examples of the e re pcct ive characteri tics, including the en rgy required f r buckling at Tu.min (£,.,,..)and the temperatur above T0 _..,111 corre ponding to the 50 percent £ 11m• · For the xample hown , it take four tim the energy to buckle at T8 .m;n for Case I than for Case II. This becomes important in defining required levels of afety ba ed on low versu moderate risks of buckling potential.
Levels of Safety
Ba ed on previou di cu ion f buckling strength characteristics , analytic con ideralions, dynamic buckling test , and railroad indu try response, Figure 12 summarize buckling afety concepts based on two level of ·afety. The. e leve l f afety have been devised to provide a minimum (low) ri k

30 TRANSPORTATION RESEARCH RECORD 1289
6 T (0 F) so ~~~~~~~~~~~~~~~~~~~~~~~~~
70
60 --- ---50 -
--------\_ __ _ .;.-.""""
------------------ STATIC
40
30
20
10
7.5 Deg CURVE, 136 II RAIL
Fp = 88.9 lbnn; SLAG BALLAST K1 = 200 lbnnnn &0 = 1.351n; Lo = 16ft
LOADED HOPPER CAR
TRUCK CEfllTER SPACING = 506 in AXLE SPACING = 70 In
v = 32,875 lb Kv = 6000 psi
0 2 4 6 8 10 12
LATERAL DEFLECTION (inches)
FIGURE 7 Influence of vehicle load on buckling response.
CASEI 6 T ('F)
125
Ta 120 . mex
115 132#GWR
T ANGEfllT TRACK WTTH
105 2500 UlS/TlE RESIST ANGE AND
1.5" /'lil' UNE DEFECT
100
95
90
85
80
75 0 2 3 4 5
BUCKLING ENERGY (kip-in)
FIGURE 8 Buckling energy variation with temperature {tangent track).
6
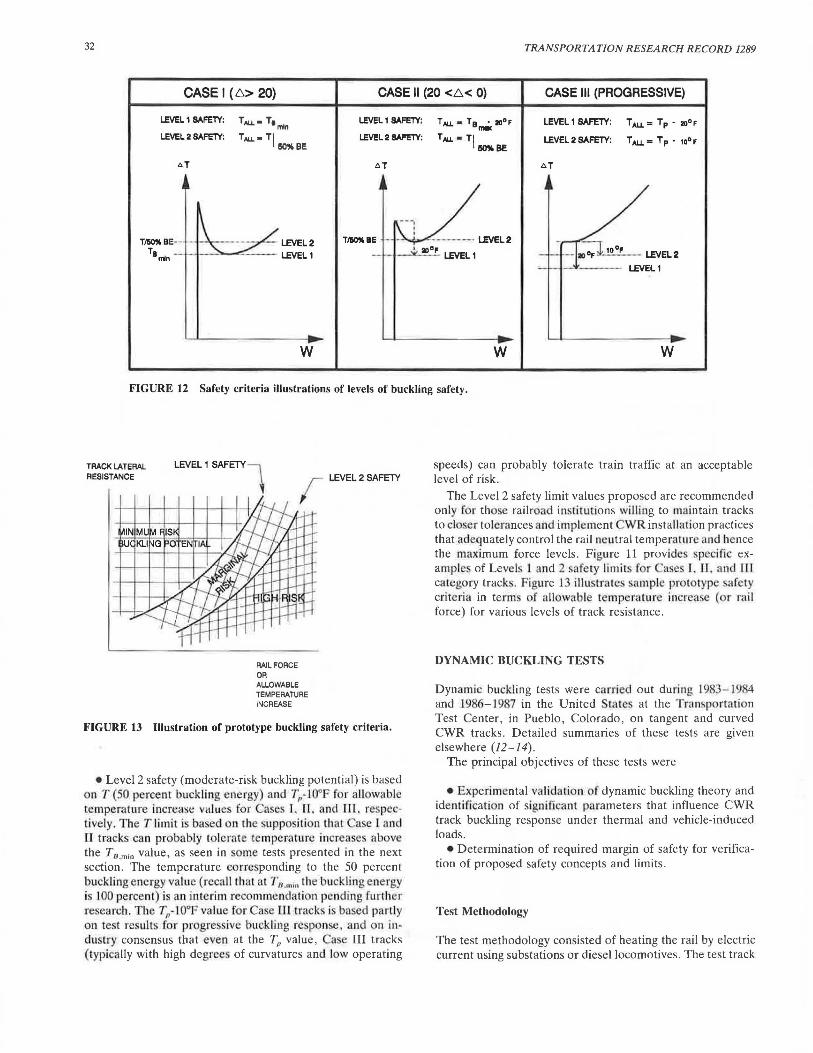
buckling potential and a marginal (moderate) risk buckling potential as illustrated in Figure 13:
• Level 1 safety (low-risk buckling potential) is based on T8 .n11n, T11 ... ,;n·20<>F and T,1-20°F for ases I. II, and I.II. repectively , for allowable temperature increase T u. • above
neutral. The Tu.min limit for ase f i justified by the typicall y hjgh buckling energies at this temperature and by the fact that the actual T8 ·"'"' values for a e I tracks tend to be higher than attained in most operating environments in the United States . The T8 .1"'1, -20°F limit is based on the moderate ly low buckling energie associated with Case II type tracks. The
CASE II 6 T ('F)
76 75 74 73 132#CWR
72 5 DEG CURVE wmt
71 2000 lBS/TlE RESISTANCE AND
70 1.5" fJl:t UNE DEFECT
69 68 67 66 65 64 63 62
0 0.2 0.4 0.6 0.8 1 1.2
BUCKLING ENERGY (kip-in)
FIGURE 9 Buckling energy var iation with temperature (curved track).
1.4
rationale for the 20°F safety margin is the need to account for some of the dynamic effects not included in the analysis . These iudude braking and traction forces, truck hunting forces, impact loads, and vibration-induced loss of track resistance. This 20°F safety margin also has some experimental basis, as shown in the next section . The TP-20°F limit for tracks with progressive characteristics (Case III) is based on the relatively small lateral displacements associated with this temperature, a requirement to limit mi alignment gr wth and lateral deflection to small values, and test result indicating that initiation of misalignment growth tends to occur approximately 20°F below the Tp value .
CASEI CASE II CASE Ill c,. T ~----------~ t> T ..-------------~ c,. T ..---- ---- -----,
- PROGRESSIVE BUCKLING
20° < 6 < 0 ° 6 =0
LATERAL DEFLECTION LATERAL DEFLECTION LATERAL DEFLECTION
TRACKS WITH 'AVERAGE' RESISTANCE, TRACKS WITH WEAK RESISTANCE,
TRACKS WITH HIGH RESISTANCE,
LOW CURVATURE AND GOOD
ALIGNMENT (i.e. 'SMALL' LINE DEFECT)
INTERMEDIATE CURVATURES, AND
MODERATE LINE DEFECTS
COMBINATION OF 'HIGH AND LOW'
VALUES OF ABOVE PARAMETERS
FIGURE 10 Classification of buckling characteristics.
CASEI AT 1401.---------~
130 120 110 100 80 80 70 eo 50 40 30 20 E..,.• 5725 IN-LBS
10 Em.,(20"T•85'F O t-'-.--.-.-..--.-.--.-.-..--......--.-.~
1 3 5 7 II 11 13 W
132•CWll
TANGENT TllM:K WITH
2500 l.B8/TIE RESISTANCE AND
1.5' m• UNEDEFECT
L.EVEL 1 SAFETY:
TAU •71°F
AT CASE II 100...--------~.
90
80
70
60
50
40
30
20
•76°F
E mi,,m 1 "30 IN-LBS 10
Em.,/2@"T•~F O i-'T....,...,r-r.-.-.-~-.--r-r-...-1
1 3 5 7 9 11 13 w
132•CWll
5 DEG CURVE WITH
2000 LBS/TIE RESISTANCE AND
U' /'MJ' UNE DEFECT
LEVEL 1 SAFETY:
TAU •N°F
LEVEL 2 SAFETY:
TAU•116°F
FIGURE 11 Typical buckling response examples.
HIGH CURVATURES AND LARGE
LINE DEFECTS
COMBINATIONS OF AVERAGE
AND EXTREME WEAK VALUES
AT CASE Ill
801.-- - ------,
40
20
10
0 .,........-,-,......,...-,.--~..--.-,.-1
1 3 5 7 9
132,,CWR
10 DEG CURVE WITH
1600 L.BS/TlE RESISTANCE AND
1.5" M' UNE DEFECT
L.EVEL 1 SAFETY:
TAU•28°F
w
32 TRANSPORTATION RESEARCH RECORD 1289
CASE I ( 6> 20) CASE II (20 <6.< 0) CASE Ill {PROGRESSIVE)
LEVEL 1 SAFETY: TAU.• T1 mln
LEVEL 2 SAFETY: TAU.. Tl 50%BE
LEVEL 1 SAFETY:
LEVEL 2 SAFETY:
LIT
-- -. I I
TALL . Tamoicao"F
TALL• Tl 50% BE
LEVEL 1 SAFETY:
LEVEL 2 SAFETY:
TAU.= T p • 20° F
TAU. .. T p • 10°F
T~BE
T9 min
T~l!IE - -""-t~'----- l.£VEL2 _,_,_ .... .J,_.ao~•"'"'~ LFIEL 1
w w w
FIGURE 12 Safety criteria illustrations of levels of buckling safety.
TRACK LATERAL RESISTANCE
LEVEL 1 SAFETY l ,
RAIL FORCE OR ALLOWABLE TEMPERATURE INCREASE
FIGURE 13 Illustration of prototype buckling safety criteria.
• Level 2 safety (moderate-risk buckling potential) is based on T (50 percent buck ling energy) and T11-J0°F for allowable temperature increase va lu.e f r e I, fl . and Ill. respec· Lively. The T limit is ba ed on rhc ·upposi ti n that ase r and n track can probably tolerat temperature increase . above the T8 .m;n value, as seen in ome tests presented in the next section. The temperature corre ponding to the 50 percent buckling energy value (recall that at T8 .111 ,,, the buckling energy is 100 percent) is an interi m recommendat ion pending furt her research. T be T
11-l0°F va lu for Ca ·e III trac k. is ba ·eel part ly
on test results for progressive buckling response, and on in· du try consensus that even at the Tp value, ase III tracks (typically with high degrees of curvatures and low operating
speeds) can probably tolerate train traffic at an acceptable level of risk.
The Level 2 safety limit values proposed are recommended only for those railr ad institutions willing to maintain tracks to cl ·er tolerances and implement WR installation practices that adequately control the rail neutral temperat ure and hence the maximum force levels. Figure 11 provides specific example. of Level. I and 2 safety li mits for Ca e · L, II , and 111 catego ry track . Figure l ill ustrates nmple prot type ·afety criteria in term of allowable temp -ratu re increase (or rail force) fur various levels of track resistance.
DYNAMIC BUCKLING TESTS
Dynamic buckling tests were carried out during 1983- 19 4 and 1986- 19 7 in the United ta t ' at the ransportation Test Center, in Pueblo, Colorado, on tangent and curved CWR tracks. Detailed summaries of these tests are given elsewhere (12-14).
The principal objectives of these tests were
• Experimental validation of dynamic buckling theory and identi ficati n of significant parameters that influence CWR track buckling response under thermal and vehicle-induced loads.
• Determination of required margin of safety for verification of proposed safety concepts and limits.
Test Methodology
The test methodology consisted of heating the rail by electric current using substations or diesel locomotives. The test track

Kish and Samavedam
lengths varied but were of the order of 1,000 ft to minimize end effects and obtain uniform rail force distribution in the central segment of the test zone. Lateral misalignments were set intentionally in the test track , and all other existing misalignments were mapped using a track geometry car or stringlining techniques. The tracks were destressed and instrumented with longitudinal rail force and vehicle wheel load gages as well as displacement transducers to measure longitudinal, lateral, and vertical movements of the rails. Thermocouples were used to measure rail temperature. Data loggers and strip chart recorders were employed to record data at frequent intervals. Track resistance was measured by both panel pull tests and STPTs. The number of cars in the test consist varied up to 70, depending on the tests.
Dynamic Buckling Theory Verification Tests
Comparison of Buckling Strength Under Hopper and Locomotive
To compare the relative influence of the central bending wave under a loaded 100-ton hopper and locomotive, equal levels of misalignment were set under each of the vehicles. Vertical and lateral displacements were measured as the rails were heated. Figure 14 shows a comparison of lateral displacements under each vehicle as a function of temperature. The misalignment growth under the hopper car is much more severe, indicating the influence of the longer uplift wave present under the 100-ton hopper car. The uplift wave is a contributing factor in the misalignment growth mechanism and hence a critical component of the dynamic buckling analysis. Subsequent dynamic tests and Figure 15 further confirm this uplift wave influence .
In another test, the measured response of the track with a large misalignment under a stationary hopper car favorably compared with the theoretical prediction (Figure 16). This test facilitated determination of lower buckling temperature and progressive buckling characteristics.
Comparison of Static and Dynamic Strengths of CWR
A weak 5-degree curved track was tested dynamically by a locomotive and hopper car at slow speeds. After an increase in temperature of up to 40°F above neutral and five train passes, initial misalignment did not increase. Train passes made at temperatures above 40°F increased the misalignment; at 62°F, the curve buckled to a deflection of 9 in., as shown in Figure 15. The buckling response was in agreement with the dynamic theory, but more important, these tests gave the first indication of a 10 to 20°F dynamic factor of safety requirement (i.e., at the buckling temperature of 62°F minus 10 to 20°F, track deflections were still very small).
Effect of Uplift Wave and LIV
In several tests the growth of imperfections under the passage of different cars was monitored using strip chart recorders. Figure 17 shows a typical result from the charts. The signif-
250
200
w ~ 150
!;;: a: w a... ~ 100 I-
50
33
LOCOMOTIVE
0'-'~~~--1.~~~-'-~~~-'-~~~-'-~~~-'
0 0.2 0.4 0.6 0.8 1.0 DEFLECTION - INCHES
FIGURE 14 Response of track under vehicles.
icant influence of the central bending wave of the hopper car can be seen. In contrast, the locomotive did not increase the deflection , which is in agreement with the theoretical predictions.
Safety Concept Validation
Safety concepts and limits were partially verified on tangent, 5-, and 7 .5-degree curved track as follows:
Tangent Track Tests (Tangents I and ll)
In Tangent I with a lateral resistance (peak) value of 69 .1 lb/ in. and in Tangent II with a peak value of 89 lb/in., train passes were made at incremental heating levels. Results are shown in Table 1. The conditions represent Case I type tracks as referred to previously. No significant movement occurred at Level 1 safety limits. At higher temperatures attained in the test, the increase in misalignment was small; however, the vehicles were not operated at maximum allowable speeds.
5-Degree Curve Tests (Curves I and l/)
Results for Curves I and II representing different peak resistance values are shown in Table 1. Again, the results are satisfactory from the Level 1 safety viewpoint. This is seen from the maximum temperatures reached in the test, which were in excess of the Level 1 temperatures.
7.5-Degree Curve
The objective in this test was not only to validate the Level 1 safety limit, but also to determine the ultimate buckling strength under a moving consist. The Level 1 safety limit of

34 TRANSPORTATION RESEARCH RECORD 1289
6 T (OF) 70 -,-~~~~~~~~~~~~~~~~~~~~~~~-~~~~,
60
50
40
30 5 DEG CURVE, 13611 RAIL
SLAG BALLAST
--------~THEORY
·(STATIC)
---
20 LINE DEFECT : 0.32 in/28 fl PEAK RESISTANCE : 68.2 lb/in
10
TEST TRAIN : LOCO + 100 TON HOPPER CAR A : THAIN PASSES 1-10
0 2 4 6 8 10
LATERAL DEFLECTION ·(indhes)
FIGURE 15 Dynamic buckling of curved track.
52°F was reached without causing significant increased misalignment due to vehicle ·passage. Analytical and experimental results are shown in Figure 18. At ·62°F above the stressfree temperature , •cumulative increased misalignment was ex;perienced under the passage of each car. This misalignment resulted in a total deflection of 4.5 in. under the 12th car in the ,final run of ;the 24-car consist , before derailment at another location in :the test zone stopped the test. Figures 19 and 20 present a view of the track and a derailed car. The test shows that :the track can withstand Level 1 safety limit temperatures, and that buckling occurred below Ta.mox and above T B .m;n·
CONCLUSIONS
• A versatile buckling model that can be run on a PC has been developed. The .new model overcomes the deficiencies in other models, namely, absence of vehicle load effects, inadequate idealization ofnonlinear lateral resistance, and lack of rational safety criteria. The model accounts for the loss of lateral resistance .caused .by a track uplift bending wave under vehicle loads. It also considers the softening behavior of the lateral resistance at large displacements, a phenomenon that has not been recognized in previous work. The model computes the energy required to precipitate buckling and thus

Kish and Samavedam
90 .------------------- -----.
80
70 CL g> 60 u ;u- 50 oc ::::> 40
~ w 30 · [I_
a5 20 I-
10
0 -
136# RAIL
TANGENT TRACK
PEAK RESISTANCE: 54.4 lb/in
LINE DEFECT: 5 ill/ 46 ft
• EXPERIMENT -THEORY
0 2 4 6 8 LATERAL DEFLECTION (inches)
FIGURE 16 Dynamic buckling test (tangent).
z 0 j::: ()
~U) LL UJ W I 0()
NEGATIVE DEFLECTION DUE TO LOCO (UV)
0.05" _J_
:Ci!~ 0.15"
•
10
35
evaluates the degree of safety of CWR at a given rail temperature.
• The model has been validated through several controlled, full-scale, dynamic buckling tests in which rails were artificially heated, and a long consist of cars made several passes at full speed over tracks with initial misalignments. Tangent, 5-, and 7 .5-degree curves were tested in the validation of the dynamic model. Static tests, which showed higher buckling strengths in the absence of train traffic, were also performed.
• Vehicle vertical loads create precession or recession and central uplift bending waves in the track. For cars with large truck center spacing (hopper) the central uplift wave is critical, whereas for smaller truck center spacing cars (locomotive) the precession wave has more significant influence on Q.uckling.
• In general, the growth of lateral misalignment under a vehicle is caused by a central bending wave rather than LIV. The influence of LIV can be significant for high impact loads and weak resistance tracks.
• The softening behavior of the lateral resistance is important in the analysis because it will have a significant influence on the lower buckling temperature. Idealizing the resistance as a constant at the peak value overestimates this temperature.
• The upper buckling temperature is sensitive to the peak value of the lateral resistance, the track misalignments, and the car parameters.
• Buckling safety limits are best approached on the basis of the energy levels required to buckle the track. Level 1 and 2 safety limits are introduced in this paper for low and moderate risks associated with track safety. The Level 1 limit has a margin of safety of at least 20°F, whereas Level 2 has a lower margin of safety. Level 1 safety limits have been verified for the tangent, 5-, and 7.5-degree curves through full-scale tests.
INCREMENT UNDER HOPPER CAR
0.04"
--r-0. 15" 0.19"
a: '--r------'------------------L--------~ UJ 5 INITIAL DEFLECTION BEFORE PASS
FINAL DEFLECTION AFTER PASS
FIGURE 17 Strip chart record for pass no. 8 (curve with finite margin of safety).

TABLE 1 SUMMARY OF SAFETY LIMIT TESTS
TANGENT/ PASS# 1 2 3 4 5 6 7 8
N = 48 6T(0F) 61 71 81 80 88 86 93 92
v = 20 P (kips) 157 182 208 207 228 222 239 237
&, (in.) 0.88 0.89 0.91 0.91 0.94 0.95 0.98 0.99
TANGENT// PASS# 1 2 3 4 5 6 7 8
N = '7 6T (OF) 70 76 83 82 85 95 100 100
v = 55 P (kips) 181 196 213 211 221 246 259 259
&, (in.) 0.81 0.83 0.86 0.87 0.78 0.79 0.81 0.82
CURVE/ PASS# 1 3 5 7 9 11 13 15 16 17
N = 63 6T (OF) 10 18.5 31 40 50 61 61 68 69 70
v = 20 P (kips) 25 48 81 104 129 158 157 175 179 180
&, (in.) 0.55 0.48 0.47 0.48 0.48 0.53 0.49 0.54 0.52 0.54
CURVE II PASS# 1 2 3 4 5 6 7
N = 52 6T (OF) 39 64 68 56 66 72 80
v = 20 P (kips) 101 165 176 148 170 186 205
&, (in.) 0.50 0.55 0.58 0.70 0.75 0.79 0.84
TEST TRACK Fp (lb/in) LEVEL 1 SAFETY LIMIT i'iTtest
TANGENT I 69.1 63 93
TANGENT II 80.0 65 100
CURVE I 83.7 59 70
CURVE II 100.0 60 80
N = Number of cars; V = Speed in mph; lb = Line defect amplitude; P = Rail force

60 -RUN #3 6T = 62°F - PROGRESSIVE BUCKLING
70 -
60 -
50
LEVEL 1 SAFETY : 6 T = 52 °F 40 -
RUN #2 6T = 48°F
30 -
RUN #1 6T = 32°F THEORY
-·-·· Fp= 1778#fTIE; l) 0 = 0.751NOiES 20 -
10
0 2 4 6 8 10 12
LATERAL DEFLECTION (inches) FIGURE 18 Dynamic buckling test analysis versus experiment.
FIGURE 19 Track condition after derailment. FIGURE 20 Last car derailed.

38
ACKNOWLEDGMENTS
The authors wish to thank D. Jeong and M. Thurston for the development of the dynamic buckling software on the PC.
REFERENCES
1. A . D . Kerr. Analysis of Thermal Track Buckling in the Lareral Plane. Report DOT/FRA/ORD-76/285. FRA, U.S. Department of Transportation, 1976.
2. G. Samilvedam. Buckling and Post Buckling Analyses of CWR in the Lateral Plane. Technical Note TN-TS-34. British Railways Board , London, 1979.
3. A. Kish , G. Samavedam, and D. Jeong. Analyses of Th ermal Buckling Tests on U.S. Railroads. Report DOT/FRA/ORD-82/ 45. FRA, U.S. Department of Transportation, 1982.
4. G. Samavedam, A. Kish, and D . Jeong. Parametric Studies on Lateral Stability of Welded Rail Track. Report DOT/FRA/ORD-83/07. FRA, U.S. Department of Transportation, 1983.
5. A. Kish, G. Samavedam, and D. Jeong. Jnfluence of Vehicle Induced Loads on the Lateral Stability of CWR Track. Report FRA/ORD-85-3. FRA, U.S. Department of Transportation , 1985.
6. F. Amans and R. Sauvage. Railway Track Stability in Relation
TRANSPORTATION RESEARCH RECORD 1289
to Transverse Stresses Exerted by Rolling Stock: A Theoretical Study of Track Behavior (in French) , Anna/es des Pon ts et Chaussees, No. 1, Jan .-Feb. 1969.
7. A . M. Zarembski and G. Magee . An investigation of Railroad Maintenance Practices to Prevent Track Buckling. AAR Report R-454. Association of American Railroads, Washington, D.C., 1980.
8. J . Nagy. Experimental Investigations on CWR Track Behavior Due to Thermally Induced Loads, V (in Hungarian), In Yearbook of the Hungarian Railway Scientific Research institute, 1970.
9. J . Nagy. Experimental Investigations on CWR Track Behavior Due to Thermally Induced Loads, VI (in Hungarian), In Yearbook of the Hungarian Railway Scientific Research Institute, 1974.
10. J. Eisenmann. The Significance of the Rail Lifting Wave. Rail International, No . 10, Oct. 1976, pp. 576-581.
11. G. Samavedam, A. Kish, M. Thurston, and D. Jeong. Recent Advances in Track Buckling Mechanics. Applied Mechanics Rail Transportation Symposium, AMD , Vol. 96, RTD , Vol. 2, 1988.
12. G . Samavedam, A . Kish, and D . Jeong. Experimental Investigations of Dynamic Buckling of CWR Tracks. Report DOT/FRA/ ORD-86/07. FRA, U.S. Department of Transportation, 1986.
13. A. Kish and G. Samavedam. Analyses of Phase Ill Dynamic Buckling Tests. Final Report DOT/FRA/ORD-89/08. FRA, U.S. Department of Transportation, 1989.
14. G. Samavedam and A. Kish. Dynamic Buckling Tes/ Analyses of a High Degree CWR Track. Report DOT/FRA/ORD-85/03. FRA, U.S. Department of Transportation, 1989.