
Dynamic Analysis of Two Area Interconnected Power...
12
51 International Journal of Control Theory and Applications Dynamic Analysis of Two Area Interconnected Power System with EHVAC-HVDC Tie-Lines using Optimal Regulator under Deregulated Environment K. Kirankumar, Mohammed Azahar Ahmed, G.Veeranna and B. Mothi Ram Asst. Professor, EEE Department, SRKREC, Bhimavaram, A.P, India, 534204 E-mails: [email protected]; [email protected]; [email protected]; [email protected] Abstract: This paper provides the investigation of mechanical generation control of two region interrelated power system functioning in deregulated environment. An EHVAC Tie-line parallel with HVDC Tie-line is considered as an interrelation among the two fields. Optimal regulator has been employed to further improve in dynamic system show with respect to settling time, peak amplitude and overshoot. A special market scenario along with bilateral transactions has been used to examine the dynamic system performance. Analysis reveal that optimal regulator along with HVDC tie-line is quite able in advancing the dynamic system performance. Keywords: AGC, EHVAC Tie-lines, HVDC Tie-lines, optimal regulator. 1. INTRODUCTION The electrical power trade has been ruled over years by huge utilities that has generally authority in Generatin, Transmission and Distribution such utilities often been referred to vertical integral utilities (VIU). This VIU served In the earlier day’s electrical power industry used to follow vertical integral utilities (VIU) structure. Due to vast increase in utilization of electricity the concept of VIU no longer exits. Electrical deregulation is the method of varying regulations to manage the electric industry to offer costumers electricity suppliers choice whether retailers or traders to permit competition [6]. Deregulation progress the production economic and electricity. Because of the cost competition in electricity which are probably to low down for the consumers benefits. In deregulated power system the independent power producers (IPP) are allowed to send the power through utility transmission and distribution. The major goals of the deregulated power markets [11]: • To offer electricity in all sensible demands • To enhance the competition in the generation and provide and the quality of service • To progress the supply continuity and the quality of service
Transcript of Dynamic Analysis of Two Area Interconnected Power...

51 International Journal of Control Theory and Applications
Dynamic Analysis of Two Area Interconnected Power System with EHVAC-HVDC Tie-Lines using Optimal Regulator...
Dynamic Analysis of Two Area Interconnected Power System withEHVAC-HVDC Tie-Lines using Optimal Regulator under DeregulatedEnvironment
K. Kirankumar, Mohammed Azahar Ahmed, G.Veeranna and B. Mothi Ram
Asst. Professor, EEE Department, SRKREC, Bhimavaram, A.P, India, 534204E-mails: [email protected]; [email protected]; [email protected]; [email protected]
Abstract: This paper provides the investigation of mechanical generation control of two region interrelated powersystem functioning in deregulated environment. An EHVAC Tie-line parallel with HVDC Tie-line is considered asan interrelation among the two fields. Optimal regulator has been employed to further improve in dynamic systemshow with respect to settling time, peak amplitude and overshoot. A special market scenario along with bilateraltransactions has been used to examine the dynamic system performance. Analysis reveal that optimal regulator alongwith HVDC tie-line is quite able in advancing the dynamic system performance.
Keywords: AGC, EHVAC Tie-lines, HVDC Tie-lines, optimal regulator.
1. INTRODUCTION
The electrical power trade has been ruled over years by huge utilities that has generally authority in Generatin,Transmission and Distribution such utilities often been referred to vertical integral utilities (VIU). This VIUserved In the earlier day’s electrical power industry used to follow vertical integral utilities (VIU) structure. Dueto vast increase in utilization of electricity the concept of VIU no longer exits. Electrical deregulation is themethod of varying regulations to manage the electric industry to offer costumers electricity suppliers choicewhether retailers or traders to permit competition [6]. Deregulation progress the production economic andelectricity. Because of the cost competition in electricity which are probably to low down for the consumersbenefits. In deregulated power system the independent power producers (IPP) are allowed to send the powerthrough utility transmission and distribution.
The major goals of the deregulated power markets [11]:
• To offer electricity in all sensible demands
• To enhance the competition in the generation and provide and the quality of service
• To progress the supply continuity and the quality of service

International Journal of Control Theory and Applications 52
K. Kirankumar, Mohammed Azahar Ahmed, G.Veeranna and B. Mothi Ram
• To encourage the efficiency and economy of the power system
The significant approach in deregulation is the competition. The competition is in two levels which arewhole sale generation and retail distribution. Under Deregulation power system industry has been divided intothree entities such as GENCOs (generation companies), TRANSCOs (transmission companies) and DISCOs(distribution companies). Each area having more than one GENCO and DISCO in deregulated environmentthere is a freedom provided for DISCO to have a contract with other GENCO in similar region or in someanother region of power transaction. Depending upon the demand a DISCO may contract with GENCO insimilar region or in other Area. DISCO having contact in other area is called Bilateral transactions [19]. Theadvantages related to deregulation are [3]
• System capacity will be employed effectively
• Optimization of energy supply will exists
• Consumer choice will improved
• Price of electricity will be clear
• Power flow will occurs from excess to scarcity areas.
2. AUTOMATIC GENERATION CONTROL
We know that power changes will takes place at loads for that we have to adjust the power output from multiplegenerators located at different areas. To adjust these generation output Automatic generation control is used.Power grid requires generation and load to be balanced frequency alterations to the generated outputs are essential.If frequency increases generating power is more than to be used this makes all machines in the system to accelerate.Decrease in frequency indicates more load is present on the system which makes all generators to deceleratethan the normal speed. As the grid having tie line connections between two areas automatic generating control[12] helps in maintaining the power interchanges over the tie-lines [2].
The major goal in the automatic generation control is
• To maintain frequency as close to specified range
To maintain changes in tie-line power to zero value.
The fundamental control problem approach of a system is to accomplish the particular objectivesfor the meant system functioning in restrictions by physical and scientific restraints. The usualtraditional control systems, mainly on the basis of frequency domain analysis, are preserved for lineartime invariant single input-single output systems permits the designer greater freedom in instinct andknowledge. The modern control theory pertain the time domain concept in problem formation known as statespace concept.
3. DYNAMIC POWER SYSTEM MODELS
The following configurations are recognized for power system model [5]:
• EHVAC tie-line is utilized as a system interconnection (PM-I).
• EHVAC link in parallel with HVDC link [9] is employed as a system interconnection (PM-II).
In PM-I Two areas are interconnected with EHVAC tie-lines and dynamic performance is studied byconsidering different market transactions [7]. In PM-II Two areas are interconnected with EHVAC parallel withHVDC tie-lines and dynamic performance is studied.

53 International Journal of Control Theory and Applications
Dynamic Analysis of Two Area Interconnected Power System with EHVAC-HVDC Tie-Lines using Optimal Regulator...
4. DISCO PARTICIPATION MATRIX
In the deregulated situation [4], GENCOs trade power to several DISCOs at spirited costs. Hence, DISCOsselect the GENCOs for contracts. There are multiple contracts combinations among DISCOs and GENCOs areexpediently envisaged by ‘Disco Participation Matrix’ (DPM) approach. The DPM matrix rows correspond toGENCOs and columns to DISCOs which contract power. The entire matrix is as of DISCOs total load (columns)contracted with all GENCO (row). The entire entries sum in columns in a matrix is unity. In a two area systemDPM will have the following structure:
11 12 13 14
21 22 23 24
31 32 33 34
41 42 43 11
cpf cpf cpf cpf
cpf cpf cpf cpfDPM
cpf cpf cpf cpf
cpf cpf cpf cpf
� �� �� ��� �� �� �
Where cpfid refers to “Contract Participation Factor of jthGENCO in supplying the load of dth DISCO. TheDPM block diagonals keep up a correspondence with local demands. Off diagonal blocks communicate to theDISCOs demands in one region to the GENCOs in another region. DPM shows the DISCO participation incontract with other GENCO. Hence it is called “DISCO PARTICPATION MATRIX”. Suppose that DISCO3
demands 0.1 pu MW powers, out of which 0.025 pu MW is demanded from GENCO1, 0.03 pu MW fromGENCO2, 0.035 pu MW from GENCO3 and 0.01 pu MW from GENCO4. Then column 3 entries in (1) areeasily defined as
13
0.0250.25,
0.1cpf � � 23
0.030.3,
0.1cpf � � 3 3
0 .0 3 50 .3 5 ,
0 .1cp f � � 43
0.010.1
0.1cpf � �
Other 'cpf s are defined similarly to get the whole DPM. It is noted that 1ijicpf ��
Block Diagram Formation
Figure 1: Dynamic Power system model with AC tie-lines
5. DISCO PARTICIPATION MATRIX
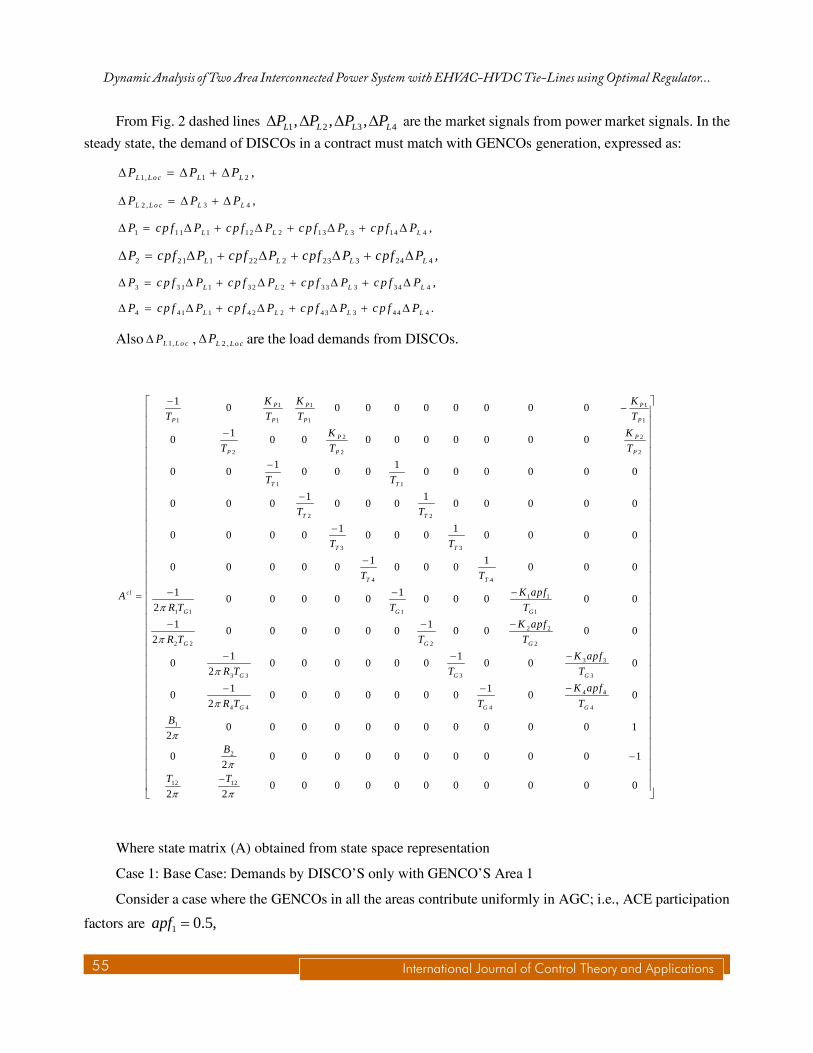
The closed loop system in Fig. 2 is characterized in state space form as
,cl clX A x B u Y C x Du� � � ��

International Journal of Control Theory and Applications 54
K. Kirankumar, Mohammed Azahar Ahmed, G.Veeranna and B. Mothi Ram
Where X is the state vector, u is the vector of power demands of the Discos, Y is the output vector. Acl is thesystem matrix and Bcl is the input distribution matrix are constructed from state space equations.
State vector:
1 2 1 2 3 4 1 2 3 4 1 2 1 2[ ]TG G G G M M M M tie DCX P P P P P P P P ACE ACE P P�� �� �� � � � � � � � � � � � ��
Control vector:
1 2 3 4[ ]TL L L LU P P P P� � � � �
Each element in state vector matrix represents the output of each block in the transfer function model.Control vector represents the demands of the corresponding DISCOs in the two areas respectively.
In this model ,the expressions for actual and scheduled steady-state power flows on the tie-line are given as
1 2 , ( o f D IS C O s in a re a II f ro m G E N C O s in a r e a I )
( o f D IS C O s in a r e a I f ro m G E N C O s in a r e a II )t ie sc h e d u ledP d e m a n d
d e m a n d�� �
�
2 4 4 2
12,1 3 3 1
tie schedul ij L ij Lji j i j
P cpf P cpf P� � � �
� � � � ��� ��
� �1212, 1 2
2tie actual
TP f f
s
�� � � � �
The tie-line power error 12,( )errorPtie� is defined by
12, 12, 12,tie error tie actual tie scheduledP P P� � � � �
The area control errors (ACEs) in a deregulated power system in both areas are defined as [10]
1 1 1 12, 2 2 2 12 12,;error errorACE B f Ptie ACE B f Ptie� � �� � � � � �
Figure 2: Dynamic Model of Two area Interconnected power systems with EHVAC tie lines
55 International Journal of Control Theory and Applications
Dynamic Analysis of Two Area Interconnected Power System with EHVAC-HVDC Tie-Lines using Optimal Regulator...
From Fig. 2 dashed lines 1 2 3 4, , ,L L L LP P P P� � � � are the market signals from power market signals. In the
steady state, the demand of DISCOs in a contract must match with GENCOs generation, expressed as:
1, 1 2 ,L L o c L LP P P� � � � �
2 , 3 4 ,L L o c L LP P P� � � � �
1 1 1 1 1 2 2 1 3 3 14 4 ,L L L LP cp f P c p f P c p f P c p f P� � � � � � � � �
2 21 1 22 2 23 3 24 4 ,L L L LP cpf P cpf P cpf P cpf P� � � � � � � � �
3 3 1 1 3 2 2 3 3 3 3 4 4 ,L L L LP c p f P cp f P c p f P c p f P� � � � � � � � �
4 4 1 1 4 2 2 4 3 3 4 4 4 .L L L LP cp f P cp f P c p f P c p f P� � � � � � � � �
Also 1,L L o cP� , 2 ,L Lo cP� are the load demands from DISCOs.
1 1 1
1 1 1 1
2 2
2 2 2
1 1
2 2
3 3
4 4
1 1
1 1 1 1
2 2 2
10 0 0 0 0 0 0 0 0
10 0 0 0 0 0 0 0 0 0
1 10 0 0 0 0 0 0 0 0 0 0
1 10 0 0 0 0 0 0 0 0 0 0
1 10 0 0 0 0 0 0 0 0 0 0
1 10 0 0 0 0 0 0 0 0 0 0
1 10 0 0 0 0 0 0 0 0 0
2
1 10 0 0 0 0 0 0 0
2
P P P
P P P P
P P
P P P
T T
T T
T T
T T
cl
G G G
G G
K K K
T T T T
K K
T T T
T T
T T
T T
T T
K apfAR T T T
R T T
�
�
��
�
�
�
�
�
�� ��
� � 2 2
2
3 3
3 3 3 3
4 4
4 4 4 4
1
2
12 12
0 0
1 10 0 0 0 0 0 0 0 0 0
2
1 10 0 0 0 0 0 0 0 0 0
2
0 0 0 0 0 0 0 0 0 0 0 12
0 0 0 0 0 0 0 0 0 0 0 12
0 0 0 0 0 0 0 0 0 0 02 2
G
G G G
G G G
K apf
T
K apf
R T T T
K apf
R T T T
B
B
T T
�
�
�
�
� �
� �� �� �� �� �� �� �� �� �� �� �� �� �� �� �� �� �� �� �� �� �� ��� �� �� ��� ���� �� �������� ��� ��� �
�������������
Where state matrix (A) obtained from state space representation
Case 1: Base Case: Demands by DISCO’S only with GENCO’S Area 1
Consider a case where the GENCOs in all the areas contribute uniformly in AGC; i.e., ACE participation
factors are 1 0.5,apf �
International Journal of Control Theory and Applications 56
K. Kirankumar, Mohammed Azahar Ahmed, G.Veeranna and B. Mothi Ram
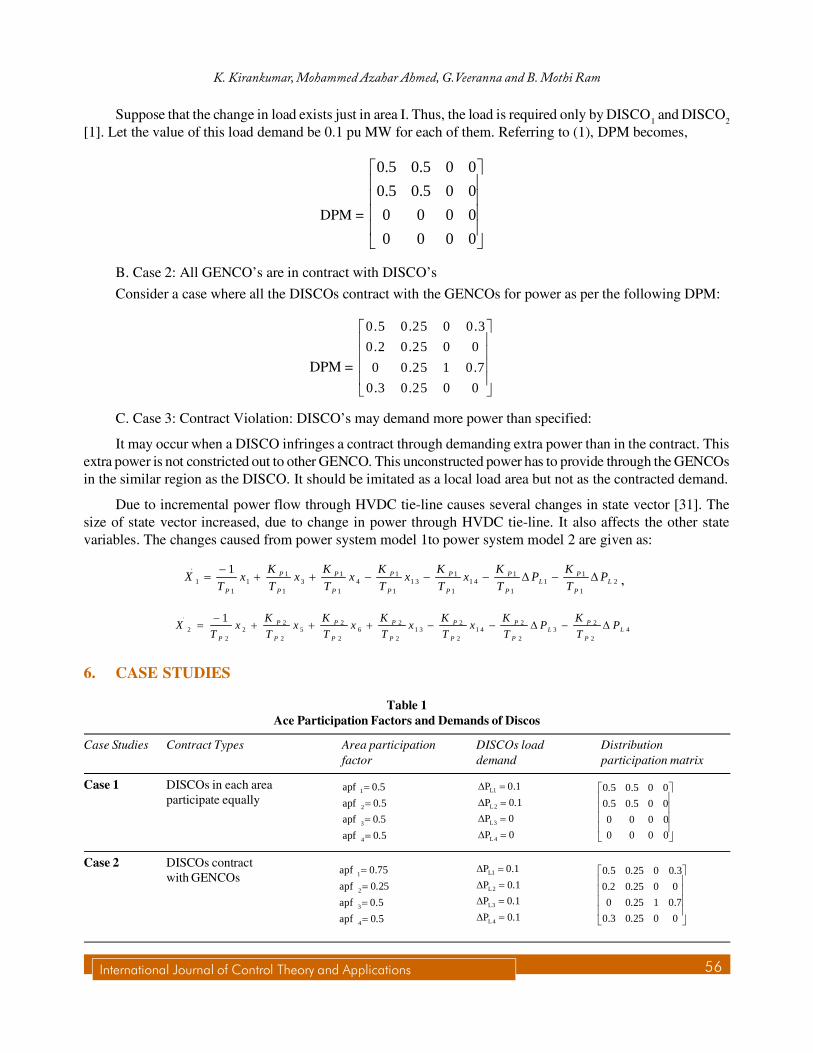
Suppose that the change in load exists just in area I. Thus, the load is required only by DISCO1 and DISCO2
[1]. Let the value of this load demand be 0.1 pu MW for each of them. Referring to (1), DPM becomes,
DPM =
0.5 0.5 0 0
0.5 0.5 0 0
0 0 0 0
0 0 0 0
� �� �� �� �� �� �
B. Case 2: All GENCO’s are in contract with DISCO’s
Consider a case where all the DISCOs contract with the GENCOs for power as per the following DPM:
DPM =
0.5 0.25 0 0.3
0.2 0.25 0 0
0 0.25 1 0.7
0.3 0.25 0 0
� �� �� �� �� �� �
C. Case 3: Contract Violation: DISCO’s may demand more power than specified:
It may occur when a DISCO infringes a contract through demanding extra power than in the contract. Thisextra power is not constricted out to other GENCO. This unconstructed power has to provide through the GENCOsin the similar region as the DISCO. It should be imitated as a local load area but not as the contracted demand.
Due to incremental power flow through HVDC tie-line causes several changes in state vector [31]. Thesize of state vector increased, due to change in power through HVDC tie-line. It also affects the other statevariables. The changes caused from power system model 1to power system model 2 are given as:
.1 1 1 1 1 1
1 1 3 4 1 3 1 4 1 21 1 1 1 1 1 1
1 P P P P P PL L
P P P P P P P
K K K K K KX x x x x x P P
T T T T T T T
�� � � � � � � � � ,
.2 2 2 2 2 2
2 2 5 6 1 3 1 4 3 42 2 2 2 2 2 2
1 P P P P P PL L
P P P P P P P
K K K K K KX x x x x x P P
T T T T T T T
�� � � � � � � � �
6. CASE STUDIES
Table 1Ace Participation Factors and Demands of Discos
Case Studies Contract Types Area participation DISCOs load Distributionfactor demand participation matrix
Case 1 DISCOs in each areaparticipate equally
Case 2 DISCOs contractwith GENCOs
1
2
3
4
apf 0.5
apf 0.5
apf 0.5
apf 0.5
�
��
�
L1
L2
L3
L4
P 0.1
P 0.1
P 0
P 0
� �
� �� �
� �
0.5 0.5 0 0
0.5 0.5 0 0
0 0 0 0
0 0 0 0
� �� �� �� �� �� �
1
2
3
4
apf 0.75
apf 0.25
apf 0.5
apf 0.5
����
L1
L2
L3
L4
P 0.1
P 0.1
P 0.1
P 0.1
� �
� �� �
� �
0.5 0.25 0 0.3
0.2 0.25 0 0
0 0.25 1 0.7
0.3 0.25 0 0
� �� �� �� �� �� �
57 International Journal of Control Theory and Applications
Dynamic Analysis of Two Area Interconnected Power System with EHVAC-HVDC Tie-Lines using Optimal Regulator...
Case 3 Contract violation ofDISCO by demandingmore power
7. DESIGN OF OPTIMAL REGULATOR
The optimal control theory is alarmed with working dynamic system at low cost. The holder where the dynamicssystem is need through linear differential equations sets and the cost is explained through a quadratic task iscalled the Linear Quadratic issue. The major outcomes offered are by Linear Quadratic Regulators (LQR).Traditionally, AGC [8] is concerned to start with the frequency control of a power system through the flywheelsynchronous machine governor. While this system was consequently established to be inadequate, an additionalcontrol was attached with a signal to the governor proportional to the frequency deviation and it’s integral. Forpower system the aim and execution of AGC regulators with hydro turbines proposes scientific complexitybecause of greater time constants related to hydropower plants. The examinations showed that concerningincremental dc power flow in AGC approach as a control variable is verified to be an efficient in progressingpower system dynamic improvement and attaining the AGC goals.
The fundamental control problem approach of a system is to accomplish the particular objectives for themeant system functioning in restrictions by physical and scientific restraints. The usual traditional control systems,mainly on the basis of frequency domain analysis [18], are preserved for linear time invariant single input-singleoutput systems permits the designer greater freedom in instinct and knowledge. The modern control theorypertain the time domain concept in problem formation known as state space concept
This concept has been suitable in real time execution using digital computers and few minimum variablesset which are necessary to complete the internal system status. The regulator plan through optimal control theoryallows the designers to encompass optimum system design regarding known performance condition. The significantaspects in modern control are the organization of logical index performance and its optimization creates thesystem control more significant in optimality sense.
The continuous time-invariant system dynamic model in the state variable form is given as
X A X BU� ��
Y = C X + D U
The control signal U is such that it minimizes the performance index (I):
0
1[ ]
2T TI X Q X U RU dx
�� ��
In the application of optimal control theory, the term in X� is eliminated by redefining the states andcontrols in terms of their steady-state values occurring after the disturbance. Equation below can be written as:
0, (0)X AX BU X X� � �� �
Moreover X� , Y will stay the same. With a full state vector feedback control problem
* *U X� ��
In the application of optimal control theory, the term Pd� in Eq. above is removed by redefining the states
and controls in terms of their steady-state values occurring after the disturbance.
1
2
3
4
apf 0.75
apf 0.25
apf 0.5
apf 0.5
��
�
�
L1
L2
L3
L4
P 0.2
P 0.1
P 0.1
P 0.1
� �� �
� �
� �
0.5 0.25 0 0.3
0.2 0.25 0 0
0 0.25 1 0.7
0.3 0.25 0 0
� �� �� �� �� �� �

International Journal of Control Theory and Applications 58
K. Kirankumar, Mohammed Azahar Ahmed, G.Veeranna and B. Mothi Ram
Which minimizes the cost function given by Eq above .Forthe infinite time problem, the application ofPontryagin’s minimum principle results in the following matrix Riccati equation?
1 0T TP A A P P B R B P Q�� � � �
The solution of Eq.above gives a positive definite symmetric matrix P, and the optimal control is given by:
1* TU R B P X�� �
The desired optimal feedback gain matrix is given by:
1* TR B P�� �
8. RESULTS COMPARISON FOR DIFFERENT CASE STUDIES
a) Case 1: Base case:
b) Case 2:

59 International Journal of Control Theory and Applications
Dynamic Analysis of Two Area Interconnected Power System with EHVAC-HVDC Tie-Lines using Optimal Regulator...
c) Case 3:
9. ANALYSIS OF RESULTS
a) Case:1
Change in frequency in Area 1
DYNAMIC PARAMETERS MODEL1 MODEL 2 OPTIMALREGULATOR
Settling time 30.8 32.5 27.6Peak Amplitude -0.325 -0.211 -0.0848Over shoot (%) 4.64e+15 -1.8e+15 -2.7e+15Change in frequency in Area 2Settling time 30.8 32.5 27.6Peak Amplitude -0.325 -0.211 -0.0848Over shoot (%) 4.64e+15 -1.8e+15 -2.7e+15Change in Tie-line powerSettling time 35.1 33.7 56.9Peak Amplitude 0.0287 -0.00869 -0.000247Over shoot (%) -4.23e+14 8.21e+14 -7.95e+12
b) Case:2
Change in frequency in Area 1
DYNAMIC PARAMETERS MODEL 1 MODEL 2 OPTIMALREGULATOR
Settling time 30 45.7 48.6Peak Amplitude -0.476 0.394 -0.104Over shoot (%) 7.02e+15 2.07e+15 9.96e+14Change in frequency in Area 2Settling time 33.1 45.7 42.4Peak Amplitude -0.269 0.527 -0.102Over shoot (%) 1.41e+16 4.37e+15 -1.48e+14Change in Tie-line powerSettling time 31.8 42.9 44.1Peak Amplitude -0.0893 -0.0719 ————Over shoot (%) 8.43e+15 3e+015 ————

International Journal of Control Theory and Applications 60
K. Kirankumar, Mohammed Azahar Ahmed, G.Veeranna and B. Mothi Ram
c) Case:3
Change in frequency in Area 1
DYNAMIC PARAMETERS MODEL 1 MODEL 2 OPTIMALREGULATOR
Settling time 27.4 45.9 45.1
Peak Amplitude -0.706 0.56 -0.145
Over shoot (%) 7.75e+15 1.13e+15 -1.43e+15
Change in frequency in Area 2
Settling time 35.5 46 41.1
Peak Amplitude 0.314 0.762 -0.112
Over shoot (%) -2.9e+15 -9e+15 -8.69e+15
Change in Tie-line power
Settling time 31.4 42.7 43.8
Peak Amplitude -0.134 -0.114 >=0.04
Over shoot (%) -67.2 42.1 0.0327
10. CONCLUSION
In all the case studies the settling time of PM-I less than the PM-II but the peak over shoot and under shoot is lesswith HVDC tie line combination. With optimal regulator the oscillations are reduced but tie line response takesmore time to settle, but a smooth response can be obtained with optimal regulator. In order to improve theresponse in spite of HVDC tie line a FACT device can be kept in series with tie line, hence the response can settleat least time and overshoot can be reduced. The oscillation’s and peak over shoot is more with only EHVAC tieline. With contract violation case the tie line oscillations are more with regulator. The responses generallydepend upon cpf’s and apf’s.The dynamic response characteristics such as settling time, peak amplitude andovershoots are obtained by state space representation technique. The dynamic characteristics are less with optimalregulator but more in case where the GENCOS violates the contract. With HVDC tie-line the peak amplitude isreduced. The patter of eigenvalue analysis shows the system is stable irrespective of additional HVDC tie line inparallel with AC tie-line.
11. DISCUSSIONS
In the case 1 the change in frequency in area 1, the settling time of optimal AGC regulator [13] is lesscompared to model 1 and model 2 at the same time peak amplitude and overshoot percentage is less for theoptimal AGC regulator only. In the case 1 area 2, the settling time is less for model 1 and peak amplitude isless for optimal AGC regulator and over shoot percentage is less for model 2. In the case 1 tie line, the settlingtime is more with optimal regulator compared to model 1 and model 2 but the peak amplitude is less foroptimal regulator compared to model 1 and model 2. In the case 2, the settling time is less for model 1compared with model 2 and AGC regulator but the peak amplitude is less with optimal regulator comparedwith model 1 and model 2. In case 2 area 2the settling time is less for model 1 and peak amplitude is less foroptimal regulator In case 2 tie line ,the settling time and overshoot percentage is less for model 1 comparedwith model 2 and AGC regulator In case 3 area 1the settling time is less but the overshoot percentage is morewith model 1 but overshoot percentage is less with model 2. In case 3 area 2the overshoot percentage is lesswith model 1 compared with model 2 and AGC regulator. In case 3 tie line powers the settling time is less withmodel 1 but the overshoot percentage is more, with optimal regulator the overshoot percentage is less but thesettling time is more.

61 International Journal of Control Theory and Applications
Dynamic Analysis of Two Area Interconnected Power System with EHVAC-HVDC Tie-Lines using Optimal Regulator...
12. APPENDIX
(a) System parameters
KP1 = 120.048, TP1=20.008, TG1 = TG2= 0.08 s, TT1= TT2 =0.3,
B1= B2= 0.425 Pu Mw/Hz, R1= R2 = 2.4 Hz/Pu MW, 12 1�� � �(b) HVDC link parameters: K dC =1.0, T dc=0.5sec.
REFERENCES
[1] MD. Azahar, M.K.Patan, “Automatic Generation Control of interconnected with TCSC and FLC under deregulatedenvironment” IJERO, volume 3, issue 6, pg. no 535-541, ISSN 2321-7758, 2015.
[2] Ibraheem, Kumar, P., and Kothari, D. P., “Recent philosophies of automatic generation control strategies in power systems,”IEEE Trans Power Syst., Vol. 20, No. 1, pp. 346–357, Februrary 2005.
[3] Donde,V., Pai, M.A., and Hiskens, I. A., “Simulation and optimization in a AGC system after deregulation,” IEEE Trans.Power Syst., Vol. 16, No. 3, pp. 481–489, 2001.
[4] Rakhashani, E., and Sadeh, J., “A reduced order estimate or with prescribed degree of stability for two area LFC system ina deregulated environment,” IEEE Conference and Exposition (PSCE-2009), pp.1–8,Seattle, WA, 15–18 March 2009.
[5] Ibraheem, Kumar, P., and Ahmad, S., “Dynamic performance enhancement of hydro-power systems with asynchronoustie-lines,” J. Institut. Eng.(India), Vol. 85, pp. 2334, June 2004.
[6] Sheble, G. B., Computational Auction Mechanisms for Restructured Power Industry Operation, Boston: Kluwer AcademicPublishers, 1999.
[7] Kumar, P., and Ibraheem, “Dynamic performance evaluation of 2-area interconnected power systems: A comparativestudy,” J. Institut. Eng. (India), Vol. EL-4, No.78, pp. 199–209, 1997.
[8] Optimal Automatic Generation Control (AGC) Dispatching and Its Control Performance Analysis for the DistributionSystems with DGsLin Chen, Jin Zhong, Member, IEEE, and Deqiang Gan.
[9] Automatic Generation Control in Multi Area Interconnected Power System by using HVDC Links, (IJPEDS)Vol.2, No.1,March 2012, pp. 67~75, Yogendra Arya, Naredra Kumar, Hitesh Dutt Mathur.
[10] Bevarani, H., Mitani, Y., and Tsuji, K., “Robust LFC in a deregulated environment: Multi-objective control approach,”IEEJ Trans . Power Syst., Vol. 124, No. 12, pp. 1409–1416, 2004.
[11] Tyagi, B., and Srivastava, S. C., “Automatic generation control formulti-area system in a deregulate delectricity market,”International Conference on Bulk Power Transmission System Integration In Developing Countries, CIGRERegionalMeeting2001, pp.VIII-18–VIII-29, New Delhi, India, 8–10 November 2001.
[12] “Automatic generation control in a deregulated power system,” IEEE Trans. Power Syst., Vol. 13, No. 4, pp. 1401–1406,1998.
[13] Optimal AGC of Deregulated Interconnected Power System with Parallel Ac/Dc Link, International Journal of ModernEngineering Research (IJMER), Vol.2, Issue.4, July-Aug 2012 pp-2789-2794, Naimul Hasan.
[14] De Tuglie, E., “Load following control scheme for deregulated energy markets,” IEEE Trans.Power Syst., Vol. 21, No. 4,pp. 1691–1698, 2006.
[15] Nobile, E., Bose, A., and Tomsovic, K., “Feasibility of a bilateral market for load following,” IEEE Trans. Power Syst.,Vol. 16, No. 3, pp. 481–489, 2001.
[16] Tyagi, B., and Srivastava, S. C., “Automatic generation control for multi-area system in a deregulated electricity market,”International Conference on Bulk Power Transmission System Integration In Developing Countries, CIGRE RegionalMeeting 2001, pp. VIII-18–VIII-29, New Delhi, India, 8–10 November 2001.
[17] Kumar, J., Hoe, N. G., and Sheble, G., “LFC simulator for price-based operation, Part I: A model,” IEEE Trans. PowerSyst., Vol. 12, No. 2, pp. 527–532, 1997.

International Journal of Control Theory and Applications 62
K. Kirankumar, Mohammed Azahar Ahmed, G.Veeranna and B. Mothi Ram
[18] Christie, R. D., and Bose, A., “Load frequency control issues in power system operations after deregulation,” IEEE Trans.Power Syst., Vol. 11, No. 3, pp. 1192–1200, 1996.
[19] Noble, A.Bose, and Tomsovic, “Bilateral market for load following ancillary services,” in Proc. PES summer power meeting,Seattle, WA, July 15-21, 2000.
[20] AGC Simulator for Price-Based Operation Part 1: A Model, IEEE Transactions on Power Systems, Vol. 12, No. 2, May1997, Jayant Kumar Kah-Hoe Ng Gerald Sheblt.


![The Coordination Issues of Relocations? How Proximity Still … · 2017. 5. 5. · Kirankumar [2004]; Athreye, [2005]…). At the analytical level, the lack of micro-economic analyses](https://static.fdocuments.in/doc/165x107/5ff4cd7590f9f046cc601b08/the-coordination-issues-of-relocations-how-proximity-still-2017-5-5-kirankumar.jpg)


![Wireless Weather Monitoring System using Adruino DUE and ... · [2]Kirankumar G. Sutar, “Low Cost Wireless Weather Monitoring System.” This survey discuss, the use of many sensors](https://static.fdocuments.in/doc/165x107/5e7021216dac4a31f253c3a2/wireless-weather-monitoring-system-using-adruino-due-and-2kirankumar-g-sutar.jpg)


![UMASS ECE Field Degree Baby Guard Final Project Review Report · Yun Shi, Kirankumar Bhusanurmath ... 1) Product A- Wireless Baby Monitor (Vvcare-851) [5], monitors temperature, but](https://static.fdocuments.in/doc/165x107/601c180e48ffff56c3506256/umass-ece-field-degree-baby-guard-final-project-review-yun-shi-kirankumar-bhusanurmath.jpg)
