Dyer Chapter04
20
Cost Advantage 04
Transcript of Dyer Chapter04
Cost Advantage
04

[ 67 ]
© travelib envilronment / Alamy
Studying this chapter should provide you with the knowledge to:
1 Differentiate between economies of scale and scope and describe how both produce cost advantages.
2 Describe what an experience curve is and how it can be used to make effective business decisions.
3 Discuss sources of lower input costs and how they provide the basis of a cost advantage strategy.
4 Explain two changes in a firm’s business model that can enable a cost advantage strategy.
L E A R N I N G O B J E C T I V E S
[ 68 ]
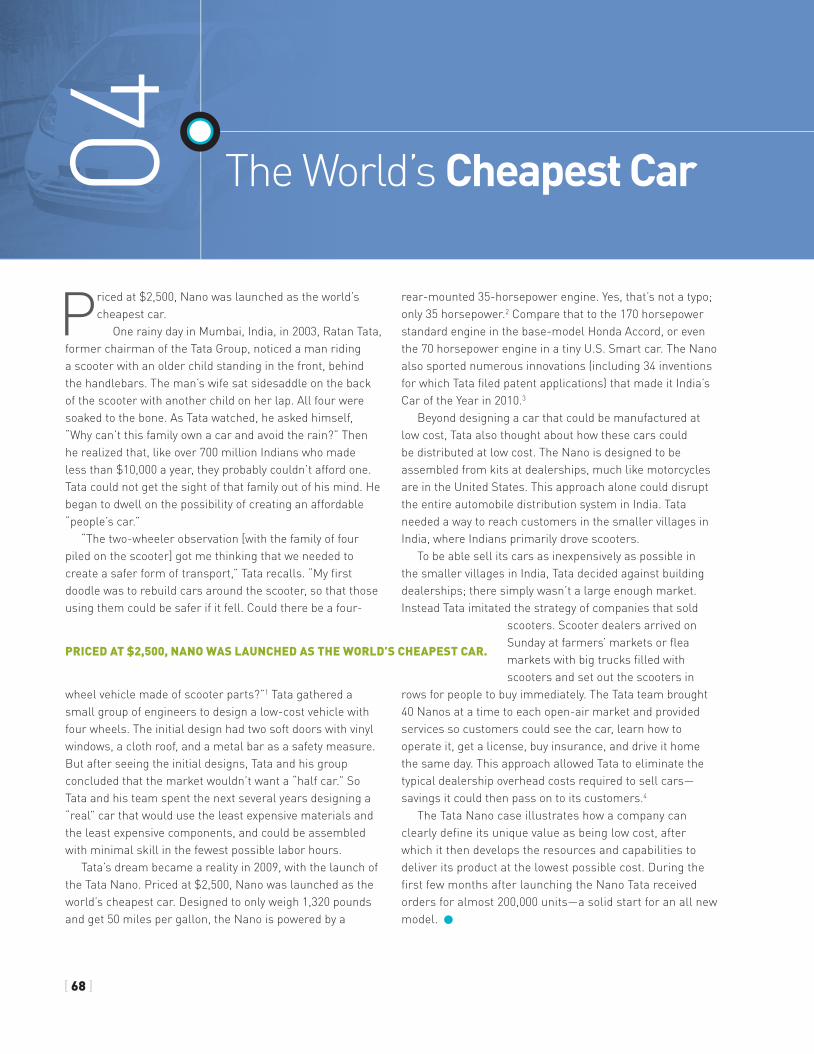
Priced at $2,500, Nano was launched as the world’s cheapest car.
One rainy day in Mumbai, India, in 2003, Ratan tata, former chairman of the tata Group, noticed a man riding a scooter with an older child standing in the front, behind the handlebars. the man’s wife sat sidesaddle on the back of the scooter with another child on her lap. All four were soaked to the bone. As tata watched, he asked himself, “Why can’t this family own a car and avoid the rain?” then he realized that, like over 700 million Indians who made less than $10,000 a year, they probably couldn’t afford one. tata could not get the sight of that family out of his mind. He began to dwell on the possibility of creating an affordable “people’s car.”
“the two-wheeler observation [with the family of four piled on the scooter] got me thinking that we needed to create a safer form of transport,” tata recalls. “My first doodle was to rebuild cars around the scooter, so that those using them could be safer if it fell. Could there be a four-
wheel vehicle made of scooter parts?”1 tata gathered a small group of engineers to design a low-cost vehicle with four wheels. the initial design had two soft doors with vinyl windows, a cloth roof, and a metal bar as a safety measure. But after seeing the initial designs, tata and his group concluded that the market wouldn’t want a “half car.” So tata and his team spent the next several years designing a “real” car that would use the least expensive materials and the least expensive components, and could be assembled with minimal skill in the fewest possible labor hours.
tata’s dream became a reality in 2009, with the launch of the tata Nano. Priced at $2,500, Nano was launched as the world’s cheapest car. Designed to only weigh 1,320 pounds and get 50 miles per gallon, the Nano is powered by a
rear-mounted 35-horsepower engine. Yes, that’s not a typo; only 35 horsepower.2 Compare that to the 170 horsepower standard engine in the base-model Honda Accord, or even the 70 horsepower engine in a tiny U.S. Smart car. the Nano also sported numerous innovations (including 34 inventions for which tata filed patent applications) that made it India’s Car of the Year in 2010.3
Beyond designing a car that could be manufactured at low cost, tata also thought about how these cars could be distributed at low cost. the Nano is designed to be assembled from kits at dealerships, much like motorcycles are in the United States. this approach alone could disrupt the entire automobile distribution system in India. tata needed a way to reach customers in the smaller villages in India, where Indians primarily drove scooters.
to be able sell its cars as inexpensively as possible in the smaller villages in India, tata decided against building dealerships; there simply wasn’t a large enough market. Instead tata imitated the strategy of companies that sold
scooters. Scooter dealers arrived on Sunday at farmers’ markets or flea markets with big trucks filled with scooters and set out the scooters in
rows for people to buy immediately. the tata team brought 40 Nanos at a time to each open-air market and provided services so customers could see the car, learn how to operate it, get a license, buy insurance, and drive it home the same day. this approach allowed tata to eliminate the typical dealership overhead costs required to sell cars—savings it could then pass on to its customers.4
the tata Nano case illustrates how a company can clearly define its unique value as being low cost, after which it then develops the resources and capabilities to deliver its product at the lowest possible cost. During the first few months after launching the Nano tata received orders for almost 200,000 units—a solid start for an all new model. •
the World’s Cheapest Car 04
priCeD aT $2,500, NaNo Was lauNCHeD as THe WorlD’s CHeapesT Car.
ECONOMIES OF SCALE AND SCOPE [ 69 ]
Companies typically choose between one of two “generic” strategies for offering unique value to customers: cost advantage or differentiation advantage (the focus of Chapter 5). By designing cars to be manufactured at the lowest cost possible, and by designing a distribution system to get the cars to customers at the lowest cost possible, Tata has a cost advantage over every other car-maker in India, which allows it to sell the Nano at the lowest price. Like Tata, a firm that chooses a cost advantage strategy wins with customers by reducing its prices below all of its competitors, thereby allowing it to gain market share. Alternatively, a firm with a cost advantage may choose the same price as competitors, which results in greater profits rather than higher market share.
Adopting a cost advantage strategy does not mean that the company focuses on cost to the exclusion of everything else. Having a single-minded focus on making a low-cost prod-uct or service can result in an offering that no one wants to buy. Although Tata wins with customers primarily because it sells a car that is cheaper than competitor offerings, it must still worry about producing a car that works and is at least somewhat reliable. In fact, some of the early Nanos caught fire, which scared off many buyers until Tata fixed the problem by beefing up the heat shield in the exhaust system.
However, a company that wins by providing low-cost products or services must focus most of its resources and capabilities on keeping its costs as low as possible. In this chapter, we’ll explore the five potential sources of cost advantage summarized in Table 4.1: econ-omies of scale or scope, learning or experience effects, proprietary know-how, lower-cost inputs, and using a different business model.
[ Table 4.1 ] Sources of Cost Advantage
Economies of Scale or Scope
Greater unit volume allows firms to have lower costs by:• spreading fixed costs across more units
• specialization of equipment and people
Learning and Experience
Greater cumulative volume drives cost differences due to greater learning and experience within companies with more cumulative experience in production.
Proprietary Knowledge
Some companies develop proprietary knowledge in the production of their product or service, which leads to a cost advantage.
Input Costs
Some companies may have lower input costs than others due to:• greater bargaining power over suppliers or labor
• superior cooperation with suppliers (including lower transaction costs)
• sourcing from low-cost locations (e.g., country comparative advantage)
• preferred access to inputs
Different Business Model
Eliminating activities or steps in the value chain or using a different set of activities altogether may allow a firm to deliver a product or service at lower cost.
ECONOMIES OF SCALE AND SCOPE
One of the primary reasons large companies dominate many manufacturing and service industries is because of economies of scale. Economies of scale exist when an increase in company size (measured as volume of production) lowers the company’s average cost per unit produced.5 For example, if Tata can sell a volume of 100,000 cars instead of 10,000 cars, the cost to produce each car will fall as the total volume or scale of production increases. When there are significant economies of scale in manufacturing, research and development, marketing, distribution, or service, large firms have a cost advantage over smaller firms.
economies of scale A reduction in costs per unit due to increases in efficiency of production as the number of goods being produced increases.
[ 70 ] CH04 • COSt ADvANtAGE
Economies of scale arise from four principle sources: the ability to spread fixed costs of production, the ability to spread nonproduction costs, specialization of equipment, and specialization of people.
Ability to Spread Fixed Costs of ProductionHigh volumes of production enable firms to spread the fixed cost of production, the costs of plant and equipment, thereby lowering their cost per unit. A simple way to think about this is to imagine two roommates who decide to share the $3,000 cost of purchasing a big-screen TV. In this case, the cost per roommate is $1,500. If, however, another roommate joins in on the purchase, the cost per roommate will decrease to $1,000, because there are now three room-mates. If there were five roommates, the cost would drop still more, to $600 per roommate. The more roommates over which to spread the cost of the TV, the lower the cost per roommate.
In similar fashion, companies can spread the costs of their plant and equipment when they have more customers to share the cost. For example, it might cost a company $1 mil-lion to purchase equipment and a plant with the capacity to produce one thousand units of a particular product; but it might cost that company only $2 million to build a plant with the capacity to produce five thousand units. This happens because, in many activities, increases in output do not require proportionate increases in input. For example, building an auto plant that can produce 100,000 cars does not cost Tata five times the cost of a 20,000-car plant. The larger plant would typically only cost two to three times as much as the smaller one.6
Ability to Spread Nonproduction CostsHigh volumes of production also enable firms to spread the cost of nonproduction functions across more units, thereby lowering the cost per unit. Large volumes enable companies to spread the cost of research and development (R&D), advertising, and general and administrative expenses.
Research and Development. Firms that incur high R&D expenses—such as in the pharmaceutical industry—have a strong incentive to expand operations globally to as many customers as possible. Once a pharmaceutical company has made the R&D investment to develop a new drug, those costs essentially become a fixed cost to spread across as many consumers as possible. In fact, some research has shown that the best predictor of whether an industry is global (meaning that firms in the industry expand to compete on a global basis) is the company’s R&D costs as a percentage of sales. The higher a firm’s R&D costs as a percentage of sales, the more incentive the firm has to expand globally to spread those costs across more customers.7
Advertising. In similar fashion, advertising is also subject to economies of scale. The fixed cost of putting an advertisement in the local city newspaper is the same for a grocery chain with one store in a particular market as it is for a chain with three stores in the same market. By spreading the advertising cost across three stores, the larger chain will have one-third the advertising costs per store, with the same level of advertising.
General and Administrative Costs. General and administrative costs (G&A) include the costs of accounting, finance, human resource management, and the chief executive and her staff. A company with high sales volume can spread its G&A costs across more units, thereby creating a cost advantage. Walmart’s general and administrative costs are only about 0.5 percent of sales, for example. This is a much lower proportion than its competitor Sears Holding Company, which has G&A costs of roughly 2 percent of sales.8 Walmart actually spends, on an absolute basis, more than three times as much on G&A as Sears Holding Company does. It is because Walmart’s sales volume is 10 times greater that G&A is much smaller as a percentage of its sales.9
Specialization of Machines and EquipmentCompanies with large volumes are also able to produce at low cost because they can invest in specialized machines and equipment. A firm that has high volumes of production is often able to purchase and use specialized equipment or tools that small firms simply cannot afford, due to their lower production volumes. For example, in the ball bearing industry, the lowest-cost way to produce fewer than 100 rings is to do it on general-purpose lathes. Producing between 100 and 1
fixed cost of production Costs such as plant and equipment, which are relatively fixed, meaning that they do not increase with an increase in the number of units produced.
general and administrative costs (G&A) Expenses and taxes that are directly related to the general operation of the company, and executive salaries, general support, and taxes related to the overall administration of the company.
ECONOMIES OF SCALE AND SCOPE [ 71 ]
million rings is done most efficiently with a specialized screw machine. Companies that produce more than 1 million rings can afford to purchase an even more specialized high-speed, continu-ous-process machine that further lowers the cost per unit. As volumes increase, firms have the ability to use specialized (often automated) machines to do work at lower cost per unit.10
Specialization of Tasks and PeopleHigh volumes of production also permit greater task specialization, thereby leading to greater employee specialization.
Task Specialization. When work tasks are specialized, workers can become more and more efficient at the particular task and avoid the loss of time that occurs from workers switching between jobs. For example, Henry Ford’s big breakthrough in the mass production in automobiles involved breaking down the production process into a series of separate tasks that could be performed by highly trained and specialized workers. Some workers specialized on design, others on specific parts, and others on testing.
Employee Specialization. Employees who specialize in accomplishing a particular task, such as accounting, legal, or tax work, often bring high levels of skills to their tasks. The value of employee specialization occurs not just in manufacturing environments, but also in knowledge industries such as management consulting, investment banking, and the legal profession, where specialization of labor permits larger firms to offer a wider range and depth of expertise to potential clients.
Smaller firms often do not have the volume necessary to justify high levels of employee specialization—and when they do hire specialized employees, there might not be enough work to keep them busy all of the time. This is why small firms are more likely to have employees who are required to perform multiple business functions and why they often outsource to subcontractors specialized work, such as accounting, legal, or taxes.
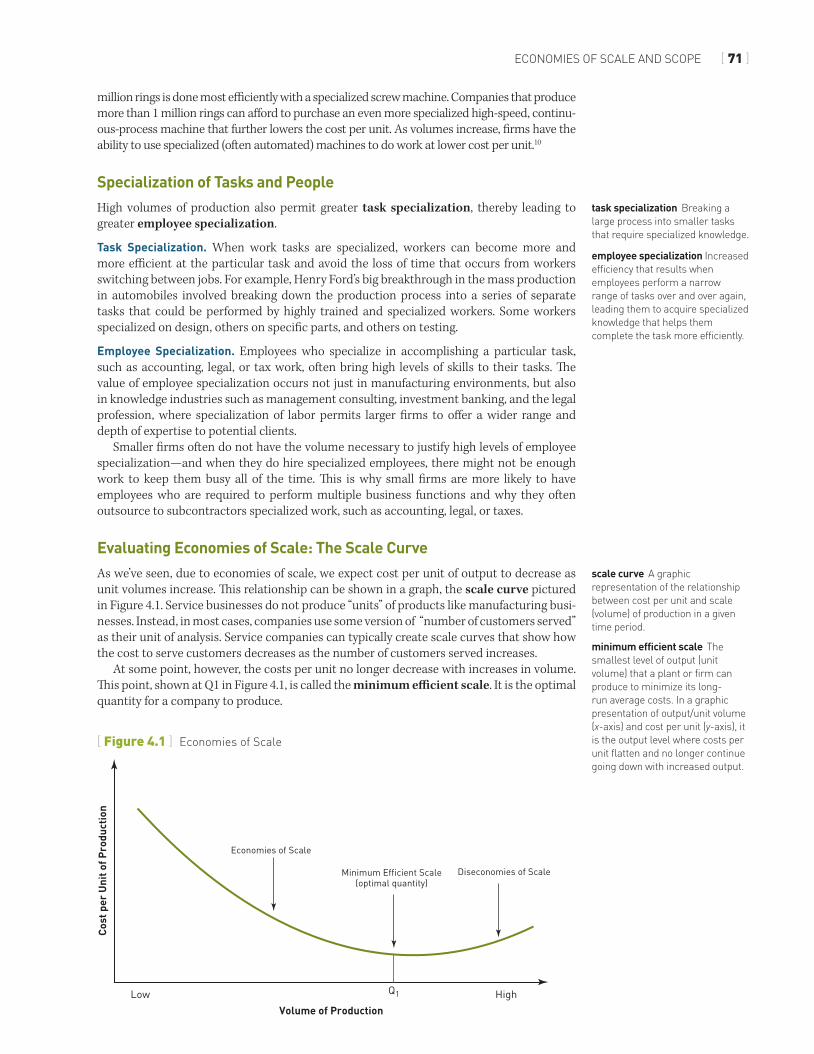
Evaluating Economies of Scale: The Scale CurveAs we’ve seen, due to economies of scale, we expect cost per unit of output to decrease as unit volumes increase. This relationship can be shown in a graph, the scale curve pictured in Figure 4.1. Service businesses do not produce “units” of products like manufacturing busi-nesses. Instead, in most cases, companies use some version of “number of customers served” as their unit of analysis. Service companies can typically create scale curves that show how the cost to serve customers decreases as the number of customers served increases.
At some point, however, the costs per unit no longer decrease with increases in volume. This point, shown at Q1 in Figure 4.1, is called the minimum efficient scale. It is the optimal quantity for a company to produce.
task specialization Breaking a large process into smaller tasks that require specialized knowledge.
employee specialization Increased efficiency that results when employees perform a narrow range of tasks over and over again, leading them to acquire specialized knowledge that helps them complete the task more efficiently.
scale curve A graphic representation of the relationship between cost per unit and scale (volume) of production in a given time period.
minimum efficient scale the smallest level of output (unit volume) that a plant or firm can produce to minimize its long-run average costs. In a graphic presentation of output/unit volume (x-axis) and cost per unit (y-axis), it is the output level where costs per unit flatten and no longer continue going down with increased output.
Low
Economies of Scale
Minimum Efficient Scale(optimal quantity)
Diseconomies of Scale
High
Volume of Production
Cost
per
Uni
t of P
rodu
ctio
n
Q1
[ Figure 4.1 ] Economies of Scale
[ 72 ] CH04 • COSt ADvANtAGE
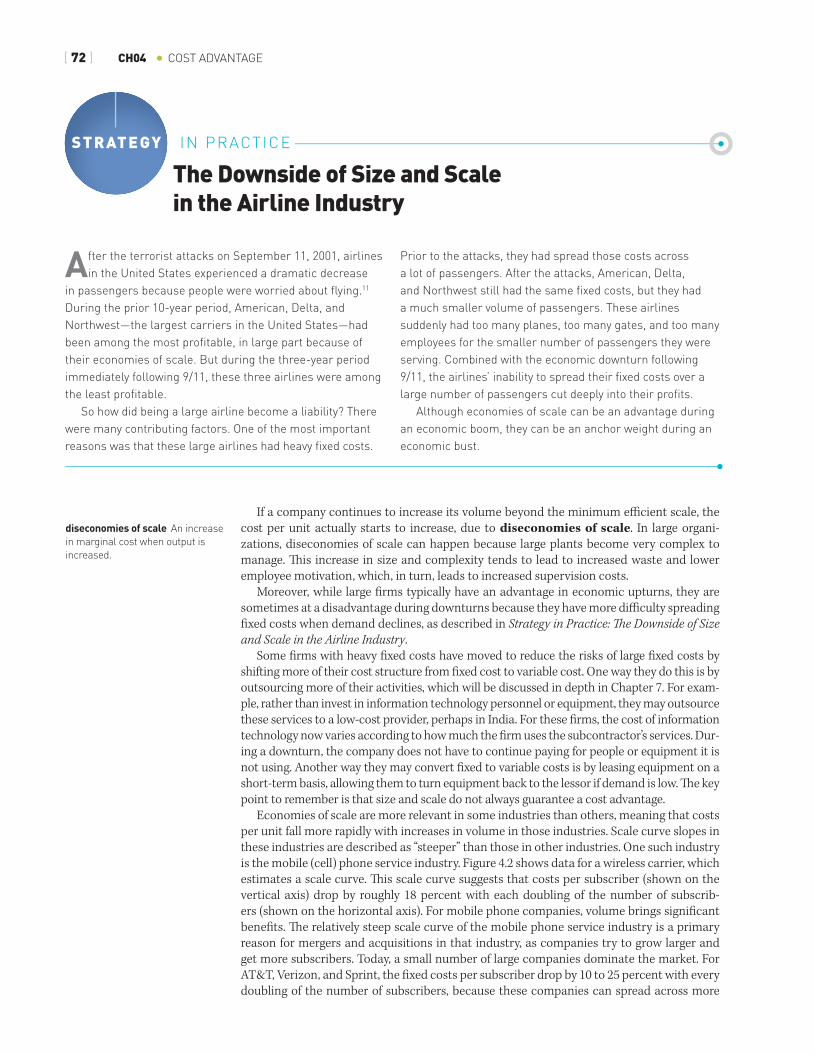
The Downside of size and scale in the airline industry
sTraTeGY IN PRACtICE
If a company continues to increase its volume beyond the minimum effi cient scale, the cost per unit actually starts to increase, due to diseconomies of scale. In large organi-zations, diseconomies of scale can happen because large plants become very complex to manage. Th is increase in size and complexity tends to lead to increased waste and lower employee motivation, which, in turn, leads to increased supervision costs.
Moreover, while large fi rms typically have an advantage in economic upturns, they are sometimes at a disadvantage during downturns because they have more diffi culty spreading fi xed costs when demand declines, as described in Strategy in Practice: Th e Downside of Size and Scale in the Airline Industry.
Some fi rms with heavy fi xed costs have moved to reduce the risks of large fi xed costs by shifting more of their cost structure from fi xed cost to variable cost. One way they do this is by outsourcing more of their activities, which will be discussed in depth in Chapter 7. For exam-ple, rather than invest in information technology personnel or equipment, they may outsource these services to a low-cost provider, perhaps in India. For these fi rms, the cost of information technology now varies according to how much the fi rm uses the subcontractor’s services. Dur-ing a downturn, the company does not have to continue paying for people or equipment it is not using. Another way they may convert fi xed to variable costs is by leasing equipment on a short-term basis, allowing them to turn equipment back to the lessor if demand is low. Th e key point to remember is that size and scale do not always guarantee a cost advantage.
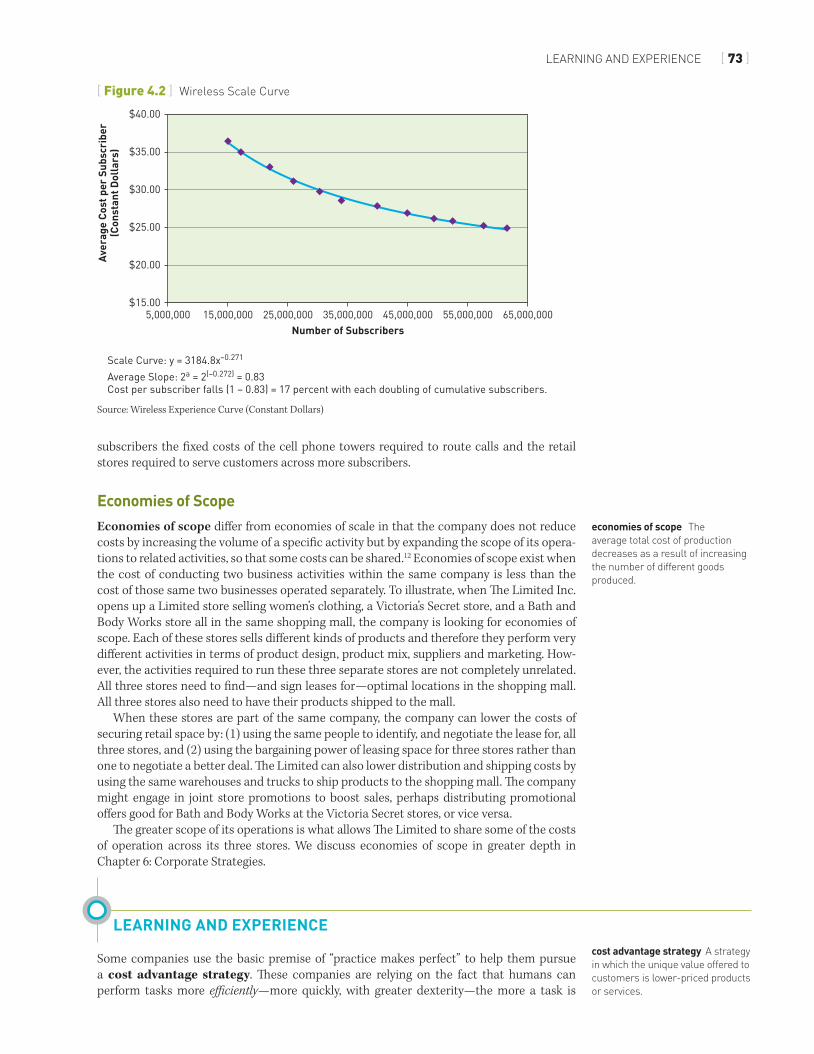
Economies of scale are more relevant in some industries than others, meaning that costs per unit fall more rapidly with increases in volume in those industries. Scale curve slopes in these industries are described as “steeper” than those in other industries. One such industry is the mobile (cell) phone service industry. Figure 4.2 shows data for a wireless carrier, which estimates a scale curve. Th is scale curve suggests that costs per subscriber (shown on the vertical axis) drop by roughly 18 percent with each doubling of the number of subscrib-ers (shown on the horizontal axis). For mobile phone companies, volume brings signifi cant benefi ts. Th e relatively steep scale curve of the mobile phone service industry is a primary reason for mergers and acquisitions in that industry, as companies try to grow larger and get more subscribers. Today, a small number of large companies dominate the market. For AT&T, Verizon, and Sprint, the fi xed costs per subscriber drop by 10 to 25 percent with every doubling of the number of subscribers, because these companies can spread across more
diseconomies of scale An increase in marginal cost when output is increased.
After the terrorist attacks on September 11, 2001, airlines in the United States experienced a dramatic decrease
in passengers because people were worried about flying.11 During the prior 10-year period, American, Delta, and Northwest—the largest carriers in the United States—had been among the most profitable, in large part because of their economies of scale. But during the three-year period immediately following 9/11, these three airlines were among the least profitable.
So how did being a large airline become a liability? there were many contributing factors. One of the most important reasons was that these large airlines had heavy fixed costs.
Prior to the attacks, they had spread those costs across a lot of passengers. After the attacks, American, Delta, and Northwest still had the same fixed costs, but they had a much smaller volume of passengers. these airlines suddenly had too many planes, too many gates, and too many employees for the smaller number of passengers they were serving. Combined with the economic downturn following 9/11, the airlines’ inability to spread their fixed costs over a large number of passengers cut deeply into their profits.
Although economies of scale can be an advantage during an economic boom, they can be an anchor weight during an economic bust.
LEARNING AND EXPERIENCE [ 73 ]
subscribers the fixed costs of the cell phone towers required to route calls and the retail stores required to serve customers across more subscribers.
Economies of ScopeEconomies of scope differ from economies of scale in that the company does not reduce costs by increasing the volume of a specific activity but by expanding the scope of its opera-tions to related activities, so that some costs can be shared.12 Economies of scope exist when the cost of conducting two business activities within the same company is less than the cost of those same two businesses operated separately. To illustrate, when The Limited Inc. opens up a Limited store selling women’s clothing, a Victoria’s Secret store, and a Bath and Body Works store all in the same shopping mall, the company is looking for economies of scope. Each of these stores sells different kinds of products and therefore they perform very different activities in terms of product design, product mix, suppliers and marketing. How-ever, the activities required to run these three separate stores are not completely unrelated. All three stores need to find—and sign leases for—optimal locations in the shopping mall. All three stores also need to have their products shipped to the mall.
When these stores are part of the same company, the company can lower the costs of securing retail space by: (1) using the same people to identify, and negotiate the lease for, all three stores, and (2) using the bargaining power of leasing space for three stores rather than one to negotiate a better deal. The Limited can also lower distribution and shipping costs by using the same warehouses and trucks to ship products to the shopping mall. The company might engage in joint store promotions to boost sales, perhaps distributing promotional offers good for Bath and Body Works at the Victoria Secret stores, or vice versa.
The greater scope of its operations is what allows The Limited to share some of the costs of operation across its three stores. We discuss economies of scope in greater depth in Chapter 6: Corporate Strategies.
LEARNING AND EXPERIENCE
Some companies use the basic premise of “practice makes perfect” to help them pursue a cost advantage strategy. These companies are relying on the fact that humans can perform tasks more efficiently—more quickly, with greater dexterity—the more a task is
economies of scope the average total cost of production decreases as a result of increasing the number of different goods produced.
cost advantage strategy A strategy in which the unique value offered to customers is lower-priced products or services.
5,000,000$15.00
$20.00
$25.00
$30.00
Aver
age
Cost
per
Sub
scri
ber
(Con
stan
t Dol
lars
) $35.00
$40.00
15,000,000 25,000,000 35,000,000Number of Subscribers
Scale Curve: y = 3184.8x–0.271
Average Slope: 2a = 2(–0.272) = 0.83Cost per subscriber falls (1 – 0.83) = 17 percent with each doubling of cumulative subscribers.
45,000,000 55,000,000 65,000,000
[ Figure 4.2 ] Wireless Scale Curve
Source: Wireless Experience Curve (Constant Dollars)
[ 74 ] CH04 • COSt ADvANtAGE
repeated. Doing a task a lot of times also often helps people become more effective, that is, they find better ways to complete the task. Researchers and strategists measure the effects of learning and experience using the learning curve and the experience curve.
The Learning CurveThe learning curve is a tool that managers can use to determine the contribution of human learning on the part of employees to reductions in costs per unit. During World War II, researchers first noticed that labor costs per unit decrease with an increase in cumulative output. The researchers studied an aircraft manufacturing firm. They calcu-lated that the number of labor hours required to build each aircraft fell by roughly 20 per-cent each time the cumulative volume of production doubled.13 Since that initial discovery, a similar pattern has been found in many other industries, including the manufacture of ships, computers, and TVs.14
Learning curve advantages are also relevant in service industries such as accounting, consulting, legal services, and even personal services like hair styling. As an accountant completes a greater number of tax returns, she learns how to do it more quickly. The same can be said for a lawyer who repeatedly handles divorces or hair stylists repeatedly giving clients a particular hairstyle.
The learning curve is more complex than a scale curve to calculate because it requires gathering data on the cumulative volume of a given product or service produced, the total amount since the company started making the product or providing the service. In con-trast, the scale curve, described earlier in this chapter, shows how costs per unit change with increases of volume of production during a given time period, such as a quarter, half-year, or year. It is easier for companies to obtain cost information from specific time periods.
The Experience CurveIn 1968, the Boston Consulting Group (BCG) generalized the concept of the learning curve to encompass not just direct labor hours but all costs incurred to produce a product or ser-vice.15 BCG conducted a series of studies on a variety of products and services ranging from bottle caps to refrigerators to long-distance telephone calls, and they found that costs per unit (and prices) fall in a predictable way with increases in cumulative volume. Costs drop with increases in cumulative volume due to a combination of factors, including economies of scale, but also due to learning.
The experience curve shows how costs per unit change with increases in cumulative volume produced. Like the learning curve, calculating an experience curve requires cumula-tive volume data. An experience curve does a better job of capturing learning effects than a scale curve, because it is based on cumulative volume, like the learning curve. But, it also does a better job of capturing the effects of economies of scale than a learning curve does, because it includes all costs, not just labor. However, if data from the same time period are used to calculate a scale curve and experience curve, both analyses produce the same result. For detailed instructions on how to calculate a scale or experience curve using Microsoft Excel, see the Strategy Tool at the end of the chapter.
Like scale curves, experience curves are applicable to service, as well as manufactur-ing, industries. Recall that, for service industries, the unit of analysis is generally “number of people served.” For example, the authors of this book consulted with a bank that was providing credit card services (a store-brand credit card) to Fry’s Electronics, a retail chain that competes with Best Buy. The bank was trying to decide whether to invest more money in marketing to convince more of Fry’s customers to apply for, and use, a Fry’s credit card. Our question to the company was: How much do your costs decrease as you add credit card subscribers? What is the slope of your experience curve? By understanding how much costs would decrease if the company doubled their number of credit card subscribers, the company would know how much they could afford to spend in marketing to get additional customers.
learning curve the concept that labor costs per unit decrease with increases in volume due to learning. New skills or knowledge can be quickly acquired initially, but subsequent learning becomes much slower.
experience curve A representation of the relationship between cumulative volume and product cost.
LEARNING AND EXPERIENCE [ 75 ]
Since BCG’s early studies, literally hundreds of studies have shown that production costs usually decline by 10 to 30 percent with each doubling of cumulative output. All of this research is summarized in the law of experience:
The cost per unit of a standard product or service declines by a constant percentage (typically between 10 and 30 percent) each time cumulative output doubles.16
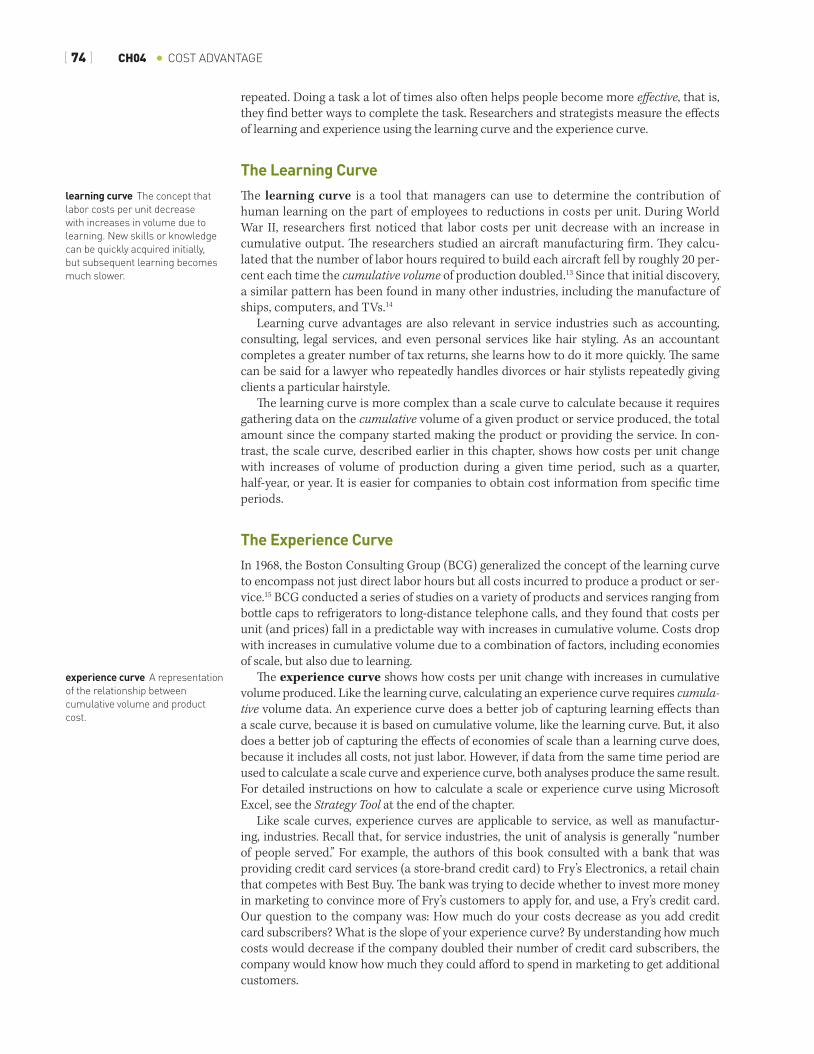
Although the law of experience is phrased in terms of cost reductions, the slope of an experience curve is described according to the percentage of costs that remain after dou-bling cumulative volume, rather than by the reduction in costs. For example, Figure 4.3 shows an 80 percent experience curve slope for semiconductors. This means that with each doubling of cumulative volume, the cost has dropped by 20 percent, or that costs are 80 per-cent of what they were before volume doubled. If the thousandth semiconductor produced costs a company $100 to make, then the two-thousandth semiconductor costs $80, and the four-thousandth semiconductor will cost $64, or 80 percent of $80.
Learning and experience curve slopes tend to be steeper in the early stages of production because learning occurs more rapidly in the early stages of production. This is because the most obvious opportunities to reduce costs will present themselves early in the experience of a company, but after those easy changes are adopted, gains from learning come in smaller increments. Both scale curves and experience curves tend to be steeper in manufactur-ing industries than they are in service businesses—which means volume tends to be more important for success in manufacturing industries.
Experience Curves and Market ShareTo a strategist, the logic of the experience curve suggests that the company with the highest volume in an industry—the highest share of an industry’s output—will also be the lowest-cost producer. In fact, early work by the Boston Consulting Group showed that a company’s rela-tive market share was a key indicator of competitive advantage and profit performance.17 This finding was corroborated by the PIMS studies (an acronym for Profit Impact of Market share Studies), which showed a consistent positive correlation between a company’s market share and its profitability in most industries.18 As discussed in Strategy in Practice: The Relationship between Market Share and Profitability in Retail Industries, the correlation can sometimes be seen in retail as well as manufacturing industries. The logic was as follows: the higher the company’s volume (its market share), the lower the costs per unit, and the better the profit performance. A company’s market share was seen as a key driver of firm profitability.
law of experience Costs per unit decrease with increases in cumulative volume of production.
[ Figure 4.3 ] Semiconductor Industry Experience Curve
0
500,0
00
1,000
,000
1,500
,000
2,000
,000
2,500
,000
3,000
,000
3,500
,000
4,000
,000
4,500
,000
5,000
,000
0.00
10.00
20.00
30.00
40.00
50.00
60.00
Cumulative Volume of Production (units)
Cost
Per
Uni
t of P
rodu
ctio
n ($
)
Average Slope = 0.798Average Decrease in Cost with Doublingof Volume = 20.2%
[ 76 ] CH04 • COSt ADvANtAGE
The relationship between market share and profitability in retail industries
sTraTeGY IN PRACtICE
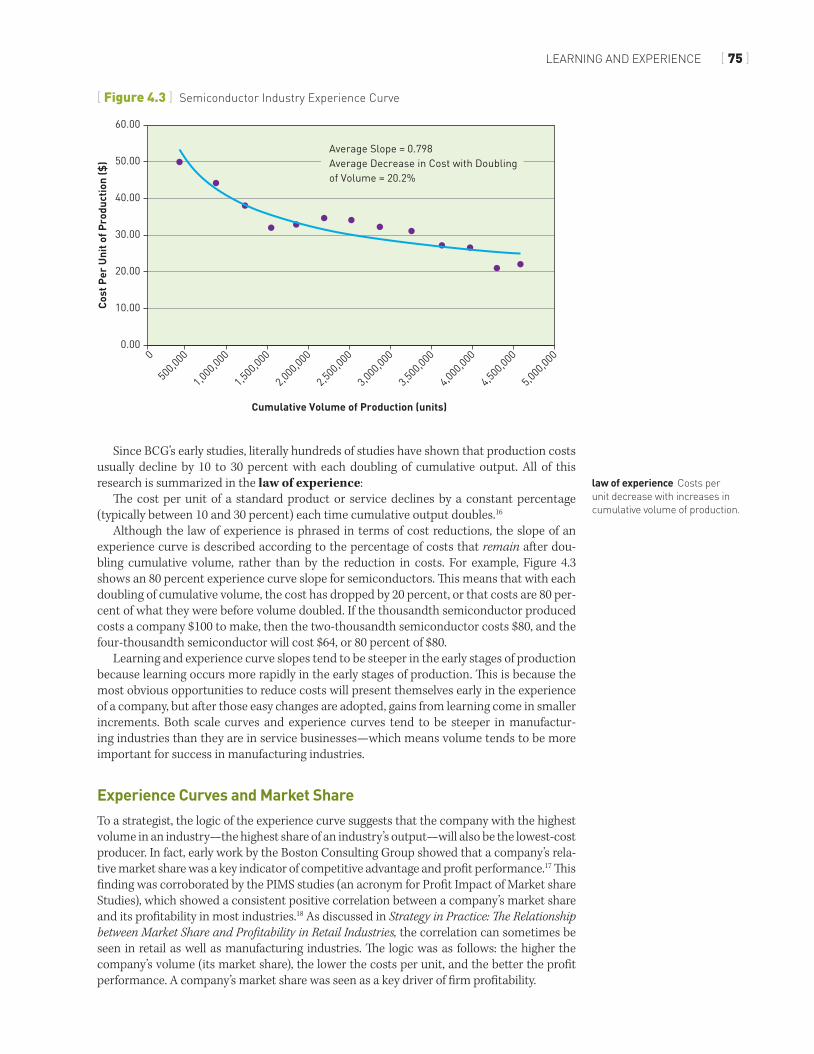
[ Figure 4.4 ] the Market Share-Profit Relationship: Home Improvement Retailing
0.0%0.0%
1.0%
2.0%
3.0%
4.0%
5.0%
6.0%
7.0%
8.0%
2.0% 4.0% 6.0%
Home DepotLowe’s
Walmart
SearsTrue Value
Ace Hardware
8.0% 10.0% 12.0% 14.0% 16.0%Market Share in Revenue
Net
Pro
fit M
argi
n
18.0%
Note: Market share fi gures are for 2004; profi t fi gures are an average of 2000–2005.
Th e initial conclusion from studies on the market share/profi tability relationship was that if a company wants to increase its profi tability, it should increase its market share. Th is had a clear implication for pricing strategy: A company should set its price based on its anticipated costs per unit (at the higher market share), not at current costs per unit. Th is kind of anticipatory pricing strategy would presumably trigger actual increases in market share, along with lower costs, per unit, and higher overall profi tability.
Does this strategy work? Not usually, and here’s why: Imagine that you compete in an industry with fi ve other companies who all hold the view that market share is the key to profi tability. To acquire market share from each other, each organization will have to drop its prices or increase its advertising and marketing costs. If all companies in a market adopt this approach, it seems clear that none of the fi rms will be particularly successful at either gaining
Food retailers like Albertsons and Pathmark sell thousands of products, as do home improvement
retailers like the Home Depot and Lowe’s. In retail industries, where companies sell multiple products, it is not possible to analyze an experience curve, because retailers do not have a “cost per unit,” as manufacturers do.
Another way for firms in these industries to answer the question, “Do I need to be big to be profitable?” is to plot each company’s market share (its share of industry revenues) on the x-axis and each company’s profit margins (operating profit as a percent of revenues) on the y-axis. Figure 4.4 shows an example of such a graph for the home improvement industry. this graph shows a clear positive relationship between national market share and profit
margins. the Home Depot and Lowe’s have high market share in the United States and are much more profitable than Sears, Ace Hardware, or true value hardware. In this particular industry, it appears that national market share contributes to lower costs and higher profitability.
However, we conducted this same analysis in the food retailing industry, using companies such as Albertsons, Kroger, Safeway, Pathmark, A&P, Giant Food, Wegmans, and Food Lion. that graph showed that national market share was not a good predictor of firm profit margins. Many regional supermarket chains, including Wegmans and Giant Food, were more profitable than larger national chains, such as Albertsons and Safeway. We can conclude that it is not critical to have high national market share to be successful in food retailing.
LEARNING AND EXPERIENCE [ 77 ]
market share or increasing profitability.19 The general consensus of strategists now is that mar-ket share cannot be easily purchased. Rather, it is most often earned, through a low-cost strat-egy or by offering a superior product. For example, Air Asia is currently the low-cost airline in Asia—and perhaps the world—because it has very low labor costs and provides fewer ameni-ties to customers than its competitors do.20 In fact, to keep costs low it doesn’t even rent gates at airports, but instead buses its passengers out to the tarmac where they board the plane. Air Asia consistently prices lower than competitors who realize they cannot afford to match the low prices. As a result, Air Asia is rapidly growing its market share by offering lower prices.
Most strategists today acknowledge that there is a correlation between market share and profitability and appreciate that greater market share will lead to lower costs per unit. As Air Asia grows its market share in the airline industry, for example, its cost per unit will decrease, which will further improve Air Asia’s profitability. However, in most cases the cause of both market share and profitability is some common underlying factor, such as a lower-cost method of production or an innovative product that allows a firm to simultaneously grow market share and profitability. In Air Asia’s case, its low-cost position is what allows it to grow market share and profitability simultaneously. In the case of Apple, its ability to simultaneously grow market share in music players (with iPod) and phones (with iPhone) while increasing profits is due to its ability to create an innovative product.
How Strategists Use the Scale and Experience Curves to Make DecisionsScale and experience curves are useful tools for making practical strategic decisions about growth and investment strategies; pricing strategies; strategies for managing costs; and acquisition strategies.
Growth/Investment Strategy. As we’ve mentioned, experience curves tend to be steeper in fast-growing industries. A scale or experience curve slope in a particular industry that is quite steep (a slope less than 85 percent is quite steep, meaning that with each doubling of volume, costs drop by 15 percent or more) indicates that first movers in a fast-growing market will secure a widening cost advantage. Firms in an industry with a steep curve have an imperative to grow as fast, or faster, than their rivals, so they do not end up at a cost disadvantage. Moreover, a steep curve also suggests that a firm should take whatever action is necessary to become a market-share leader. General Electric was known to have its business units follow the philosophy, “Be #1 or #2, or exit,” presumably because GE operated mainly in industries with steep experience curves, where it was difficult to be profitable if the business unit was not #1 or #2 in unit volume.21
Pricing Strategy. A scale or experience curve can also be useful as a basis for pricing strategy. A company can use the curve to anticipate future costs at different levels of volume. If higher unit volumes will produce lower costs per unit, the company may want to price its product or service aggressively low now, so that it can gain enough market share to reach those higher volumes, and make more money. For example, Hyundai has been described as a company that is pricing very aggressively to gain market share in order to lower its future costs per unit.22 The strategy seems to be working, as evidenced by the fact that share has tripled in the United States in the last 10 years. Of course, as we pointed out earlier, if all firms in an industry attempt to price for market-share gains without a sustainable cost advantage, the strategy may not work for any of them.
Cost-Management Strategy. A scale or experience curve can also be used as way to assess a company’s relative cost position. For example, it is possible to plot scale or experience curves for a company and for its competitors, allowing company leaders to assess how well each company is managing its costs. For many years, General Motors produced more cars than any other automaker in the world. An industry-wide analysis of several companies’ cost per unit produced (each car) showed, however, that while General Motors produced the most units, it did not have the lowest cost per unit.23 Toyota, Honda, and Hyundai all had lower costs per unit. This type of analysis suggests that General Motors was not managing its costs well. Given its high production volumes, it should have lower costs per car. There
relative cost the costs incurred by one company compared to the costs paid by a competitor.
[ 78 ] CH04 • COSt ADvANtAGE
is probably much GM can learn from its lower-cost competitors. For example, Tata doesn’t have significant economies of scale in production like General Motors has, but Tata has developed proprietary designs and patents that allow it to produce cars at low cost.
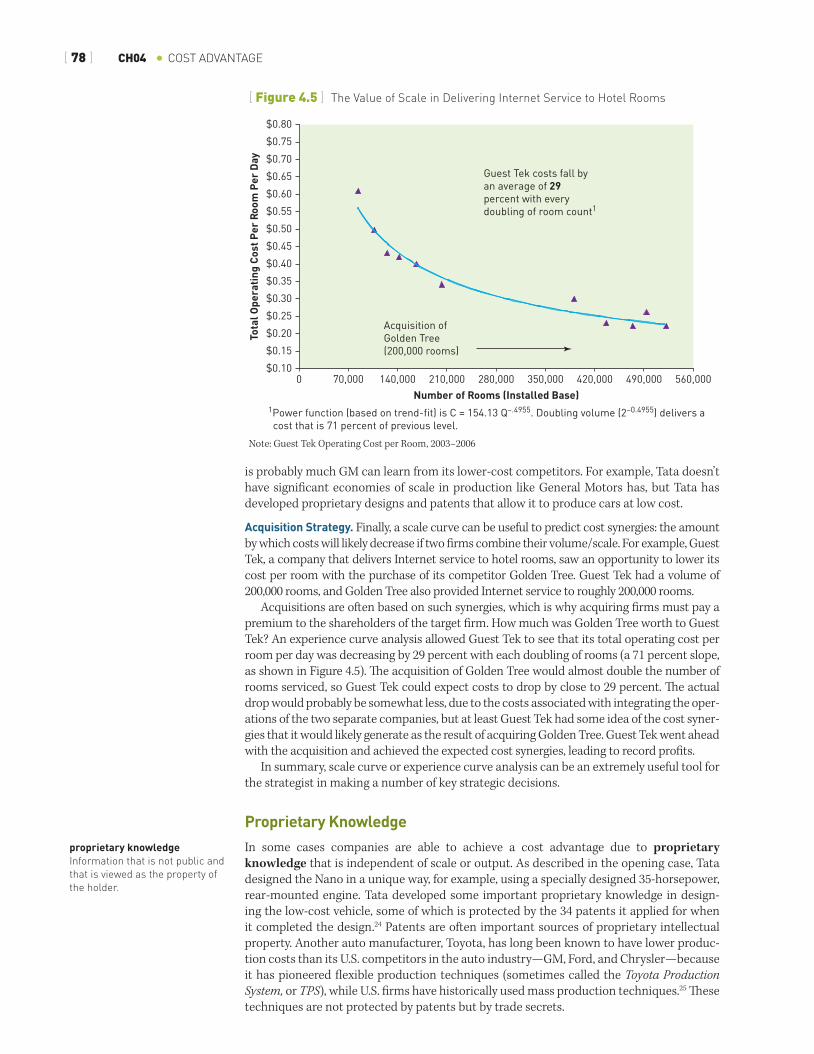
Acquisition Strategy. Finally, a scale curve can be useful to predict cost synergies: the amount by which costs will likely decrease if two firms combine their volume/scale. For example, Guest Tek, a company that delivers Internet service to hotel rooms, saw an opportunity to lower its cost per room with the purchase of its competitor Golden Tree. Guest Tek had a volume of 200,000 rooms, and Golden Tree also provided Internet service to roughly 200,000 rooms.
Acquisitions are often based on such synergies, which is why acquiring firms must pay a premium to the shareholders of the target firm. How much was Golden Tree worth to Guest Tek? An experience curve analysis allowed Guest Tek to see that its total operating cost per room per day was decreasing by 29 percent with each doubling of rooms (a 71 percent slope, as shown in Figure 4.5). The acquisition of Golden Tree would almost double the number of rooms serviced, so Guest Tek could expect costs to drop by close to 29 percent. The actual drop would probably be somewhat less, due to the costs associated with integrating the oper-ations of the two separate companies, but at least Guest Tek had some idea of the cost syner-gies that it would likely generate as the result of acquiring Golden Tree. Guest Tek went ahead with the acquisition and achieved the expected cost synergies, leading to record profits.
In summary, scale curve or experience curve analysis can be an extremely useful tool for the strategist in making a number of key strategic decisions.
Proprietary KnowledgeIn some cases companies are able to achieve a cost advantage due to proprietary knowledge that is independent of scale or output. As described in the opening case, Tata designed the Nano in a unique way, for example, using a specially designed 35-horsepower, rear-mounted engine. Tata developed some important proprietary knowledge in design-ing the low-cost vehicle, some of which is protected by the 34 patents it applied for when it completed the design.24 Patents are often important sources of proprietary intellectual property. Another auto manufacturer, Toyota, has long been known to have lower produc-tion costs than its U.S. competitors in the auto industry—GM, Ford, and Chrysler—because it has pioneered flexible production techniques (sometimes called the Toyota Production System, or TPS), while U.S. firms have historically used mass production techniques.25 These techniques are not protected by patents but by trade secrets.
proprietary knowledge Information that is not public and that is viewed as the property of the holder.
[ Figure 4.5 ] the value of Scale in Delivering Internet Service to Hotel Rooms
$0.100 70,000
1Power function (based on trend-fit) is C = 154.13 Q–.4955. Doubling volume (2–0.4955) delivers a cost that is 71 percent of previous level.
140,000
Acquisition ofGolden Tree(200,000 rooms)
Guest Tek costs fall byan average of 29percent with everydoubling of room count1
210,000 280,000Number of Rooms (Installed Base)
350,000 420,000 490,000 560,000
$0.15
$0.20
$0.25
$0.30
$0.35
$0.40
$0.45
$0.50
$0.55
$0.60
$0.65
$0.70
Tota
l Ope
rati
ng C
ost P
er R
oom
Per
Day
$0.75
$0.80
Note: Guest Tek Operating Cost per Room, 2003–2006
LOWER INPUt COStS [ 79 ]
The architect of the Toyota Production System was Taiichi Ohno, a Toyota engineer who realized that Toyota simply didn’t have the volume of production required to compete with U.S. automakers on the basis of economies of scale. So, Ohno invented a set of processes that allowed Toyota the flexibility to make three to four different car models within the same plant. U.S. automakers, in comparison, could typically only make one or two different car models within the same plant. A key principle of the Toyota Production System is “just-in-time” delivery of components, both from outside suppliers and from different manufac-turing stations within the plant. Delivering components close to the time they will be used keeps inventories at plants low and minimizes waste.
Studies have shown that the Toyota Production System comprises roughly 30 key pro-cesses, including their “just-in-time” delivery. Although U.S. automakers have tried to imi-tate many of the practices of TPS, they have been relatively unsuccessful at understanding the full proprietary system and how it works. As a result, Toyota has been able to maintain a cost advantage and quality advantage over many competitors.
LOWER INPUT COSTS
Inputs are any purchases that are made by a firm in the course of conducting business activities. The term inputs is broad. It includes raw materials, supplies, parts, and equip-ment. Inputs also include labor, capital, and land. When companies in a particular industry purchase their inputs as commodities from the same competitive input markets, we can expect every company to pay the same price for identical inputs.
In some situations, however, companies can achieve a cost advantage through lower-cost inputs. There are four primary ways that companies achieve cost advantage through lower-cost inputs: (1) exercising strong bargaining power over suppliers, (2) cooperating especially well with suppliers, (3) getting inputs from low-cost locations, and (4) arranging better access to inputs than other companies have.
Bargaining Power over Suppliers Perhaps the most important way that companies get lower-cost inputs is by having greater bargaining power over suppliers than their competitors do. There are two main sources of bargaining power: buying a lot from the supplier and using successful negotiating tactics.
Purchasing Volume. Perhaps not surprisingly, suppliers can be expected to drop prices when buyers increase their volume of purchases. Indeed, as a rule of thumb, suppliers are known to drop prices by 5 to 10 percent with a doubling of purchased volume. At high volumes, suppliers experience economies of scale and the law of experience, so they can lower their prices. Walmart, for example, is known to get lower cost per unit prices from suppliers because it can guarantee significantly higher volumes than its major competitors, Target and Sears Holding Company.
Purchasing and Negotiating Tactics. Even when two firms purchase similar volumes of inputs, one of the firms may have negotiation skills and purchasing tactics that allow it to get inputs at lower prices. Once again, Walmart is well-known for its purchasing strategy and tough negotiating tactics. Walmart spreads its purchases across numerous suppliers, so that no one supplier has a dominant market share in any particular product category. The company’s willingness to drop a supplier’s product if another supplier comes in with a lower price is widely known. These practices let suppliers know that they are expendable, which creates an incentive for suppliers to always give Walmart their lowest prices.26
Cooperation with Suppliers Rather than strong-arm suppliers into offering lower prices as a result of bargaining power, some companies achieve cost advantages by working cooperatively with suppliers. Toyota is known for working cooperatively with suppliers to get lower-cost and higher-quality inputs. Rather than spread purchases across multiple suppliers, Toyota has a two-vendor policy; it typically only works with two partner suppliers of a particular input. By working with a
inputs Resources such as people, raw materials, energy, information, or financing that are put into a system (such as an economy, manufacturing plant, computer system, etc.) to obtain a desired output.

[ 80 ] CH04 • COSt ADvANtAGE
smaller number of suppliers, Toyota is able to devote resources to make sure it coordinates very effectively with these particular suppliers.27 Toyota will even send its own engineers, who are manufacturing experts in TPS, to help suppliers implement more efficient manu-facturing processes to lower their costs. As a result of their close, highly cooperative rela-tionship with Toyota, many suppliers will build their manufacturing plants close to Toyota’s automobile assembly plants, thereby lowering the costs of transportation, logistics, and face-to-face communications. Toyota is often able to get lower input costs from suppliers by developing relationships that are highly cooperative.
Location Advantages Another way to achieve cost advantage through low-cost inputs is to source inputs from the lowest-cost location or country. The price of inputs can vary significantly between locations because of differences in wage rates, exchange rates, or raw material or energy costs. •Wage rates. When Nike entered the athletic footwear industry in the late 1970s, Adi-
das was the world leader. Adidas produced high-quality shoes primarily in Europe, where labor rates were quite high. Textile workers were paid approximately $20 per hour in 1990. Nike decided to source all of its shoes from Asia, starting in Korea (where wage rates were roughly $2.50 per hour in 1990) and then later mainly in China and Indonesia (where wage rates were roughly $0.50 an hour in 1990).28 Because high-qual-ity athletic shoes require a lot of hand-stitching labor, Nike was able to get shoes at far lower cost than Adidas. Nike used these cost savings to invest in marketing, athlete endorsers, and shoe design—a strategy of differentiation.
•Exchange rates. In the late 1990s, the value of the Indonesian rupiah fell from 4,000 rupiah per dollar to over 10,000 rupiah per dollar. This meant that Nike could buy more rupiahs with each dollar. It also meant Nike could buy shoes manufactured in Indone-sia for less than it could purchase shoes made in countries, such as China, where the currency had more value compared to the dollar.
•Raw material and energy costs. The production of aluminum requires significant energy, which is why much of the production is done in countries with low-cost hydroelec-tric power, such as Canada.29 Pulp and paper producers have typically come from countries such as Canada and Scandinavia that have access to forests and hydroelectric power.30
Preferred Access to Inputs In some instances, a company may have a cost advantage because it has preferred access to particular inputs—it can get them more easily than other companies can. For example, drilling oil in Saudi Arabia requires only the simplest drilling technologies, because drilling is less complicated in the desert and oil is more frequently found relatively close to the surface. For this reason, Saudi Arabian oil companies can access oil more cheaply than most oil com-panies in the world can. In similar fashion, the diamond company De Beers has historically had preferred access to diamonds because De Beers owns and controls the output of a large percentage of the world’s diamond mines.31
Companies only gain a cost advantage through preferred access to inputs when those inputs are raw materials (such as oil or diamonds) that are rare and difficult to imitate.
DIFFERENT BUSINESS MODEL OR VALUE CHAIN
A final way to achieve a cost advantage is to use an entirely different business model, or set of activities, to deliver a product or service. There are two basic ways to create a new business model: to eliminate activities or steps in the value chain or to perform different activities altogether.32 The value chain refers to the sequence of all activities that are per-formed by a firm to turn raw materials into the finished product that is sold to a buyer.33 Each activity is designed to add value to the prior activity, which is why it is referred to as the value chain.
business model the plan and set of activities implemented by a company to offer unique value and generate revenue and make a profit from operations.
value chain the sequence of all activities that are performed by a firm to turn raw materials into the finished product that is sold to a buyer.
SUMMARY [ 81 ]
Eliminating Steps in the Value ChainOne reason Ryanair has a cost advantage over other airlines in Europe is because it does not offer any in-flight meals, pillows, blankets, or even air-sick bags. By not offering these items, Ryanair not only doesn’t have to purchase the items itself, but also is able to significantly reduce the labor costs associated with getting meals on and off its airplanes or laundering blankets and pillows.
In similar fashion, Panasonic has long had a cost advantage over competitor Sony, because it opts to spend only one-half as much as Sony spends for research and develop-ment each year. Rather than lead in product development, Panasonic follows, largely by imitating Sony’s technologies. Panasonic also spends less than Sony does on advertising, because it does not lead in launching new product designs. Eliminating some R&D and advertising allows Panasonic to have lower costs, and lower prices, for comparable products sold in electronics stores.
Performing Completely New ActivitiesBook retailer Barnes and Noble sells books through large superstores. Each store costs millions of dollars to build. The company also has thousands of employees working in those bookstores and millions of dollars of books on its store shelves. In 1995, Amazon.com began to sell books in a completely different way—over the Internet. It was much cheaper for Amazon to build a few large warehouses, take orders online, and ship books directly to the customers’ homes than to do the things Barnes and Noble was doing: building superstores, hiring employees to staff the stores, and buying and storing inventory.34 We provide a more comprehensive treatment of strategies based on different business models and disruptive innovations in Chapter 10. Some firms like Ryanair and Amazon achieve a cost advantage by deploying a different business model, meaning that they either eliminate activities or steps in the value chain, or they deliver their product or services using entirely different activities than their competitors do.
Revisiting TataAt the beginning of the chapter, we described how Tata entered the motor vehicle industry with the Tata Nano, which was heralded as “the world’s cheapest car.” Indeed, the Tata Nano was the lowest-priced car in the world and was expected to appeal to very price-sensitive Indian customers. Yet it hasn’t sold as expected. Between 2009 and 2013, Tata sold 229,000 vehicles—a number far lower than expected. So what happened? Most observers point to the fact that the Nano was marketed as the most affordable car available. But in the Indian market where car purchases are hugely aspirational, people don’t want to buy “the world’s cheapest car.” Purchas-ing a Nano makes the Indian consumer feel cheap and doesn’t give the impression that they want to give to friends and family. Says Haritha Saranga, a professor at the Indian Institute of Management in Bangalore, “It is important to change the current image of Nano as a cheap car.”35 So Tata represents a cautionary tale about how you position a low-cost product. For some products that are hard to differentiate, like sugar, salt, wheat, oil, coal, and aluminum, offering the lowest price may be all you need to win customer business. However, for many other prod-ucts, like a car, customers consider a broader set of factors beyond price. In Chapter 5, we turn our attention to the ways that firms differentiate their offerings in ways other than price.
SUMMARY
•Companies that consistently offer lower prices due to lower costs rely on one or more of five primary sources of cost advantage: economies of scale or scope, learning and experi-ence, proprietary knowledge, low cost inputs, or a different business model.
•Economies of scale produce cost advantages by allowing firms to: (a) better spread the fixed costs of production across more units, (b) spread nonfixed costs across more units,
[ 82 ] CH04 • COSt ADvANtAGE
and/or (c) invest in the specialization of machines and employees that lower the per-unit costs of production.
•Learning produces cost advantages by improving employees’ efficiency and effectiveness. A learning curve shows reductions in labor costs per unit as cumulative volumes of produc-tion increase. A similar analysis that considers all costs produces an experience curve.
•A scale curve shows how cost per unit decreases with increases in volume of production. An experience curve shows how cost per unit decreases with increases in cumulative vol-ume of production. Scale and experience curve analysis are useful for: •making investment/growth decisions, •making pricing decisions, •analyzing a company’s relative cost position and looking for opportunities to reduce
costs, and •making acquisition decisions.
•To a strategist, experience-curve logic suggests that the company with the highest share of an industry’s cumulated output will also be the lowest-cost producer. However, a strategy to simply buy market share, or grow volume, through increases in advertising or lower-ing prices does not typically result in higher profits. The correlation between high market share and high profitability is the result of some underlying factor, such as low-cost pro-duction methods or an innovative product that causes both to grow simultaneously.
•Even when producing similar volumes, some companies are able to achieve a cost advantage as a result of proprietary knowledge about how to produce a product or service.
•Lower input costs are possible due to: (a) bargaining power over suppliers or labor, (b) superior cooperation with suppliers, (c) sourcing from low-cost locations, or (d) preferred access to inputs (e.g., ownership of key raw materials).
•Some firms achieve a cost advantage by deploying a different business model, meaning that they either eliminate activities or steps in the value chain, or they deliver their prod-uct or service using entirely different activities than competitors.
KEY TERMS
business model (p. 80)cost advantage strategy
(p. 73)diseconomies of scale
(p. 72)economies of scale
(p. 69)economies of scope
(p. 73)
employee specialization (p. 71)
experience curve (p. 74)fixed cost of production
(p. 70)general and administrative
costs (G&A) (p. 70)inputs (p. 79)law of experience (p. 75)
learning curve (p. 74)minimum efficient scale
(p. 71)proprietary knowledge
(p. 78)relative cost (p. 77)scale curve (p. 71)task specialization (p. 71) value chain (p. 80)
REVIEW QUESTIONS
1. What are the five sources of cost advantage? 2. Which of the five major sources of cost advantage contributed to the Tata Nano being the
world’s least expensive car?3. Explain three ways that economies of scale produce cost advantages.4. What is a scale curve, and how it is different from an experience curve? 5. What data would you need to calculate a scale curve or experience curve?6. Why do companies have difficulty increasing their profitability by simply buying market
share (e.g., lowering prices to increase market share)?
APPLICAtION EXERCISES [ 83 ]
7. Identify at least two ways that companies can achieve a cost advantage through lower-cost inputs.
8. Give an example of a company that has a cost advantage because it uses a different busi-ness model or shorter value chain than its competitors.
APPLICATION EXERCISES
Exercise 1: Read the Southwest case and answer the following questions.1. What are the primary drivers of cost (major cost areas) in the airline industry?2. What are the primary sources of Southwest’s cost advantage? In other words, do you believe
that Southwest’s cost advantage can be best attributed to economies of scale, learning and experience, proprietary knowledge, lower-cost inputs, or a different business model?
3. How is JetBlue’s strategy similar to Southwest’s strategy? How is it different?4. What prevents larger competitors, such as American, Delta, or United, from imitating
Southwest’s approach? What prevents new entrants from successfully imitating South-west’s approach?
5. Assignment: Using data from the Southwest case, create a chart that plots the relation-ship between each airline’s market share, in terms of revenue or airline seat miles flown, and its profitability for two time periods: 1995–2000 and 2001–2005. Does your analysis suggest that market share is correlated with profitability in this industry? If you exclude Southwest Airlines and JetBlue airlines from the analysis (companies that use a “point-to-point” route structure rather than a “hub and spoke” route structure), how well does market share predict profitability?
Exercise 2: Find the sources of cost advantage of a successful company with low prices. 1. Identify a company you would like to learn more about that seems to have a cost advan-
tage—it consistently has the lowest prices in the market.2. Use your own experience and public sources, including the company website or annual
reports and public articles, to gather data about the activities of that company. Based on your data, what are the primary sources of the company’s cost advantage?
3. Try to identify any resources or capabilities the company has that enable it to achieve low costs.
4. What, if anything, do you think prevents other companies from easily imitating this com-pany’s strategy? For example, is it difficult to imitate the company’s source (or sources) of cost advantage? Why?
Imagine that you work for a wireless phone carrier that is trying to decide how much money it should invest in
marketing and advertising in order to grow its number of subscribers. Calculating a scale curve will let you determine the extent to which increases in the number of subscribers result in corresponding decreases in the cost per subscriber. the faster that costs per subscriber drop with increases in the number of subscribers, the more money the company can afford to spend to acquire new subscribers.
to calculate a scale curve for a particular product or service, you need the following data: Cost per unit (in this case, the unit = one subscriber) at different levels of company volume (in this
case, volume = total number of subscribers). You can determine the cost per unit with the following formula:
Company’s costs ÷ Number of units Many strategists use numbers from several different years
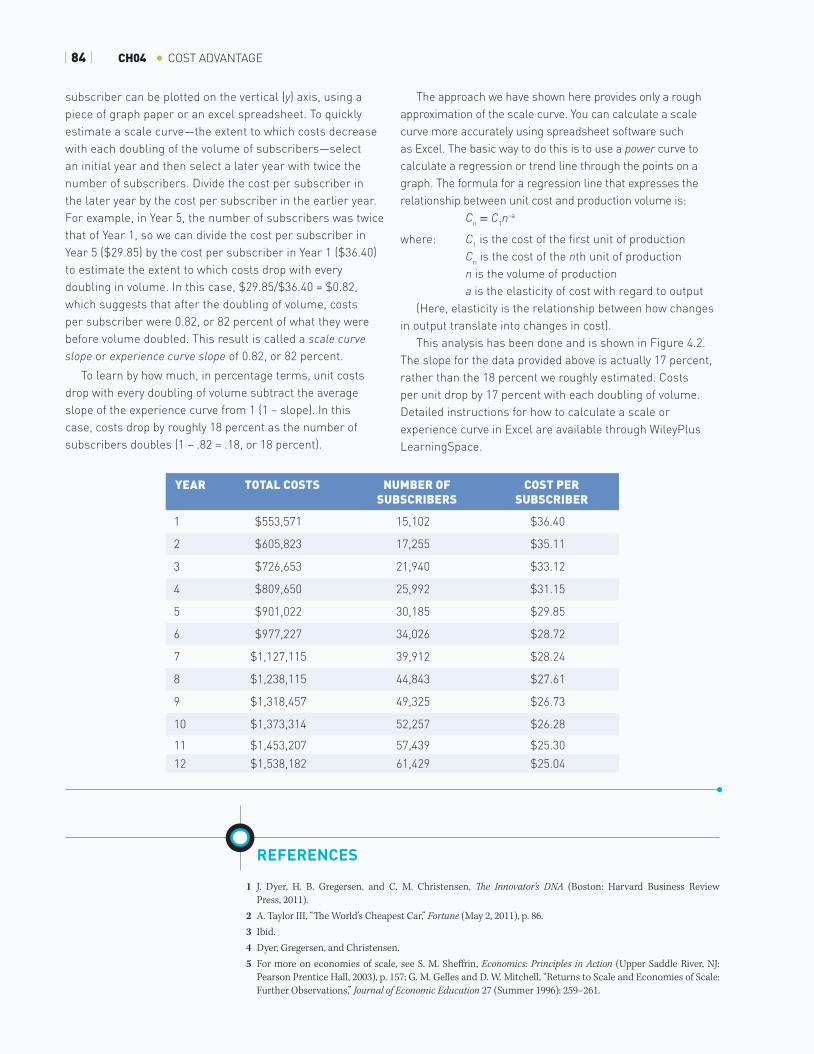
to calculate the cost per unit. Here, we provide disguised data for a wireless company’s total costs (expressed in constant dollars with inflation taken out),36 number of subscribers, and average cost per subscriber over 12 years.
to provide a visual summary of the relationship between number of subscribers and the cost per subscriber, create a graph that plots the number of subscribers for each year can be plotted on the horizontal (x) axis and the cost per
Strategy ToolHow To Calculate A Scale Curve or Experience Curve
[ 84 ] CH04 • COSt ADvANtAGE
subscriber can be plotted on the vertical (y) axis, using a piece of graph paper or an excel spreadsheet. to quickly estimate a scale curve—the extent to which costs decrease with each doubling of the volume of subscribers—select an initial year and then select a later year with twice the number of subscribers. Divide the cost per subscriber in the later year by the cost per subscriber in the earlier year. For example, in Year 5, the number of subscribers was twice that of Year 1, so we can divide the cost per subscriber in Year 5 ($29.85) by the cost per subscriber in Year 1 ($36.40) to estimate the extent to which costs drop with every doubling in volume. In this case, $29.85/$36.40 = $0.82, which suggests that after the doubling of volume, costs per subscriber were 0.82, or 82 percent of what they were before volume doubled. this result is called a scale curve slope or experience curve slope of 0.82, or 82 percent.
to learn by how much, in percentage terms, unit costs drop with every doubling of volume subtract the average slope of the experience curve from 1 (1 – slope). In this case, costs drop by roughly 18 percent as the number of subscribers doubles (1 – .82 = .18, or 18 percent).
the approach we have shown here provides only a rough approximation of the scale curve. You can calculate a scale curve more accurately using spreadsheet software such as Excel. the basic way to do this is to use a power curve to calculate a regression or trend line through the points on a graph. the formula for a regression line that expresses the relationship between unit cost and production volume is:
Cn = C1n-a
where: C1 is the cost of the first unit of production Cn is the cost of the nth unit of production n is the volume of production a is the elasticity of cost with regard to output(Here, elasticity is the relationship between how changes
in output translate into changes in cost). this analysis has been done and is shown in Figure 4.2.
the slope for the data provided above is actually 17 percent, rather than the 18 percent we roughly estimated. Costs per unit drop by 17 percent with each doubling of volume. Detailed instructions for how to calculate a scale or experience curve in Excel are available through WileyPlus LearningSpace.
REFERENCES
1 J. Dyer, H. B. Gregersen, and C. M. Christensen, The Innovator’s DNA (Boston: Harvard Business Review Press, 2011).
2 A. Taylor III, “The World’s Cheapest Car,” Fortune (May 2, 2011), p. 86. 3 Ibid. 4 Dyer, Gregersen, and Christensen. 5 For more on economies of scale, see S. M. Sheffrin, Economics: Principles in Action (Upper Saddle River, NJ:
Pearson Prentice Hall, 2003), p. 157; G. M. Gelles and D. W. Mitchell, “Returns to Scale and Economies of Scale: Further Observations,” Journal of Economic Education 27 (Summer 1996): 259–261.
Year ToTal CosTs Number oF subsCribers
CosT per subsCriber
1 $553,571 15,102 $36.40
2 $605,823 17,255 $35.11
3 $726,653 21,940 $33.12
4 $809,650 25,992 $31.15
5 $901,022 30,185 $29.85
6 $977,227 34,026 $28.72
7 $1,127,115 39,912 $28.24
8 $1,238,115 44,843 $27.61
9 $1,318,457 49,325 $26.73
10 $1,373,314 52,257 $26.28
11 $1,453,207 57,439 $25.30
12 $1,538,182 61,429 $25.04
REFERENCES [ 85 ]
6 M. B. Lieberman, “Market Growth, Economies of Scale, and Plant Size in the Chemical Processing Industry,” Journal of Industrial Economics 36 (2) (1987): 175–191.
7 See “DHL Global Connectedness Index 2012,” http://www.dp-dhl.com/content/dam/presse/specials/gci/2012/dhl-gci-2012-chapter3.pdf, p. 48.
8 See U.S. Securities and Exchange Commission, “Sears Holdings Corporation,” http://www.sec.gov/Archives/edgar/data/1310067/000131006713000013/shld201210k.htm, p. 24.
9 See U.S. Securities and Exchange Commission, “Exhibit 13.3 Annual Report to Shareholders,” http://www.sec.gov/Archives/edgar/data/104169/000010416913000011/annualreporttoshareholders.htm, p. 26.
10 K. Junias, “Economies of Scale: A Survey of the Empirical Literature,” Kiel working paper 813, Kiel Institute of World Economics (1997).
11 See http://traveltips.usatoday.com/effects-911-airline-industry-63890.html; E. Goldschein, “13 Ways The U.S. Airline Industry Has Changed Since 9/11,” Business Insider (September 8, 2011), http://www.businessinsider.com/how-the-us-airline-industry-has-changed-since-911-2011-9?op=1.
12 For more on economies of scope see J. C. Panzar and R. D. Willig, “Economies of Scale in Multi-Output Produc-tion,” Quarterly Journal of Economics 91 (3) (1977): 481–493; “Economies of Scope,” American Economic Review 71 (2) (1981): 268–272; D. J. Teece, “Economies of Scope and the Scope of the Enterprise,” Journal of Economic Behavior & Organization 1 (3) (1980): 223.
13 L. E. Yelle, “The Learning Curve: Historical Review and Comprehensive Survey,” Decision Sciences 10 (1979): 302–328.
14 M. Gottfredsen and S. Shaubert, The Breakthrough Imperative (New York: HarperCollins, 2008). 15 Perspectives on Experience (Boston: Boston Consulting Group, 1968). 16 Ibid.; also see G. Hall, and S. Howell, “The Experience Curve from the Economist’s Perspective,” Strategic Man-
agement Journal 6 (1985): 197–212. 17 G. S. Hansen and B. Wernerfelt, “Determinants of Firm Performance: The Relative Importance of Economic and
Organizational Factors,” Strategic Management Journal 10 (5) (1989). 18 P. W. Farris and M. J. Moore, The Profit Impact of Marketing Strategy Project: Retrospect and Prospects (Cambridge,
England: Cambridge University Press, 2004); Robert D. Buzzell and Bradley T. Gale, The PIMS Principles: Linking Strategy to Performance (New York: Free, 1987).
19 R. P. Rumelt and R. Wensley, “In Search of the Market Share Effect,” Proceedings of the Academy of Management (1981): 2–6.
20 See Air Asia, “Fourth Quarter 2010 Results,” (February 24, 2011), http://www.airasia.com/iwov-resources/my/common/pdf/AirAsia/IR/AA_4Q10_Analyst_Presentation.pdf.
21 “How Jack Welch Runs GE,” http://www.businessweek.com/1998/23/b3581001.htm. 22 See: V. Courtenay, “Hyundai Aiming High on Several Fronts,” WardsAuto (March 20, 2013), http://wardsauto.
com/management-amp-strategy/hyundai-aiming-high-several-fronts-2013. 23 J. H. Dyer, “Dedicated Assets: Japan’s Manufacturing Edge,” Harvard Business Review (November–December
1994): 174–178. 24 A. Taylor III, “The World’s Cheapest Car,” Fortune (May 2, 2011), p. 86. 25 J. P. MacDuffie, “Human Resource Bundles and Manufacturing Performance: Organizational Logic and Flexible
Production Systems in the World Auto Industry,” Industrial and Labor Relations Review 48 (2) (1995): 197–221. 26 P. Ghemewat, S. Bradley, and K. Mark, Wal-Mart Stores in 2003 (Cambridge, MA: Harvard Business School Press,
2003). 27 J. H. Dyer and N. Hatch, “Using Supplier Networks to Learn Faster,” Sloan Management Review, 45 (3)
(2004): 57–63. 28 P. Rosenzweig, “International Sourcing in Athletic Footwear,” HBS case 9-394-184. 29 P. Chevalier, “Aluminum,” The Canadian Encyclopedia. 2012. Accessed on April 8, 2013. <http://www.thecanadi-
anencyclopedia.com/articles/aluminum>. 30 See C. Campbell, Global Forest, Paper & Packaging Industry Survey: 2009 Edition—Survey of 2008 Results. Price-
WaterhouseCoopers, 2009. 31 T. Kretschmer, De Beers and Beyond: The History of the International Diamond Cartel (New York: New York Uni-
versity, 2003). 32 G. Hamel, “Strategy as Revolution,” Harvard Business Review (1996). 33 M. Porter, Competitive Advantage (New York: Free Press, 1983). 34 “Barnes & Noble versus Amazon.com.” (A) Harvard Business School Press. 35 S. Philip, “Tata’s Nano, the World’s Cheapest Car, Is Sputtering,” Bloomberg Businessweek (April 11, 2013),
http://www.businessweek.com/articles/2013-04-11/tatas-nano-the-worlds-cheapest-car-is-sputtering. Also, S. Nolen, “India’s Nano Hits Bumps on the Road,” The Globe and Mail (November 8, 2011), http://www.theglobe-andmail.com/globe-drive/news/indias-nano-hits-bumps-on-the-road/article4252239/.
36 Scale and experience curves should be calculating using costs in constant dollars to eliminate the effects of inflation. This can be done using a GDP deflator where a year is selected as the base year and the nominal costs for subsequent years are adjusted down based on inflation for each subsequent year. To convert nominal/cur-rent U.S. dollars to constant dollars using a GDP deflator, see: http://www.measuringworth.com/uscompare/.