
April 13, 2013 DVAEYC Dr. Donna R. Sanderson West Chester University.
Upload
valerie-robertsonCategory
view
214download
0
DVAEYC IREG Meeting
2 June 2010
Tamara Manik-Perlman, Azavea (formerly Avencia)
CommonSpace:A Shared Transitspace Collaboration Platform

William Penn Foundation
Sustainable Business Network of Greater Philadelphia
NPower PA
Azavea (formerly Avencia)
Partners

Vision
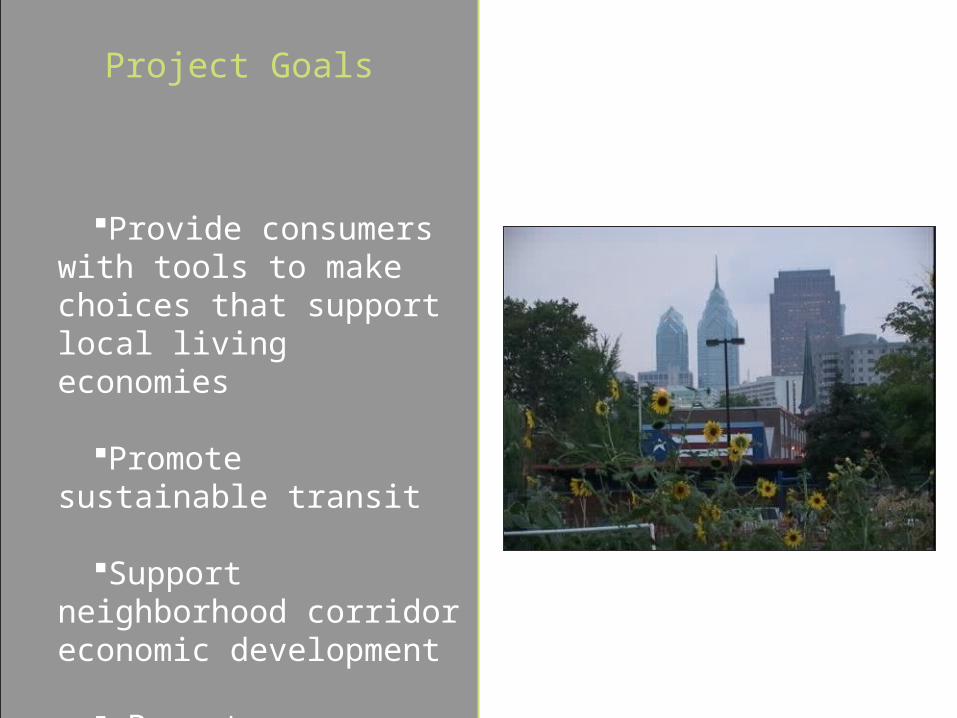
Provide consumers with tools to make choices that support local living economies
Promote sustainable transit
Support neighborhood corridor economic development
Promote Philadelphia as a sustainable city
Project Goals
1.Sustainable transit visualization
2.Destination discovery on a map, aggregated from curated web sources
3.Real-time collaboration
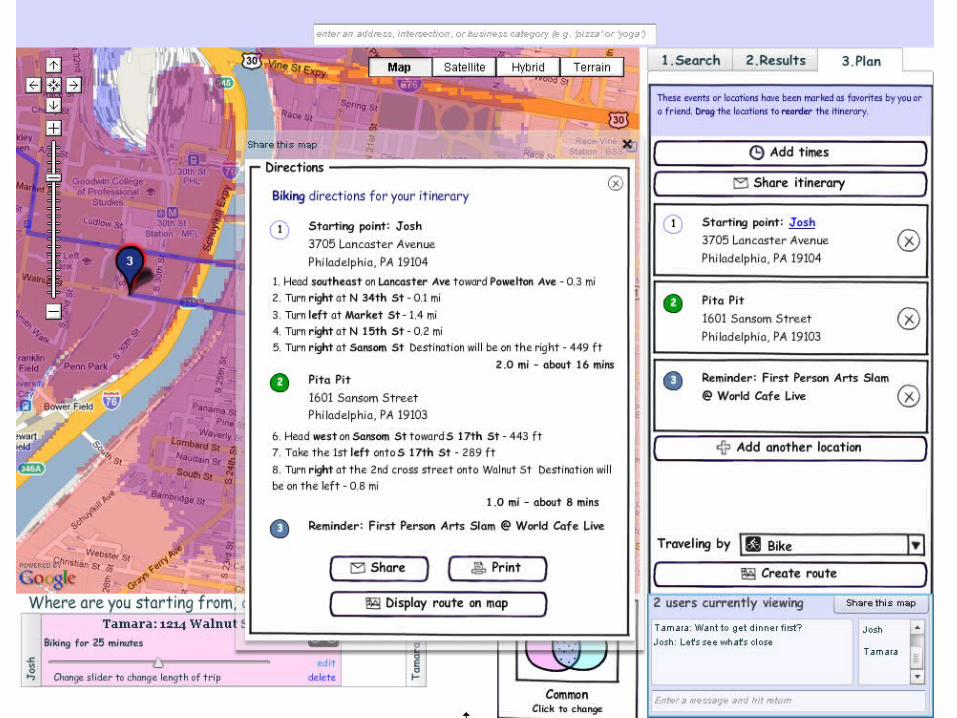
CommonSpace Features

See and searchwhere you can go by
walking,biking
&public transit.
1.Transit Visualization
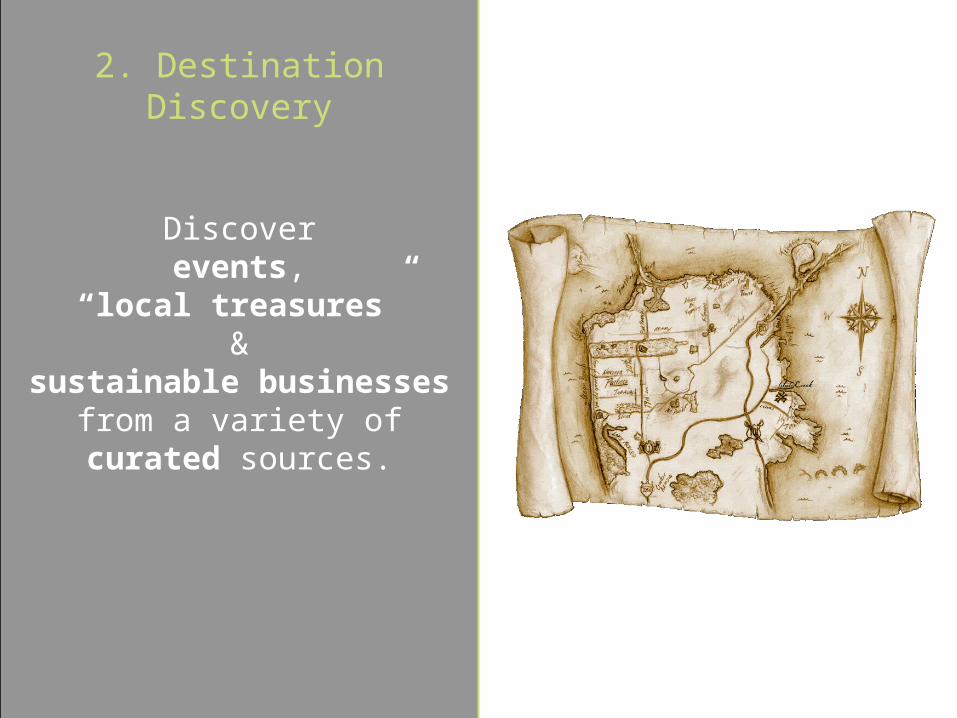
Discoverevents,
“local treasures”&
sustainable businessesfrom a variety ofcurated sources.
2. Destination Discovery

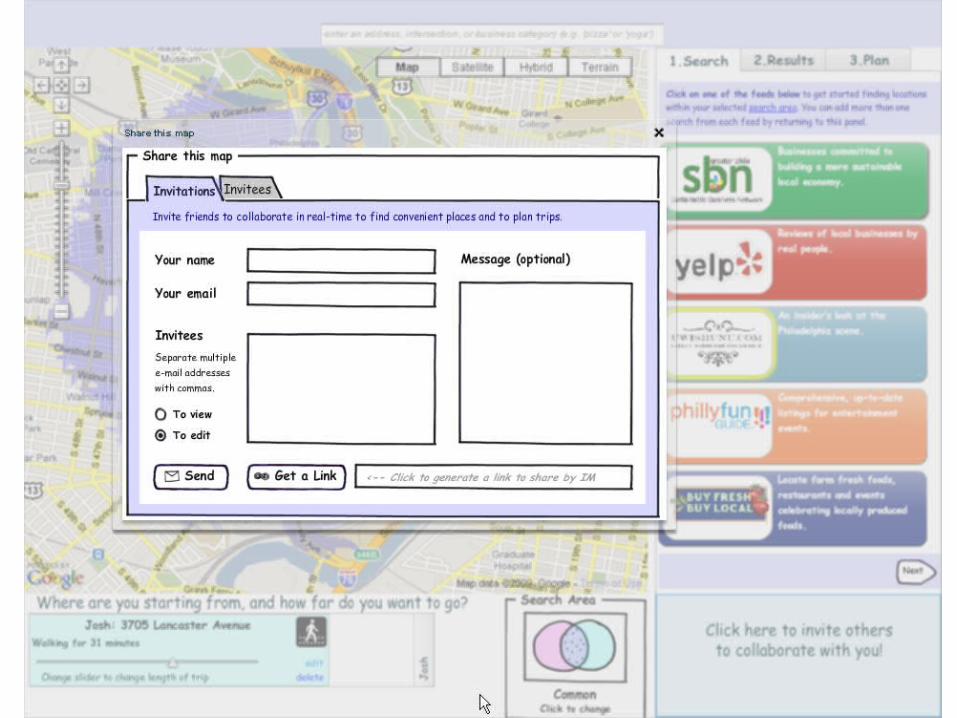
Collaborate on ashared map
to find and choose destinationsat a convenient distance
from everyone in a group.
3. Collaboration
Planning what to do tonight with your friends who are online at the same time
Planning a weekend adventure over the course of a week
Planning a multi-stop shopping trip
Finding a location for a house based on work, school, and other locations
Publishing an itinerary online, e.g. events at a multi-day event
How could this be used?
Walkthrough
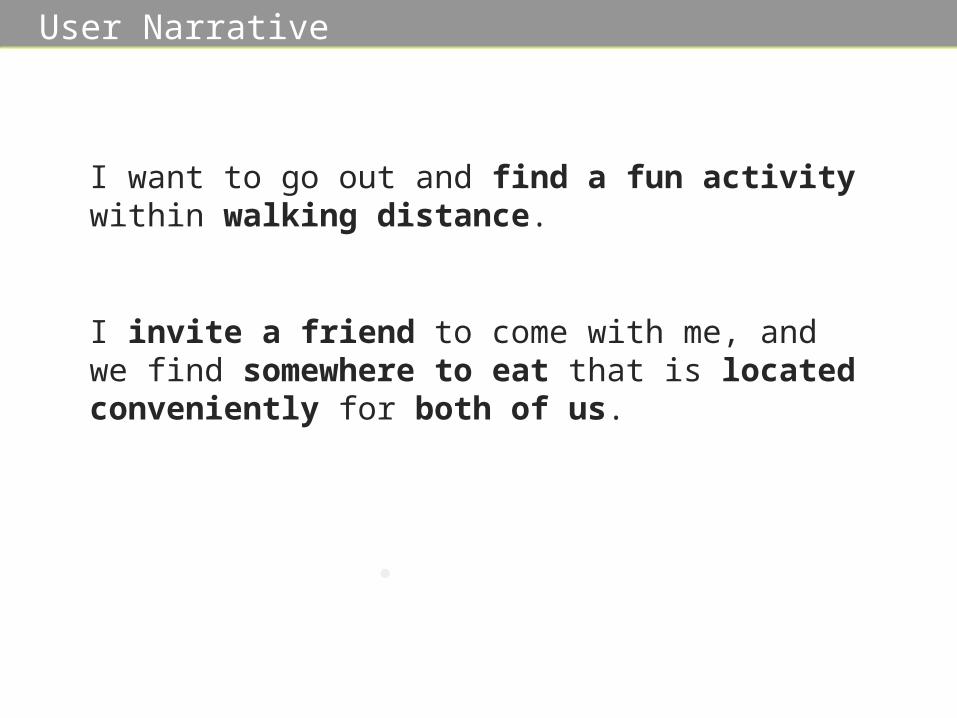
User Narrative
I want to go out and find a fun activity within walking distance.
I invite a friend to come with me, and we find somewhere to eat that is located conveniently for both of us.
Demonstration
http://commonspace.us/CommonSpace.html

Data & Technology
Open-source multi-modal trip planner
Uses Dijkstra’s shortest path algorithm
Developed by Brandon Martin-Anderson
http://bmander.github.com/graphserver
Graphserver

Transitspace Calculation Methodology
1.Gather data
2.Build graphs
3.Generate shortest path tree
4.Calculate contour raster
5.Convert raster to three-band bitmap

Street networkOpenStreetMap (XML)
DEMUSGS NED
Transit dataGoogle’s General Transit
Feed Specification (GTFS)
1. Gather Data

Import data into Graphserver
Run a utility to create a network for each transit method; include additional parameters such as directionality or weighting
i. Walkingii. Bikingiii. Mass Transit
2. Build Graphs
+
+
i.
ii.
iii.

Select a starting point and a transit method
Traverse the appropriate graph
Assign a time distance to each vertex on the network
3. GenerateShortest Path Tree
Source: Brandon Martin-Anderson

Using values of vertices, calculate a contour map of travel times
Output result as a raster
4. CalculateContour Raster
Source: Brandon Martin-Anderson

Convert single-band raster to a three-band (RGB) bitmap
5. Convert to Bitmap
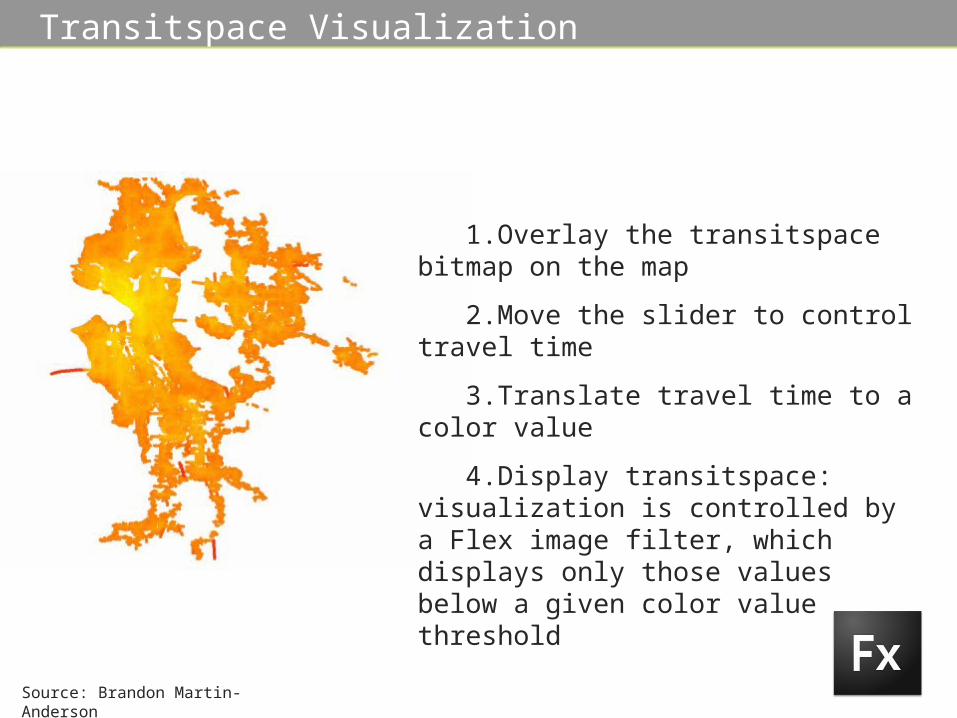
Transitspace Visualization
Source: Brandon Martin-Anderson
1.Overlay the transitspace bitmap on the map
2.Move the slider to control travel time
3.Translate travel time to a color value
4.Display transitspace: visualization is controlled by a Flex image filter, which displays only those values below a given color value threshold

Search Area Server Geoprocessing
1.Move the slider to control travel time
2.Reclass the raster into binary values: 1 for values below the selected time, 0 for those above
3.Convert cells = 1 to a vector polygon with a unique ID
4.Calculate search area, or commonspace, as the intersection of one or more transitspace polygons

Feed Search
Feeds come in many types Event listings (API) Curated blogs (GeoRSS) Static databases of destinations (API)
CommonSpace calls web services differently depending on their requirements
Point-in-polygon search Pass in an extent, filter returned results by the
search area
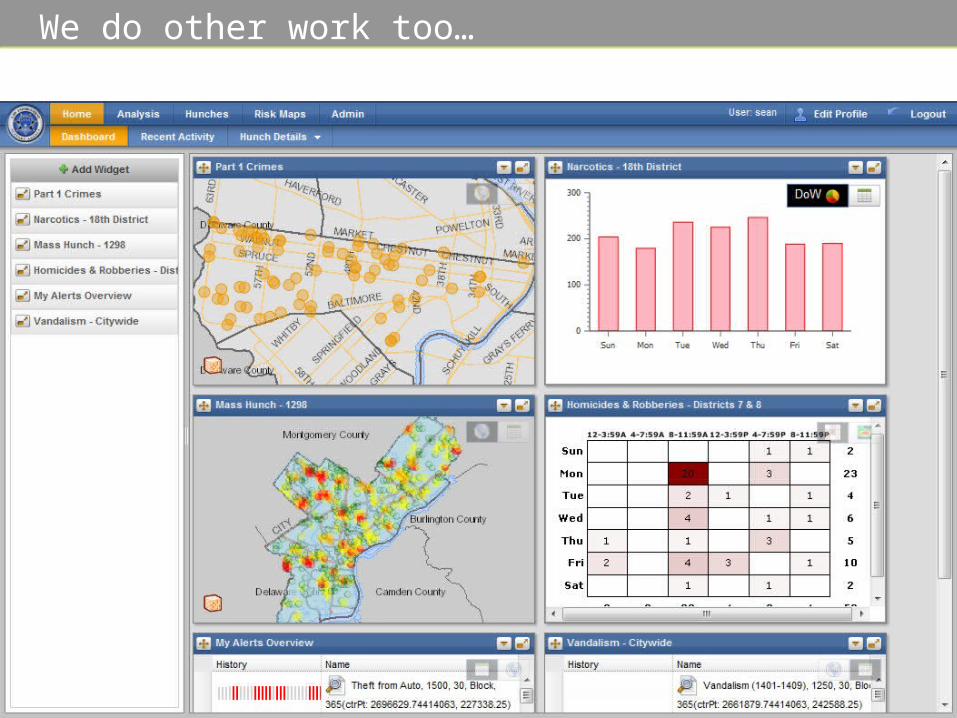
We do other work too…
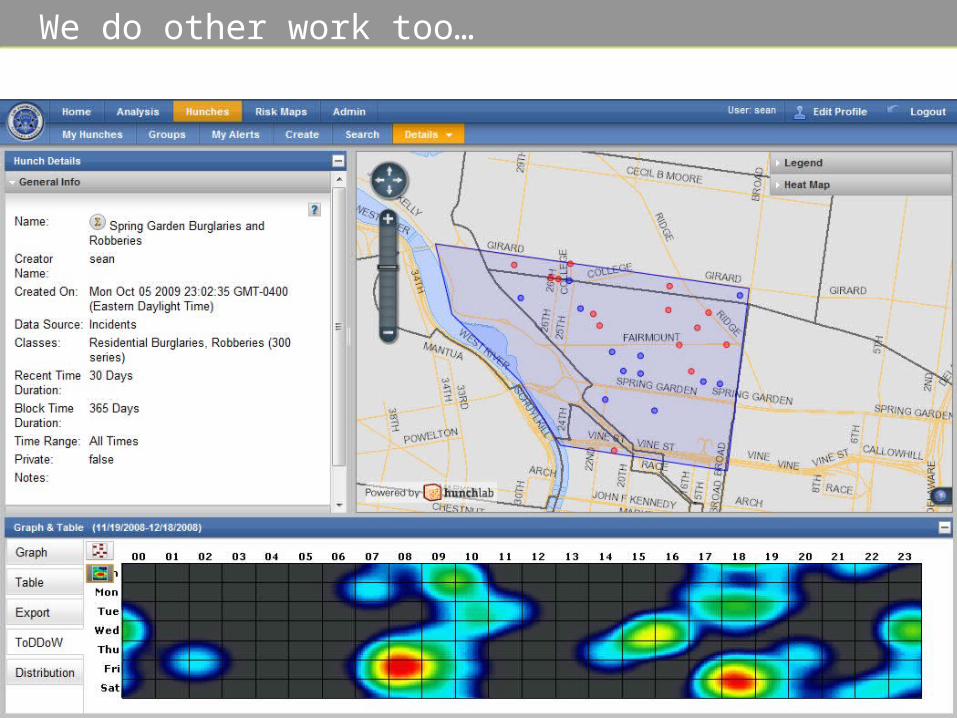
We do other work too…

Transitspace Visualization
1.Overlay the transitspace bitmap on the map
2.Move the slider to control travel time
3.Translate travel time to a color value
4.Display transitspace: visualization is controlled by a Flex image filter, which displays only those values below a given color value threshold
+ =+