Duvernay Formation mapping and inversion
25
Duvernay Formation mapping and inversion CREWES Research Report — Volume 29 (2017) 1 The Duvernay Formation-the application of structure and simultaneous inversion for reservoir characterization and induced seismicity Ronald Weir, L. Lines, D. Lawton ABSTRACT This paper describes the analysis of multi-component inversion data integrated with structural interpretation. This workflow is used for characterizing a low permeability unconventional reservoir, both in a structural and lithologic sense. This includes the determination of a time-depth relationship using synthetic seismograms, generation of seismic derived structural maps, and the determination of inversion based parameters of density, shear wave, and p wave velocity. The model based procedure includes poststack (acoustic) inversion, AVO prestack inversion, and joint PP-PS inversion. With these rock properties determined, calculations are made to determine Young’s Modulus, Poisson’s Ratio and brittleness. Faults are mapped based on time slices, isochrons and observing correlatable vertical displacements. Seismic derived attributes, when combined with structural mapping can highlight zones most favorable to hydraulic fracturing. The mapping of structural discontinuities can also lead to an understanding of zones of preexisting weakness, and an understanding of induced seismicity risk. INTRODUCTION Unconventional plays are located in geological fairways, and are characterized by low permeability, organic rich shales. These plays are not economically viable based on conventional drilling and completion methods. The Duvernay play in the Western Canada sedimentary basin is one such play. This Duvernay Formation play is developed with multiple horizontal wells from single surface location, completed using hydraulic fracturing. The completion enhances the natural permeability and allows the hydrocarbons to be produced in and economic manner (Dusseault and McLennan, 2011). In the planning of an unconventional drilling program, well logs, cores and seismic data can provide valuable information for horizontal well placement and the design of hydraulic fracture stages. Seismic data can also provide estimates of lithologic parameters such as Young’s Modulus, Poisson’s Ratio and brittleness. Goodway et al. (2010) described methods built on the use of AVO analysis to differentiate ductile shale reservoirs from brittle reservoirs in the Barnett Shale of Texas. Parameters known as lambda-rho and mu-rho were derived from well logs, cross plotted and compared with data derived from seismic inversion (LMR analysis). Trends that emerged from this approach demonstrated that variations in rock properties, often attributed to brittle behavior of reservoir rocks, exhibit coherent patterns that reflect reservoir quality. When seismic-derived LMR attributes are back projected onto the seismic section, trends in brittleness are observed and can be mapped spatially within the seismic volume. The importance of fault mapping was highlighted by Refayee et al. (2016) in a Utica Shale example. Parameters such as dip, similarity and curvature were extracted from the seismic data and incorporated into the interpretive model. A “fault enhanced filtered” seismic volume was derived from the seismic cube (similar to semblance) and
Transcript of Duvernay Formation mapping and inversion
Duvernay Formation mapping and inversion
CREWES Research Report — Volume 29 (2017) 1
The Duvernay Formation-the application of structure and simultaneous inversion for reservoir characterization and induced seismicity
Ronald Weir, L. Lines, D. Lawton
ABSTRACT This paper describes the analysis of multi-component inversion data integrated with
structural interpretation. This workflow is used for characterizing a low permeability unconventional reservoir, both in a structural and lithologic sense. This includes the determination of a time-depth relationship using synthetic seismograms, generation of seismic derived structural maps, and the determination of inversion based parameters of density, shear wave, and p wave velocity. The model based procedure includes poststack (acoustic) inversion, AVO prestack inversion, and joint PP-PS inversion. With these rock properties determined, calculations are made to determine Young’s Modulus, Poisson’s Ratio and brittleness. Faults are mapped based on time slices, isochrons and observing correlatable vertical displacements. Seismic derived attributes, when combined with structural mapping can highlight zones most favorable to hydraulic fracturing. The mapping of structural discontinuities can also lead to an understanding of zones of preexisting weakness, and an understanding of induced seismicity risk.
INTRODUCTION Unconventional plays are located in geological fairways, and are characterized by low
permeability, organic rich shales. These plays are not economically viable based on conventional drilling and completion methods. The Duvernay play in the Western Canada sedimentary basin is one such play. This Duvernay Formation play is developed with multiple horizontal wells from single surface location, completed using hydraulic fracturing. The completion enhances the natural permeability and allows the hydrocarbons to be produced in and economic manner (Dusseault and McLennan, 2011). In the planning of an unconventional drilling program, well logs, cores and seismic data can provide valuable information for horizontal well placement and the design of hydraulic fracture stages. Seismic data can also provide estimates of lithologic parameters such as Young’s Modulus, Poisson’s Ratio and brittleness.
Goodway et al. (2010) described methods built on the use of AVO analysis to differentiate ductile shale reservoirs from brittle reservoirs in the Barnett Shale of Texas. Parameters known as lambda-rho and mu-rho were derived from well logs, cross plotted and compared with data derived from seismic inversion (LMR analysis). Trends that emerged from this approach demonstrated that variations in rock properties, often attributed to brittle behavior of reservoir rocks, exhibit coherent patterns that reflect reservoir quality. When seismic-derived LMR attributes are back projected onto the seismic section, trends in brittleness are observed and can be mapped spatially within the seismic volume. The importance of fault mapping was highlighted by Refayee et al. (2016) in a Utica Shale example. Parameters such as dip, similarity and curvature were extracted from the seismic data and incorporated into the interpretive model. A “fault enhanced filtered” seismic volume was derived from the seismic cube (similar to semblance) and

Weir, Lawton, and Lines
2 CREWES Research Report — Volume 29 (2017)
used to map the major faults and to image the fracture networks. Refayee et al. (2016) proposed that sweet spots within in the reservoir are defined by areas of enhanced natural fractures and are mappable within the seismic volume.
Meek et al. (2013) highlighted the advantages of a multidisciplinary reservoir geophysics approach by combining results from microseismic monitoring, structural attribute analysis and seismic petrophysics. Comparison of recorded microseismic events with curvature anomalies and other seismic-derived attributes such as Young’s modulus revealed a strong correlation with the density of the recorded microseismic events. Prospective areas for future development were then identified based on seismic attributes. Similarly, Rafiq et al. (2016) showed how sets of attributes extracted from microseismic data can be correlated with curvature anomalies from 3D seismic data to partition a reservoir into depositional facies units.
Chopra et al. (2017) conducted a seismic analysis within part of the Duvernay play to show that induced seismicity appears to follow pre-existing basement faults. Shultz et al. (2017) investigated areas within the Duvernay play that are prone to induced seismicity from hydraulic fracturing and identified event hypocenters extending from the Duvernay into the underlying Precambrian basement. This study confirmed a correlation between the presence of the basement fault systems and the location of induced seismic events.
This paper analyzes and interprets a 3D multicomponent seismic dataset in the Kaybob portion of the Duvernay play; this is an area where nearby induced earthquakes have occurred (Bao and Eaton, 2016; Schultz et al., 2017). Analysis of this dataset includes structural interpretation and mapping, fault detection, and reservoir characterization based on poststack and simultaneous P-P and P-S inversion. Various presentations of the data are used to illustrate how structure and inversion attributes can be employed to identify areas that are most prospective for development, as well as areas where the existing fault architecture may pose a risk for induced seismicity.
The main objective of our study is to present a comprehensive workflow for interpretive processing and inversion of 3D multi-component seismic data for unconventional reservoir geophysics. We apply this approach to a dataset from the Duvernay play, demonstrating how seismic data can be used to map structural discontinuities and faults, thus providing insights into the tectonic history of the reservoir. We also show how seismic inversion applied to poststack and multicomponent data gathers (PP-PS) can be used as a tool to identify facies changes, fault boundaries, and potential geohazards such as basement faults.

Duvernay Formation mapping and inversion
CREWES Research Report — Volume 29 (2017) 3
FIG 1. Hydrocarbon maturity windows for the Duvernay petroleum system (modified from Creaney et al., 1994), showing location of the study area. Table on the right (adapted from Core Labs, 2017) shows Middle and Upper Devonian regional stratigraphic nomenclature, highlighting several units that are discussed here.
GEOLOGICAL SETTING The Duvernay Formation, a bituminous / argillaceous carbonate of late Devonian age
in the Western Canada Sedimentary Basin, is emerging as a major resource play in North America (Hammermaster, 2012; Creaney and Allan 1990). The Duvernay is rich in organic matter and, depending upon thermal maturity and position within the basin, it produces gas, natural gas liquids, or oil (Switzer et al. 2016). It is also commonly believed to be the primary source rock for the Devonian Leduc reef, Nisku, and Wabamun carbonate plays (Dunn, 2012). With the advent of increasingly widespread horizontal drilling and multi-stage hydraulic fracturing, the Duvernay is being recognized as a world-class unconventional resource play (Davis et al., 2013).

Weir, Lawton, and Lines
4 CREWES Research Report — Volume 29 (2017)
FIG 2. Generalized regional cross section showing stratigraphic relationships of the Duvernay Formation with Leduc reef buildups and adjacent Devonian units. Inset shows location of cross section. Adapted from Switzer et al. (1994).
The Duvernay Formation was deposited adjacent to several large Leduc reef complexes (Figure 1). The Duvernay has an effective porosity of 6-7% and an average total organic carbon (TOC) content of up to 4.5% (Chopra et al., 2017). It is correlative with the lower member of the Leduc Formation (Figure 2) and is believed to be the source rock for most of the Leduc, Nisku, and Wabamun oil pools in Alberta (Dunn et al., 2012). Growth of Leduc reefs was terminated by sea level rise, during which the reef-building organisms were ultimately unable to keep up with the rising sea level and were drowned (MacKay, 2017). The Leduc and Duvernay Formations are both overlain by the quartz-rich Ireton Formation, which forms a cap and seal to hydrocarbon reservoirs.
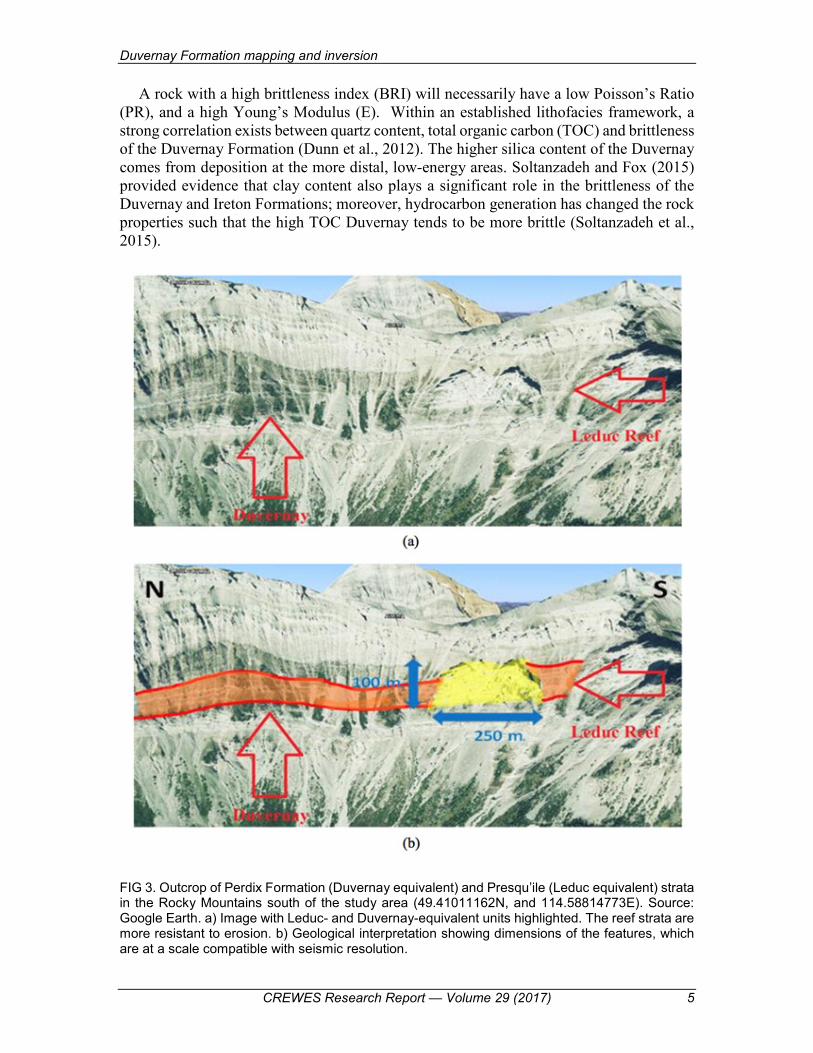
Variability in depositional setting is evident in Figure 3, which shows a Leduc reef (Presqu’ile Formation) outcrop characterized by multiple stages of reef growth, with adjacent Duvernay-equivalent (Perdrix Formation) strata. This outcrop exhibits both lateral and vertical lithofacies variation within the section, including relationships relative to the reef margin. The reef mass visible in this exposure is 100 m thick and 250 m wide in section. The reef exhibits five distinct episodes of growth. To the north, the Perdrix Formation transitions into a quartz-rich shale.
The depositional environment of the Duvernay Formation varied depending on where it was situated with respect to the Leduc reef margin. Factors that influenced the depositional environment included tides, storms and sea level changes. Inter-reef areas were protected from waves and tides, so that sediments in these regimes were deposited in a low-energy environment. In the subsurface, five lithofacies have been identified from cores (Dunn et al., 2012); these are argillaceous mudstones, bioturbated limestones, organic rich siliceous mudstones, siliceous organic-rich mudstone and mixed siliceous mudstones.
Duvernay Formation mapping and inversion
CREWES Research Report — Volume 29 (2017) 5
A rock with a high brittleness index (BRI) will necessarily have a low Poisson’s Ratio (PR), and a high Young’s Modulus (E). Within an established lithofacies framework, a strong correlation exists between quartz content, total organic carbon (TOC) and brittleness of the Duvernay Formation (Dunn et al., 2012). The higher silica content of the Duvernay comes from deposition at the more distal, low-energy areas. Soltanzadeh and Fox (2015) provided evidence that clay content also plays a significant role in the brittleness of the Duvernay and Ireton Formations; moreover, hydrocarbon generation has changed the rock properties such that the high TOC Duvernay tends to be more brittle (Soltanzadeh et al., 2015).
FIG 3. Outcrop of Perdix Formation (Duvernay equivalent) and Presqu’ile (Leduc equivalent) strata in the Rocky Mountains south of the study area (49.41011162N, and 114.58814773E). Source: Google Earth. a) Image with Leduc- and Duvernay-equivalent units highlighted. The reef strata are more resistant to erosion. b) Geological interpretation showing dimensions of the features, which are at a scale compatible with seismic resolution.

Weir, Lawton, and Lines
6 CREWES Research Report — Volume 29 (2017)
INTERPRETIVE WORKFLOW AVO-Compliant Processing The 3D multicomponent seismic data used in this study
were acquired and processed in 2015. The data were processed in an AVO-compliant manner (e.g., Lee et al., 1991; Allen and Peddy, 1993) by using processing steps designed to preserve relative amplitudes for both PP and PS datasets. The AVO-compliant processing flow used to generate the PP data volume is generally similar to a conventional seismic-processing flow, with a few key differences. Spectral balancing was applied in a surface-consistent manner (Taner and Koehler, 1981) by scaling low-amplitude frequency bands using correlated stack equalization. Noise attenuation was then performed in the cross-spread domain (Calvert et al., 2008). Traces with residual anomalous amplitudes (i.e. outliers) were manually edited from the data. Pre-stack time migration (e.g., Fowler, 1997) was then applied, followed by a radon multiple attenuation (Kelamis et al., 1990). 5-D interpolation and normalization (Chopra and Marfurt, 2013) was then applied to the data in order to fill in missing traces and to normalize the data to the bin center.
Essentially the same AVO-compliant workflow was applied for PS data processing, with several adaptations that account for the specific raypath geometry of converted waves (Stewart et al., 2002) in addition to shear-wave splitting. In particular, the bin centers were determined using common conversion point binning (Eaton and Lawton, 1992). Shear-wave splitting analysis was performed to determine the time shift and rotation angle between the fast and slow qS arrivals. An amplitude compensation was performed using the approach of Jin et al. (2000), by applying corrections that reverse the shear-wave splitting effect along the upgoing raypath. After applying these processing steps, a 5-D interpolation and normalization was performed, with the PS output bins normalized (interpolated) to coincide with the location of the PP bins.
The version of the stacked data used in this study for interpretation and prestack inversion was limited to a maximum 38˚ P-wave incidence angle, based on ray tracing using a velocity model derived from a control-well (well “A”) that is discussed below. The corresponding gathers then had residual normal moveout and trim statics (e.g. Hoeber, 2005) applied to both the PP and PS prestack data volumes. Structural Mapping
Sonic and density logs from a control well “A” were used to generate a synthetic
seismogram in order to achieve a precise tie to the seismic data (Figure 4). During this process, the source wavelet was also estimated. Well “A” was logged to the Middle Devonian Gilwood member of the Watt Mountain Formation, to a depth of 3607 m. This synthetic seismogram tie establishes a time-depth relationship, which was subsequently used to create angle gathers, perform PP – PS registration, and provide a calibration point for the seismic inversion.
Figure 5 shows a west-east seismic profile extracted from the PP stacked data volume. The sonic curve from well “A” are overlaid to illustrate the correlation of these log curves with the seismic profile. The Duvernay, Gilwood, and Precambrian seismic horizon are correlated based on the tie to well “A”. A horizon marking the top of the Precambrian basement was also picked, based on a regional correlation from a deep crustal seismic

Duvernay Formation mapping and inversion
CREWES Research Report — Volume 29 (2017) 7
profile (Eaton et al., 1999) that passes close to this 3D seismic survey. Structural discontinuities are evident as breaks or sharp bends in the picked horizons (Figure 5).
FIG 4. PP synthetic-seismogram well tie for the interpretive workflow, showing the extracted source wavelet. The integrated two-way times from the VP log at well “A” have been shifted to match the observed times. Zero-offset synthetic seismograms are duplicated for clarity; those that plotted in blue are from the zero-offset synthetic, while those plotted in red are the actual seismic traces at the jump tie. A good fit for the latter synthetic seismogram is evident by overlaying it onto the PP data volume at the location of well “A”, as shown on the right. This provides confidence for the horizon picks and time-depth relationship.

Weir, Lawton, and Lines
8 CREWES Research Report — Volume 29 (2017)
FIG 5. West-East seismic profile extracted from the PP data volume, showing the integrated sonic log correlation with the mapped seismic horizons., the Δt (sonic) and ρ (density) logs are shown. The well is located 8 Km. SE of the line along structural strike. Two interpreted basement faults are displayed showing displacement in the Gilwood, Swan Hills, and Ireton formations.
Both time slices in Figure 6 reveal amplitude trends that define a prominent set of north-south oriented features. In the case of the shallower time slice (b), a curved surface trending NE to SW is seen, as well as the N-S trend observed on the deeper time slice. Figure 6 shows a perspective view of time slices from the PP data volume that intersect the Duvernay and Precambrian horizons, respectively. Well “A” was jump correlated from a position approximately 8 km SW of this survey. Both time slices reveal amplitude trends that define a prominent set of N-S oriented features. In the case of the shallower time slice (b), a curved surface trending NE to SW is seen, as well as the N-S trend observed on the deeper time slice.
1500
2000
Tim
em
s
Ireton
Duvernay/Swan Hills
Wabamun
Montney
Colorado
2WS
Gilwood
Precambrian

Duvernay Formation mapping and inversion
CREWES Research Report — Volume 29 (2017) 9
FIG 6. Perspective view showing time slices through the PP seismic volume at (a) 2150 ms. and (b) 2000 ms. The shallower time slice (a) intersects the Duvernay horizon, while time slice (b) intersects the Precambrian surface. Both time slices reveal approximately north-south trending linear topographic features that are interpreted to be associated with the N-S basement fault systems.
Time-structure maps were created throughout the data volume for all of the horizons listed above. Representative time-structure maps of the Ireton and Duvernay horizons are shown in Figure 7. For the time stratigraphic horizons, the overall structural dip is toward the southwest. The Ireton also exhibits distinctive North – South lineations, as well as the curved structural feature trending NE – SW.
The curved SW -NE curved feature seen on the Swan Hills map highlighted in FIG. 7 is interpreted to be the edge of a carbonate reef, with a possible structural closure to the NE. This feature is not aligned with any Precambrian age faulting, it is not seen in the Precambrian or Gilwood structures. This structural feature is also seen on the Ireton map, suggesting structural drape over a preexisting reef front.
(a) (b)

Weir, Lawton, and Lines
10 CREWES Research Report — Volume 29 (2017)
FIG 7. Perspective view of The Swan Hills Formation time-structure displays, derived from the PP data volume. There is a prominent NW- SE feature on the Swan Hills time structure that shows curvature, starting NW – SE trending to NS. This feature is highlighted by the white arrows. Histograms in lower left of each panel show the color scale, the time is in ms.
FIG 8. Perspective view of the Ireton Formation time-structure displays, derived from the PP data volume. The Ireton structure map contains several distinct N – S lineations, as well as a NE – SW feature similar to the Swan Hills map. This feature is highlighted by the white arrows. Histograms in lower left of each panel show the color scale, the time is in ms.
1977
2039
2102
1977
1977
1977
Duvernay Formation mapping and inversion
CREWES Research Report — Volume 29 (2017) 11
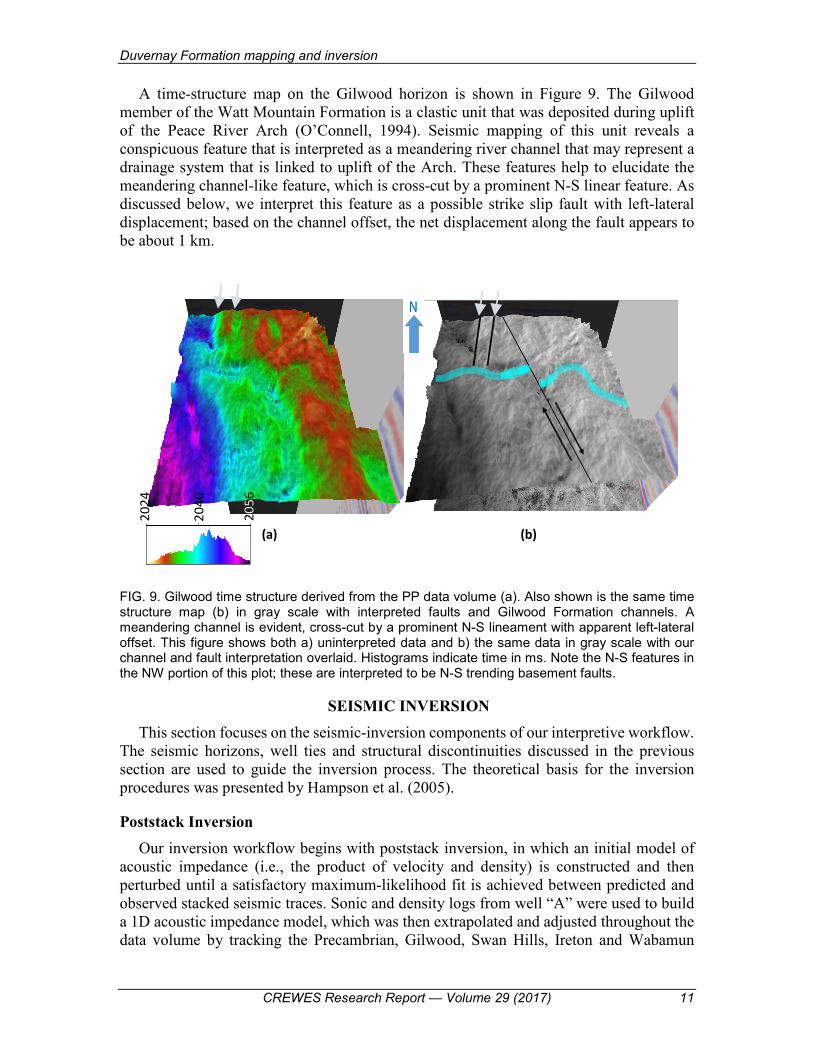
A time-structure map on the Gilwood horizon is shown in Figure 9. The Gilwood member of the Watt Mountain Formation is a clastic unit that was deposited during uplift of the Peace River Arch (O’Connell, 1994). Seismic mapping of this unit reveals a conspicuous feature that is interpreted as a meandering river channel that may represent a drainage system that is linked to uplift of the Arch. These features help to elucidate the meandering channel-like feature, which is cross-cut by a prominent N-S linear feature. As discussed below, we interpret this feature as a possible strike slip fault with left-lateral displacement; based on the channel offset, the net displacement along the fault appears to be about 1 km.
FIG. 9. Gilwood time structure derived from the PP data volume (a). Also shown is the same time structure map (b) in gray scale with interpreted faults and Gilwood Formation channels. A meandering channel is evident, cross-cut by a prominent N-S lineament with apparent left-lateral offset. This figure shows both a) uninterpreted data and b) the same data in gray scale with our channel and fault interpretation overlaid. Histograms indicate time in ms. Note the N-S features in the NW portion of this plot; these are interpreted to be N-S trending basement faults.
SEISMIC INVERSION This section focuses on the seismic-inversion components of our interpretive workflow.
The seismic horizons, well ties and structural discontinuities discussed in the previous section are used to guide the inversion process. The theoretical basis for the inversion procedures was presented by Hampson et al. (2005).
Poststack Inversion Our inversion workflow begins with poststack inversion, in which an initial model of
acoustic impedance (i.e., the product of velocity and density) is constructed and then perturbed until a satisfactory maximum-likelihood fit is achieved between predicted and observed stacked seismic traces. Sonic and density logs from well “A” were used to build a 1D acoustic impedance model, which was then extrapolated and adjusted throughout the data volume by tracking the Precambrian, Gilwood, Swan Hills, Ireton and Wabamun
(a) (b)
2024
2040
2056

Weir, Lawton, and Lines
12 CREWES Research Report — Volume 29 (2017)
horizons. This produced the initial acoustic impedance model, which is illustrated in Figure 9a. This model provided low-frequency (0 - 12 Hz) components that are absent in the stacked seismic data, due to unavoidable bandwidth limitations. The quality of the seismic tie was very good, despite it being a jump tie 8 km. to the SE.
Figure 10b illustrates the poststack inversion results obtained using the Geoview Strata software. A sample set of input traces from the PP data volume is shown in Figure 9c. The model-based inversion procedure uses a linear regression method (Russell and Hampson, 1991) with a linear-programming approach in order to obtain a maximum likelihood waveform fit, using the estimated source wavelet from the well tie. The application of poststack inversion increases the resolution of small-scale features, vertically as well as laterally, and also extends the dynamic range of the model (i.e. the difference between maximum and minimum acoustic impedance values).
FIG. 10. Small region extracted from poststack inversion of the PP data volume, obtained using CGG Geoview software. (a) Initial model; (b), inversion output; and (c) input seismic data. Well “A” is a location 8 km SE of this survey.
Stratal-slices can be used to facilitate geological interpretation for a data volume. This approach is based on extraction of a horizon-parallel slice through the impedance volume, which can then be visualized in map or perspective view. Unlike a time, slice (e.g. Figure 6), amplitude or property variability that is apparent within a stratal slice represents internal variations that occur within a single unit. An example is shown in Figure 12, where a gray-scale rendering is used to accentuate subtle features. This stratal slice was extracted 8 ms. above the base of the Duvernay zone, generating an image that reveals features that are broadly representative of the lithologic variability seen in the outcrop image shown in Figure 3.
Well “A”
Gilwood
Swan HillsDuvernay
Ireton
2000
2100
ms.16792
7000
Acou
stic
impe
danc
e K
g*m
/s
Acou
stic
impe
danc
e K
g*m
/s
7000
16792
(a) (b) (c)

Duvernay Formation mapping and inversion
CREWES Research Report — Volume 29 (2017) 13
FIG 12. Stratal slice showing acoustic impedance variations within the Duvernay Formation, created using a time horizon 8 ms. above the base Duvernay reflector and extracting the amplitude from the poststack inversion volume. Some interpreted trends are highlighted on the right. (a) is a uninterpreted slice with arrows highlighting prominent features, (b) shows an interpretation of three of the stratal boundaries. There are several more stratal features seen on these displays.
PP-PS Joint Inversion The next step in our workflow procedure involves PP-PS joint inversion. Figure 5
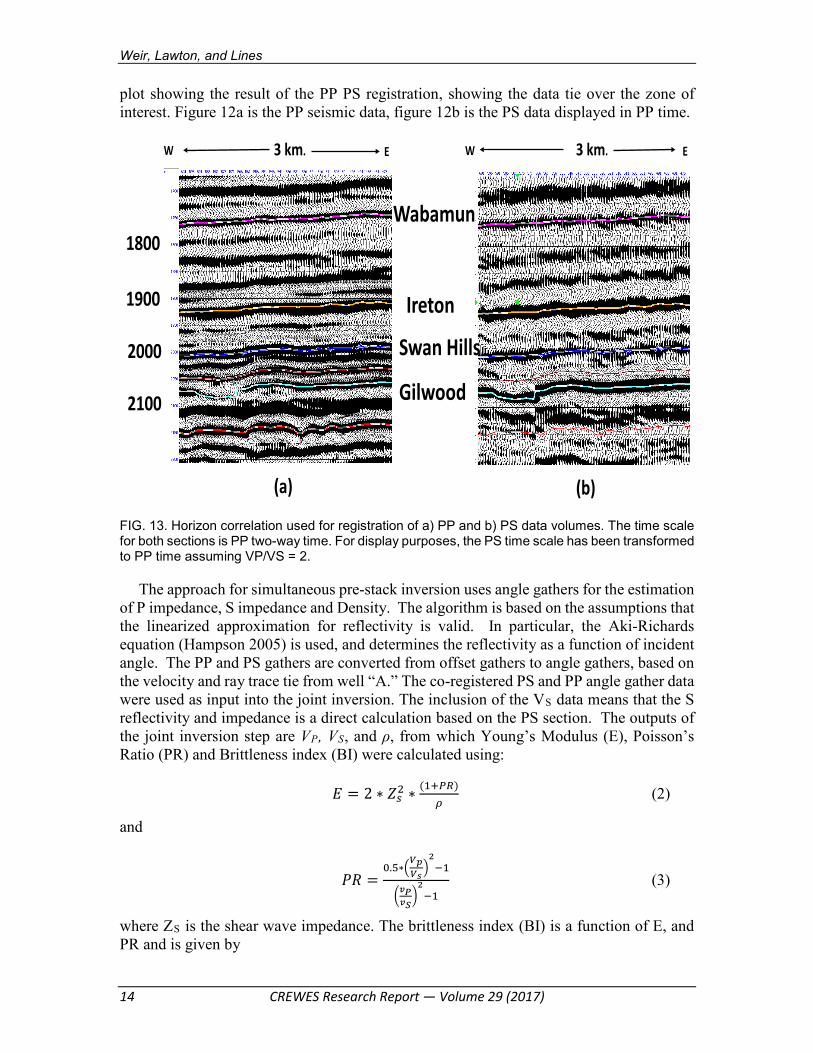
shows the events used for registrations; the seismic events correlated for registration were Colorado, 2WS, Montney, Wabamun, Ireton, Swan Hills, Gilwood, and Precambrian. The same events were correlated on the PS data set, and used to perform the PP-PS registration. A crucial step in this process is registration of the PP to PS data, which requires correlation of seismic events in the PP and PS data sets that correspond to the same geological formation. In practice, if we assume (for the sake of simplicity) that a constant VP/VS = 2 is applicable, the PP and PS sections can be easily compared by displaying the PP data at 1.5 times the scale of the PS data. This simple scaling relationship can be derived easily from the formula for average VP/VS for the interval between two horizons (Stewart et al., 2002)
𝑉𝑉𝑃𝑃𝑉𝑉𝑆𝑆
= 2 �∆𝑡𝑡𝑃𝑃𝑆𝑆∆𝑡𝑡𝑃𝑃𝑃𝑃
� − 1 (1)
where Δt PP and ΔtPS are PP and PS isochrons (time difference) between horizons that have been correlated between PP and PS sections. If the upper horizon is taken as the surface, then it follows from equation (1) that if VP/VS = 2, then the surface-to-depth isochron ratio is ΔtPS/ΔtPP = 1.5. Equation (1) has been used to determine the interval VP/VS for various pairs of horizons, as summarized in Table 1. Figure 12 is a large-scale
1216
5
0970
0
1089
0
10 KM 10 KM
Stratal slice boundaries
Acoustic Impedance(a) (b)
Weir, Lawton, and Lines
14 CREWES Research Report — Volume 29 (2017)
plot showing the result of the PP PS registration, showing the data tie over the zone of interest. Figure 12a is the PP seismic data, figure 12b is the PS data displayed in PP time.
FIG. 13. Horizon correlation used for registration of a) PP and b) PS data volumes. The time scale for both sections is PP two-way time. For display purposes, the PS time scale has been transformed to PP time assuming VP/VS = 2.
The approach for simultaneous pre-stack inversion uses angle gathers for the estimation of P impedance, S impedance and Density. The algorithm is based on the assumptions that the linearized approximation for reflectivity is valid. In particular, the Aki-Richards equation (Hampson 2005) is used, and determines the reflectivity as a function of incident angle. The PP and PS gathers are converted from offset gathers to angle gathers, based on the velocity and ray trace tie from well “A.” The co-registered PS and PP angle gather data were used as input into the joint inversion. The inclusion of the VS data means that the S reflectivity and impedance is a direct calculation based on the PS section. The outputs of the joint inversion step are VP, VS, and ρ, from which Young’s Modulus (E), Poisson’s Ratio (PR) and Brittleness index (BI) were calculated using:
𝐸𝐸 = 2 ∗ 𝑍𝑍𝑠𝑠2 ∗(1+𝑃𝑃𝑃𝑃)
𝜌𝜌 (2)
and
𝑃𝑃𝑃𝑃 =0.5∗�
𝑉𝑉𝑝𝑝𝑉𝑉𝑠𝑠�2−1
�𝑣𝑣𝑃𝑃𝑣𝑣𝑆𝑆�2−1
(3)
where ZS is the shear wave impedance. The brittleness index (BI) is a function of E, and PR and is given by
Wabamun
Ireton
Swan Hills
Gilwood
1900
1800
2000
2100
(a) (b)
3 km. 3 km.W WE E

Duvernay Formation mapping and inversion
CREWES Research Report — Volume 29 (2017) 15
𝐵𝐵𝐵𝐵 = 100 ∗ �𝑤𝑤 ∗ (𝑃𝑃𝑃𝑃max −𝑃𝑃𝑃𝑃)𝑃𝑃𝑃𝑃max −𝑃𝑃𝑃𝑃min
+ (1 − 𝑤𝑤) ∗ (𝐸𝐸−𝐸𝐸min )𝐸𝐸max −𝐸𝐸min
� (4)
where w is a weighting factor that controls the relative importance of Young’s Modulus and Poisson’s Ratio. Here, w = 0.5 is used. A high BI is considered to be a desired lithological trait for hydraulic fracture completion (Rickman et al., 2008).
Figure 14 presents stratal slices that depict E and PR extracted from the same Duvernay stratal interval as in Figure 10. These stratal slices highlight several distinct features. For example, the NE-SW structure that follow the Swan Hills structure shows a distinct trend from SW to NE. There are N-S features aligned with the interpreted deep-seated basement faults. The very low PR values seen in the Northern most portion of the survey
FIG. 13. Stratal slices showing (a) Young’s Modulus (units: GPa) and (b) Poisson’s ratio, from joint PP-PS prestack inversion. The data are extracted from the same stratal slice within the Duvernay interval that is shown in figure 10. This slice is conformable to the Swan Hills structure. A – A, and B’-B are the plots shown in FIG 16 and 17. may be related to lack of fold, and edge effects.
Figure 15a shows a cross plot of E versus PR for the Duvernay interval, including all data values from the simultaneous inversion volume from the top Duvernay horizon to the base Duvernay horizon. For comparison, the points are overlaid onto theoretical values of E versus PR (Cho et al., 2015) as shown in Figure 14b. The Duvernay points cluster within a relatively confined region near the middle of the theoretical values for quartz-clay and quartz-limestone mixtures. The Duvernay values also appear to fall approximately along a trend of constant bulk modulus vs. PR slope, as indicated on the graph by a set of black curves.
.19
9 km. .25
.22
(a)
53
36
45
E PR
(b)
9 km.
A’ A’AB’
B

Weir, Lawton, and Lines
16 CREWES Research Report — Volume 29 (2017)
FIG. 15. a) Cross plot showing Young’s Modulus (E) versus Poisson’s Ratio (PR) from prestack PP-PS inversion for data samples within the Duvernay interval from Figure 14. These points are grouped into 4 seismic lithology zones, which are displayed in Figures 16 and 17. Cross plot of theoretical values of E and PR (Cho et al., 2015) showing that the Duvernay points fall approximately along a line of constant slope of bulk modulus vs. PR; these cluster near the middle of the range for quartz-clay and quartz-limestone mixtures. The highest brittleness index corresponds to high E and low PR and thus would plot toward the top left corner of the graph (the region highlighted in red).
The cross-plot in Figure 14a has been used to group the data into four distinct seismic-lithology zones on the basis of PR. A seismic cross section in Figure 15 and 16 display the PP-PS inversion results, where each data point is assigned a color according to the parameter ranges of these seismic lithology zones. Although the zones are defined in Figure 15 based on the range of Duvernay values, these have been applied to data points that fall outside of the Duvernay interval. Along this west-east profile, the Duvernay interval is classified from zones 1 to 4 where zone 1 may be considered to be more brittle as it is characterized by a higher E and lower PR. Zone 4 is considered to be the least brittle. The N-S faulting, and the deeper Swan Hills structure appear to be marked by a pronounced lateral transition from low to higher brittleness. The potential significance of this transition is discussed below.
Figure 18 (a) shows interpreted near-vertical basement-rooted faults seen on all horizons from the Precambrian to the Duvernay. Figure 18 (b) is a plot of the brittleness index calculated using equation 4. The major N-S fault is shown in figure 16. Warm colors are high in the brittleness index, cold colors are low values. This system of faults was picked and correlated is based on matching seismic displacements, from the Ireton to the top of Precambrian basement. Strike-slip movements were interpreted using observed displacement on the Gilwood channels. Combined, these two maps show key elements in evaluating the Duvernay; structure controls, and lithologic properties.
Poisson’s Ratio Poisson’s Ratio.1 .2 .3
Youn
g’s
Mod
ulus
E 50
40
30
20
(a) (b)

Duvernay Formation mapping and inversion
CREWES Research Report — Volume 29 (2017) 17
FIG 16.N-S profile showing E vs. PR data from prestack PP-PS inversion, colored based on the seismic lithology zones in Figure 14. The top and base of the Duvernay interval are highlighted with green arrows. Note the red to blue contrast across the Duvernay interval. FIG 13 shows the location of this seismic section.
DISCUSSION Although standardized resource-play development schemes, such as horizontal drilling
on a regular grid and use of uniform completion designs, may be well suited to homogeneous reservoir conditions, they are not optimal for the type of geologic complexity that is likely to prevail in the case of the Duvernay play. For example, a uniform pattern of wells may fail due to reservoir heterogeneity and the presence of faults, while uniform perforation intervals may not be suitable, particularly when a wellbore crosses a facies boundary with varying brittleness. The stratigraphically equivalent Perdrix Formation in the southern Canadian Rockies (Figure 3) exemplifies, in a spectacular manner, how changes in Duvernay lithofacies may be linked to increments of reef growth. Outcrop analysis also reveal how the off-reef depositional environment varies over spatial scales of

Weir, Lawton, and Lines
18 CREWES Research Report — Volume 29 (2017)
FIG. 17. A N-S profile showing E vs. PR data from prestack PP-PS inversion, colored based on the seismic lithology zones defined in Figure 14. The top and base of the Duvernay interval are highlighted with green arrows. Note the red to yellow contrast across the Duvernay interval.
10s to 100s m, which are compatible with resolution capabilities of seismic data. Stratal slices from 3D seismic inversion volumes, as depicted in Figures 10, 13 and 16, reveal coherent patterns of parameter variability that likely reflect varying reservoir conditions due, in part, to distinctive lithofacies arising from episodes of Leduc reef building.
The Duvernay Formation is also highly structured, and development of this unconventional play must consider structural controls along with depositional heterogeneity. Depending upon their present-day permeability structure, faults could represent either a barrier or a pathway for fluids in the subsurface. The presence of faults can thus exert a major influence on reservoir characteristics, even if the accumulated offset is relatively small. The expression of such a fault system in a 3D seismic volume depends, to a large degree, on whether past tectonic activity was syn- or post-depositional. Syn-depositional faulting could lead to some step-like facies change that is localized across a fault; for example, if the total organic content of the Duvernay Formation varies systematically across a fault, this would lead to changes in E, PR and the BI (Soltanzadeh et al., 2015). On the other hand, post-depositional faulting could generate seismically detectable linear features that are aligned along a fault. Such linear features could be associated with a damage zone around seismically invisible fault core, or from fluid alteration in proximity to a permeable fault. Hence, three pertinent ways in which an active fault system could affect lateral facies distribution are: (i) syn-depositional faulting could create a lower energy depositional environment on the downthrown sides of the fault in a marine setting; (ii) post-depositional faulting could be manifested by a damage or alteration zone; and (iii) strike slip faulting could transport material laterally such that different facies are juxtaposed against each other.
7 KM
1900
2050
BB’
Duvernay
Zone 1
Zone 2
Zone 3
Zone 4
BRI
Duvernay Formation mapping and inversion
CREWES Research Report — Volume 29 (2017) 19
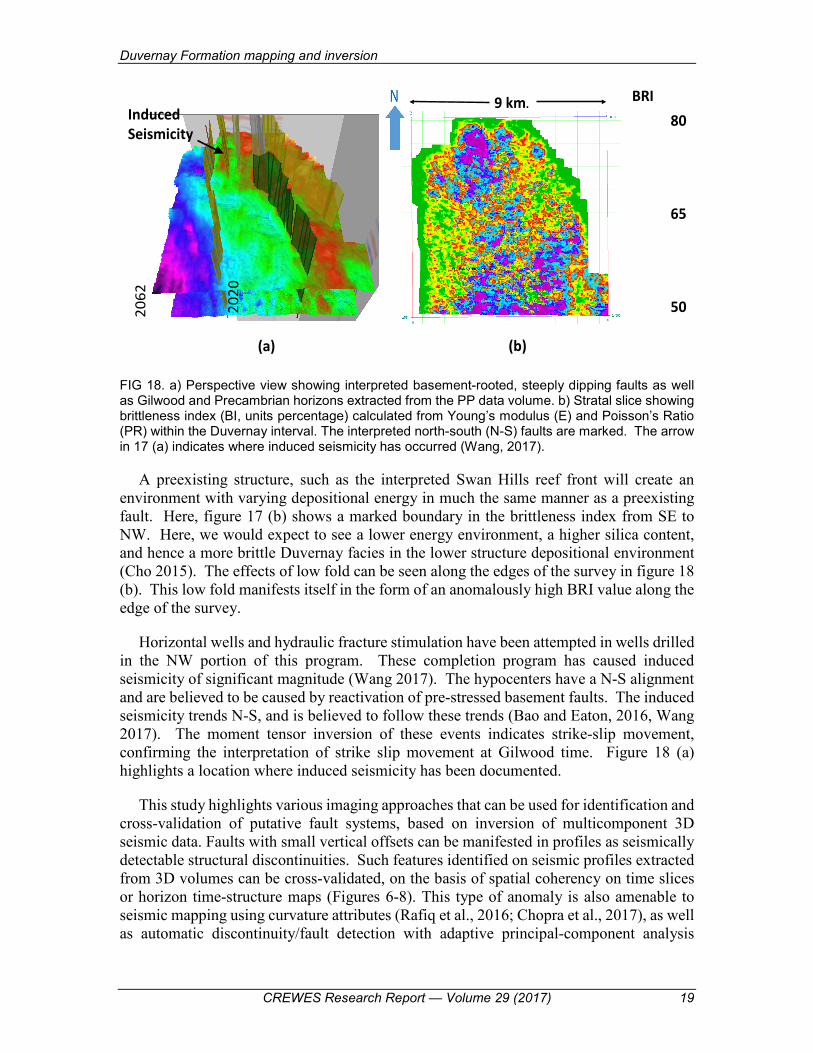
FIG 18. a) Perspective view showing interpreted basement-rooted, steeply dipping faults as well as Gilwood and Precambrian horizons extracted from the PP data volume. b) Stratal slice showing brittleness index (BI, units percentage) calculated from Young’s modulus (E) and Poisson’s Ratio (PR) within the Duvernay interval. The interpreted north-south (N-S) faults are marked. The arrow in 17 (a) indicates where induced seismicity has occurred (Wang, 2017).
A preexisting structure, such as the interpreted Swan Hills reef front will create an environment with varying depositional energy in much the same manner as a preexisting fault. Here, figure 17 (b) shows a marked boundary in the brittleness index from SE to NW. Here, we would expect to see a lower energy environment, a higher silica content, and hence a more brittle Duvernay facies in the lower structure depositional environment (Cho 2015). The effects of low fold can be seen along the edges of the survey in figure 18 (b). This low fold manifests itself in the form of an anomalously high BRI value along the edge of the survey.
Horizontal wells and hydraulic fracture stimulation have been attempted in wells drilled in the NW portion of this program. These completion program has caused induced seismicity of significant magnitude (Wang 2017). The hypocenters have a N-S alignment and are believed to be caused by reactivation of pre-stressed basement faults. The induced seismicity trends N-S, and is believed to follow these trends (Bao and Eaton, 2016, Wang 2017). The moment tensor inversion of these events indicates strike-slip movement, confirming the interpretation of strike slip movement at Gilwood time. Figure 18 (a) highlights a location where induced seismicity has been documented.
This study highlights various imaging approaches that can be used for identification and cross-validation of putative fault systems, based on inversion of multicomponent 3D seismic data. Faults with small vertical offsets can be manifested in profiles as seismically detectable structural discontinuities. Such features identified on seismic profiles extracted from 3D volumes can be cross-validated, on the basis of spatial coherency on time slices or horizon time-structure maps (Figures 6-8). This type of anomaly is also amenable to seismic mapping using curvature attributes (Rafiq et al., 2016; Chopra et al., 2017), as well as automatic discontinuity/fault detection with adaptive principal-component analysis
BRI
50
80
65
2062
2020
9 km.InducedSeismicity
(a) (b)

Weir, Lawton, and Lines
20 CREWES Research Report — Volume 29 (2017)
(Weir et. Al. 2018). Lateral offset of paleogeographic features such as a river channel (Figure 8) provides a tool to measure lateral fault offset, which is otherwise very difficult to quantify in a horizontally layered medium. In this study, seismic images imply that strike-slip faulting was active during or after formation of a Middle Devonian Gilwood river channel.
As argued above, seismic lithology parameters may provide important clues for distinguishing syn- and post-depositional faulting. For example, some step-like facies change across a fault, or preexisting structure. The PP-PS inversion results define an inferred north-south feature (Figures 14 and 15), is interpreted here to indicate that syn-depositional tectonic activity may have taken place during Leduc reef buildup and deposition of the Duvernay. Various linear anomalies that lack such a step-like change are also documented in this study, suggesting that the Duvernay Formation in this area may be transected by a fault system that includes younger (i.e. post-depositional) elements.
Defining the fault architecture is thus crucial to well planning. The objective of a fracture stimulation is to inject proppant into the Duvernay Formation, open up the fracture porosity and thus produce hydrocarbons. In the presence of a critically stressed basement fault, the fault may become a thief zone; for example, in a neighboring part of the Duvernay play Bao and Eaton (2016) found evidence for fluid loss and associated induced seismicity defining a north-south lineament. Recorded seismic events were reported to have hypocenters extending below the Duvernay into the uppermost part of the basement.
Finally, as noted by Cho et al. (2015) a desired combination for brittleness is a high E and a low PR. Hence, a desired reservoir is easy to fracture but sufficiently strong to hold the fractures open long enough for placement of proppant to occur. Attempting to induce a fracture in a rock with low E would produce poor results, as the rock material would simply collapse back into the induced fracture, sealing it off. Similarly, attempting to induce a fracture in a high PR material is more likely to produce ductile deformation, with less tendency for a fracture to form. In the absence of faults, fracture stimulation should thus be targeted toward areas of high brittleness while avoiding more ductile facies. While straightforward in concept, the use of brittleness index has many complications and is not straightforward. Nevertheless, the PP-PS seismic inversion in this study shows promise for mapping seismic lithology parameters to aid in development of Duvernay reservoirs.
CONCLUSIONS The Duvernay play is prone to induced seismicity and is likely to exhibit considerable
lithologic heterogeneity in the subsurface, at scales that are seismically resolvable. Consequently, we recommend that planning for drilling and hydraulic-fracturing well-completions programs should consider both reservoir facies and present-day fault structure. In this study, we have developed a new workflow for interpretive inversion of multicomponent 3D seismic data, guided by structural analysis. Our workflow requires AVO-compliant data processing and makes use of poststack inversion to obtain an acoustic-impedance volume, followed by correlation of horizons between PP and PS sections and prestack PP-PS AVO inversion. The output parameters from the inversion, consisting of VP, VS and ρ, are used to calculate data volumes containing Young’s Modulus (E), Poisson’s Ratio (PR) and brittleness index (BI) (e.g., Rickman et al., 2008).

Duvernay Formation mapping and inversion
CREWES Research Report — Volume 29 (2017) 21
Various presentation formats for the inversion results, including perspective views and stratal slices, provide insights for geological interpretation of the data.
The inversion results reveal spatially coherent patterns of seismic lithology parameter variability that support a number of key interpretations. Lithofacies variations within the Duvernay Formation likely reflect episodes of growth of proximal Leduc reef complexes. These processes lead to variations in E, PR and BRI, which indicate that some areas within the survey volume are better suited than other areas for hydraulic fracturing. Fault systems that are characterized by relatively small vertical offsets are expressed by structural discontinuities and, more commonly, curvature anomalies defined by fold hingelines. The largest fault is a steeply dipping structure with a north-south strike; this fault produced approximately 1 km of left-lateral strike-slip offset, based on inferred displacement of a Middle Devonian Gilwood river channel.
The interpreted Swan Hills reef front has produced an abrupt change in brittleness in the Duvernay formation from the high side to the low side. This change is interpreted to be the result of a lower energy marine depositional environment, caused by pre-existing Swan Hills structures at the time of Duvernay shale deposition.
A step-like discontinuity in brittleness index, derived from the PP-PS inversion results, provides evidence that for syn-depositional motion on this fault. Other seismic anomalies are quasi-linear features that lack such a step-like discontinuity; these anomalies are interpreted as damage or alteration zones near post-depositional faults that belong to a complex fault network in this region.
From an economic perspective, basement faulting may produce an undesirable result when a fracture stimulation is attempted nearby. The objective of a completion program is for the hydraulic fracture system to remain within the formation. The presence of pre-existing critically stressed faults can produce the undesirable result of induced seismicity.
ACKNOWLEDGEMENTS We are grateful to Arcis Seismic Solutions for providing the 3D multicomponent data
used in this study and for PP and PS AVO-compliant processing that was used for this study. We thank the sponsors of the Microseismic Industry Consortium and CREWES for their financial support of this study. This work was also funded by NSERC (Natural Science and Engineering Research Council of Canada) through grants CRDPJ 461179-13, CRDPJ 474748-14, IRCPJ/485692-2014, and IRCSA 485691. We thank Dr. Brian Russell for his technical advice and consultation as well as, Dr. Per Pederson, staff and students at the University of Calgary for technical assistance. We thank Sarah Reid for assistance with graphics and figures. We are grateful to CGG for providing Strata software used in this study. We thank Dr. Dave Eaton for his input on seismic fault focal mechanisms, and editing.
REFERENCES Allen, J. L., and C.P. Peddy, 1993, Amplitude variation with offset: Gulf Coast case studies, in Allen, J. L.,
and, C. P. Peddy: Geophysical Developments Series, 4, 9-22. Baig, A.M., and T. Urbancic, 2012, Structural controls on vertical growth of hydraulic fractures as revealed
through seismic moment tensor inversion analysis: CSPG Conferences

Weir, Lawton, and Lines
22 CREWES Research Report — Volume 29 (2017)
Abstract Archive (2012). Bao, X., and D. W., Eaton, 2016, Fault activation by hydraulic fracturing in western Canada: Science, 354,
1406-1409. Calvert, A., E. Jenner, R. Jefferson, R. Bloor, N. Adams, R. Ramkhelawan, and C. St. Clair, 2008, Preserving
azimuthal velocity information: Experiences with cross-spread noise attenuation and offset vector tile preSTM: 78th Annual International Meeting, SEG, Expanded Abstracts, 207-211.
Castagna, J. P., 1993, Petrophysical imaging using AVO: The Leading Edge, 12, 172–179. Cho, David, and M. Perez, 2014, Brittleness revisited: CSPG Conferences Abstract Archive (2014). Chopra S., R. K. Sharma, A. K. Ray, H. Nemati, R. Morin, B. Schulte, and D. D’Amico, 2017, Seismic
reservoir characterization of Duvernay shale with quantitative interpretation and induced seismicity considerations – A case study: Interpretation, 5 no.2, T 185 – T 197.
Creaney, S, and J. Allan. 1990, Hydrocarbon Generation and Migration in the Western Canada Sedimentary Basin, Classic Petroleum Provinces, in Mossop, G.D. and Shetsen, 1994: Atlas of the Western
Canada Sedimentary Basin, Chapter 31. Chopra, S., and K. J. Marfurt, 2013, Preconditioning seismic data with 5D interpolation for computing
geometric attributes: The Leading Edge. 32 no.12, p 1456-1460 Cui, Albert, R. Wust, and B. Nassichuk, 2017, A comparison study of existing and new mineralogical,
(geo)mechanical, and petrophysical brittleness indices of the Alberta Montney and their applicability for optimizing well Stimulations: Expanded Abstracts CSPG Conferences Abstract Archive (2017).
Davis, M. K., 2013, A Regional Assessment of the Duvernay Formation; a World-Class Liquids-Rich Shale Play: CSPG Conferences Abstract Archive (2013).
Dommisse, R., 2013, 3-D Geological interpretation examples in unconventional shale reservoirs: Expanded Abstracts. Unconventional Resources Technology Conference.
Dunn, L., G. Schmidt, K. Hammermaster, M. Brown, R. Bernard, E. Wen, R. Befus, and S.Gardiner, 2012,The Duvernay Formation (Devonian): sedimentology and reservoir characterization of a shale gas/liquidsplay in Alberta, Canada: Expanded Abstracts, CSPG Conferences Abstract Archive (2012).
Dusseault, M. and J. McLennan, 2011, Massive multistage hydraulic fracturing: Where are we? 45 US Rock Mechanics/Geomechanics Symposium.
Eaton, D.W. and D.C. Lawton, 1992, P-SV stacking charts and binning periodicity: Geophysics, 57, 745-748.
Eaton, D.W., G.M. Ross, and J. Hope,1999, The rise and fall of a cratonic arch: A regional seismic perspective on the Peace River Arch, Alberta: Bulletin of Canadian Petroleum Geology, 47 no.4, 346-361.
Fowler, P.J., 1997, A comparative overview of prestack time migration methods: 78th Annual International Meeting, SEG, Expanded Technical Abstracts, 207 - 211.
Goodway, B., M. Perez, J. Varsek, and C. Abasco, 2010 Seismic petrophysics and isotropic anisotropic AVO methods for unconventional gas exploration: The Leading Edge, 29, 1500-1508.
Hammermaster, K., 2012, The Duvernay Formation (Devonian): An emerging shale liquids play in Alberta, Canada: Expanded Abstracts, CSPG Conferences Abstract Archive (2012).
Hampson D., B. Russell, 2005, Simultaneous inversion of pre‐stack seismic data: 75th Annual International Meeting, SEG Expanded Technical abstracts, 2668.
Hoeber, H., S. Butt, D. Davies, S. Campbell, and T. Ricketts, 2005. Improved 4D seismic processing: Foinaven case study: 75th Annual International Meeting, SEG, Expanded Abstracts, 207-211.
Jin, S., G. Cambois, and C. Vuillermoz, 2000, Shear-wave velocity and density estimation from PS-wave AVO analysis: Application to an OBS dataset from the North Sea.: Geophysics, 65, no.5, 1446-1454.
Kelamis, P.G., E.F. Chiburis, and S. Shahryar, 1990, Radon multiple elimination, a Practical methodology for land data: 60th Annual International Meeting, SEG, Expanded Abstracts, 1611-1613.
Lee, S., M.S. Ho, and G.W. Purnell, 1991, Preprocessing for amplitude-versus-angle (AVA) analysis of land seismic data: 61st Annual International Meeting, Society of Exploration Geophysicists, Expanded Abstracts, 1070-1071.
MacKay, M, D. Eaton, C. Clarkson, 2017, The Geomechanical system of the Duvernay Formation: part 1. Outcrop, core, and microseismic interpretation. Interpretation, Submitted (2017).

Duvernay Formation mapping and inversion
CREWES Research Report — Volume 29 (2017) 23
Meek, R., B. Suliman, R. Hull, H. Bello, and D. Portis, 2013, What Broke? Microseismic analysis using seismic derived rock properties and structural attributes in the Eagle Ford play: Expanded Abstracts, Unconventional Resources Technology Conference.
Millar John, and Bancroft, John C, Multigrid 2004, Deconvolution of seismic data: CREWES research report,volume 16.
O'Connell, S.C. ,2017, Geological history of the Peace River Arch, in Mossop, G.D. and Shetsen, 1994, Atlas of the Western Canada Sedimentary Basin, Chapter 28.
Pennington, W.D.,2001, Reservoir geophysics: Geophysics, 66, 25-30. Rafiq, A., D.W. Eaton, A. McDougall, and P.K. Pedersen, 2016, Reservoir characterization
usingmicroseismic facies analysis integrated with surface seismic attributes: Interpretation, 4,no. 2, T167-T181.
Refayee, H., H. Jaglan, and S. Adcock, 2016, Fault and Fracture Detection in Unconventional Reservoirs: A Utica Shale Study: Expanded Abstracts, Unconventional Resources Technology Conference.
Rickman, R., M. J. Mullen, J.E. Petre, W.V. Grieser, and D. Kundert, 2008, A practical use of shale petrophysics for stimulation design optimization: All shale plays are not clones of the Barnett Shale: SPE Annual Technical Conference and Exhibition, Society of Petroleum Engineers.
Russell, B. ,2014, Seismic Reservoir Characterization and Pre-stack Inversion in Resource Shale Plays, Search and Discovery article #41467.
Russell, B. and D. Hampson, 1991. Comparison of poststack seismic inversion methods. 61st annual international meeting, SEG expanded abstracts, 876-879.
Schultz, R., R.Wang, Y. Gu, J. Haug, and G. Atkinson, G. 2017. A seismological overview of the induced earthquakes in the Duvernay play near Fox Creek, Alberta: Journal of Geophysical Research Solid Earth, 122 no.1, 492-505.
Sharma, R., S. Chopra, 2014, Identification of thin sweet spots in the Duvernay Formation of north central Alberta: Search and discovery Article. Soltanzadeh, M., A. Fox, and N. Rahim, 2015, Application of an Integrated Approach for the Characterization of Mechanical Rock Properties in the Duvernay Formation: Expanded Abstracts, CSPG
Conferences Abstract Archive (2015). Stewart, R.R., J.E. Gaiser, R.J. Brown, and D.C. Lawton, 2002, Converted-wave seismic exploration
methods: Geophysics, 67 no. 5, 1348-1363. Switzer, S.B., W.G. Holland, D.S. Christie, G.C. Graf, A.S. Hedinger, R.J. McAuley, R.A. Wierzbicki, and
J.J. Packard, 1994. Devonian Woodbend-Winterburn strata of the Western Canada Sedimentary Basin. In 2004, Geological Atlas of the Western Canada sedimentary basin. G.D. Mossop and I. Shtsen, Calgary, CSPG and ARC, 165-202. chapter 12.
Taner, M.T. and F. Koehler, 1981, Surface consistent corrections: Geophysics, 46 no.1, 17-22. Wang Ruijia, Y J. Gu1, R Schultz, Miao Zhang, and A Kim, 2017, Source Characteristics and Geological
Implications of the January 2016 Induced Earthquake Swarm near Crooked Lake, Alberta, Geophysics, J. Int. 210, 979-988
,Weir, R. M., Eaton, D, Lines, L. Lawton, 2017, Integrating seismic derived rock properties with horizontal well induced fractures in the Duvernay Formation: GeoConvention, 2017 Expanded Abstracts, CSPG Conferences Abstract Archive (2017).
Weir, R. M., Eaton, D, Lines, L. Lawton, E . Ekpo, 2017, Inversion and interpretation of seismic-derived rock properties in the Duvernay play: Interpretation,2018

Weir, Lawton, and Lines
24 CREWES Research Report — Volume 29 (2017)
APPENDIX 1. Table A1. Interval velocity tables from the PP PS registration These values were picked at a central CMP in the survey to compare PP and PS travel times. These times represent travel times from the seismic processing datum at 1100 meters.
VP/VS 2WS Doe Wab. Ireton SWH Gill ~Prec PP Time (ms)
Colo 2.15 1.99 2.15 2.09 2.05 2.07 2.18 971
2WS 1.991 2.09 1.88 1.86 1.981 2.02 2.156 1253
Wab. 2.148 1.88 2.03 1.80 1.78 1.94 2.06 1766
Ireton 2.088 1.88 1.80 2.03 1.814 2.09 2.06 1933
SWH 2.050 1.981 1.87 1.814 2.01 2.411 2.18 2000
Gill. 2.073 2.017 1.93 2.09 2.411 2.02 2.02 2068
~Prec. 2.179 2.02 2.06 2.06 2.18 2.02 2.02 2151
PS time (ms)
1484 1950 2674 2909 2994 3110 3298 Vp/Vs
Colo Colorado Group Cretaceous
2WS Second White Speckled Shale Cretaceous
Wab Wabamun Formation Devonian
Ireton Ireton Formation Devonian
Gill Gillwood Member Devonian

Duvernay Formation mapping and inversion
CREWES Research Report — Volume 29 (2017) 25
APPENDIX 2
FIG. A2. Brittleness calculations. These 4 plots are PR vs. E for (a) 2WS, (b) Wabamun Formation, (c) Duvernay Formation (target), and (d) Gilwood. The vertical and horizontal scales are identical for the sake of comparison.
(a)
(d)(c)
(b)
You
ng
’s M
od
ulu
s E
You
ng
’s M
od
ulu
s E
You
ng
’s M
od
ulu
s E
You
ng
’s M
od
ulu
s E