Dutchess County Division of Aging Services Needs Assessment · Dutchess County Division of Aging...
78
Dutchess County Division of Aging Services Needs Assessment Comprehensive Report 2011 William R. Steinhaus, County Executive Betsy Brockway, Commissioner, Services for Aging Veterans and Youth Mary Kaye Dolan, Director, Division of Aging Services
Transcript of Dutchess County Division of Aging Services Needs Assessment · Dutchess County Division of Aging...
Dutchess County Division of Aging Services
Needs Assessment
Comprehensive Report
2011
William R. Steinhaus, County Executive Betsy Brockway, Commissioner, Services for Aging Veterans and Youth
Mary Kaye Dolan, Director, Division of Aging Services
- 2 -
Dutchess County Division of Aging Services
Advisory Board Members
Raymon Oberly, President
Robert Allers
Betsy Brockway
Kathleen DeLisa
Kenneth J. Doka, PhD.
Betsy Fratz
Barbara Good
Wendy Jackson
Sabrina Jaar Marzouka
Barbara Jensen
Raymond Joyce
Edward A. Koziol
Leon Krakower, M.D.
Danielle Marxer
Patty Moore
Howard Nichols
Raymon Oberly
Dana Pavelock
Hon. Steve White
- 3 -
Long Term Care Council Members
Barbara Good, President
Shirley Adams
Robert Allers
Mary Brendler
Monica Finley
Cynthia Fiore
Judy Fraleigh
Betsy Fratz
Katherine Graff
Benjamin Hayden, Ph.D.
May Mamiya
Maureen Marchessault
Ellen Ott
Doris Reap
Cynthia Rodriquez
Mary Scileppi
Elaine Sproat
Richard Trocino
Dawn Whitten
Joan Wright
Needs Assessment Advisory Committee
Mary Kaye Dolan, Chair
Patricia Brown
Margaret Kwet
John Beale
Raymon Oberly

- 4 -
Acknowledgements
Thanks to the following for their assistance in various capacities throughout the needs assessment process from planning to survey distribution to tabulation to editorial assistance:
Division of Aging Services Staff members: Teiqua McRae, Russell Boris, Donna O’Brien, Theresa Zoller, Crystal Galloway, Patricia Brown, Margaret Kwet, Joseph Ryan, Nutrition Services Staff Department of Services for Aging, Veterans and Youth staff: Commissioner Betsy Brockway and Confidential Secretary Carole Lehrer Tracy Lee, Dutchess County OCIS Jean Curlee, Senior Exercise Program Coordinator Senior Housing Managers Aging Services Advisory Board and Long Term Care Council Emily Pantel, Vassar College Field Work Intern Senior Exercise Program and Brain Games Volunteers

5
Table of Contents/Outline
I. History/Background……………………………………………………………………….. 7 II. The Needs Assessment Process: Methodology and Data Sources………….….… 7 A. Description of Methodology………………………………………………………..…… 7 B. Description of Data Sources and Collection……………………………………..…… 8 1. Senior Survey 2. Key Informant Survey 3. Caregiver Survey 4. Dutchess NY Connects Intakes 5. Public Hearings 6. Dutchess County Community Health Report 7. National Unmet Need for Services Data 8. Outcomes and Client Satisfaction Data C. Advisory Board Role in Process…………………………………………….…….…… 10 D. Inclusion of Target Populations…………………………………………….……….…. 11 III. Data Presentation………………………………………………………………….…….….. 11 A. Senior Survey Results…………………………………………………………….....…. 11 B. Key Informant Survey Results…………………………………………….………….... 51 C. Caregiver Survey Results………………………………………………….……....…... 52 D. Dutchess NY Connects Intakes Data……………………………………………..…... 54 E. Public Hearings Findings………………………………………………….……….…… 54 F. Dutchess County Community Health Report Findings………………………….…... 55 G. National Unmet Need for Services Data………………………………….…….…..... 55 H. Outcomes and Client Satisfaction Data………………………………………….....… 56 IV. Analysis and Findings……………………………………………………………….…..…. 58 A. The Senior Population……………………………………………………….……....…. 58 B. Caregivers……………………………………………………………………………..… 58 C. Key Informants………………………………………………………………………..…. 59 D. Other Data Sources………………………………………………………….…….……. 59 E. Discussion and Designation of Areas of Greatest Unmet Need………………….... 60 V. Establishment of Priorities…………………………………………………………….…... 61 VI. Resource Inventory……………………………………………………………………...….. 62 VII. Appendices………………………………………………………………………………...… 63 A. 2007 Senior Survey Results………………………….………………….…………….. 63 B. 2007 Key Informant Survey Results…………………………………….……………. 64 C. Public Hearing Minutes………………………………………………….……………... 65 D. Dutchess NY Connects Intake Detail………………………………….……………… 72 E. Resource Inventory Screen Shots……………………………………..……………… 75

6
THIS PAGE INTENTIONALLY LEFT BLANK.

7
I. History/Background
In setting priorities and making funding decisions, the Dutchess County Division of Aging Services considers a number of factors. These include: service utilization, satisfaction and outcomes; funding availability and requirements; needs of the older population and their caregivers. It is a federal and state requirement that emphasis be placed on those in certain target groups including those with greatest economic or social need. The Dutchess County Division of Aging Services, as part of its planning process, and as a result of its role as the Area Agency on Aging in Dutchess County, conducts a Needs Assessment in conjunction with the development and submission of its Four Year Plan. In Dutchess County, the Needs Assessment process is initiated the year before the Four Year Plan is due in order to allow for time to gather data, analyze results and apply findings to the Four Year Plan. The senior population is truly growing in Dutchess County. Some facts to consider from the 2010 United States Census: • In 2000 there were 44,660 residents of Dutchess County over age 60, making up
15.95% of the total county population; • In 2010 there were 57,062 residents of Dutchess County over age 60, making up
19.18% of the total county population; • Dutchess County’s total population grew 6.55% between 2000 and 2010, but the
age 60 and over population grew by 27.77%; and • Not only has the growth in the senior population far outpaced the growth in the
overall Dutchess County population, but the growth of the older senior population has been remarkable as well. The age 75 and over population grew 22.82%, and the age 85 and over population grew 36.44% between 2000 and 2010.
Census data, including demographic profiles for each Dutchess County municipality, is available on the Dutchess County Government website at: http://www.co.dutchess.ny.us/CountyGov/Departments/Planning/19745.htm As the senior population grows, so will the need for services for this population and their caregivers. II. The Needs Assessment Process: Methodology and Data Sources
A. Description of Methodology
A multifaceted approach to the Needs Assessment was once again employed. Additionally, an internal committee made up of the Director, Nutrition Director, Intake Case Manager and Advisory Board President was appointed to advise the Division of Aging Services throughout the process. The 2011 Needs Assessment included several different data gathering methods used to reasonably quantify unmet need. These methods included conducting and analyzing surveys specifically designed for the

8
Needs Assessment as well as review of other literature and available data.
The rationale utilized in selecting this approach was to develop a needs assessment that relied largely on input from a wide array of senior citizen residents of Dutchess County but also included input from key informants and caregivers. Other secondary sources were identified that would allow for additional input. This methodology and rationale allowed for compliance with the state and federal regulations, particularly Section 6653.4 of Title 9 of the New York Code of Rules and Regulations which requires that Area Plans include a needs assessment “based on surveys or interviews conducted by the area agency, records of the area agency, current secondary data from other agencies, public comments at advisory committee meetings.” Using the aforementioned regulations as a basis, and from the various sources of data available and research that could reasonably be conducted by the agency, the data sources outlined below were selected to be included in the Needs Assessment and to reasonably quantify unmet need. This methodology and rationale were used to yield: • An assessment of the conditions of elderly people that may limit their ability to
remain in or return to their homes and to participate in family and community life; • Quantification of the extent of the needs of elderly people in Dutchess County for
supportive services, nutrition services, legal services, senior centers; • Identification of the unique needs, if any, of specific target groups such as minority
groups, the over age 75 population and low income elderly. B. Description of Data Sources and Collection
1. Senior Survey A survey was conducted of Dutchess County senior citizens. With 2,125 completed surveys, nearly 4% of Dutchess County’s population of 57,062 ages 60+ (2010 Census) took part. The survey was distributed at Division of Aging Services senior picnics held throughout the county, at senior exercise classes, in the Aging Services Quarterly Newsletter, Spotlight on Seniors, to residents of senior housing, and to frail, homebound clients of the Division of Aging Services. The survey was also publicized through local news media and made available to complete online. It should be noted that in the online version, respondents were required to provide an e-mail address in order to avoid the potential problem of multiple survey responses.
The Dutchess County Division of Aging Services lacks the resources to hire research firms or consultants to perform highly scientific research. While the survey sample was not a random sample, a form of quota sampling was utilized in order to insure certain target groups were represented in at least the same proportion they are represented in the overall senior population in the county. Testing for geographic location, income status, and minority status was done on the returned surveys to insure these demographic characteristics were reasonably represented in the survey sample.

9
Since a primary goal was to have a large number of completed surveys, the survey was designed to be easily understood and completed in a few minutes, thereby increasing the likelihood of being completed and increasing the number of responses. In the survey, respondents were asked whether certain issues were problems to them. They were also asked some basic demographic questions.
2. Key Informant Survey A survey was conducted of “key informants.” The key informant survey was mailed to approximately 125 individuals in the human service and aging network. These included housing managers, Aging Services Advisory Board and Long Term Care Council members, Senior Center Directors, the Division of Aging Services Nutrition Program staff, Case Assistance, Case Management and Public Health Nursing staff, Division of Aging Services subcontractors, etc. In the survey, respondents were asked to choose, from the same list provided in the Senior Survey, the top five unmet needs/problems faced by the senior population based on their knowledge and experience. Of the roughly 125 surveys distributed, 67 completed surveys were returned.
3. Caregiver Survey A Caregiver Survey was mailed to about 60 caregivers. These included caregivers receiving respite and other services through the Division of Aging Services as well as caregivers attending the annual Dutchess County Caregiver Conference, a collaboration of a number of aging network partners. Of the surveys distributed, 28 completed surveys were returned. The Caregiver Survey sought to assess which caregiver services were needed and received and which were needed but not received. Additionally, the survey included questions about the perceived benefits caregivers derived as a result of the services they received.
4. Dutchess NY Connects Intakes Administered by the Division of Aging Services, Dutchess NY Connects is Dutchess County’s single point of entry for long-term care. Dutchess NY Connects receives calls from seniors, caregivers and providers who wish to obtain information or assistance regarding a wide variety of services. Dutchess NY Connects logs each of these calls to produce Information and Assistance Aggregate Data Reports every three months. The data presented in the Needs Assessment reflects the nature of these calls, or intakes, over a yearlong period in order to shed additional light on the service and information needs of those accessing the single point of entry.
5. Public Hearings The Division of Aging Services Advisory Board conducts annual public hearings at locations around the county, using different locations each year. In 2011, three public hearings were held to give an opportunity for seniors and the public at large, to provide input to the Division of Aging Services and its Advisory Board on senior

10
needs and services. These hearings were held in Beacon (Southwestern Dutchess, Urban), Millerton (Northeastern Dutchess, Rural) and the Town of Poughkeepsie (Core area, Suburban). The sessions were publicized at events leading up to the hearings, and in the local media. The Beacon hearing was attended by 11 people, the Millerton hearing was attended by 22 people, and the Town of Poughkeepsie hearing was attended by 64 people. Findings from the public hearings are presented based on minutes of those hearings.
6. Dutchess County Community Health Report The Division of Aging Services was represented on the steering committee of Dutchess County’s 2009 Community Health Report and Survey. The purpose of the Community Health Survey was to ascertain the issues related to community health and quality of life that are of highest priority to the residents of Dutchess County. To fulfill this objective, the Dutchess County Department of Health hired consultants to conduct a telephone survey in late 2008. The telephone survey reached out to randomly selected households. For purposes of the survey, the county was divided into four regions based on socio-demographic characteristics and geography. The number of calls placed within each region was proportionate to its population.
7. National Unmet Need for Services Data National unmet need is illuminated in a study performed by the United States Government Accountability Office (GAO). Published in February 2011 in a Report to the Chairman of the Senate Special Committee on Aging, the study assesses the state of need for services funded by the Older Americans Act. Services examined in the study include home-delivered and congregate meals, home care, and transportation. To assess the degree of need for these services, the study collected data from a number of sources. In conjunction with data from recent existing national surveys, the study considered self-report responses from adults over 60 years of age to the Current Population Survey and the Health and Retirement Study, both completed in 2008. The study also carried out its own web-based survey of 125 randomly selected local Area Agencies on Aging during 2010. Finally, review of Administration on Aging program data, 51 state plans on aging, state needs assessments, and relevant federal regulations and laws contributed to the data presented in the study.
8. Outcomes and Client Satisfaction Data Historically, the Division of Aging Services has conducted Outcomes and Client Satisfaction research for both its directly provided and subcontracted services as part of its ongoing agency operations. Data from several major services provided in 2009 and 2010 is included in the Needs Assessment as it provides an indicator as to the effectiveness of particular services in meeting needs. The data is also useful in determining whether existing programs meet identified senior and caregiver needs. One limitation of this data is it focuses upon those already being served and does not include non-clients.
11
C. Advisory Board Role in Process
The Dutchess County Division of Aging Services plays an important role in the Needs Assessment Process. • The Advisory Board sets the annual public hearings conducted by the Division; • Advisory Board members chair the public hearings; • Advisory Board members are presented with the senior survey instrument prior to
distribution; • Advisory Board members are included among the “key informants” surveyed; • The Advisory Board is represented on the internal Needs Assessment Committee; • The Advisory Board is presented with the findings of the Needs Assessment and is
afforded the opportunity to provide comment on findings. D. Inclusion of Target Populations Action is taken to ensure inclusion of target populations in the Needs Assessment Process. A number of strategies are employed: • The Division of Aging Services works with service providers, such as senior
housing locations, to distribute surveys in order to reach target groups; • Surveys are included in the Division’s quarterly newsletter, Spotlight on Seniors; • Service providers to target groups are included among the key informants surveyed. Once surveys have been distributed, the tabulation includes steps to affirm that target groups have been included. An analysis is conducted of the demographic breakdown of survey responses in order to determine the level to which target populations are actually included in the process. The percentage of the various target groups among survey respondents is compared to their actual representation in the senior population.
III. Data Presentation
A. Senior Survey Results There were 2125 responses to the Senior Survey. The results show the problem cited most frequently is “Understanding health insurance/Medicare” with 33% of seniors saying this is a problem for them. Other problem areas in the top 5 included: “Keeping up with medical costs” at 31%, “Knowing where to obtain information about services and benefits” at 25%, “Household chores and maintenance” at 24%, and “Affording energy and utilities” at 22%. Among the target groups the results were slightly different, but not remarkably so. As might be expected the target groups had greater problems in areas related to income.
The tables below detail the findings of the 2125 completed surveys.
• Table 1 ranks the issues according to all senior respondents ranking them as
being a problem for them individually.

12
• Table 2 ranks the issues for seniors age 75 and over.
• Table 3 ranks the issues for low income seniors. For purposes of the survey low income was defined as at or below 150% of poverty level:
Household of 1 – no more than $16,245/year Household of 5 – no more than $38,685/year Household of 2 – no more than $21,855/year Household of 6 – no more than $44,295/year Household of 3 – no more than $27,465/year Household of 7 – no more than $49,905/year Household of 4 – no more than $33,075/year Household of 8 – no more than $55,515/year
For households more than 8 members, add $3740 for each additional member
• Table 4 ranks the issues for minority seniors.
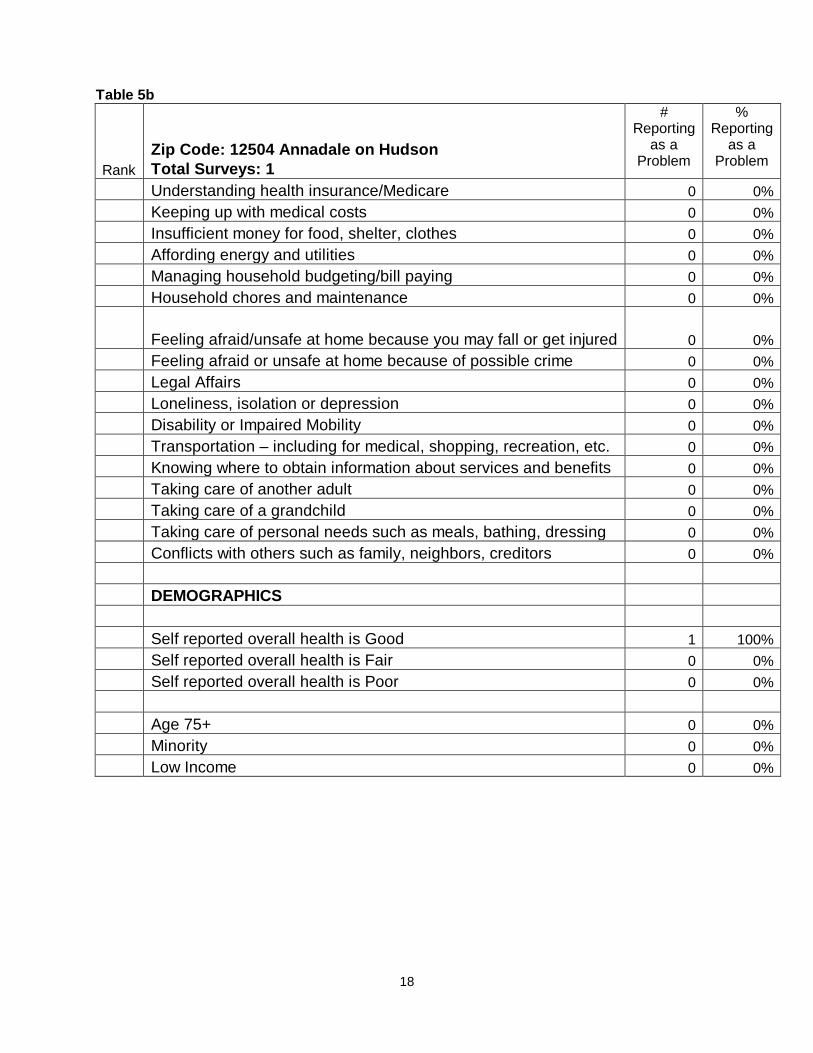
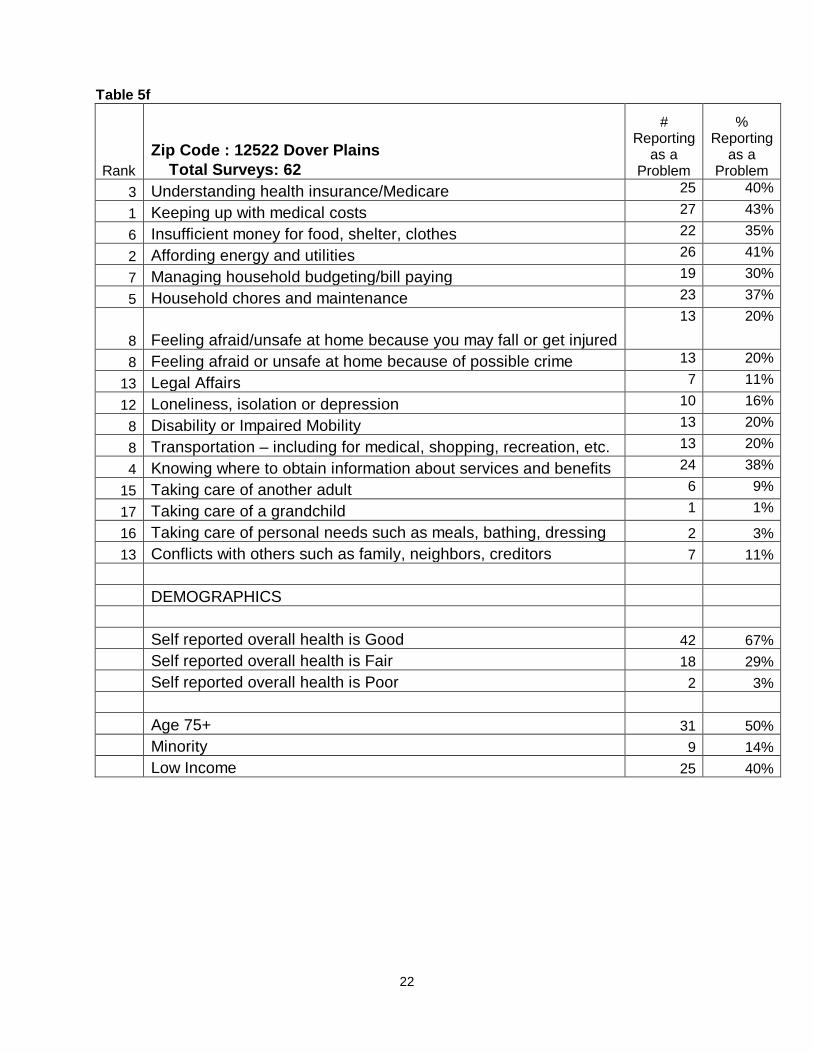
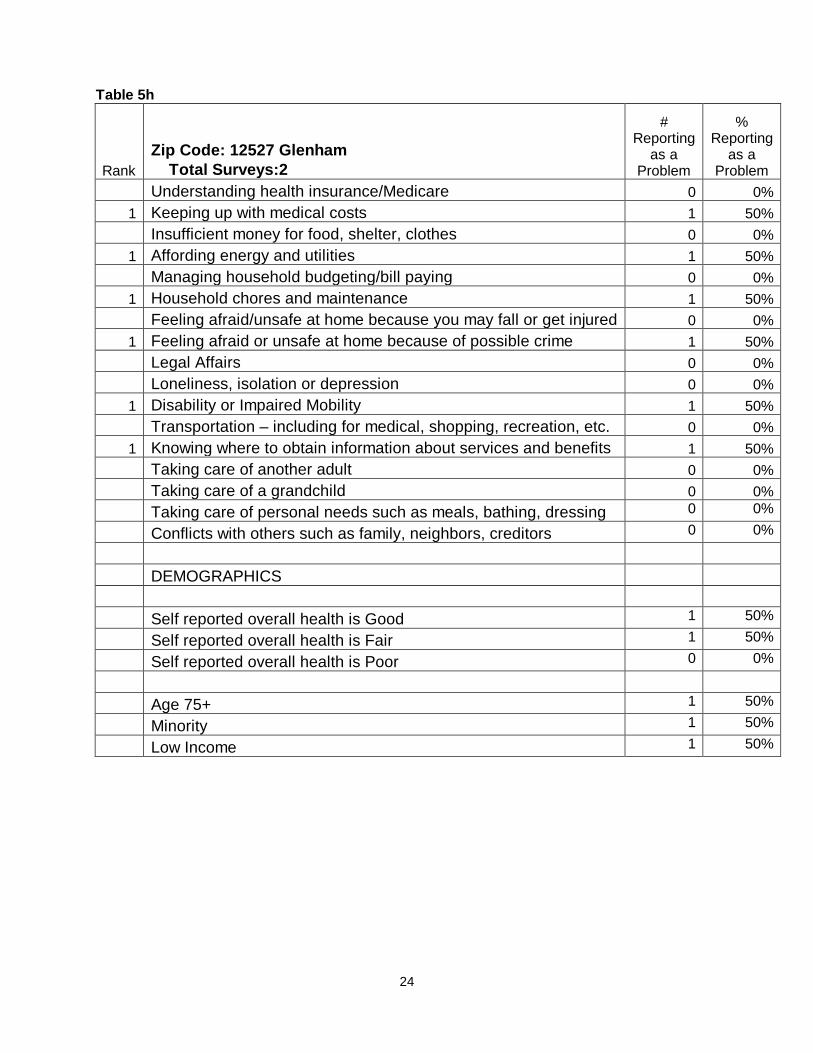
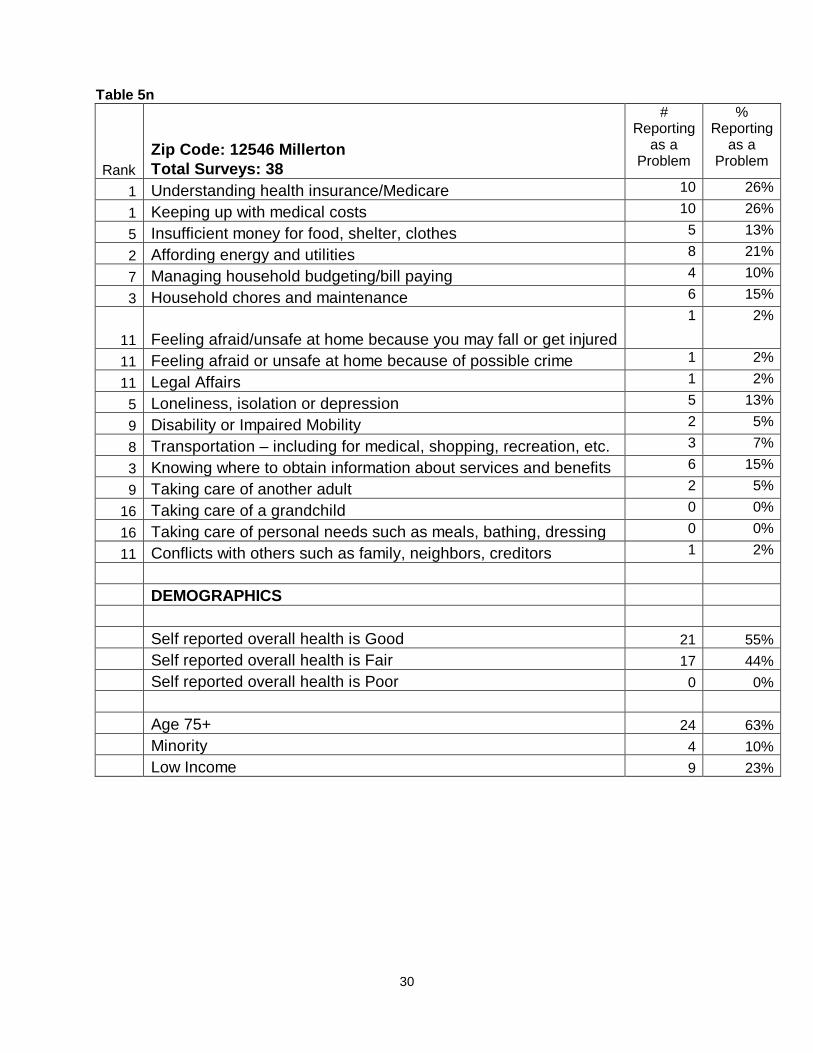
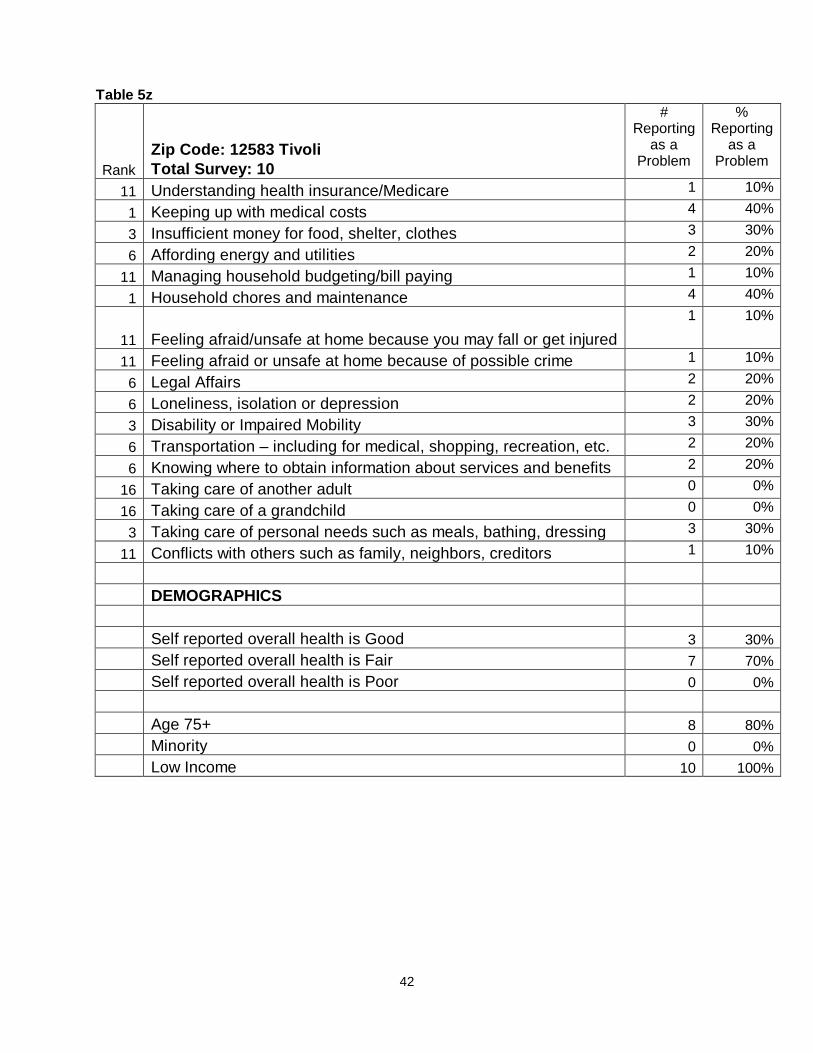
• Tables 5a – 5hh provide separate breakouts for each zip code. It should be noted that results by zip code should be used with caution given that for some zip codes the total number of responses is very small. In these cases, single zip code data should not be used to establish need; however, adjoining zip codes may combined to provide more reliable and useful data. Not all survey respondents answered the zip code question, so the total of surveys in the zip code breakouts does not equal the total number of completed surveys.

13
Table 1. PROBLEMS - All Seniors
Rank Total Surveys: 2125
# Reporting
as a Problem
% Reporting
as a Problem
1 Understanding health insurance/Medicare 698 32%
2 Keeping up with medical costs 668 31%
9 Insufficient money for food, shelter, clothes 323 15%
5 Affording energy and utilities 458 21%
8 Managing household budgeting/bill paying 329 15%
4 Household chores and maintenance 500 23%
10 Feeling afraid/unsafe at home because you may fall or get injured
312 14%
12 Feeling afraid or unsafe at home because of possible crime 289 13%
10 Legal Affairs 312 14%
13 Loneliness, isolation or depression 283 13%
6 Disability or Impaired Mobility 413 19%
7 Transportation – including for medical, shopping, recreation, etc. 356 16%
3 Knowing where to obtain information about services and benefits 537 25%
14 Taking care of another adult 182 8%
17 Taking care of a grandchild 90 4%
16 Taking care of personal needs such as meals, bathing, dressing 131 6%
15 Conflicts with others such as family, neighbors, creditors 148 6%
DEMOGRAPHICS Self reported overall health is Good 1312 61% Self reported overall health is Fair 671 31% Self reported overall health is Poor 84 3% Age 75+ 1215 57% Minority 158 7% Low Income 750 35%

14
Table 2. PROBLEMS – Seniors Age 75+
Rank Total Surveys: 1215
# Reporting
as a Problem
% Reporting
as a Problem
1 Understanding health insurance/Medicare 350 28%
2 Keeping up with medical costs 328 26%
13 Insufficient money for food, shelter, clothes 137 11%
7 Affording energy and utilities 213 17%
9 Managing household budgeting/bill paying 158 13%
3 Household chores and maintenance 293 24%
8 Feeling afraid/unsafe at home because you may fall or get injured
207 17%
12 Feeling afraid or unsafe at home because of possible crime 147 12%
11 Legal Affairs 149 12%
9 Loneliness, isolation or depression 158 13%
5 Disability or Impaired Mobility 249 20%
6 Transportation – including for medical, shopping, recreation, etc. 215 17%
4 Knowing where to obtain information about services and benefits 278 22%
14 Taking care of another adult 90 7%
17 Taking care of a grandchild 45 3%
15 Taking care of personal needs such as meals, bathing, dressing 89 7%
16 Conflicts with others such as family, neighbors, creditors 64 5%
DEMOGRAPHICS Self reported overall health is Good 732 60% Self reported overall health is Fair 406 33% Self reported overall health is Poor 54 4% Age 75+ 1215 100% Minority 69 5% Low Income 436 35%

15
Table 3. PROBLEMS – Low Income Seniors
Rank Total Surveys: 750
# Reporting
as a Problem
% Reporting
as a Problem
2 Understanding health insurance/Medicare 282 37%
1 Keeping up with medical costs 297 39%
6 Insufficient money for food, shelter, clothes 209 27%
3 Affording energy and utilities 253 33%
8 Managing household budgeting/bill paying 181 24%
5 Household chores and maintenance 215 28%
11 Feeling afraid/unsafe at home because you may fall or get injured 138 18%
13 Feeling afraid or unsafe at home because of possible crime 120 16%
12 Legal Affairs 137 18%
10 Loneliness, isolation or depression 153 20%
7 Disability or Impaired Mobility 193 25%
9 Transportation – including for medical, shopping, recreation, etc. 174 23%
4 Knowing where to obtain information about services and benefits 242 32%
15 Taking care of another adult 75 10%
17 Taking care of a grandchild 40 5%
16 Taking care of personal needs such as meals, bathing, dressing 69 9%
14 Conflicts with others such as family, neighbors, creditors 79 10%
DEMOGRAPHICS Self reported overall health is Good 337 44% Self reported overall health is Fair 316 42% Self reported overall health is Poor 41 5% Age 75+ 452 60% Minority 107 14% Low Income 750 100%

16
Table 4. PROBLEMS – Minority Seniors
Rank Total Surveys: 158
# Reporting
as a Problem
% Reporting
as a Problem
2 Understanding health insurance/Medicare 50 31%
1 Keeping up with medical costs 57 36%
4 Insufficient money for food, shelter, clothes 45 28%
2 Affording energy and utilities 50 31%
5 Managing household budgeting/bill paying 39 24%
9 Household chores and maintenance 26 16%
15 Feeling afraid/unsafe at home because you may fall or get injured 11 6%
12 Feeling afraid or unsafe at home because of possible crime 20 12%
10 Legal Affairs 25 15%
11 Loneliness, isolation or depression 23 14%
7 Disability or Impaired Mobility 31 19%
8 Transportation – including for medical, shopping, recreation, etc. 27 17%
6 Knowing where to obtain information about services and benefits 38 24%
14 Taking care of another adult 12 7%
17 Taking care of a grandchild 5 3%
16 Taking care of personal needs such as meals, bathing, dressing 6 3%
13 Conflicts with others such as family, neighbors, creditors 15 9%
DEMOGRAPHICS Self reported overall health is Good 88 55% Self reported overall health is Fair 56 35% Self reported overall health is Poor 9 5% Age 75+ 69 43% Minority 158 100% Low Income 82 51%

17
Tables 5a-5hh. Results by Zip Code Table 5a
Rank Zip Code: 12501 Amenia Total Surveys: 21
# Reporting
as a Problem
% Reporting
as a Problem
1 Understanding health insurance/Medicare 12 57%
1 Keeping up with medical costs 12 57%
10 Insufficient money for food, shelter, clothes 3 14%
3 Affording energy and utilities 7 33%
5 Managing household budgeting/bill paying 5 23% 5 Household chores and maintenance 5 23%
10 Feeling afraid/unsafe at home because you may fall or get injured 3 14%
15 Feeling afraid or unsafe at home because of possible crime 1 4%
10 Legal Affairs 3 14%
8 Loneliness, isolation or depression 4 19% 4 Disability or Impaired Mobility 6 28% 8 Transportation – including for medical, shopping, recreation, etc. 4 19% 5 Knowing where to obtain information about services and benefits 5 23%
13 Taking care of another adult 2 9%
13 Taking care of a grandchild 2 9%
15 Taking care of personal needs such as meals, bathing, dressing 1 4%
15 Conflicts with others such as family, neighbors, creditors 1 0%
DEMOGRAPHICS
Self reported overall health is Good 14 66%
Self reported overall health is Fair 7 33%
Self reported overall health is Poor 0 0%
Age 75+ 6 28%
Minority 2 9%
Low Income 6 28%
18
Table 5b
Rank Zip Code: 12504 Annadale on Hudson Total Surveys: 1
# Reporting
as a Problem
% Reporting
as a Problem
Understanding health insurance/Medicare 0 0% Keeping up with medical costs 0 0% Insufficient money for food, shelter, clothes 0 0% Affording energy and utilities 0 0% Managing household budgeting/bill paying 0 0% Household chores and maintenance 0 0%
Feeling afraid/unsafe at home because you may fall or get injured 0 0% Feeling afraid or unsafe at home because of possible crime 0 0% Legal Affairs 0 0% Loneliness, isolation or depression 0 0% Disability or Impaired Mobility 0 0% Transportation – including for medical, shopping, recreation, etc. 0 0% Knowing where to obtain information about services and benefits 0 0% Taking care of another adult 0 0% Taking care of a grandchild 0 0% Taking care of personal needs such as meals, bathing, dressing 0 0% Conflicts with others such as family, neighbors, creditors 0 0% DEMOGRAPHICS Self reported overall health is Good 1 100% Self reported overall health is Fair 0 0% Self reported overall health is Poor 0 0% Age 75+ 0 0% Minority 0 0% Low Income 0 0%

19
Table 5c
Rank Zip Code: 12508 Beacon Total Surveys: 114
# Reporting
as a Problem
% Reporting
as a Problem
1 Understanding health insurance/Medicare 43 37%
2 Keeping up with medical costs 35 30%
5 Insufficient money for food, shelter, clothes 25 21%
6 Affording energy and utilities 23 20%
10 Managing household budgeting/bill paying 19 16%
6 Household chores and maintenance 23 20%
9 Feeling afraid/unsafe at home because you may fall or get injured 20 17%
13 Feeling afraid or unsafe at home because of possible crime 14 12%
12 Legal Affairs 17 14%
8 Loneliness, isolation or depression 22 19%
4 Disability or Impaired Mobility 28 24%
10 Transportation – including for medical, shopping, recreation, etc. 19 16%
3 Knowing where to obtain information about services and benefits 33 28%
16 Taking care of another adult 11 9%
17 Taking care of a grandchild 4 3%
14 Taking care of personal needs such as meals, bathing, dressing 12 10%
14 Conflicts with others such as family, neighbors, creditors 12 10% DEMOGRAPHICS Self reported overall health is Good 69 60% Self reported overall health is Fair 37 32% Self reported overall health is Poor 7 7% Age 75+ 63 55% Minority 28 24% Low Income 47 41%

20
Table 5d
Rank Zip Code: 12512 Chelsea Total Surveys: 3
# Reporting
as a Problem
% Reporting
as a Problem
4 Understanding health insurance/Medicare 1 33%
1 Keeping up with medical costs 2 66%
Insufficient money for food, shelter, clothes 0 0%
4 Affording energy and utilities 1 33%
4 Managing household budgeting/bill paying 1 33%
1 Household chores and maintenance 2 66%
4 Feeling afraid/unsafe at home because you may fall or get injured 1 33%
1 Feeling afraid or unsafe at home because of possible crime 2 66%
4 Legal Affairs 1 33%
Loneliness, isolation or depression 0 0%
Disability or Impaired Mobility 0 0%
Transportation – including for medical, shopping, recreation, etc. 0 0%
Knowing where to obtain information about services and benefits 0 0%
4 Taking care of another adult 1 33%
Taking care of a grandchild 0 0%
Taking care of personal needs such as meals, bathing, dressing 0 0%
Conflicts with others such as family, neighbors, creditors 0 0% DEMOGRAPHICS Self reported overall health is Good 0 0% Self reported overall health is Fair 3 33% Self reported overall health is Poor 0 0% Age 75+ 2 66% Minority 0 0% Low Income 1 33%

21
Table 5e
Rank Zip Code: 12514 Clinton Corners Total Surveys: 15
# Reporting
as a Problem
% Reporting
as a Problem
1 Understanding health insurance/Medicare 4 0.26 1 Keeping up with medical costs 4 26%
Insufficient money for food, shelter, clothes 0 0% Affording energy and utilities 0 0
4 Managing household budgeting/bill paying 1 6%
3 Household chores and maintenance 3 20%
4 Feeling afraid/unsafe at home because you may fall or get injured 1 6%
4 Feeling afraid or unsafe at home because of possible crime 1 6%
4 Legal Affairs 1 6%
Loneliness, isolation or depression 0 0%
4 Disability or Impaired Mobility 1 6%
4 Transportation – including for medical, shopping, recreation, etc. 1 6%
4 Knowing where to obtain information about services and benefits 1 6%
4 Taking care of another adult 1 6%
4 Taking care of a grandchild 1 6%
Taking care of personal needs such as meals, bathing, dressing 0 0%
Conflicts with others such as family, neighbors, creditors 0 0%
DEMOGRAPHICS
Self reported overall health is Good 12 80% Self reported overall health is Fair 3 20% Self reported overall health is Poor 0 0% Age 75+ 0 0% Minority 2 13% Low Income 2 13%
22
Table 5f
Rank Zip Code : 12522 Dover Plains Total Surveys: 62
# Reporting
as a Problem
% Reporting
as a Problem
3 Understanding health insurance/Medicare 25 40%
1 Keeping up with medical costs 27 43%
6 Insufficient money for food, shelter, clothes 22 35%
2 Affording energy and utilities 26 41%
7 Managing household budgeting/bill paying 19 30%
5 Household chores and maintenance 23 37%
8 Feeling afraid/unsafe at home because you may fall or get injured 13 20%
8 Feeling afraid or unsafe at home because of possible crime 13 20%
13 Legal Affairs 7 11%
12 Loneliness, isolation or depression 10 16%
8 Disability or Impaired Mobility 13 20%
8 Transportation – including for medical, shopping, recreation, etc. 13 20%
4 Knowing where to obtain information about services and benefits 24 38%
15 Taking care of another adult 6 9%
17 Taking care of a grandchild 1 1%
16 Taking care of personal needs such as meals, bathing, dressing 2 3% 13 Conflicts with others such as family, neighbors, creditors 7 11%
DEMOGRAPHICS Self reported overall health is Good 42 67% Self reported overall health is Fair 18 29% Self reported overall health is Poor 2 3% Age 75+ 31 50% Minority 9 14% Low Income 25 40%

23
Table 5g
Rank Zip Code: 12524 Fishkill Total Surveys: 81
# Reporting
as a Problem
% Reporting
as a Problem
2 Understanding health insurance/Medicare 22 27%
1 Keeping up with medical costs 25 30%
15 Insufficient money for food, shelter, clothes 2 2%
5 Affording energy and utilities 13 16%
11 Managing household budgeting/bill paying 7 8%
3 Household chores and maintenance 17 20%
8 Feeling afraid/unsafe at home because you may fall or get injured 10 12%
10 Feeling afraid or unsafe at home because of possible crime 9 11%
5 Legal Affairs 13 16%
12 Loneliness, isolation or depression 6 7%
5 Disability or Impaired Mobility 13 16% 8 Transportation – including for medical, shopping, recreation, etc. 10 12% 3 Knowing where to obtain information about services and benefits 17 0.2
15 Taking care of another adult 2 2% 17 Taking care of a grandchild 1 1% 13 Taking care of personal needs such as meals, bathing, dressing 4 4% 13 Conflicts with others such as family, neighbors, creditors 4 4%
DEMOGRAPHICS Self reported overall health is Good 47 58% Self reported overall health is Fair 30 37% Self reported overall health is Poor 2 2% Age 75+ 44 54% Minority 10 12%
Low Income 17 20%
24
Table 5h
Rank Zip Code: 12527 Glenham Total Surveys:2
# Reporting
as a Problem
% Reporting
as a Problem
Understanding health insurance/Medicare 0 0% 1 Keeping up with medical costs 1 50%
Insufficient money for food, shelter, clothes 0 0% 1 Affording energy and utilities 1 50%
Managing household budgeting/bill paying 0 0% 1 Household chores and maintenance 1 50%
Feeling afraid/unsafe at home because you may fall or get injured 0 0% 1 Feeling afraid or unsafe at home because of possible crime 1 50%
Legal Affairs 0 0% Loneliness, isolation or depression 0 0%
1 Disability or Impaired Mobility 1 50% Transportation – including for medical, shopping, recreation, etc. 0 0%
1 Knowing where to obtain information about services and benefits 1 50% Taking care of another adult 0 0% Taking care of a grandchild 0 0% Taking care of personal needs such as meals, bathing, dressing 0 0%
Conflicts with others such as family, neighbors, creditors 0 0%
DEMOGRAPHICS
Self reported overall health is Good 1 50%
Self reported overall health is Fair 1 50%
Self reported overall health is Poor 0 0%
Age 75+ 1 50%
Minority 1 50%
Low Income 1 50%

25
Table 5i
Rank Zip Code: 12531 Holmes Total Surveys: 7
# Reporting
as a Problem
% Reporting
as a Problem
3 Understanding health insurance/Medicare 4 57%
1 Keeping up with medical costs 6 85%
4 Insufficient money for food, shelter, clothes 3 42%
2 Affording energy and utilities 5 71%
4 Managing household budgeting/bill paying 3 42%
4 Household chores and maintenance 3 42%
4 Feeling afraid/unsafe at home because you may fall or get injured 3 42%
8 Feeling afraid or unsafe at home because of possible crime 2 28%
8 Legal Affairs 2 28%
8 Loneliness, isolation or depression 2 28%
8 Disability or Impaired Mobility 2 28%
14 Transportation – including for medical, shopping, recreation, etc. 1 14%
8 Knowing where to obtain information about services and benefits 2 28%
8 Taking care of another adult 2 28%
14 Taking care of a grandchild 1 14%
Taking care of personal needs such as meals, bathing, dressing 0 0%
14 Conflicts with others such as family, neighbors, creditors 1 14%
DEMOGRAPHICS Self reported overall health is Good 5 71% Self reported overall health is Fair 2 28% Self reported overall health is Poor 0 0% Age 75+ 3 42% Minority 0 0% Low Income 3 42%

26
Table 5j
Rank Zip Code: 12533 Hopewell Junction Total Surveys: 113
# Reporting
as a Problem
% Reporting
as a Problem
1 Understanding health insurance/Medicare 47 41%
2 Keeping up with medical costs 42 37%
9 Insufficient money for food, shelter, clothes 23 20%
4 Affording energy and utilities 33 29%
7 Managing household budgeting/bill paying 25 22%
6 Household chores and maintenance 26 23%
10 Feeling afraid/unsafe at home because you may fall or get injured 21 18%
7 Feeling afraid or unsafe at home because of possible crime 25 22%
5 Legal Affairs 27 23%
11 Loneliness, isolation or depression 19 16%
11 Disability or Impaired Mobility 19 16%
13 Transportation – including for medical, shopping, recreation, etc. 18 15%
3 Knowing where to obtain information about services and benefits 38 33%
15 Taking care of another adult 11 9%
17 Taking care of a grandchild 4 3%
16 Taking care of personal needs such as meals, bathing, dressing 7 6%
14 Conflicts with others such as family, neighbors, creditors 15 13%
DEMOGRAPHICS Self reported overall health is Good 76 67% Self reported overall health is Fair 31 27% Self reported overall health is Poor 5 4% Age 75+ 54 47% Minority 20 17% Low Income 33 29%

27
Table 5k
Rank Zip Code: 12538 Hyde Park Total Surveys: 94
# Reporting
as a Problem
% Reporting
as a Problem
1 Understanding health insurance/Medicare 34 36%
3 Keeping up with medical costs 28 29%
10 Insufficient money for food, shelter, clothes 14 14%
5 Affording energy and utilities 21 22%
10 Managing household budgeting/bill paying 14 14%
4 Household chores and maintenance 25 26%
7 Feeling afraid/unsafe at home because you may fall or get injured 17 18%
13 Feeling afraid or unsafe at home because of possible crime 11 11%
12 Legal Affairs 13 13%
7 Loneliness, isolation or depression 17 18%
6 Disability or Impaired Mobility 20 21%
9 Transportation – including for medical, shopping, recreation, etc. 16 17%
2 Knowing where to obtain information about services and benefits 30 31%
16 Taking care of another adult 5 5%
17 Taking care of a grandchild 3 3%
14 Taking care of personal needs such as meals, bathing, dressing 9 9%
15 Conflicts with others such as family, neighbors, creditors 7 7%
DEMOGRAPHICS Self reported overall health is Good 56 59% Self reported overall health is Fair 33 35% Self reported overall health is Poor 2 2% Age 75+ 57 60% Minority 7 7% Low Income 47 50%

28
Table 5l
Rank Zip Code: 12540 Lagrangeville Total Surveys: 35
# Reporting
as a Problem
% Reporting
as a Problem
3 Understanding health insurance/Medicare 9 25%
1 Keeping up with medical costs 14 40%
12 Insufficient money for food, shelter, clothes 4 11%
3 Affording energy and utilities 9 25%
10 Managing household budgeting/bill paying 5 14%
2 Household chores and maintenance 10 28%
10 Feeling afraid/unsafe at home because you may fall or get injured 5 14%
15 Feeling afraid or unsafe at home because of possible crime 1 2%
7 Legal Affairs 7 20%
9 Loneliness, isolation or depression 6 17%
5 Disability or Impaired Mobility 8 22%
7 Transportation – including for medical, shopping, recreation, etc. 7 20%
5 Knowing where to obtain information about services and benefits 8 22%
12 Taking care of another adult 4 11%
15 Taking care of a grandchild 1 2%
14 Taking care of personal needs such as meals, bathing, dressing 2 5%
15 Conflicts with others such as family, neighbors, creditors 1 2%
DEMOGRAPHICS Self reported overall health is Good 24 68% Self reported overall health is Fair 10 28% Self reported overall health is Poor 1 2% Age 75+ 24 68% Minority 2 5% Low Income 5 14%

29
Table 5m
Rank Zip Code: 12545 Millbrook Total Surveys: 47
# Reporting
as a Problem
% Reporting
as a Problem
1 Understanding health insurance/Medicare 19 40%
2 Keeping up with medical costs 12 25%
12 Insufficient money for food, shelter, clothes 2 4%
7 Affording energy and utilities 8 17%
11 Managing household budgeting/bill paying 3 6%
5 Household chores and maintenance 9 19%
8 Feeling afraid/unsafe at home because you may fall or get injured 7 14%
12 Feeling afraid or unsafe at home because of possible crime 2 2%
8 Legal Affairs 7 14%
12 Loneliness, isolation or depression 2 4%
3 Disability or Impaired Mobility 11 23%
5 Transportation – including for medical, shopping, recreation, etc. 9 19%
4 Knowing where to obtain information about services and benefits 10 21%
12 Taking care of another adult 2 4%
16 Taking care of a grandchild 1 2%
10 Taking care of personal needs such as meals, bathing, dressing 6 12%
16 Conflicts with others such as family, neighbors, creditors 1 2%
DEMOGRAPHICS Self reported overall health is Good 34 72% Self reported overall health is Fair 14 29% Self reported overall health is Poor 1 2% Age 75+ 36 76% Minority 8 17% Low Income 15 31%
30
Table 5n
Rank Zip Code: 12546 Millerton Total Surveys: 38
# Reporting
as a Problem
% Reporting
as a Problem
1 Understanding health insurance/Medicare 10 26%
1 Keeping up with medical costs 10 26%
5 Insufficient money for food, shelter, clothes 5 13%
2 Affording energy and utilities 8 21%
7 Managing household budgeting/bill paying 4 10%
3 Household chores and maintenance 6 15%
11 Feeling afraid/unsafe at home because you may fall or get injured 1 2%
11 Feeling afraid or unsafe at home because of possible crime 1 2%
11 Legal Affairs 1 2%
5 Loneliness, isolation or depression 5 13%
9 Disability or Impaired Mobility 2 5%
8 Transportation – including for medical, shopping, recreation, etc. 3 7%
3 Knowing where to obtain information about services and benefits 6 15%
9 Taking care of another adult 2 5%
16 Taking care of a grandchild 0 0%
16 Taking care of personal needs such as meals, bathing, dressing 0 0%
11 Conflicts with others such as family, neighbors, creditors 1 2%
DEMOGRAPHICS Self reported overall health is Good 21 55% Self reported overall health is Fair 17 44% Self reported overall health is Poor 0 0% Age 75+ 24 63% Minority 4 10% Low Income 9 23%

31
Table 5o
Rank Zip Code: 12564 Pawling Total Surveys: 91
# Reporting
as a Problem
% Reporting
as a Problem
1 Understanding health insurance/Medicare 31 34%
3 Keeping up with medical costs 20 21%
9 Insufficient money for food, shelter, clothes 8 8%
6 Affording energy and utilities 12 13%
12 Managing household budgeting/bill paying 7 7%
4 Household chores and maintenance 18 19%
12 Feeling afraid/unsafe at home because you may fall or get injured 7 7%
5 Feeling afraid or unsafe at home because of possible crime 13 14%
8 Legal Affairs 10 10%
9 Loneliness, isolation or depression 8 8%
6 Disability or Impaired Mobility 12 13%
9 Transportation – including for medical, shopping, recreation, etc. 8 8%
2 Knowing where to obtain information about services and benefits 21 23%
14 Taking care of another adult 5 5%
16 Taking care of a grandchild 3 3%
15 Taking care of personal needs such as meals, bathing, dressing 4 4%
17 Conflicts with others such as family, neighbors, creditors 1 1%
DEMOGRAPHICS Self reported overall health is Good 60 65% Self reported overall health is Fair 20 21% Self reported overall health is Poor 4 4% Age 75+ 56 61% Minority 9 9% Low Income 29 31%

32
Table 5p
Rank Zip Code: 12567 Pine Plains Total Surveys: 24
# Reporting
as a Problem
% Reporting
as a Problem
3 Understanding health insurance/Medicare 8 33%
3 Keeping up with medical costs 8 33%
10 Insufficient money for food, shelter, clothes 3 12%
5 Affording energy and utilities 7 29%
7 Managing household budgeting/bill paying 5 20%
1 Household chores and maintenance 9 37%
5 Feeling afraid/unsafe at home because you may fall or get injured 7 29%
10 Feeling afraid or unsafe at home because of possible crime 3 12%
10 Legal Affairs 3 12%
7 Loneliness, isolation or depression 5 20%
7 Disability or Impaired Mobility 5 20%
13 Transportation – including for medical, shopping, recreation, etc. 2 8%
1 Knowing where to obtain information about services and benefits 9 37%
13 Taking care of another adult 2 8%
13 Taking care of a grandchild 2 8%
17 Taking care of personal needs such as meals, bathing, dressing 0 0%
13 Conflicts with others such as family, neighbors, creditors 2 8%
DEMOGRAPHICS Self reported overall health is Good 14 58% Self reported overall health is Fair 8 33% Self reported overall health is Poor 1 1% Age 75+ 12 50% Minority 1 4% Low Income 8 33%

33
Table 5q
Rank Zip Code: 12569 Pleasant Valley Total Surveys: 83
# Reporting
as a Problem
% Reporting
as a Problem
1 Understanding health insurance/Medicare 37 44%
1 Keeping up with medical costs 37 44%
8 Insufficient money for food, shelter, clothes 13 15%
3 Affording energy and utilities 21 25%
8 Managing household budgeting/bill paying 13 15%
6 Household chores and maintenance 17 20%
8 Feeling afraid/unsafe at home because you may fall or get injured 13 15%
7 Feeling afraid or unsafe at home because of possible crime 14 16%
12 Legal Affairs 9 10%
14 Loneliness, isolation or depression 5 6%
5 Disability or Impaired Mobility 18 21%
11 Transportation – including for medical, shopping, recreation, etc. 12 14%
3 Knowing where to obtain information about services and benefits 21 25%
13 Taking care of another adult 6 7%
16 Taking care of a grandchild 3 3%
17 Taking care of personal needs such as meals, bathing, dressing 1 1%
15 Conflicts with others such as family, neighbors, creditors 4 4%
DEMOGRAPHICS Self reported overall health is Good 62 74% Self reported overall health is Fair 17 20% Self reported overall health is Poor 3 3% Age 75+ 42 50% Minority 3 3% Low Income 17 20%

34
Table 5r
Rank Zip Code: 12570 Poughquag Total Surveys: 46
# Reporting
as a Problem
% Reporting
as a Problem
1 Understanding health insurance/Medicare 17 36%
2 Keeping up with medical costs 11 23%
10 Insufficient money for food, shelter, clothes 3 6%
5 Affording energy and utilities 8 17%
12 Managing household budgeting/bill paying 2 2%
9 Household chores and maintenance 4 8%
7 Feeling afraid/unsafe at home because you may fall or get injured 5 10%
16 Feeling afraid or unsafe at home because of possible crime 1 2%
6 Legal Affairs 6 13%
12 Loneliness, isolation or depression 2 4%
4 Disability or Impaired Mobility 9 19%
7 Transportation – including for medical, shopping, recreation, etc. 5 10%
3 Knowing where to obtain information about services and benefits 10 21%
12 Taking care of another adult 2 4%
16 Taking care of a grandchild 1 2%
10 Taking care of personal needs such as meals, bathing, dressing 3 6%
12 Conflicts with others such as family, neighbors, creditors 2 4%
DEMOGRAPHICS Self reported overall health is Good 31 67% Self reported overall health is Fair 14 30% Self reported overall health is Poor 0 0% Age 75+ 27 58% Minority 5 10% Low Income 15 32%

35
Table 5s
Rank Zip Code: 12571 Red Hook Total Surveys: 91
# Reporting
as a Problem
% Reporting
as a Problem
5 Understanding health insurance/Medicare 17 18%
1 Keeping up with medical costs 25 27%
6 Insufficient money for food, shelter, clothes 15 16%
8 Affording energy and utilities 14 15%
11 Managing household budgeting/bill paying 8 8%
2 Household chores and maintenance 20 21%
6 Feeling afraid/unsafe at home because you may fall or get injured 15 16%
10 Feeling afraid or unsafe at home because of possible crime 10 10%
12 Legal Affairs 7 7%
12 Loneliness, isolation or depression 7 7%
3 Disability or Impaired Mobility 18 19%
3 Transportation – including for medical, shopping, recreation, etc. 18 19%
8 Knowing where to obtain information about services and benefits 14 15%
16 Taking care of another adult 3 3%
15 Taking care of a grandchild 4 4%
14 Taking care of personal needs such as meals, bathing, dressing 6 6%
16 Conflicts with others such as family, neighbors, creditors 3 3%
DEMOGRAPHICS Self reported overall health is Good 58 63% Self reported overall health is Fair 27 29% Self reported overall health is Poor 5 5% Age 75+ 69 75% Minority 7 7% Low Income 33 36%

36
Table 5t
Rank Zip Code: 12572 Rhinebeck Total Surveys: 83
# Reporting
as a Problem
% Reporting
as a Problem
1 Understanding health insurance/Medicare 28 33%
2 Keeping up with medical costs 24 28%
15 Insufficient money for food, shelter, clothes 5 6%
7 Affording energy and utilities 13 15%
10 Managing household budgeting/bill paying 10 12%
3 Household chores and maintenance 21 25%
6 Feeling afraid/unsafe at home because you may fall or get injured 14 16%
10 Feeling afraid or unsafe at home because of possible crime 10 12%
8 Legal Affairs 12 14%
9 Loneliness, isolation or depression 11 13%
5 Disability or Impaired Mobility 16 19%
12 Transportation – including for medical, shopping, recreation, etc. 9 10%
4 Knowing where to obtain information about services and benefits 20 24%
13 Taking care of another adult 8 9%
14 Taking care of a grandchild 6 7%
16 Taking care of personal needs such as meals, bathing, dressing 1 1%
16 Conflicts with others such as family, neighbors, creditors 1 1%
DEMOGRAPHICS Self reported overall health is Good 52 62% Self reported overall health is Fair 31 37% Self reported overall health is Poor 0 0% Age 75+ 49 59% Minority 1 1% Low Income 23 27%

37
Table 5u
Rank Zip Code: 12574 Rhinecliff Total Surveys: 2
# Reporting
as a Problem
% Reporting
as a Problem
1 Understanding health insurance/Medicare 1 50%
1 Keeping up with medical costs 1 50%
1 Insufficient money for food, shelter, clothes 1 50%
Affording energy and utilities 0 0%
Managing household budgeting/bill paying 0 0%
1 Household chores and maintenance 1 50%
1 Feeling afraid/unsafe at home because you may fall or get injured 1 50%
Feeling afraid or unsafe at home because of possible crime 0 0%
Legal Affairs 0 0%
Loneliness, isolation or depression 0 0%
Disability or Impaired Mobility 0 0%
1 Transportation – including for medical, shopping, recreation, etc. 1 50%
Knowing where to obtain information about services and benefits 0 0%
1 Taking care of another adult 1 50%
Taking care of a grandchild 0 0%
Taking care of personal needs such as meals, bathing, dressing 0 0%
Conflicts with others such as family, neighbors, creditors 0 0%
DEMOGRAPHICS Self reported overall health is Good 1 50% Self reported overall health is Fair 1 50% Self reported overall health is Poor 0 0% Age 75+ 2 100% Minority 0 0% Low Income 1 50%

38
Table 5v
Rank Zip Code: 12578 Salt Point Total Surveys: 20
# Reporting
as a Problem
% Reporting
as a Problem
1 Understanding health insurance/Medicare 5 25%
5 Keeping up with medical costs 2 10%
11 Insufficient money for food, shelter, clothes 0 0%
2 Affording energy and utilities 4 20%
7 Managing household budgeting/bill paying 1 5%
3 Household chores and maintenance 3 15%
11 Feeling afraid/unsafe at home because you may fall or get injured 0 0%
7 Feeling afraid or unsafe at home because of possible crime 1 5%
7 Legal Affairs 1 5%
11 Loneliness, isolation or depression 0 0%
3 Disability or Impaired Mobility 3 15%
11 Transportation – including for medical, shopping, recreation, etc. 0 0%
5 Knowing where to obtain information about services and benefits 2 10%
7 Taking care of another adult 1 5%
11 Taking care of a grandchild 0 0%
11 Taking care of personal needs such as meals, bathing, dressing 0 0%
11 Conflicts with others such as family, neighbors, creditors 0 0%
DEMOGRAPHICS Self reported overall health is Good 17 85% Self reported overall health is Fair 2 10% Self reported overall health is Poor 1 5% Age 75+ 13 65% Minority 1 5% Low Income 2 10%

39
Table 5w
Rank Zip Code: 12580 Staatsburg Total Surveys: 16
# Reporting
as a Problem
% Reporting
as a Problem
3 Understanding health insurance/Medicare 5 31%
2 Keeping up with medical costs 6 37%
13 Insufficient money for food, shelter, clothes 2 12%
10 Affording energy and utilities 4 25%
3 Managing household budgeting/bill paying 5 31%
3 Household chores and maintenance 5 31%
11 Feeling afraid/unsafe at home because you may fall or get injured 3 18%
11 Feeling afraid or unsafe at home because of possible crime 3 18%
3 Legal Affairs 5 31%
13 Loneliness, isolation or depression 2 12%
3 Disability or Impaired Mobility 5 31%
3 Transportation – including for medical, shopping, recreation, etc. 5 31%
1 Knowing where to obtain information about services and benefits 7 43%
15 Taking care of another adult 1 6%
16 Taking care of a grandchild 0 0%
16 Taking care of personal needs such as meals, bathing, dressing 0 0%
3 Conflicts with others such as family, neighbors, creditors 5 31%
DEMOGRAPHICS Self reported overall health is Good 10 62% Self reported overall health is Fair 4 25% Self reported overall health is Poor 2 12% Age 75+ 7 43% Minority 1 6% Low Income 9 56%

40
Table 5x
Rank Zip Code: 12581 Stanfordville Total Surveys: 29
# Reporting
as a Problem
% Reporting
as a Problem
1 Understanding health insurance/Medicare 10 34%
2 Keeping up with medical costs 9 31%
15 Insufficient money for food, shelter, clothes 2 6%
3 Affording energy and utilities 8 27%
15 Managing household budgeting/bill paying 2 6%
4 Household chores and maintenance 7 24%
6 Feeling afraid/unsafe at home because you may fall or get injured 5 17%
6 Feeling afraid or unsafe at home because of possible crime 5 17%
12 Legal Affairs 3 10%
6 Loneliness, isolation or depression 5 17%
6 Disability or Impaired Mobility 5 17%
6 Transportation – including for medical, shopping, recreation, etc. 5 17%
4 Knowing where to obtain information about services and benefits 7 24%
11 Taking care of another adult 4 13%
17 Taking care of a grandchild 1 3%
12 Taking care of personal needs such as meals, bathing, dressing 3 10%
12 Conflicts with others such as family, neighbors, creditors 3 10%
DEMOGRAPHICS Self reported overall health is Good 17 58% Self reported overall health is Fair 10 34% Self reported overall health is Poor 1 3% Age 75+ 16 55% Minority 4 13% Low Income 14 48%

41
Table 5y
Rank Zip Code: 12582 Stormville Total Survey: 13
# Reporting
as a Problem
% Reporting
as a Problem
2 Understanding health insurance/Medicare 6 46%
5 Keeping up with medical costs 5 38%
5 Insufficient money for food, shelter, clothes 5 38%
1 Affording energy and utilities 7 53%
5 Managing household budgeting/bill paying 5 38%
2 Household chores and maintenance 6 46%
10 Feeling afraid/unsafe at home because you may fall or get injured 3 23%
10 Feeling afraid or unsafe at home because of possible crime 3 23%
2 Legal Affairs 6 46%
15 Loneliness, isolation or depression 2 15%
10 Disability or Impaired Mobility 3 23%
9 Transportation – including for medical, shopping, recreation, etc. 4 30%
5 Knowing where to obtain information about services and benefits 5 38%
10 Taking care of another adult 3 23%
10 Taking care of a grandchild 3 23%
16 Taking care of personal needs such as meals, bathing, dressing 1 7%
17 Conflicts with others such as family, neighbors, creditors 0 0%
DEMOGRAPHICS Self reported overall health is Good 8 61% Self reported overall health is Fair 1 7% Self reported overall health is Poor 1 7% Age 75+ 2 15% Minority 1 7% Low Income 4 30%
42
Table 5z
Rank Zip Code: 12583 Tivoli Total Survey: 10
# Reporting
as a Problem
% Reporting
as a Problem
11 Understanding health insurance/Medicare 1 10%
1 Keeping up with medical costs 4 40%
3 Insufficient money for food, shelter, clothes 3 30%
6 Affording energy and utilities 2 20%
11 Managing household budgeting/bill paying 1 10%
1 Household chores and maintenance 4 40%
11 Feeling afraid/unsafe at home because you may fall or get injured 1 10%
11 Feeling afraid or unsafe at home because of possible crime 1 10%
6 Legal Affairs 2 20%
6 Loneliness, isolation or depression 2 20%
3 Disability or Impaired Mobility 3 30%
6 Transportation – including for medical, shopping, recreation, etc. 2 20%
6 Knowing where to obtain information about services and benefits 2 20%
16 Taking care of another adult 0 0%
16 Taking care of a grandchild 0 0%
3 Taking care of personal needs such as meals, bathing, dressing 3 30%
11 Conflicts with others such as family, neighbors, creditors 1 10%
DEMOGRAPHICS Self reported overall health is Good 3 30% Self reported overall health is Fair 7 70% Self reported overall health is Poor 0 0% Age 75+ 8 80% Minority 0 0% Low Income 10 100%

43
Table 5aa
Rank Zip Code: 12585 Verbank Total Surveys: 9
# Reporting
as a Problem
% Reporting
as a Problem
8 Understanding health insurance/Medicare 0 0%
3 Keeping up with medical costs 1 11%
8 Insufficient money for food, shelter, clothes 0 0%
1 Affording energy and utilities 2 11%
3 Managing household budgeting/bill paying 1 11%
8 Household chores and maintenance 0 0%
3 Feeling afraid/unsafe at home because you may fall or get injured 1 11%
1 Feeling afraid or unsafe at home because of possible crime 2 22%
8 Legal Affairs 0 0%
8 Loneliness, isolation or depression 0 0%
8 Disability or Impaired Mobility 0 0%
3 Transportation – including for medical, shopping, recreation, etc. 1 11%
3 Knowing where to obtain information about services and benefits 1 11%
8 Taking care of another adult 0 0%
8 Taking care of a grandchild 0 0%
8 Taking care of personal needs such as meals, bathing, dressing 0 0%
8 Conflicts with others such as family, neighbors, creditors 0 0%
DEMOGRAPHICS Self reported overall health is Good 8 88% Self reported overall health is Fair 1 11% Self reported overall health is Poor 0 0% Age 75+ 0 0% Minority 0 0% Low Income 2 22%

44
Table 5bb
Rank Zip Code: 12590 Wappingers Falls Total Surveys: 162
# Reporting
as a Problem
% Reporting
as a Problem
2 Understanding health insurance/Medicare 53 32%
1 Keeping up with medical costs 60 37%
8 Insufficient money for food, shelter, clothes 24 14%
5 Affording energy and utilities 39 24%
6 Managing household budgeting/bill paying 30 18%
3 Household chores and maintenance 46 28%
13 Feeling afraid/unsafe at home because you may fall or get injured 15 9%
11 Feeling afraid or unsafe at home because of possible crime 16 9%
7 Legal Affairs 27 16%
10 Loneliness, isolation or depression 17 10%
11 Disability or Impaired Mobility 16 9%
9 Transportation – including for medical, shopping, recreation, etc. 19 11%
4 Knowing where to obtain information about services and benefits 43 26%
14 Taking care of another adult 13 8%
16 Taking care of a grandchild 4 2%
17 Taking care of personal needs such as meals, bathing, dressing 3 1%
15 Conflicts with others such as family, neighbors, creditors 11 6%
DEMOGRAPHICS Self reported overall health is Good 117 72% Self reported overall health is Fair 38 23% Self reported overall health is Poor 3 1% Age 75+ 90 55% Minority 31 19% Low Income 41 25%

45
Table 5cc
Rank Zip Code: 12592 Wassaic Total Surveys: 23
# Reporting
as a Problem
% Reporting
as a Problem
8 Understanding health insurance/Medicare 7 3000%
5 Keeping up with medical costs 9 39%
10 Insufficient money for food, shelter, clothes 6 26%
5 Affording energy and utilities 9 39%
8 Managing household budgeting/bill paying 7 30%
2 Household chores and maintenance 12 52%
14 Feeling afraid/unsafe at home because you may fall or get injured 5 21%
14 Feeling afraid or unsafe at home because of possible crime 5 21%
10 Legal Affairs 6 26%
2 Loneliness, isolation or depression 12 52%
1 Disability or Impaired Mobility 13 56%
4 Transportation – including for medical, shopping, recreation, etc. 11 47%
7 Knowing where to obtain information about services and benefits 8 34%
10 Taking care of another adult 6 26%
16 Taking care of a grandchild 2 8%
10 Taking care of personal needs such as meals, bathing, dressing 6 26%
17 Conflicts with others such as family, neighbors, creditors 1 4%
DEMOGRAPHICS Self reported overall health is Good 9 39% Self reported overall health is Fair 11 47% Self reported overall health is Poor 12 52% Age 75+ 13 56% Minority 2 8% Low Income 6 26%

46
Table 5dd
Rank Zip Code: 12594 Wingdale Total Surveys: 28
# Reporting
as a Problem
% Reporting
as a Problem
1 Understanding health insurance/Medicare 15 53%
2 Keeping up with medical costs 13 46%
7 Insufficient money for food, shelter, clothes 7 25%
3 Affording energy and utilities 12 42%
6 Managing household budgeting/bill paying 9 32%
7 Household chores and maintenance 7 25%
12 Feeling afraid/unsafe at home because you may fall or get injured 5 17%
5 Feeling afraid or unsafe at home because of possible crime 11 39%
7 Legal Affairs 7 25%
13 Loneliness, isolation or depression 4 14%
7 Disability or Impaired Mobility 7 25%
11 Transportation – including for medical, shopping, recreation, etc. 6 21%
3 Knowing where to obtain information about services and benefits 12 42%
16 Taking care of another adult 1 3%
16 Taking care of a grandchild 1 3%
15 Taking care of personal needs such as meals, bathing, dressing 2 7%
13 Conflicts with others such as family, neighbors, creditors 4 14%
DEMOGRAPHICS Self reported overall health is Good 15 53% Self reported overall health is Fair 11 39% Self reported overall health is Poor 2 2% Age 75+ 8 28% Minority 10 35% Low Income 7 25%

47
Table 5ee
Rank Zip Code: 12601 Poughkeepsie Total Surveys: 278
# Reporting
as a Problem
% Reporting
as a Problem
2 Understanding health insurance/Medicare 71 25%
1 Keeping up with medical costs 73 26%
6 Insufficient money for food, shelter, clothes 49 17%
8 Affording energy and utilities 48 17%
9 Managing household budgeting/bill paying 43 15%
5 Household chores and maintenance 55 19%
10 Feeling afraid/unsafe at home because you may fall or get injured 40 14%
11 Feeling afraid or unsafe at home because of possible crime 39 14%
13 Legal Affairs 32 11%
12 Loneliness, isolation or depression 35 12%
4 Disability or Impaired Mobility 60 21%
3 Transportation – including for medical, shopping, recreation, etc. 65 23%
6 Knowing where to obtain information about services and benefits 49 17%
14 Taking care of another adult 28 10%
17 Taking care of a grandchild 17 6%
15 Taking care of personal needs such as meals, bathing, dressing 25 8%
16 Conflicts with others such as family, neighbors, creditors 21 7%
DEMOGRAPHICS Self reported overall health is Good 147 52% Self reported overall health is Fair 110 39% Self reported overall health is Poor 19 6% Age 75+ 157 56% Minority 77 27% Low Income 161 57%

48
Table 5ff
Rank Zip Code: 12602 Poughkeepsie Total Surveys: 1
# Reporting
as a Problem
% Reporting
as a Problem
Understanding health insurance/Medicare 0 0%
Keeping up with medical costs 0 0%
Insufficient money for food, shelter, clothes 0 0%
Affording energy and utilities 0 0%
Managing household budgeting/bill paying 0 0%
Household chores and maintenance 0 0%
Feeling afraid/unsafe at home because you may fall or get injured 0 0%
Feeling afraid or unsafe at home because of possible crime 0 0%
Legal Affairs 0 0%
Loneliness, isolation or depression 0 0%
Disability or Impaired Mobility 0 0%
Transportation – including for medical, shopping, recreation, etc. 0 0%
Knowing where to obtain information about services and benefits 0 0%
Taking care of another adult 0 0%
Taking care of a grandchild 0 0%
Taking care of personal needs such as meals, bathing, dressing 0 0%
Conflicts with others such as family, neighbors, creditors 0 0%
DEMOGRAPHICS Self reported overall health is Good 1 100% Self reported overall health is Fair 0 0% Self reported overall health is Poor 0 0% Age 75+ 1 100% Minority 0 0% Low Income 0 0%

49
Table 5gg
Rank Zip Code: 12603 Poughkeepsie Total Surveys: 312
# Reporting
as a Problem
% Reporting
as a Problem
1 Understanding health insurance/Medicare 97 31%
2 Keeping up with medical costs 90 28%
13 Insufficient money for food, shelter, clothes 30 9%
7 Affording energy and utilities 49 15%
12 Managing household budgeting/bill paying 42 13%
4 Household chores and maintenance 77 24%
9 Feeling afraid/unsafe at home because you may fall or get injured 43 13%
9 Feeling afraid or unsafe at home because of possible crime 43 13%
6 Legal Affairs 50 16%
9 Loneliness, isolation or depression 43 13%
5 Disability or Impaired Mobility 62 19%
8 Transportation – including for medical, shopping, recreation, etc. 46 14%
3 Knowing where to obtain information about services and benefits 82 26%
14 Taking care of another adult 26 8%
17 Taking care of a grandchild 9 2%
16 Taking care of personal needs such as meals, bathing, dressing 12 3%
15 Conflicts with others such as family, neighbors, creditors 18 5%
DEMOGRAPHICS Self reported overall health is Good 202 64% Self reported overall health is Fair 101 32% Self reported overall health is Poor 8 2% Age 75+ 188 60% Minority 38 12% Low Income 99 31%

50
Table 5hh
Rank Zip Code: 12604 Poughkeepsie Total Surveys: 2
# Reporting
as a Problem
% Reporting
as a Problem
Understanding health insurance/Medicare 0 0%
2 Keeping up with medical costs 1 50%
Insufficient money for food, shelter, clothes 0 0%
Affording energy and utilities 0 0%
Managing household budgeting/bill paying 0 0%
Household chores and maintenance 0 0%
Feeling afraid/unsafe at home because you may fall or get injured 0 0%
Feeling afraid or unsafe at home because of possible crime 0 0%
Legal Affairs 0 0%
Loneliness, isolation or depression 0 0%
Disability or Impaired Mobility 0 0%
Transportation – including for medical, shopping, recreation, etc. 0 0%
1 Knowing where to obtain information about services and benefits 2 100%
Taking care of another adult 0 0%
Taking care of a grandchild 0 0%
Taking care of personal needs such as meals, bathing, dressing 0 0%
Conflicts with others such as family, neighbors, creditors 0 0%
DEMOGRAPHICS Self reported overall health is Good 2 100% Self reported overall health is Fair 0 0% Self reported overall health is Poor 0 0% Age 75+ 0 0% Minority 0 0% Low Income 0 0%
51
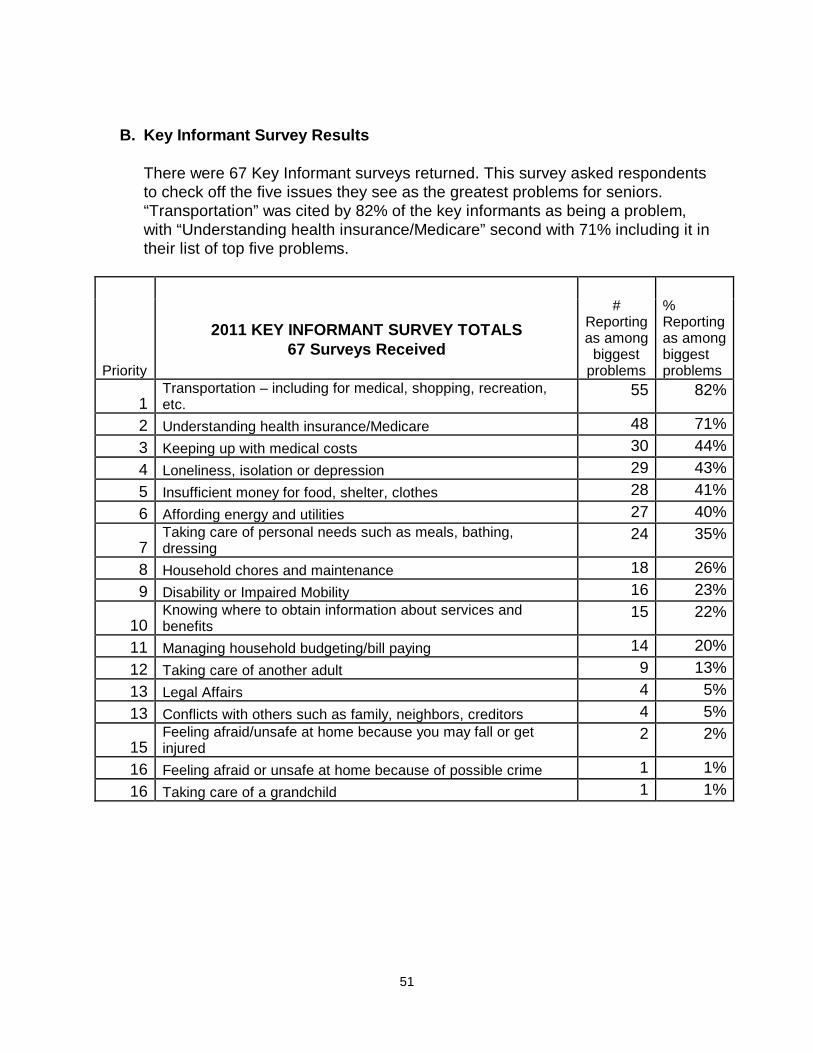
B. Key Informant Survey Results
There were 67 Key Informant surveys returned. This survey asked respondents to check off the five issues they see as the greatest problems for seniors. “Transportation” was cited by 82% of the key informants as being a problem, with “Understanding health insurance/Medicare” second with 71% including it in their list of top five problems.
# Reporting as among
biggest problems
% Reporting as among biggest problems Priority
2011 KEY INFORMANT SURVEY TOTALS 67 Surveys Received
1 Transportation – including for medical, shopping, recreation, etc.
55 82%
2 Understanding health insurance/Medicare 48 71% 3 Keeping up with medical costs 30 44% 4 Loneliness, isolation or depression 29 43% 5 Insufficient money for food, shelter, clothes 28 41% 6 Affording energy and utilities 27 40%
7 Taking care of personal needs such as meals, bathing, dressing
24 35%
8 Household chores and maintenance 18 26% 9 Disability or Impaired Mobility 16 23%
10 Knowing where to obtain information about services and benefits
15 22%
11 Managing household budgeting/bill paying 14 20% 12 Taking care of another adult 9 13% 13 Legal Affairs 4 5% 13 Conflicts with others such as family, neighbors, creditors 4 5%
15 Feeling afraid/unsafe at home because you may fall or get injured
2 2%
16 Feeling afraid or unsafe at home because of possible crime 1 1% 16 Taking care of a grandchild 1 1%

52
C. Caregiver Survey Results
Twenty eight responses to the survey of caregivers were returned. The survey sought to determine which services caregivers needed and of those, which ones were received and which ones were not received. Additionally, it sought to determine what benefits accrued to those caregivers receiving services. Of those responding, the services most frequently needed and received were “Caregiver workshops, conference, support groups and counseling” and “Help or information about and connecting to services and resources.” Services most frequently cited as having been needed but not received were “Respite Care – Social Adult Day Care” and “Respite Care – Overnight Respite.” With respect to the benefits derived by the caregiver as a result of services received, the most frequently cited benefits were the following: “Learned more about care receiver’s condition or illness,” “Gained a better understanding of how to get needed services,” “Felt more confident in providing care to care receiver,” and “Felt less stress.” The tables below illustrate the findings:
1. Service Needs - Services Needed and Received vs Services Needed but Not Received
Needed and Received
Needed but Haven't
Received # % # % Help or information about and connecting to services and resources 12 43% 4 14% Caregiver workshops, conference, support groups, counseling 13 46% 5 18%
Respite Care – Social Adult Day Care 2 7% 8 29%
Respite Care - Homemaking or Personal Care Services 2 7% 5 18%
Respite Care – Overnight Respite 0 0% 6 21%
Case Management 3 11% 4 14%
Personal Emergency Response System (Lifeline) 5 18% 2 7%
Home Delivered Meals 2 7% 1 4%
Transportation 2 7% 3 11% Other (please describe): Advocacy and Assistance, Nursing, Daytime Groups 0 0% 3 100%

53
2. Service Results As a result of services received, have you: Yes No # % # %
Had more time for personal or work activities? 3 30% 7 70%
Felt less stress? 10 63% 6 37%
Gained a better understanding of how to get needed services? 12 71% 5 29%
Learned more about your care receiver’s condition or illness? 14 82% 3 18%
Felt more confident in providing care to your care receiver? 11 85% 2 15%
Found that the services enabled you to provide care longer? 7 70% 3 30%
Thought the services you receive benefit the care receiver too? 9 90% 1 10%
Thought the services the care receiver received benefit you too? 9 90% 1 10%
Obtained other services, such as HEAP, EPIC, Legal? 2 20% 8 80% Receive other benefits (please describe)? "We are more self sufficient now" 1 100% 0 0%

54
D. Dutchess NY Connects Intakes Data
The majority of requested information pertains to home- and facility-based services. Among the home-based services of greatest interest are home health care, personal care, personal emergency response systems and home-delivered meals. Facility-based services include nursing services and adult day programs. A high volume of intakes relate to consumer and caregiver supports, as well as insurance and benefits information. A great number of calls related to consumer and caregiver supports inquire about case or care management, food stamps, senior centers, respite care and support groups. Insurance and benefits inquiries most often relate to general information about Medicaid, information or counseling regarding Medicare or health insurance and government-subsidized prescription drug benefits. The call breakdown is summarized below.
Dutchess NY Connects Intakes: Breakdown of Requested Information April 1, 2010 – March 31, 2011 Total intakes for the period: 2, 197
Topic Area Number Consumer and Caregiver Supports 870 Facility-Based Services 1,089 Home-Based Services 1,403 Insurance/Benefits 833 Protective and Prevention Services 64 Residential/Housing Options and Supports
341
Transportation Services 146 Other 459
Further detail is provided in Appendix D.
E. Public Hearings Findings
• Town of Poughkeepsie Public Hearing
The only topic raised by more than one person concerned the location of the senior picnic for Town of Poughkeepsie residents. Two persons expressed two different concerns about the location. Other matters raised by attendees in Poughkeepsie related to the suggested donation for congregate meals, Dial-A-Ride, getting information out to seniors, and the “Do Not Call” list.
• Beacon Public Hearing

55
In Beacon a roundtable-type of discussion was held due to the relatively small number of participants (11). The two topics discussed were transportation issues pertaining to the LOOP bus and ways to get more seniors participating at the Senior Friendship Center.
• Millerton Public Hearing
In Millerton several attendees brought up the need for transportation.
Minutes of the public hearings are included as an Appendix. F. Dutchess County Community Health Report Findings
It is important to keep in mind the smaller sample size of senior participants with regard to the validity of the data. The total sample size of the Community Health Survey is 1,000 respondents. Of the total, 21%, or 210 respondents, are over age 60. Seventy individuals are in the 75+ age group.
The data presented here represent the areas of greatest concern expressed by seniors as well as the largest areas of unmet need as expressed by senior participants in the Community Health Survey. The breakdown by age group provided in the Community Health Report shows the following for seniors:
Greatest Concerns: • Unsafe driving/roads (approximately 47% of 60-74, 51% of 75+) • Community readiness for natural disaster or other emergency (approximately
31% of 60-74, 32% of 75+) • Lyme disease and other insect-related diseases (71% of 60-74, approximately
58% of 75+) • Unsafe housing conditions (approximately 70% of 60-74, 68% of 75+) Unmet Need: • Healthcare services (approximately 17% of 60-74, 12% of 75+) • Dental care (approximately 6% of 60-74, 7% of 75+)
G. National Unmet Need for Services Data
The Federal Report on Unmet Need for Services shows the following for meal services, home care and transportation:
• Meal Services
Federal unmet need for services data reveal that nationwide, most low-income older adults in need of meal programs did not receive them in 2008. The Current Population Survey reports: “[Approximately 9 percent of an estimated 17.6 million low-income older adults received meals services” (United States Government, 2011). After an examination of all data sources, however, the General Accountability Office GAO suggests that unmet need for services is

56
even greater. The report suggests an estimated 90 percent of food insecure low-income older adults did not receive meals services.
• Home-based Care
An analysis of data from the 2008 Health and Retirement Study shows that approximately 29 percent of older adults, regardless of income level, experience difficulties with daily activities. Federal unmet need for services data illustrates that nearly 80 percent of older adults received limited assistance or none at all. This trend is shared among older adults with varying amounts of difficulty with activities of daily living.
• Transportation Services
Examination of data from the 2008 Health and Retirement Study reveals an estimated 21 percent of individuals over the age of 65 are likely to need transportation services. The GAO did not have access to sufficient data to draw conclusions about the extent to which this need is met or unmet, but the study discusses unofficial clues about the degree to which older adults likely to be in need may or may not receive transportation assistance (United States Government, 2011). Data collected from state and local agencies on aging hint that there might be substantial unmet need. Approximately 62 percent of state and local agencies that participated in the web-based survey for the study cited transportation services among the most requested. Additionally, of the agencies that provide transportation services, an estimated 26 percent struggle to meet all transportation requests (United States Government, 2011).
Source for National Unmet Data:
United States Government Accountability Office, (2011). Older Americans Act:
More should be done to measure the extent of unmet need for services (GAO-11-237). Retrieved from http://www.gao.gov/new.items/d11237.pdf
H. Outcomes and Client Satisfaction Data
1. Nutrition Services
Findings from Nutrition Services client surveys show the following with respect to services received:
• 92% of Congregate Meals clients feel the meals meet their nutritional needs,
help them remain independent and that the social contact at the Friendship Centers improve their sense of well being;
• 88% of Congregate Meals clients feel the Friendship Center transportation services are beneficial;
• 99% of Home Delivered Meals Clients feel the service helps them to remain independent;
• 97% of Home Delivered Meals Clients feel the interaction with the meal delivery person helps them to feel less isolated;
57
• 91% of Frozen Meals Clients feel the service helps them to remain independent;
• 91% of Frozen Meals Clients feel the interaction with the meal delivery person helps them to feel less isolated.
2. Expanded In Home Services to the Elderly Program (EISEP) Services
Findings from EISEP Services client surveys show the following with respect to services received:
• 99% of EISEP clients feel the services they receive (case management,
home care, social adult day care, personal emergency response systems) help them to remain independent;
• 73% of EISEP clients report the program has provided them with services they would otherwise not be able to afford;
• 65% of EISEP clients report the program has made them feel safer and more secure in their home;
• 63% of EISEP clients report the services they receive relieve some of the burden on their other caregivers.
3. Legal Services
Findings from Legal Services client surveys show the following with respect to services received:
• 96% of clients report the service is important in assisting them to remain
independent.
4. Dutchess NY Connects Intake, Information and Referral Findings from Dutchess NY Connects Intake, Information and Referral client surveys show the following with respect to services received:
• 96% of clients found the information received from Dutchess NY Connects to
be helpful and reported that they would contact Dutchess NY Connects again and would recommend it to others;
• 77% of clients reported that Dutchess NY Connects staff provided them with information on the program/service they were inquiring about;
• 96% of clients stated they think Dutchess NY Connects is a good program to have in the community.
5. Senior Exercise Program Findings from Senior Exercise Program client surveys show the following with
respect to services received:
• 95% of clients report improved balance and strength; • 88% of clients report the program helps them to maintain their
independence;

58
• 76% of clients report they experience reduced isolation, reduced loneliness and reduced depression as a result of being in the program.
IV. Analysis and Findings
Given the volume of data produced by the various surveys and other sources, the analysis and findings must weigh the voices of the senior population, those who serve them, their caregivers, and data produced by other sources. In evaluating each separately, the following is found:
A. The Senior Population
1. Senior Survey
According to the Senior Survey, the top five problems expressed are the following: a. Understanding health insurance/Medicare – 32% b. Keeping up with medical costs – 31% c. Knowing where to obtain information about services and benefits – 25% d. Household chores and maintenance – 23% e. Affording energy and utilities – 21%
Taken in the context of the percentage of seniors reporting these issues to be a problem for them, it would appear that there are a large number of seniors who could use assistance in this area.
2. Outcomes and Client Satisfaction
The various Outcomes and Client Satisfaction measures discussed earlier indicate that the services covered (nutrition, in home services, senior exercise, legal, information and referral) are all services which have a high impact on the ability of seniors to remain in the community. The specific outcomes and manner in which this is accomplished vary, but include the following:
a. Feeling more secure at home b. Meeting nutritional needs c. Reduced loneliness, isolation and depression d. Increased socialization
B. Caregivers
1. Dutchess NY Connects Intake, Information and Referral The Dutchess NY Connects database reports do not separate out topics by type of caller, so the call topics above represent family caregivers, seniors and

59
service providers. The data is included under caregivers because of the three types of callers, caregivers represent the greatest number.
Looking at the Dutchess NY Connects Intake, Information and Referral statistics, analysis of the numbers show the top five items callers are provided information on, are the following: a. Home health care and/or personal care b. Medicaid c. Personal emergency response systems d. Case management e. Food stamps
It should be noted that topics of information provided may not represent the initial topic the caller was calling about. It is frequently upon discussion with the intake worker; information on a variety of topics and services is provided.
2. Caregiver Survey The Caregiver survey results indicate the greatest unmet need is in the area of Respite care. The greatest area of met need is information and support.
C. Key Informants
The survey of those working with seniors shows the following as the top problems: 1. Transportation – 82% 2. Understanding health insurance/Medicare – 71% 3. Keeping up with medical costs – 44% 4. Loneliness, isolation or depression – 43% 5. Insufficient money for food, shelter or clothes – 41% The percentages listed reflect the percentage of key informants who listed that particular problem or issue among what they believe to be among the top five issues faced by senior citizens.
D. Other Data Sources The other data sources presented shed further light on senior citizen concerns and needs. 1. U.S. Government Accountability Office Study on Older Americans Act
Programs Federal data indicates there is unmet demand for nutrition services (congregate and home delivered meals), in home services (such as housekeeping and personal care) and transportation.
2. Dutchess County Community Health Survey
The Dutchess County Community Health Survey indicates the greatest areas of concern expressed by seniors in response to health related questions were the following:

60
• Lyme disease and other insect-related diseases (71% of 60-74,
approximately 58% of 75+); • Unsafe housing conditions (approximately 70% of 60-74, 68% of 75+).
3. Public Hearing Minutes
Minutes from the 2010 Dutchess County public hearings showed the greatest concerns expressed related to unmet transportation needs and the need for senior center activities.
E. Discussion and Designation of Greatest Unmet Need
In weighing the various findings, consideration must be given to a number of factors: • For Intake, Information and Referral topic areas against the Senior Survey
problems, callers to Dutchess NY Connects are already experiencing a problem situation or a need. Thus, the areas inquired about by the callers to Dutchess NY Connects may be considered more acute or active. Also worth noting is that calls to Dutchess NY Connects tend to be more closely related to long term care needs by the very nature of the Dutchess NY Connects program.
• Those completing the senior survey, on the other hand, are being presented
with a list of possible problems, so while an individual may respond that an issue is a problem, he or she may not have thought it to be a problem until being asked.
• In considering the senior survey results, weighing the impact of certain needs
being unmet or certain problems against the impact of others requires judgment calls which may result in differing views of what might be the top problem. As an example, while fewer seniors report having transportation problems than those reporting problems figuring out health insurance, which is really the greater problem for the community and for the individual – is it more significant that 32% of seniors say they have a problem understanding their health insurance or that 16% have problems getting transportation, possibly to the doctor? Another example, while 12% of seniors say that acting as caregiver to another adult or a grandchild is a problem for them, but nearly double that, 23%, report household chores and maintenance are a problem, which is truly the larger problem?
• The results of the senior survey are provided separately for three target groups:
minorities, age 75+ and low income seniors. • The key informant survey results were examined for their similarities to and
differences from the senior survey. While the top problems are for the most part similar, the top problem noted by these key informants is transportation at 82%. On the other hand, transportation is number 8 on the list of problems identified by the overall senior population at 16%. Analysis of this variation points out that

61
the senior survey is designed and administered to be more reflective of the overall 60+ population, whereas, the key informant survey is taken of those who work with seniors in such capacities as housing managers, case managers, etc. These seniors are more likely to be older, frailer and lower income.
• An analysis of Outcome and Client Satisfaction data shows that the services are designed to meet a number of the identified problem areas found in the surveys and other data review. For most services, the outcomes go beyond the specific service being provided. For instance, the congregate meals program and related transportation does more than address nutritional needs. It also addresses the issue of loneliness, isolation and depression.
• The data from the U.S. General Accountability Office confirm the local anecdotal
experience as well as the local survey findings: there is unmet need in transportation and home care. In the area of nutrition services, the federal study also finds widespread unmet need. In Dutchess County those needing home delivered and/or congregate meals are able to obtain those meals provided they reside in an area where there is meal delivery and/or transportation to senior centers. There are several pockets in the county where meal delivery and senior center transportation are not available.
After studying the available data and weighing the above considerations, it has been determined that the five greatest areas of unmet need for the senior population in Dutchess County include the following:
• Transportation; • Understanding health insurance/Medicare; • Keeping up with medical costs; • Knowing where to obtain information about services and benefits; • Household chores and maintenance.
In light of the discussion above and the difficulty in weighing importance of data sources and the seriousness of various problems, these are not presented in any particular order and should be treated equally. The other problems and areas of unmet need identified through the various surveys should not be ignored. For the most part they do represent areas of need among the senior population and caregivers in Dutchess County. Although the top five areas will be identified as priority areas resulting from the Needs Assessment, these additional needs should also be considered in the local service matrix. Since results of the senior survey have also been provided for each zip code, service providers, funders and local municipalities may wish to consider the data from their geographic areas of interest when making service and funding decisions. Caution should be exercised when working with very small numbers of surveys; however, zip codes may be combined for more viable “regional” findings.

62
V. Establishment of Priorities
Priorities for the 2012-2016 Four Year Area Plan on Aging will be established based on consideration of the following funding, public policy, needs assessment and resource factors:
Funding and Public Policy Related Factors
Available funding Parameters of available funding Federal Priority Service Expenditure Requirements Local Executive and Legislative decision making and budgeting
Needs Assessment Related Factors Senior Survey Results Key Informant Survey Results Outcomes and Client Satisfaction Data Service Demand Data
Local Resources Availability of services in the community Availability of community service providers
A separate document on priorities will be produced following review of the Needs Assessment and consideration of the other factors listed above in development of the Four Year Plan.
VI. Resource Inventory The Dutchess County Division of Aging Services has established and maintains an extensive resource inventory. It is available in its entirety online at: http://www.co.dutchess.ny.us/CountyGov/Departments/Aging/14263.htm
Screen shots of the table of contents and subheadings are found as Appendix E. Each topic area includes a narrative on the topic followed by a listing of all resources providing the particular service or other appropriate listings. This resource inventory is widely used by service providers and seniors alike. For those who do not have computer access, agency personnel may print out particular sections to mail or provide
contact information over the telephone.

63
VII. Appendices Appendix A - 2007 Senior Survey Results for comparison purposes 1628 Completed Surveys
Rank Problem Area
Number Identifying
as a Problem
% of Total Identifying as
a Problem
1 Energy/utilities 869 53%
2 Money to live on 867 53%
3 Figuring out health insurance/Medicare 749 46%
4 Crime 737 45%
5 Home maintenance 664 41%
6 Mobility/disability/health issues 641 39%
7 Health care 620 38%
8 Getting information about services/benefits 561 34%
9 Transportation 530 33%
10 Loneliness/isolation 402 25%
11 Legal affairs 379 23%
12 Housing 333 20%
13 Nutrition/food 330 20%
14 Employment 329 20%
15 Taking care of another adult 234 14%
16 Taking care of a grandchild 124 8%

64
Appendix B - 2007 Key Informant Survey Results 88 Completed Surveys
Rank Problem Area
Number Identifying
as one of the top 3 unmet
needs/ problems faced by Seniors
Percentage Identifying as one of the top 3
unmet needs/
problems faced by Seniors
1 Transportation 58 66%
2 Health Care 33 38%
3 Mobility/Disability Health Issues 28 32%
3 Money to Live On 28 32%
5 Loneliness/Isolation 26 30%
6 Housing 23 26%
7 Figuring out Health Insurance/Medicare 17 19%
8 Getting Information about Services/Benefits 15 17%
9 Home Maintenance 13 15%
10 Energy/Utilities 9 10%
11 Taking care of another adult 7 8%
12 Nutrition/Food 4 5%
13 Taking Care of a Grandchild (or other relative child) 3 3%
14 Crime 2 2%
15 Employment 2 2%
16 Legal Affairs 1 1%

65
Appendix C - Public Hearing Minutes
Dutchess County Office for the Aging Public Hearing
Tri Town Senior Friendship Center September 21, 2010
Minutes
Present: 64 persons in attendance, see sign in sheet. Office for the Aging Director John Beale welcomed those present and asked that everyone sign the attendance sheet. He introduced Office for the Aging Advisory Board members Barbara Good and Robert Oppenheim who will chair the public hearing and OFA Aging Services Coordinator Mary Kaye Dolan who is taking notes. Mr. Oppenheim explained that each year the Office for the Aging Advisory Board conducts several public hearings in conjunction with development of the Annual Implementation Plan for the department. The hearings are moved around the county each year. We are looking to find out how we are doing at meeting the needs of seniors and want to know whether seniors are satisfied with services, how the services impact you and whether there are any issues or comments on programs or needs that you would like us to know. Mary Fratoni asked why the meals in the nutrition program at Tri Town are $3 while they are 75 cents or $1 at other senior centers. Mr. Beale replied that the $3 is a confidential suggested donation. Those who can’t afford to make the donation or choose not to will not be denied a meal or have their service impacted in any way. The $3 suggestion is the same at all Dutchess County Senior Friendship Centers. Celeste Pavone stated that the picnic locations are difficult to get to with too many hills to climb, insufficient cover and inconveniently located restrooms. She suggested finding a more senior friendly location. The Tri Town seniors attended the Bowdoin Park picnic this year. John Beale replied that there are tents set up at Bowdoin Park. Celeste Pavone stated that the Office for the Aging does a wonderful job for the elderly. Her mother needed services and received all the services she needed. Dave ? stated that he is a retired teacher and does not avail himself of services. He wondered whether the Office for the Aging could get names and addresses from Social Security of all seniors in order to let them know of our existence and the services we provide. Barbara Good answered that there are various privacy laws that would prevent that and added that outreach is always a challenge. She added that the Office for the Aging does a lot of outreach such as John Beale’s column, the website, brochures, picnics.

66
Bob Oppenheim stated that brochures have gone out to various medical offices. John Beale stated that we tend to be in the “need to know” business, meaning that people don’t always want to know about what we do until they need a service, so we are always doing outreach. He added that when anyone calls the Office for the Aging they get a live person, not a voice mail or menu system. Bob Oppenheim stated he was thankful for the suggestion regarding Social Security and perhaps we can look into getting Office for the Aging brochures displayed at Social Security. JoAnne ? stated that she receives a postcard each year for the picnic. Ross ? stated that for those with computers and e-mail you can get frequent updates and information from the Office for the Aging. He stated he is always receiving information from Office for the Aging. John Beale stated that there are 800 names on the Office for the Aging e-mail distribution list and we ask at picnics if seniors want to be added to the list. Mary Fratoni suggested that information be put in supermarkets. Barbara Good gave out the Office for the Aging phone number for anyone who has questions or needs information: 845-486-2555. Philomena ? stated that she uses Dial A Ride to come to the center and has to call every three times she comes. She also stated that there was one time her son forgot to book a ride and when she tried the day before to schedule a ride they were unable to take her. Is there a way to book more than three days service at a time? John Beale replied that he will work on this. Pat ? stated that the do not call number to keep telemarketers from calling you is 888-382-1222. ? stated that they had a therapist from St. Francis and she was wonderful. ? stated that her mother in law has 24 hour care but her money will run out soon. Will Medicaid pay? She has tried to obtain information from Social Services, but she did not find the information they sent to be useful. She also stated that she has dealt with the Office for the Aging many times before as her mother and father both had Office for the Aging services and they were wonderful. John Beale stated that she should call our office at 845-486-2555 and say that she needs information on long term care and someone from Intake will assist her. Barbara Good mentioned that there is a Nursing Home Without Walls program that is designed to provide the same services people would receive in a nursing home in their own home. ? stated that their group did not go to the picnic at Bowdoin Park this year because there were so
67
many bugs last year. Did they spray this year? Bob Oppenheim stated that this was a much dryer year so there weren’t as many bugs anywhere as last year. Mary Burkhard asked if one of the reasons to keep people at home is to keep people from going on Medicaid in a nursing home. She stated that sometimes people should be in a nursing home. She stated that in the housing facility she lives in, someone was found dead in their apartment and she believes the person should have been in a nursing home. Barbara Good stated that it is always a challenge to determine the best setting for a person. If anyone knows of someone they feel is in an unsafe situation, they should contact the Department of Social Services Adult Protective Services at 486-3000. With no one else wishing to be heard, attendees were reminded that if they think of something later, please write to the Office for the Aging. The public hearing was adjourned at 11:40 a.m. Mary Kaye Dolan

68
Dutchess County Office for the Aging
Public Hearing Beacon Senior Friendship Center
September 27, 2010 Minutes
Present: 11 persons in attendance, see sign in sheet. Office for the Aging Advisory Board members Brigitte Amodeo and Kathy DeLisa opened the public hearing. With such a small number of persons in attendance the hearing was conducted somewhat like a focus group with the sharing of comments, suggestions thoughts and ideas between those in attendance and the Advisory Board members. Brigitte Amodeo stated that the Beacon Center is lucky to have meals on Fridays provided by civic groups as in East Fishkill there are no Friday meals. There was discussion around the table about the lack of transportation and the loss in Loop service. Currently, the bus to Walmart only goes every two hours which is not enough because if you miss the bus you have to wait two hours. There have been cutbacks, and there is also a problem with the weekend service. The BLT transportation was discussed, noting that it stops at the hotel across from Walmart but does not stop at Forrestal Heights. The service is designed to get tourists to Main Street in Beacon and Fishkill on weekends. Loop bus service on weekends was discussed. Paul Sund stated that he would like to have more parties and activities at the Friendship Center. He stated that they have tried movies and Bingo but they were not successful. Kathy DeLisa stated she was surprised that Bingo did not go over well as when she was the Director of the Wappinger Center she would have 80 seniors attend for Bingo. Paul Sund said he would like to have some events outside of the building, for example, Stonykill. Brigitte Amodeo stated that these kinds of trips do cost money. She noted that the way East Fishkill handles them is that the Town pays for the bus and seniors pay their entry to the event or meal, whatever the case may be. She suggested seniors approach the City of Beacon for assistance. Charlotte Marmo stated that Martin Luther King Cultural Center takes people places but you have to make a reservation and the availability is limited. Kay Boyle stated that MLKCC takes them to Shop Rite or Walmart on Wednesdays and you have to call ahead. They also take people to dialysis and other medical appointments as well as delivering the home delivered meals. She added that she used to live in Fishkill and used Dial A Ride which was

69
nice because they came right to your door. Paul Sund stated that the BLT service goes to the center of town. Kay Boyle stated that there are a lot of people who are disabled and can’t get on a bus. Donna Dieli stated that she is fortunate in that she has a car and still drives. She does sometimes provide rides for other people. Kay Boyle stated the Loop buses are too high to step up onto, and the drivers say the lifts are broken. Paul Sund stated that he told the Mayor that he wants to have a function in life. He is looking for things to do. He stated that he signed up at the new Welcome Center in Beacon to volunteer but has not heard anything. Dona Dieli suggested that he go to Castle Point to volunteer. Paul Sund stated that there is no bus that can get you into Castle Point – you have to walk from the highway one way and the other way they will pick you up inside. Kathy DeLisa asked if the seniors have computers? She added that there is so much that can be done and learned on the computer, including keeping in touch with family. Paul Sund stated that he would like to have interactive exercise on a Wii Fit system and would also like to have Brain Games. John Beale asked if anyone participates in the Senior Exercise Program – there are two classes in Beacon. Charlotte Marmo stated that Tracy Cesar (Site Manager) and Meredith Booth need to get involved in trying to get people to take part. Events are scheduled but no one shows up or they get an attitude and don’t want to participate. She specifically referred to Brain Games and the artist that used to come. Kay Boyle stated that they even tried sewing, but everyone wanted to take it back to their apartments to do instead of sewing together. She added that she notices when the people from the Fishkill Friendship Center come they seem to be more friendly and interested in activities than those in Beacon. With no one else wishing to be heard the public hearing was closed at 11:30. Mary Kaye Dolan

70
Dutchess County Office for the Aging Public Hearing
Millerton Senior Friendship Center September 29, 2010
Minutes
Present: 22 persons in attendance, see sign in sheet. Office for the Aging Director John Beale welcomed those present and asked that everyone sign the attendance sheet. He introduced Office for the Aging Advisory Board member Patty Moore of the Community Resource and Service Center of Pawling who will be co-chairing the public hearing and OFA Aging Services Coordinator Mary Kaye Dolan who is taking notes. Odvisory Board President Raymon Oberley will also be in attendance to co-chair the Public Hearing. Howard Milton asked why Fridays were taken away but Poughkeepsie still has them. John Beale responded that the Office for the Aging had to reduce county expenses for this year. Of the ten Friendship Centers that we had in 2009, one was closed entirely in 2010, and eight were switched to four day per week operation. One site, the City of Poughkeepsie, was left at five days as the state requires that we have at least one Nutrition Site open every day. Katherine Garzetta asked why the Millerton OFA van was taken away. She stated that so many people aren’t able to get to the center now and the van was also used for home delivered meals. Getting a van back should be at the top of the list. John Beale stated that OFA had to reduce costs and he hopes in the future that a van will be made available in Millerton again. Ray Oberley, OFA Advisory Board President, was introduced by Patty Moore. Kathleen Healy asked if Millerton would ever get a van for traveling. John Beale said, at the moment, no we would not be able to do that. Kathleen Healy stated that it would not even need to be a new van – a used van would do. Katherine Garzetta stated that there is such a need for transportation. There is not even any Mass Transit or Loop service in Millerton. John Beale asked if anyone participates in the Senior Exercise Program. One person stated she used to participate and then had a heart attack, so does not go anymore. John Beale encouraged those in attendance to take part in the program at the North East Community Center.

71
Ray Oberly asked how many attended the OFA picnic this year. Two persons stated they attended. Others said they did not have transportation, that 6-8 used to go in the van. Silvia Shultz stated that they need transportation. With no one else wishing to be heard, it was announced that additional comments may be made in writing and sent to the Office for the Aging. The public hearing was adjourned at 11:45 a.m. Mary Kaye Dolan

72
Appendix D - Dutchess NY Connects Intake Details (New York State defined categories and topics)
1 Consumer and Caregiver Supports a Advocacy 54 b Assistive Technology Equipment 40 c Caregiver Training 17 d Case/Care Management 423 e Centers for Independent Living 3 f Condition Specific Rehabilitation Services 21 g Friendly visiting 66 h Outreach Programs 74 i Respite Care 133 j Senior Centers 159 k Vocational Rehabilitation 0
1.1 Children Specific a Child Care Provider Referrals 0 b Early Intervention- Children with Disabilities/Delays 0 c Special Education Assessment 4
1.2 Nutrition Specific & Wellness a Congregate Meals/Nutrition Sites 93 b Food Stamps 316 c Nutrition Assessment Services 16 d Nutrition Education 0 e Food Pantries 21 f WIC 0
1.3 Support Groups/Counseling a Aging/Older Adult Support Groups 21 b Caregiver/Care Receiver Support Groups 193 c Caregiver Counseling 50 d Disability Related Support Groups 44 e Specialized Counseling Services 13 2 Facility Based Services a Adult Day Health Programs 111 b Adult Day Programs (Social) 139 c Nursing Facilities 138

73
Appendix D (continued) - Dutchess NY Connects Intake Details
3 Home Based Services a Companionship 76 b Home Delivered Meals 199 c Home Health Care 1322 d In Home Attendants for People with Disabilities 11 e Personal Care 1151 f Personal Emergency Response System 610 g Private Duty Nursing 28 h Telephone Reassurance 21 4 Insurance/Benefit Information & Counseling a Government Subsidized Prescription Drug Benefits 93 b Health Insurance Information & Counseling 182 c Long Term Care Insurance Information/Counseling 18 d Managed Health Care Information 12 e Managed Information/Counseling 209 f Medicaid(General Info) 893 g Prescription Drug Patient Assistance Programs 50 h Veterans Benefits Assistance 78 i Welfare Rights Assistance 1 5 Protective/Preventative a Adult Protective 96 b Children's Protective Services 1 6 Residential/Housing Options and Support a Adult Residential Care Homes 112 b Assisted Living Facilities 191 c Congregate Living Facilities 76 d Low Income/Subsidized Rental Housing 84 e Utility Bill Payment Assistance 143 f Weatherization Programs 38
6.1 Home Modification and Repairs a Home Barrier Evaluation/Removal 2 b Home Rehabilitation/Repair Services 16 c Home Maintenance and Minor repair Services 19 d Yard Work 0
Appendix D (continued) - Dutchess NY Connects Intake Details

74
7 Transportation a Automobile/Van Adaptations 5 b Disability Related Transportation 14 c Escort Programs 11 d Medical Transportation 110 e Senior Ride Programs 119 8 Other a Health Care Referrals 131 b Hospice 36 c Household Safety Education 4 d Interpreter Registries 1 e Legal Services 0
e.1 Guardianship Assistance 9 e.2 Advance Medical Directives 11 e.3 Other 62
f Property Tax Exemption Information 6 g Substance Abuse 0 h Other 412

75
Appendix E - Resource Directory Screen Shots

76

77

78