Dust Dispersion Study August 2013
43
TANBREZ MINING GREENLAND A/S TANBREEZ PROJECT Dust Dispersion Study August 2013 AirQuality.dk Document no. 1 Revision no. 2 Date 28 August 2013 Prepared by Douglas R. Clark
Transcript of Dust Dispersion Study August 2013
TANBREZ MINING GREENLAND A/S
TANBREEZ PROJECT
Dust Dispersion Study
August 2013
AirQuality.dk
Document no. 1
Revision no. 2
Date 28 August 2013
Prepared by Douglas R. Clark

Dust Dispersion Report 2 / 43
TANBREEZ Project
PREFACE
This report assesses the impact of dust from the project activities during operation of
the proposed mine. This annex documents the dust sources and the methodology used
for calculating dust emission and dispersion from project activities. Annual dust emis-
sions and the potential heavy metal content of dust emissions are estimated. The re-
sults of dispersion modeling of dust (TSP) and PM10 emissions are presented in maps
over the project area. The calculated ambient PM10 concentrations are compared to EU
limit values. The impact of annual dust deposition in the surroundings of the project is
discussed, including potential load of metals and rare earth elements.
Dust dispersion modelling has been carried out separately by Golder Associates. The
results of the dispersion modelling study are summarized in this report.

Dust Dispersion Report 3 / 43
TANBREEZ Project
TABLE OF CONTENTS
1 Summary and Conclusion ................................................................................................ 6
2 Introduction ........................................................................................................................ 9
2.1 Scope of Work ..................................................................................................................... 9
2.2 Project Setting ..................................................................................................................... 9
2.3 Legislative Framework ....................................................................................................... 10
3 Project Activities and Estimated Emissions................................................................. 13
3.1 Approach ........................................................................................................................... 13
3.2 Scenarios ........................................................................................................................... 13
3.3 Emission Sources .............................................................................................................. 14
3.4 Operation Schedule and Production Rates ....................................................................... 15
3.5 Emission Methodology ...................................................................................................... 17
3.6 Estimated Emissions ......................................................................................................... 18
4 Dust Dispersion ............................................................................................................... 20
4.1 Methodology ...................................................................................................................... 20
4.2 Model Results .................................................................................................................... 21
5 Dust Deposition ............................................................................................................... 24
5.1 Annual Total Dust Deposition ............................................................................................ 24
5.2 Impact of Dust Deposition ................................................................................................. 25
5.3 Emission of Metals and REE ............................................................................................. 26
5.4 Deposition of Metals and REE .......................................................................................... 29
6 Conclusion ....................................................................................................................... 32
7 References ....................................................................................................................... 34
8 Appendix 1 – Details of Emission Calculations ........................................................... 36 8.1.1 Drilling ................................................................................................................................ 36 8.1.2 Blasting .............................................................................................................................. 36 8.1.3 Excavator loading of haul trucks ....................................................................................... 36 8.1.4 Wheel loader in pit ............................................................................................................. 36 8.1.5 Haul trucks and other vehicle travel on unpaved roads .................................................... 37 8.1.6 Grading .............................................................................................................................. 38 8.1.7 Haul truck unloading at the ROM stockpile ....................................................................... 38 8.1.8 ROM stockpile stacking ..................................................................................................... 39 8.1.9 Loading of the primary crusher .......................................................................................... 39 8.1.10 Primary and secondary crusher ........................................................................................ 39 8.1.11 Process plant and storage building ................................................................................... 40 8.1.12 Ship loading ....................................................................................................................... 40 8.1.13 Wind erosion of storage piles ............................................................................................ 41 8.1.14 Power plant ........................................................................................................................ 42 8.1.15 Incinerator .......................................................................................................................... 42 8.1.16 Mobile equipment engine exhaust ..................................................................................... 43

Dust Dispersion Report 4 / 43
TANBREEZ Project
LIST OF FIGURES
Figure 1 Process Flow Diagram (PFD) for Tanbreez Project. Source: MTHøjgaard. ................ 16 Figure 2 Wind roses for meteorological stations used for input data: (a) Qaqortoq, (b)
Narsarsuaq Airport, (c) Tanbreez Climate Station located at the hill pit area,
and (d) derived wind rose for the Tanbreez Port Site based processing of the
other meteorological data. ............................................................................................ 20 Figure 3 Plot of the 36
th highest 24-hour PM10 concentration in the Fjord Pit scenario.
The EU limit value (50 µg/m3) is exceeded within the 50 µg/m
3 contour
shaded area.................................................................................................................. 21 Figure 4 Plot of the 36
th highest 24-hour PM10 concentration in the Hill Pit scenario.
The EU limit value (50 µg/m3) is exceeded within the 50 µg/m
3 contour
shaded area.................................................................................................................. 22 Figure 5 Isoline map of annual dust deposition for the Fjord Pit scenario in kg/ha/year,
including both wet and dry deposition of TSP. The highest value is labeled
51.30 kg/ha/year (equivalent to 14 mg/m2/day). .......................................................... 24
Figure 6 Isoline map of annual dust deposition for the Hill Pit scenario in kg/ha/year,
including both wet and dry deposition of TSP. The highest value is labeled
71.90 kg/ha/year (equivalent to 20 mg/m2/day). .......................................................... 25

Dust Dispersion Report 5 / 43
TANBREEZ Project
LIST OF TABLES
Table 1 Particulate matter limit values for the protection of human health from EU
Directive 2008/50/EC. .................................................................................................. 11 Table 2 German limit values for deposition of heavy metals, in µg/m
2/day (TA Luft,
2002). *Approximate values in mg/ha/yr included for convenience. ............................ 12 Table 3 Emission source areas defined for dispersion modeling. The source ID is the
identifier used in the dispersion model software. ......................................................... 15 Table 4 Assumed operating hours for emission sources. Hours per day is the
maximum expected operation. Hours per year are based on 85% availability
and 80% utilization for the process plant and 90% efficiency for material
handling operations. ..................................................................................................... 17 Table 5 Assumed material handling amounts in tons. Tons per hour and tons per day
are assumed maximum rates. ...................................................................................... 17 Table 6 Emission rates for dispersion modeling in g/s, by source area for the two
scenarios. PM10 maximum daily emission rate is used to assess compliance
with PM10 limit values and the TSP annual average rate is used for modeling
of the annual deposition of dust. .................................................................................. 18 Table 7 Annual TSP and PM10 emissions by activity in the fjord pit scenario, and the
ratio of PM10 to TSP. .................................................................................................... 19 Table 8 Annual TSP and PM10 emissions by activity in the hill pit scenario, and the
ratio of PM10 to TSP. .................................................................................................... 19 Table 9 PM10 concentration statistics at Narsaq and Qaqortoq towns, from dispersion
of Tanbreez dust emission, in comparison to EU limit values. Source: Golder
Tables 15 and 17, Appendix 2. ..................................................................................... 23 Table 10 Worst case concentrations of metals and REE in emitted dust (ppm), based
on highest measured concentrations in Eudialyte and waste rock samples.
EF is the enrichment factor ratio of the worst case concentration in
comparison to upper continental crust (UCC). Maximum emission loads of
metals and REE (kg/year) are based on the total annual TSP emission for
each scenario. .............................................................................................................. 27 Table 11 Estimated annual loads (kg/year) of metals and REE in the discharge of
Lakseelv to the fjord, and ratios of annual dust emission loads to the
Lakseelv discharge loads. ............................................................................................ 28 Table 12 Equivalent metal and REE deposition rates for selected TSP deposition
isoline values in Figure 5 and Figure 6. Conversion from kg TSP/ha/year to
metal and REE deposition in mg/ha/hr and µg/m2/day. ............................................... 30
Table 13 Comparison of maximum heavy metal deposition loads to German limit
values, for arsenic, cadmium and lead. TSP deposition rates equivalent to
the limit values are given, for comparison with plotted TSP deposition levels
plotted in Figure 5 and Figure 6. .................................................................................. 31
Dust Dispersion Report 6 / 43
TANBREEZ Project
1 SUMMARY AND CONCLUSION
The TANBREEZ Project will generate dust emissions during operation of the open pit
mines, including drilling and blasting, excavation, hauling, stockpiling, crushing and pro-
cessing of ore, road maintenance and the storage and ship loading of the Eudialyte and
Feldspar concentrate products. Particulate emissions will also come from the diesel power
plant, mobile equipment engines and the incinerator.
The planned mine operation will have two phases: 1) a pit near the fjord will be excavated
for the first five years, and 2) a pit on the hill will be excavated for the last five years. These
two separate scenarios are assessed in this report.
Dust Emission
Emissions of particulate matter are calculated for two particulate size classes: total sus-
pended particulate matter (TSP) and particulate matter less than 10 µm in diameter (PM10).
The maximum daily emission rate and annual average emission rate are calculated for
both parameters. PM10 ambient concentrations, TSP dustfall rates and metal loads in dust-
fall are compared to international standards.
Emission calculations for both scenarios are based on the design production rate for the
processing plant of 2400 tons of ore per day. The mine is assumed to operate 248 days
per year (80% availability and 85% utilization). This gives an annual production of 595,200
tons of ore per year, which is 19% more than the design basis of 500,000 tons per year but
well within the planned capacity of the facility. The estimated concentrate yield for both
scenarios is 101,184 tons/yr Eudialyte (17% of ore) and 202,368 tons/yr feldspar (34% of
ore).
Emission estimation takes into account dust control measures planned in the design, in-
cluding watering and/or chemical dust suppression on haul roads, enclosed processing
plant with dust filtration system, and enclosed ship loading conveyor system.
The total annual TSP emission is estimated at 318 tons TSP/yr for the fjord pit scenario
and 631 tons TSP/yr for the hill pit scenario. PM10 emissions are 102 and 191 tons PM10/yr
for the two scenarios. The overall annual emission rates for the fjord pit scenario are 0.53
kg TSP per ton ore and 0.17 kg PM10 per ton ore. For the hill pit scenario the overall emis-
sion rates are 1.06 kg TSP/ton and 0.32 kg PM10/ton.
Dust generated by haul trucks and other vehicles on unpaved roads accounts for the larg-
est share of the total dust emission in both scenarios – 83% for the fjord pit scenario and
91% for the hill pit scenario. The power plant accounts for 2% and 1% of particulate emis-
sions and mobile equipment diesel engines account for only about 0.1%.
Dust Deposition
Most of the dust from the TANBREEZ Project will come from travel on gravel roads. The
dust will come from gravel made from the local Kakortokite bedrock exposed throughout
the project area. Dust falling on the land surface will be the same material as the surface it-
self, and will not change the chemical composition of the surface or runoff. Dust particles
falling directly on streams, lakes and fjords will mostly settle to the bottom, where it will

Dust Dispersion Report 7 / 43
TANBREEZ Project
have the same mineral composition as the bottom material. The natural water quality will
not be altered by dust.
Dust generation will increase ambient particulate matter concentrations close to mine activ-
ity and haul roads. EU limit values for ambient concentrations of inhalable particles (PM10)
apply to populated and publically accessible areas and not in industrial areas. The EU limit
values have not been formally adopted in Greenland, but are used for comparison. The EU
annual PM10 limit value (40 µg/m3) will be exceeded only in a few small areas within the
mining site itself. The EU short-term 24-hour PM10 limit value (50 µg/m3), reflecting occa-
sional adverse dispersion conditions, will be exceeded no more than 500 m from the active
mine pit and haul roads.
In comparison to the Norwegian limit value for dust deposition as a nuisance of 5 g/m2/30
days (167 mg/m2/day), dust deposition is at most 0.6 g/m
2/30 days (20 mg/m
2/day) or 12%
of the nuisance limit value – and that occurs at the dustiest location within the mine site.
Dust deposition rates decline rapidly from the maximum level – to less than 2% of the Nor-
wegian limit value within about 500 m of the pits and haul roads.
There is no vegetation over most of the project area, but where vegetation occurs, plant
communities could be affected up to a few tens of meters from the mine pit, haul roads and
crusher area.
The area where dust deposition is more than 20 kg/ha/year (5.5 mg/m2/day) – a level sug-
gested by Canadian research as a lower threshold for caribou avoidance due to dust on
edible vegetation – is limited to within about 500 m from the mine pits and haul roads, simi-
lar to the 500 m buffer area suggested by the 24-hour ambient PM10 concentrations. Cari-
bou are not found in the area, but this threshold might also be relevant for small mammals
such as Arctic hare and birds like Ptarmigan that feed on plant material, where vegetation
exists.
Metal Deposition
Mineral dust is expected to have the same chemical composition as the natural Kakortokite
bedrock used for gravel, or the Eudialyte and Feldspar minerals being mined. Heavy metal
loads in dustfall can be compared to German limit values for deposition of arsenic, cadmi-
um and lead: 4 µg As/m2/day, 2 µg Cd/m
2/day and 100 µg Pb/m
2/day. Based on the maxi-
mum calculated dust deposition rate (71.9 kg/ha/year, Hill Pit scenario), and the highest
concentrations measured in ore and waste rock samples, the maximum loads of arsenic,
cadmium and lead in dustfall are 1.2 µg As/m2/day, 0.09 µg Cd/m
2/day and 18.4 µg
Pb/m2/day. These are 31%, 5% and 18% of the German limit values, respectively. Dust
deposition rates decline rapidly from the maximum in the mine site, further reducing the
loads in comparison to the German standards.
The entire load of arsenic, copper, cadmium and zinc in emitted dust is no greater than the
dissolved amount naturally flowing into Kangerluarsuk Fjord from a single stream (Lak-
seelv). Only a fraction of the total dust load will fall on the fjord and most of this will settle to
the bottom without significant leaching of metals. Since the chemical composition of the
dust is similar to the composition of the exposed bedrock on the land surface and under the
fjord, changes to water quality would be very small and difficult to detect.

Dust Dispersion Report 8 / 43
TANBREEZ Project
Conclusion
The impact of dust emission, dispersion and deposition is assessed to be low.
The dust study suggests that the industrial area of the mine should be considered to ex-
tend about 500 m outward from the mine pits and main haul roads.

Dust Dispersion Report 9 / 43
TANBREEZ Project
2 INTRODUCTION
TANBREEZ Mining Greenland A/S is applying for a permit to mine Zirconia, rare earth el-
ements (REE), Yttrium, Niobium, Hafnium and Tantalum at Killavaat Alannguat (Kringlerne)
in South Greenland.
An assessment of dust dispersion from mining activities has been requested as part of the
EIA.
2.1 Scope of Work
1. Dust and particulate matter emission inventory – Emissions of total suspended particu-
lates (TSP) and particulate matter smaller than 10 µm (PM10) will be calculated for pit op-
erations, truck & equipment engine emissions, haul road truck travel, crusher & processing
plant, material transfers, ship loading, power plant (4 MW), and wind-generated dust emis-
sions. Two scenarios will be calculated: 1) mining in only the lower pit during the first 5
years, and 2) mining in only the upper pit after the lower pit is closed. Each scenario will
correspond to the highest expected annual production levels for each pit. Engine emissions
from ships are not included. The compilation will include annual total emissions and hourly
emission rates suitable for dispersion modelling.
2. Dispersion model calculations based on 1 year of meteorological data. The CALPUFF
dispersion model will be used due to the complex coastal terrain, emission sources from
sea level up to over 400 m elevation around a steep hillside, and topographic channelling
effects on the wind. Both ambient dust concentrations and total dust deposition (wet+dry)
will be calculated. Onsite (hilltop) meteorological data will be used together with regional
surface and upper air meteorological data. The calculations will be carried out for 20 x 20
km region surrounding the mine site, and include predicted dust loads at Narsaq and
Qarqoraq. Modelling will be carried out for two scenarios, as mentioned above.
The results of modelling will include isoline maps of the ground-level concentration of PM10
and the annual deposition of TSP to the surface (land or water). The PM10 maps will in-
clude annual average PM10 concentration and the 36th highest 24-hour PM10 concentra-
tions, for comparison to EU limit values.
3. Assessment report on dust impacts. The results of the emission inventory and dispersion
modelling for two scenarios will be presented in a concise report. Annual concentration sta-
tistics for PM10 will be compared to EU limit values. The potential annual load of metals in
dust to fjord water and land will be estimated based on a worst case assumption that all
dust has the same composition as the ore.
Above items 1 and 3 will be carried out by AirQuality.dk and item 2 will be carried out by
Golder Associates. Quality assurance will be carried out by both AirQuality.dk and Golder
Associates.
2.2 Project Setting
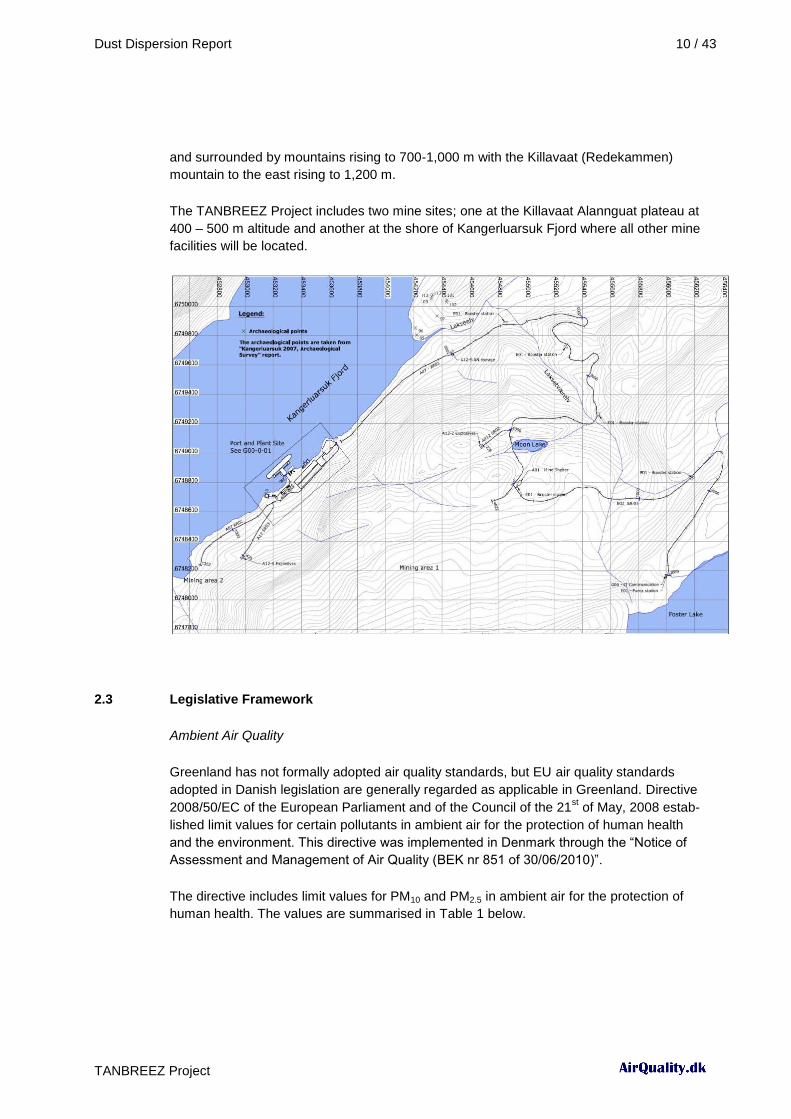
The TANBREEZ Project is located 20 km northeast of Qaqortoq (population 3300) and 12
km southwest of Narsaq (population 1600). The Killavaat Alannguat mineral deposit is situ-
ated on the Kangerluarsuk Fjord nears the head of the fjord. The fjord is mostly steep sided
Dust Dispersion Report 10 / 43
TANBREEZ Project
and surrounded by mountains rising to 700-1,000 m with the Killavaat (Redekammen)
mountain to the east rising to 1,200 m.
The TANBREEZ Project includes two mine sites; one at the Killavaat Alannguat plateau at
400 – 500 m altitude and another at the shore of Kangerluarsuk Fjord where all other mine
facilities will be located.
2.3 Legislative Framework
Ambient Air Quality
Greenland has not formally adopted air quality standards, but EU air quality standards
adopted in Danish legislation are generally regarded as applicable in Greenland. Directive
2008/50/EC of the European Parliament and of the Council of the 21st of May, 2008 estab-
lished limit values for certain pollutants in ambient air for the protection of human health
and the environment. This directive was implemented in Denmark through the “Notice of
Assessment and Management of Air Quality (BEK nr 851 of 30/06/2010)”.
The directive includes limit values for PM10 and PM2.5 in ambient air for the protection of
human health. The values are summarised in Table 1 below.

Dust Dispersion Report 11 / 43
TANBREEZ Project
Table 1 Particulate matter limit values for the protection of human health from EU Directive 2008/50/EC.
Pollutant Limit value Averaging period Comments
PM10 50 µg/m3 24 hours
Not to be exceeded more than 35 times in a calendar year-
40 µg/m3 Calendar year Not to be exceeded.
PM2.5 25 µg/m3 Calendar year Limit value to be met by 1 January 2015.
20 µg/m3 Calendar year
Indicative value to be met by 1 January, 2020.
The limit values apply in publically-accessible areas but not within industrial areas.
The PM10 limit values are relevant for this assessment because the majority of fugitive dust
particles are larger than 2.5 µm. Compliance with the PM10 annual limit value in this case
will also be a strong indication of compliance with the PM2.5 annual limit value as well.
Dust deposition
Dust deposition is generally regarded as a nuisance in populated areas. There are no
Greenlandic, Danish or EU standards for dust deposition. There is a Norwegian standard
for dust deposition from rock crushing operations (quarries) of 5 g/m2/30 days (167
mg/m2/day) (Norway, 2004). Fuglsang (2003) lists nuisance dust deposition limit values
from nine countries, ranging from 3 g/m2/30 days in New York State USA to 10 g/m
2/30
days in Finland (100 to 333 mg/m3/day). The Norwegian limit value is used for comparative
purposes in this report.
Heavy metal and REE deposition
Dust from mining activities can potentially include metals or other compounds which are
harmful to health and the environment. The metals of most concern include arsenic (As),
copper (Cu), cadmium (Cd), mercury (Hg), zinc (Zn) and lead (Pb). Deposition of alumini-
um (Al) and iron (Fe) can also impact soils and ecosystems and should also be assessed.
Rare earth elements (REE) are also of concern. The rare earth elements include lantha-
num (La), cerium (Ce), praseodymium (Pr), neodymium (Nd), samarium (Sm), europium
(Eu), gadolinium (Gd), terbium (Tb), dysprosium (Dy), holmium (Ho), erbium (Er), thulium
(Tm), ytterbium (Yb) and lutetium (Lu). Scandium (Sc) and yttrium (Y) are often included
with REE because the chemical and toxicological characteristics of these two transition
metals appear to be similar to those of REE.
The human toxicology of REE has been reviewed by Hirao and Suzuki (1996). Plant toxici-
ty of metals and REE has been reviewed by Babula et al (2008). Under certain conditions,
low concentrations of at least some REEs seem to favour plant growth and productivity,
and REE are used in agricultural fertilizers in East Asia, but the physiological mechanisms
are still not well understood (Tyler, 2004). The ecotoxicity and environmental risks of REE
is still a subject of research (Chapman, 2008; Gandhi et al, 2012).

Dust Dispersion Report 12 / 43
TANBREEZ Project
There are no Greenlandic, Danish or EU standards for deposition of heavy metals or REE.
German air quality standards (TA Luft, 2002) include limit values for deposition of heavy
metals, shown in Table 2.
Table 2 German limit values for deposition of heavy metals, in µg/m2/day (TA Luft, 2002). *Approximate values in mg/ha/yr included for convenience.
Pollutant Limit value (TA Luft, 2002)
µg/m
2/day
g/ha/yr*
averaging time
Arsenic (As) Arsenic and its inorganic com-pounds, expressed as arsenic
4 15 1 year
Lead (Pb) and its inorganic compounds, ex-pressed as lead
100 365 1 year
Cadmium (Cd) and its inorganic compounds, expressed as cadmium
2 7 1 year
Nickel (Ni) and its inorganic compounds, ex-pressed as nickel
15 55 1 year
Mercury (Hg) and its inorganic compounds, ex-pressed as mercury
1 4 1 year
Thallium (Tl) and its inorganic compounds, ex-pressed as thallium
2 7 1 year
Calculated deposition loads of arsenic, cadmium and lead will be compared these German
limit values in Section 5.4.

Dust Dispersion Report 13 / 43
TANBREEZ Project
3 PROJECT ACTIVITIES AND ESTIMATED EMISSIONS
3.1 Approach
The emission estimates serve two purposes: 1) estimation of emission rates for dispersion
modeling, and 2) estimation of the total annual emissions of dust.
Two size classes of particulate matter are used in this study: total suspended particulates
(TSP) and PM10. TSP includes particles up to about 30 µm in diameter. PM10 is particles
less than 10 µm in diameter. TSP is used in the dispersion model for calculation of total
dust deposition. PM10 is used for assessment of compliance with the EU ambient air quality
standards for PM10.
Two types of emission rates are used for each source in dispersion modeling. The maxi-
mum daily PM10 emission rate is for calculating ambient PM10 concentrations for compari-
son with EU limit values. This is the preferred approach when assessing compliance with
24-hour and annual limit values, when only one year of meteorological data is available for
dispersion modeling. The second emission rate is the annual average emission rate for
dust (TSP), which is used for calculation of the annual total dust deposition in the disper-
sion model.
The methodology for estimating emissions is described in section 3.5. The methodology for
dispersion modeling is presented in section 4.1.
3.2 Scenarios
Dust emission, dispersion and deposition are estimated in this study for two scenarios, cor-
responding to the two mine pits to be exploited.
“Fjord Pit Scenario” Excavation of the mineral deposit near the shore of
Kangerluarsuk Fjord, with 1.4 km haul road along the
shoreline to the process plant.
“Hill Pit Scenario” Excavation of the mineral deposit at about 400 m eleva-
tion, with 4.7 km haul road from the pit to the process
plant.
The Fjord Pit is to be excavated during the first five years of the project and the Hill Pit is to
be excavated during the second five years. Only one pit will be exploited at a time.
The process plant, port facilities and other supporting facilities are the same for both sce-
narios. The operating schedule, process rates and material handling volumes are assumed
to be the same for both scenarios.
The primary differences between the two scenarios are: 1) the location of the pits, and 2)
the lengths of the haul roads. Wind patterns can be different between the two pit sites due
to the steep terrain, resulting in different dispersion patterns. This will be taken into account
by the dispersion model. Haul truck travel on unpaved haul roads is the largest source of
dust from mining operations. Total dust emissions in the Hill Pit Scenario will be larger than
in the Fjord Pit Scenario, due to the longer haul road.

Dust Dispersion Report 14 / 43
TANBREEZ Project
3.3 Emission Sources
Activities which can be significant sources of dust or particulate matter are included in the
calculation of dust emissions. The process plant and storage buildings will be enclosed and
equipped with comprehensive dedusting systems. The dust emission from the process and
storage buildings is limited to the filtered exhaust air from the dedusting systems. The ac-
tivities included in the emission calculations are:
drilling
blasting
excavation and handling of fragmented ore in the pit
loading of haul trucks
travel of haul trucks and other vehicles on unpaved roads and work areas
grading of roads
unloading of haul trucks at the ROM stockpile area
stacking of ore in the stockpile
loading of the primary crusher
primary and secondary crushing
transfer of crushed ore between crushers and into the process plant
loading of ships from the storage buildings
wind erosion from pit areas and ROM stockpile
combustion exhaust from the incinerator
combustion exhaust from the diesel power plant
combustion exhaust from diesel engines in vehicles and mobile equipment
The location of the emissions is important for dispersion modeling. Emissions occur over
work areas (area or volume sources), roadways (line sources) and as point sources such
as chimneys and dedusting exhausts. The source locations defined for dispersion modeling
are listed in Table 3. Within each emission source area, dust emissions are calculated for
all relevant activities to give a total emission rate in grams per second (g/s) for each area,
for each scenario. In the dispersion model, non-point emissions are distributed along the
length of roadways or over the area of area and volume sources.
Dust Dispersion Report 15 / 43
TANBREEZ Project
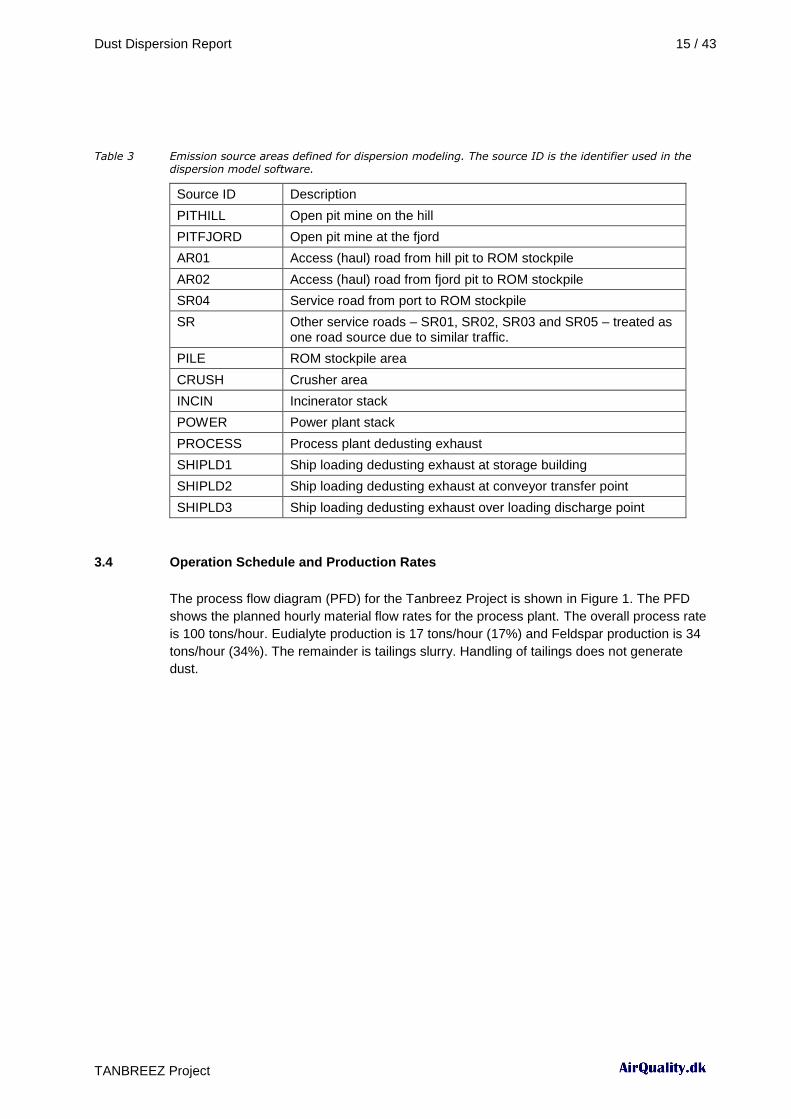
Table 3 Emission source areas defined for dispersion modeling. The source ID is the identifier used in the dispersion model software.
Source ID Description
PITHILL Open pit mine on the hill
PITFJORD Open pit mine at the fjord
AR01 Access (haul) road from hill pit to ROM stockpile
AR02 Access (haul) road from fjord pit to ROM stockpile
SR04 Service road from port to ROM stockpile
SR Other service roads – SR01, SR02, SR03 and SR05 – treated as one road source due to similar traffic.
PILE ROM stockpile area
CRUSH Crusher area
INCIN Incinerator stack
POWER Power plant stack
PROCESS Process plant dedusting exhaust
SHIPLD1 Ship loading dedusting exhaust at storage building
SHIPLD2 Ship loading dedusting exhaust at conveyor transfer point
SHIPLD3 Ship loading dedusting exhaust over loading discharge point
3.4 Operation Schedule and Production Rates
The process flow diagram (PFD) for the Tanbreez Project is shown in Figure 1. The PFD
shows the planned hourly material flow rates for the process plant. The overall process rate
is 100 tons/hour. Eudialyte production is 17 tons/hour (17%) and Feldspar production is 34
tons/hour (34%). The remainder is tailings slurry. Handling of tailings does not generate
dust.

Dust Dispersion Report 16 / 43
TANBREEZ Project
Figure 1 Process Flow Diagram (PFD) for Tanbreez Project. Source: MTHøjgaard.
For the purpose of estimating emissions, operating hours and production rates are based
on values given in the Feasibility Study (MTHøjgaard, 2012). The planned process plant
capacity of 100 tons/hour is used, with 85% availability and 80% utilization. This gives an
estimated 595,200 tons of ore processed per year, which is 17% more than the design ba-
sis of 500,000 tons/year. Activity rates which are linked to the process plant production rate
are adapted to the assumed annual ore capacity of 595,200 tons/year. Activities not direct-

Dust Dispersion Report 17 / 43
TANBREEZ Project
ly dependant on the process plant production rate are assumed to operate 292 or 365 days
per year.
Operating hours are shown in Table 4 and material handling rates are given in Table 5 for
the various types of activities.
The hourly and daily operating times and activity rates are the expected maximum hourly
and daily values. The annual operating hours and material amounts are based on the as-
sumption of 595,200 tons of ore processed per year. An efficiency factor of 90% is used
when estimating annual operating hours. This is primarily relevant to calculation of engine
exhaust emissions, which depend on hours of operation.
Table 4 Assumed operating hours for emission sources. Hours per day is the maximum expected operation. Hours per year are based on 85% availability and 80% utilization for the process plant and 90% ef-ficiency for material handling operations.
* annual grading hours for hill scenario
Table 5 Assumed material handling amounts in tons. Tons per hour and tons per day are assumed maxi-mum rates.
3.5 Emission Methodology
Emissions are calculated using emission factors (EF). An emission factor defines the mass
of emission per unit of polluting activity, such as per ton of material handled, per kilometer
vehicle travel, or per hour of operation. Emission factors are obtained from well respected
international sources such as US EPA, Australia’s Environment Agency and research pub-
Activity hours/day days/year hours/year
Drilling 18 134 2,421
Blasting 1 82 82
Excavation and hauling 12 162 1,945
ROM Stockpile 12 162 1,945
Crushing 24 276 6,613
Process Plant 24 276 6,613
Ship Loading 20 23 450
Grading* 9 292 2,089
Snow removal, grader 8 41 308
Incinerator 19
Power Plant 24 365
Activity tons/hour tons/day tons/year
Excavation 340 4,080 595,200
Haul trucks 340 4,080 595,200
ROM Stockpile 340 4,080 595,200
Crushing 100 2,400 595,200
Process Plant 100 2,400 595,200
Ship Loading 750 15,000 303,552

Dust Dispersion Report 18 / 43
TANBREEZ Project
lications. Some emission factors include variables for environmental or operating condi-
tions that significantly affect the rate of emission, such as silt content of road surfaces, ve-
hicle weight or speed, wind speed, moisture content and number of days with precipitation.
Some activities in the project include control measures to prevent or reduce dust emission.
Emission factors are reduced according to the expected control efficiency, C, given as a
percentage of emission reduction.
Details of emission calculations for each type of emission are given in Appendix 1.
3.6 Estimated Emissions
Emission rates used in dispersion modeling are given in Table 6. The rates are given in g/s
for each emission area or point, for both scenarios.
Table 6 Emission rates for dispersion modeling in g/s, by source area for the two scenarios. PM10 maximum daily emission rate is used to assess compliance with PM10 limit values and the TSP annual average rate is used for modeling of the annual deposition of dust.
The total annual emissions of TSP and PM10 by activity in the Fjord Pit and Hill Pit scenari-
os are given in Table 7 and Table 8 respectively. These tables show the activities ordered
by size of the TSP emission, with the unpaved road emissions contributing most of the
emissions in both scenarios.
Source area Source ID Fjord Hill Fjord Hill
Open pit at fjord site PITFJORD 1.8137 3.0468
Open pit at hill site PITHILL 1.8135 3.0468
Access/haul road to hill pit AR01 0.0083 5.1390 0.0001 14.0518
Access/haul road to fjord pit AR02 1.5128 0.0068 4.1230 0.0000
Service road in port area SR04 0.0837 0.0837 0.2009 0.2009
Other service roads SR 0.0717 0.0717 0.1784 0.1784
ROM Stockpile area PILE 0.7384 0.7384 1.6578 1.6578
Crusher area CRUSH 0.4451 0.4451 0.6980 0.6980
Incinerater stack INCIN 0.0003 0.0003 0.0001 0.0001
Power plant stack POWER 0.1716 0.1716 0.1798 0.1798
Process building dedusting PROCESS 0.0083 0.0083 0.0067 0.0067
Shiploader dedusting 1 SHIPLD1 0.0070 0.0070 0.0004 0.0004
Shiploader dedusting 2 SHIPLD2 0.0070 0.0070 0.0004 0.0004
Shiploader dedusting 3 SHIPLD3 0.0046 0.0046 0.0002 0.0002
Total 4.8724 8.4970 10.0927 20.0214
TSP annual average
emission rate, g/s
PM10 maximum daily
emission rate, g/s
Dust Dispersion Report 19 / 43
TANBREEZ Project
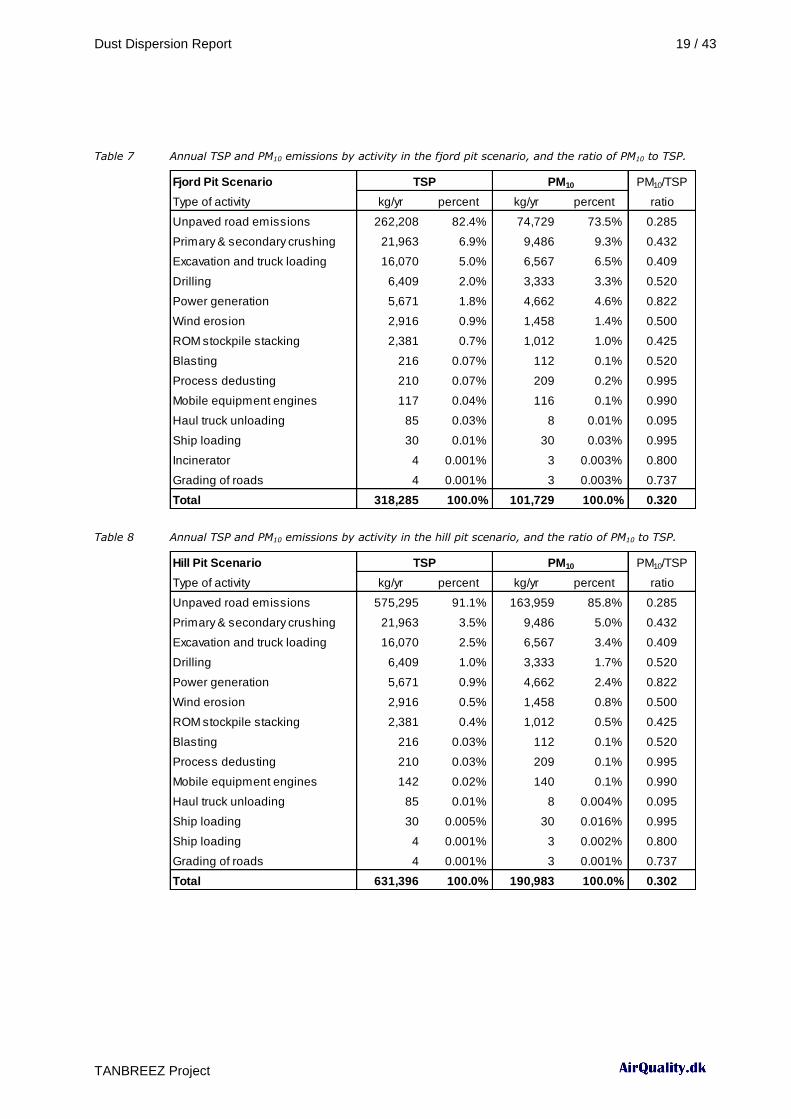
Table 7 Annual TSP and PM10 emissions by activity in the fjord pit scenario, and the ratio of PM10 to TSP.
Table 8 Annual TSP and PM10 emissions by activity in the hill pit scenario, and the ratio of PM10 to TSP.
Fjord Pit Scenario PM10/TSP
Type of activity kg/yr percent kg/yr percent ratio
Unpaved road emissions 262,208 82.4% 74,729 73.5% 0.285
Primary & secondary crushing 21,963 6.9% 9,486 9.3% 0.432
Excavation and truck loading 16,070 5.0% 6,567 6.5% 0.409
Drilling 6,409 2.0% 3,333 3.3% 0.520
Power generation 5,671 1.8% 4,662 4.6% 0.822
Wind erosion 2,916 0.9% 1,458 1.4% 0.500
ROM stockpile stacking 2,381 0.7% 1,012 1.0% 0.425
Blasting 216 0.07% 112 0.1% 0.520
Process dedusting 210 0.07% 209 0.2% 0.995
Mobile equipment engines 117 0.04% 116 0.1% 0.990
Haul truck unloading 85 0.03% 8 0.01% 0.095
Ship loading 30 0.01% 30 0.03% 0.995
Incinerator 4 0.001% 3 0.003% 0.800
Grading of roads 4 0.001% 3 0.003% 0.737
Total 318,285 100.0% 101,729 100.0% 0.320
TSP PM10
Hill Pit Scenario PM10/TSP
Type of activity kg/yr percent kg/yr percent ratio
Unpaved road emissions 575,295 91.1% 163,959 85.8% 0.285
Primary & secondary crushing 21,963 3.5% 9,486 5.0% 0.432
Excavation and truck loading 16,070 2.5% 6,567 3.4% 0.409
Drilling 6,409 1.0% 3,333 1.7% 0.520
Power generation 5,671 0.9% 4,662 2.4% 0.822
Wind erosion 2,916 0.5% 1,458 0.8% 0.500
ROM stockpile stacking 2,381 0.4% 1,012 0.5% 0.425
Blasting 216 0.03% 112 0.1% 0.520
Process dedusting 210 0.03% 209 0.1% 0.995
Mobile equipment engines 142 0.02% 140 0.1% 0.990
Haul truck unloading 85 0.01% 8 0.004% 0.095
Ship loading 30 0.005% 30 0.016% 0.995
Ship loading 4 0.001% 3 0.002% 0.800
Grading of roads 4 0.001% 3 0.001% 0.737
Total 631,396 100.0% 190,983 100.0% 0.302
TSP PM10

Dust Dispersion Report 20 / 43
TANBREEZ Project
4 DUST DISPERSION
4.1 Methodology
Dispersion modeling has been carried out by Golder Associates using the CALPUFF mod-
eling system. One year of meteorological data are used from the on-site monitoring station,
two public weather stations and upper air profiles, for the period October 2010 to Septem-
ber 2011. Wind roses for the three monitoring stations are shown in Figure 2. The on-site
monitoring station is located close to the Tanbreez hill pit site. A wind rose is also shown
for the Tanbreez port site which has been derived from processing of the meteorological
data with the CALMET software.
(a) Qaqortoq (b) Narsarsuaq Airport
(c) Tanbreez Climate Station (d) Tanbreez Port Site (derived)
Figure 2 Wind roses for meteorological stations used for input data: (a) Qaqortoq, (b) Narsarsuaq Air-port, (c) Tanbreez Climate Station located at the hill pit area, and (d) derived wind rose for the Tanbreez Port Site based processing of the other meteorological data.
Dust Dispersion Report 21 / 43
TANBREEZ Project
Dispersion is modeled on a 20 x 20 km grid centered at the mine site. The model area in-
cludes the towns of Narsaq and Qaqortoc. PM10 concentrations based on maximum daily
emission rates are compared to the EU daily and annual limit values for PM10 in ambient
air. Annual deposition of TSP is calculated based on annual average TSP emission rates.
The modeled concentrations do not include a background concentration, since background
levels of PM10 are very low, on the order of 2 µg/m3.
Following Danish practice for modeling industrial sources, calculated daily PM10 concentra-
tion statistics are based on continuous emissions equal to the maximum daily PM10 emis-
sion rates – on all days of the year. No adjustment is made for intermittent operation of the
mine on only 68% of the days.
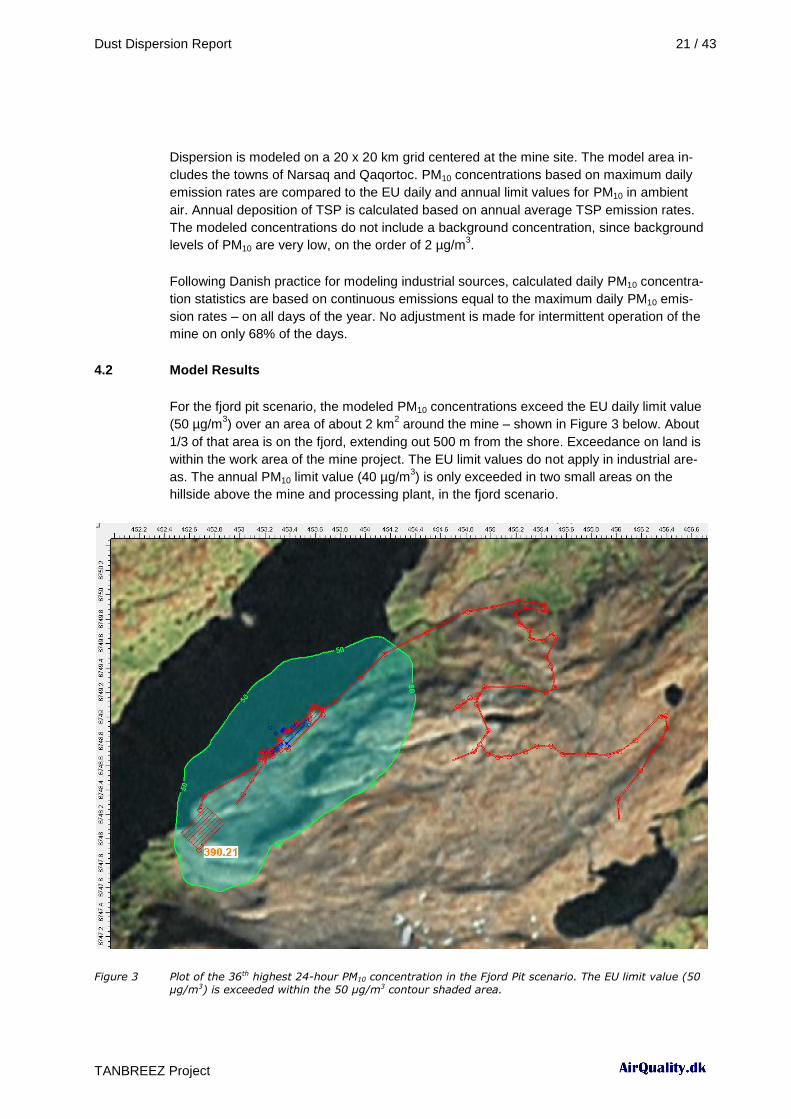
4.2 Model Results
For the fjord pit scenario, the modeled PM10 concentrations exceed the EU daily limit value
(50 µg/m3) over an area of about 2 km
2 around the mine – shown in Figure 3 below. About
1/3 of that area is on the fjord, extending out 500 m from the shore. Exceedance on land is
within the work area of the mine project. The EU limit values do not apply in industrial are-
as. The annual PM10 limit value (40 µg/m3) is only exceeded in two small areas on the
hillside above the mine and processing plant, in the fjord scenario.
Figure 3 Plot of the 36th highest 24-hour PM10 concentration in the Fjord Pit scenario. The EU limit value (50 µg/m3) is exceeded within the 50 µg/m3 contour shaded area.
Dust Dispersion Report 22 / 43
TANBREEZ Project
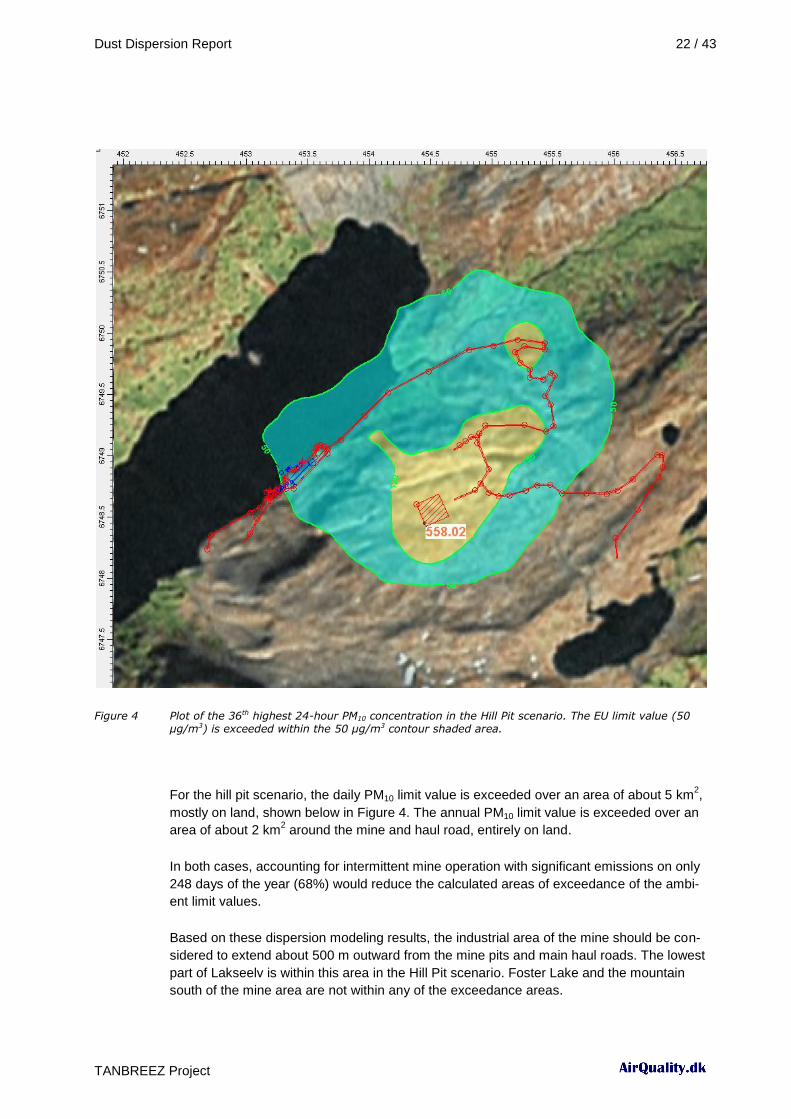
Figure 4 Plot of the 36th highest 24-hour PM10 concentration in the Hill Pit scenario. The EU limit value (50 µg/m3) is exceeded within the 50 µg/m3 contour shaded area.
For the hill pit scenario, the daily PM10 limit value is exceeded over an area of about 5 km2,
mostly on land, shown below in Figure 4. The annual PM10 limit value is exceeded over an
area of about 2 km2 around the mine and haul road, entirely on land.
In both cases, accounting for intermittent mine operation with significant emissions on only
248 days of the year (68%) would reduce the calculated areas of exceedance of the ambi-
ent limit values.
Based on these dispersion modeling results, the industrial area of the mine should be con-
sidered to extend about 500 m outward from the mine pits and main haul roads. The lowest
part of Lakseelv is within this area in the Hill Pit scenario. Foster Lake and the mountain
south of the mine area are not within any of the exceedance areas.

Dust Dispersion Report 23 / 43
TANBREEZ Project
PM10 concentrations have also been calculated for the towns of Narsaq (12 km northwest)
and Qaqortaq (20 km southwest). The results are summarized and compared to the EU
limit values in Table 9.
Table 9 PM10 concentration statistics at Narsaq and Qaqortoq towns, from dispersion of Tanbreez dust emission, in comparison to EU limit values. Source: Golder Tables 15 and 17, Appendix 2.
Town Scenario
36th highest 24-hour
PM10 concentration µg/m
3
Annual average PM10 concentration
µg/m3
Narsaq Fjord Pit scenario 0.55 0.13
Hill Pit scenario 0.85 0.21
Qaqortoq Fjord Pit scenario 0.12 0.03
Hill Pit scenario 0.18 0.05
EU limit value 50 40
The Tanbreez contributions to PM10 concentrations at Narsaq and Qarqotoq are very small
and below the typical detection limit of about 1 µg/m3 for PM10 monitoring. For comparison,
the average natural background PM10 concentration in the region is about 2 µg/m3.
Dust Dispersion Report 24 / 43
TANBREEZ Project
5 DUST DEPOSITION
5.1 Annual Total Dust Deposition
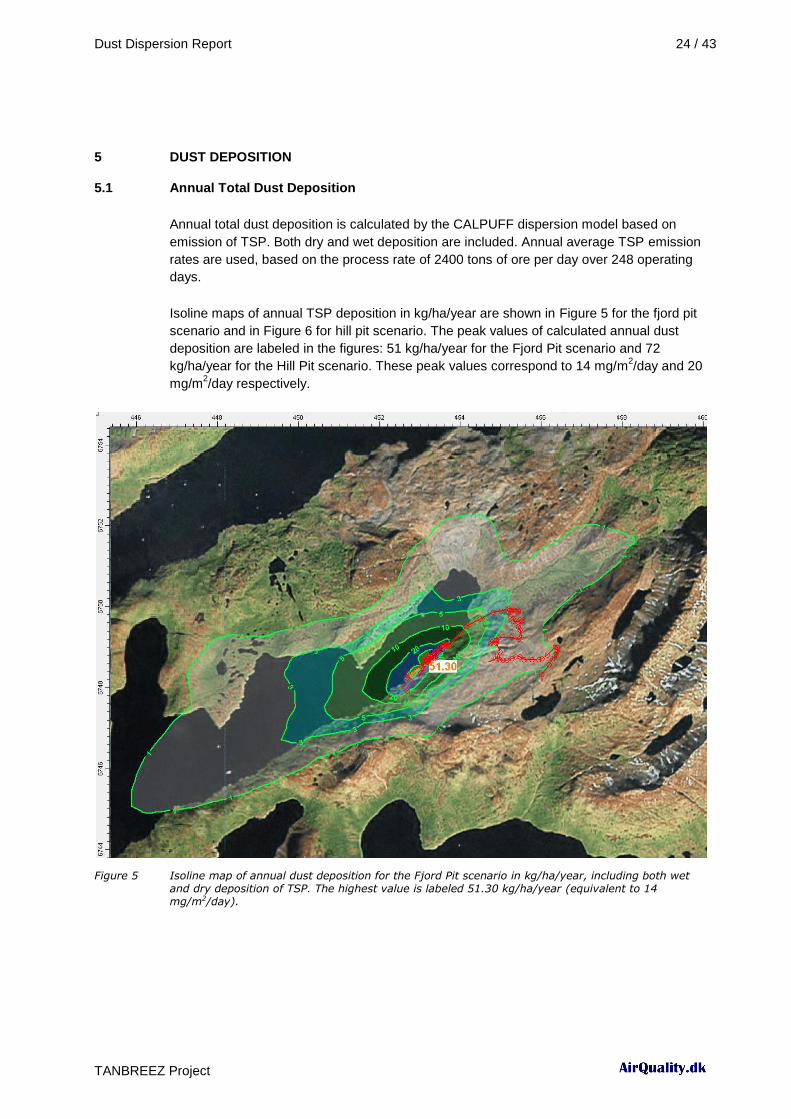
Annual total dust deposition is calculated by the CALPUFF dispersion model based on
emission of TSP. Both dry and wet deposition are included. Annual average TSP emission
rates are used, based on the process rate of 2400 tons of ore per day over 248 operating
days.
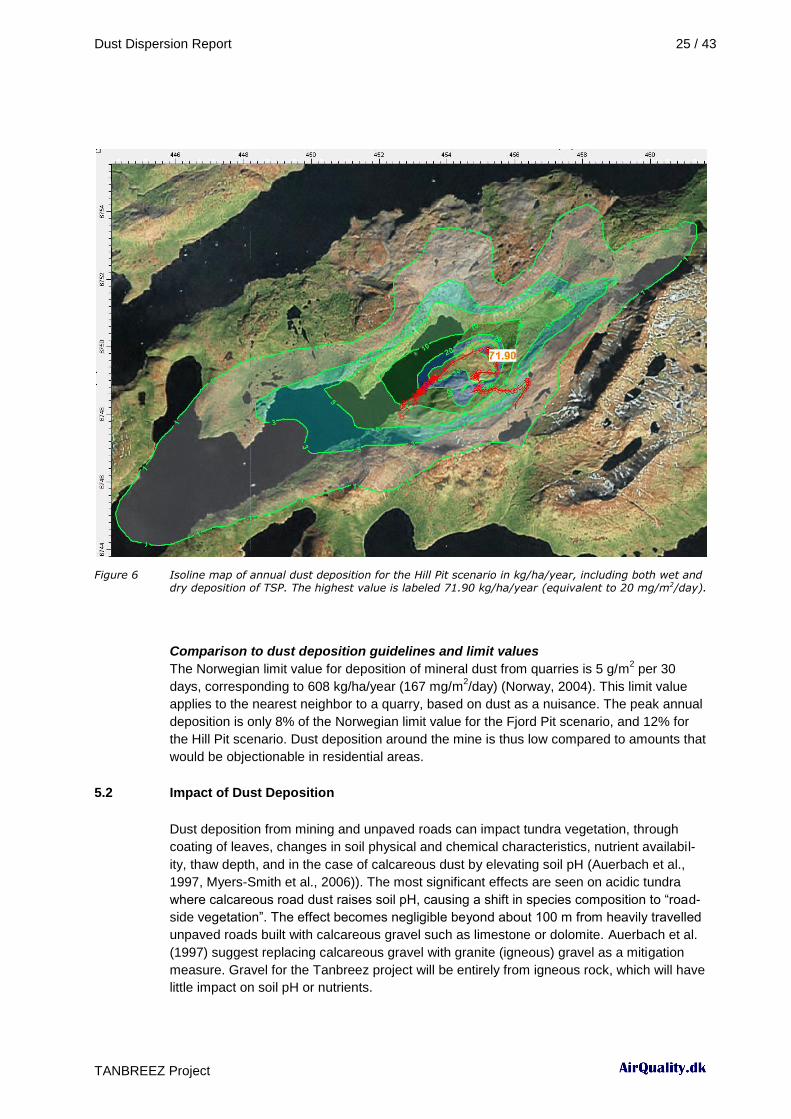
Isoline maps of annual TSP deposition in kg/ha/year are shown in Figure 5 for the fjord pit
scenario and in Figure 6 for hill pit scenario. The peak values of calculated annual dust
deposition are labeled in the figures: 51 kg/ha/year for the Fjord Pit scenario and 72
kg/ha/year for the Hill Pit scenario. These peak values correspond to 14 mg/m2/day and 20
mg/m2/day respectively.
Figure 5 Isoline map of annual dust deposition for the Fjord Pit scenario in kg/ha/year, including both wet and dry deposition of TSP. The highest value is labeled 51.30 kg/ha/year (equivalent to 14 mg/m2/day).
Dust Dispersion Report 25 / 43
TANBREEZ Project
Figure 6 Isoline map of annual dust deposition for the Hill Pit scenario in kg/ha/year, including both wet and dry deposition of TSP. The highest value is labeled 71.90 kg/ha/year (equivalent to 20 mg/m2/day).
Comparison to dust deposition guidelines and limit values
The Norwegian limit value for deposition of mineral dust from quarries is 5 g/m2 per 30
days, corresponding to 608 kg/ha/year (167 mg/m2/day) (Norway, 2004). This limit value
applies to the nearest neighbor to a quarry, based on dust as a nuisance. The peak annual
deposition is only 8% of the Norwegian limit value for the Fjord Pit scenario, and 12% for
the Hill Pit scenario. Dust deposition around the mine is thus low compared to amounts that
would be objectionable in residential areas.
5.2 Impact of Dust Deposition
Dust deposition from mining and unpaved roads can impact tundra vegetation, through
coating of leaves, changes in soil physical and chemical characteristics, nutrient availabil-
ity, thaw depth, and in the case of calcareous dust by elevating soil pH (Auerbach et al.,
1997, Myers-Smith et al., 2006)). The most significant effects are seen on acidic tundra
where calcareous road dust raises soil pH, causing a shift in species composition to “road-
side vegetation”. The effect becomes negligible beyond about 100 m from heavily travelled
unpaved roads built with calcareous gravel such as limestone or dolomite. Auerbach et al.
(1997) suggest replacing calcareous gravel with granite (igneous) gravel as a mitigation
measure. Gravel for the Tanbreez project will be entirely from igneous rock, which will have
little impact on soil pH or nutrients.

Dust Dispersion Report 26 / 43
TANBREEZ Project
There is no vegetation on most of the project area, except at low elevations along the fjord.
The potential zone of vegetation impact will thus be confined to narrow corridors (a few
tens of meters) surrounding to the fjord pit, the short haul road between fjord pit and ROM
stockpile area, and around the stockpile and crusher area.
Dust on vegetation might impact small mammals such as Arctic hare and birds such as
Ptarmigan in the project area. Researchers in northern Canada observed reduction of 50 to
75% in caribou density where calculated dust deposition exceeded about 20 kg/ha/year
(5.5 mg/m2/day) (Boulanger et al., 2012). Caribou density rose quickly to normal frequency
at lower dust levels. There are no caribou in the Tanbreez area, but this suggests a dust
deposition threshold on the order of 20 kg/ha/year for impact on forage for mammals in
tundra regions. The area with dust deposition above 20 kg/ha/year extends less than about
400 m from the mine pits, haul roads and port area in both scenarios, and very little of this
area is vegetated. The dust footprint for potential impact on small mammals and birds is
thus very small.
5.3 Emission of Metals and REE
Mineral dust generated from mining activities consists of small particles of waste rock or
ore. The particles are mechanically generated by abrasion, crushing, handling and traffic
on unpaved areas and roads. The composition of the dust particles will reflect the composi-
tion of the rock handled or used for road construction. Analyses of the composition of
waste rock and ore are used to estimate the metal and REE content of dust.
The content of metals and REE in dust emissions (TSP) will reflect the composition of the
material from which dust is generated. The composition of dust from travel on gravel haul
roads will be similar to the composition of the gravel. The composition of dust from blasting,
excavation, handling, storage and crushing of ore and waste rock will depend on the com-
position of these materials. The calculated dust emissions include a small contribution (1-
2%) of combustion particulate matter, mostly from power generation, consisting primarily of
organic compounds and carbon (soot). The composition of this small combustion contribu-
tion is neglected for the purposes of estimating worst case metals and REE emission and
deposition.
The largest source of dust is travel on the haul roads. These gravel roads will be built from
cut/blasted bedrock obtained along the alignments, surplus material from plant site level-
ling, and possibly a gravel deposit at Moon Lake (MTHøjgaard, 2011). No data on the
composition of these materials is available. The geologic map of the area (Map 6 in the
Application) shows most of the project area as “Kakorkotite” at the surface. Kakorkotite in-
clude the minerals arfvedsonite, eudialyte and feldspar. This suggests that the gravel com-
position could be similar to the ore and waste rock composition.
Data for two samples of Eudialyte zirconium ore are available (“composite head assays”,
Westrip Holding/Trical Mining & Metallurgical Services Pty Ltd.). Data for 10 composite
samples of green sill waste rock are also available (Rimbal Pty Ltd). A worst case assump-
tion is made for composition of dust. The highest concentration of each element is taken
from the available ore and waste rock sample data. These maximum concentrations are
used to estimate the worst-case load of metals and REE in emitted and deposited dust.

Dust Dispersion Report 27 / 43
TANBREEZ Project
Table 10 lists the maximum metal and REE concentrations measured in Eudialyte and
waste rock samples. The higher of the two concentrations is listed as the worst case for
each element and is used for calculation of the loads of metals and REE in emitted and
deposited dust. Table 10 also shows the ratios of worst case concentrations to the global
average concentrations in Upper Continental Crust (UCC) (Rudnich and Gao, 2003), also
known as enrichment factors (labelled EF in the table).
Based on the total annual dust emission in tons/year – 318 tons/year in the Fjord Pit sce-
nario and 631 tons/year in the Hill Pit scenario – and the maximum concentrations of met-
als and REE, the maximum emitted load of each element is calculated in kg/year. The
maximum emission loads are shown at the right in Table 10.
Table 10 Worst case concentrations of metals and REE in emitted dust (ppm), based on highest measured concentrations in Eudialyte and waste rock samples. EF is the enrichment factor ratio of the worst case concentration in comparison to upper continental crust (UCC). Maximum emission loads of metals and REE (kg/year) are based on the total annual TSP emission for each scenario.
Maximum Concentration Maximum Emission Load
Eudialyte
Waste Rock
Worst Case
UCC EF
Fjord Pit Scenario
318 t TSP/yr
Hill Pit Scenario
631 t TSP/yr
Element
µg/g (ppm) µg/g (ppm) µg/g (ppm) ratio kg/year kg/year
Aluminum Al 81800 78300 81800 0.5 25118 45225
Iron Fe 70200 101000 101000 2.0 30421
Copper Cu 40.0 20.0 40.0 1.4 7.5 12.5
Zinc Zn 410 1240 1240 18.5 348 671
Arsenic As 30.0 62.0 62.0 12.9 17.9 34.0
Cadmium Cd 0.25 4.5 4.5 50.0 1.2 2.4
Lead Pb 124 933 933 54.9 252 495
Scandium Sc 1.0 6.0 6.0 0.4 1.6 3.2
Yttrium Y 1230 413 1230 58.6 177 279
Lanthanum La 1370 784 1370 44.2 282 481
Cerium Ce 2580 1230 2580 41.0 467 777
Praseodymium Pr 280 229 280 39.4 75.7 134
Neodymium Nd 968 8.6 968 35.9 56.5 54.1
Samarium Sm 193 137 193 41.1 46.7 81.7
Europium Eu 18.5 11.1 18.5 18.5 3.9 6.8
Gadolinium Gd 194 101 194 48.5 37.4 62.9
Terbium Tb 33.6 11.2 33.6 48.0 4.8 7.6
Dysprosium Dy 248 74.3 248 63.6 33.4 51.6
Holmium Ho 53.8 13.4 53.8 64.8 6.5 9.8
Erbium Er 165 38.5 165 71.7 19.3 28.6
Thulium Tm 24.8 6.7 24.8 82.7 3.2 4.8
Ytterbium Yb 156 33.5 156 79.6 17.5 25.5
Lutetium Lu 20.6 4.9 20.6 66.5 2.4 3.6
Thorium Th 79.0 103 103 9.8 31.4 58.0
Uranium U 24.0 33.6 33.6 12.4 10.2 18.8

Dust Dispersion Report 28 / 43
TANBREEZ Project
These emitted loads in dust particles will be transported by wind until deposited on the sur-
face. Larger particles are deposited near the source of emission while fine particles can be
transported long distances. Assuming that the composition of large and small particles is
the same, the spatial pattern of deposition will be proportional to the deposition of TSP, as
shown in Figure 5 and Figure 6. The actual impact will depend on the type of surface
where the dust is deposited, and solubility of the actual metal compounds that the metals
occur in.
To put these loads in perspective, a comparative natural load of metals and REE is calcu-
lated for the discharge of Lakseelv, the stream that enters Kangerluarsuk Fjord north of the
project area, including discharge from Moon Lake and Fostersø and surface drainage from
much of the project area and areas to the north. The annual discharge of Lakseelv near the
fjord is estimated at 1.091 m3/s. Element composition of a water sample taken from Lak-
seelv near Laksetværelv in June 2010 (DANAK/NERI test report no. 405) is used to rough-
ly estimate the annual load of metals to the fjord from Lakseelv. The estimated loads for el-
ements with water concentration data are shown in Table 11.
The ratios of the total emitted loads of metals and REE in dust to the natural load of dis-
solved metals and REE in the discharge of Lakseelv are shown at the right in Table 11. Ra-
tios near or below 1.0 indicate that the total emitted load of that substance is less than the
natural dissolved load in discharge of a single stream – Lakseelv.
Table 11 Estimated annual loads (kg/year) of metals and REE in the discharge of Lakseelv to the fjord, and ratios of annual dust emission loads to the Lakseelv discharge loads.
Lakseelv Discharge to Fjord Load Comparison
Concentration Annual Load Fjord Pit to
Lakseelv Hill Pit to Lakseelv
Element
mg/L kg/year ratio ratio
Iron Fe 14.68 505 60.2 0.0
Copper Cu 0.96 33.0 0.2 0.4
Zinc Zn 3.04 105 3.3 6.4
Arsenic As 1.62 55.7 0.3 0.6
Cadmium Cd 0.017 0.6 2.0 4.0
Lead Pb 0.21 7.2 34.8 68.6
Scandium Sc 0.27 9.3 0.2 0.3
Yttrium Y 0.24 8.3 21.5 33.8
Lanthanum La 0.21 7.2 39.1 66.6
Cerium Ce 0.06 2.1 226 376
Neodymium Nd 0.24 8.3 6.8 6.6
Thorium Th 0.0277 1.0 33.0 60.9
Uranium U 0.417 14.3 0.7 1.3
Table 11 shows that except for lead, the worst case total annual emission of toxic metals,
scandium and uranium from dust emission are comparable to or less than the natural an-

Dust Dispersion Report 29 / 43
TANBREEZ Project
nual dissolved loads from one stream discharging into Kangerluarsuk Fjord. The dust im-
pact on the fjord is actually much less, since only a fraction of the emitted dust falls on the
fjord, and dust particles will settle to the bottom without significant leaching of metals or
REE.
The worst case emission loads of lead, yttrium, lanthanum and thorium in dust emissions
are on the order of 34 to 67 times higher, and cerium load in dust is 376 times than the
Lakseelv load. No indication can be judged for these elements with higher ratios without an
assessment of the solubility and bioavailability of the actual metal compounds in the dust,
and the distribution of dust deposition on the landscape and the fjord.
5.4 Deposition of Metals and REE
The annual deposition load of metals and REE will be proportional to the annual deposition
of TSP shown earlier in Figure 5 and Figure 6. The TSP deposition rates shown in
kg/ka/year on the isolines in those figures can be converted to metal and REE deposition
rates by multiplying by the assumed worst-case concentrations given in Table 10. Equiva-
lent load values in mg/ha/year and µg/m2/day are given for two selected isoline values (1
and 20 kg TSP/ha/year) in Table 12.

Dust Dispersion Report 30 / 43
TANBREEZ Project
Table 12 Equivalent metal and REE deposition rates for selected TSP deposition isoline values in Figure 5 and Figure 6. Conversion from kg TSP/ha/year to metal and REE deposition in mg/ha/hr and µg/m2/day.
TSP Isoline level 1 kg TSP/ha/yr 20 kg TSP/ha/yr 1 kg TSP/ha/yr 20 kgTSP/ha/yr
Element
mg/ha/yr mg/ha/yr µg/m2/day µg/m2/day
Aluminum Al 82 1636 22 448
Iron Fe 101 2020 28 553
Copper Cu 0.04 0.80 0.011 0.22
Zinc Zn 1.2 25 0.34 6.8
Arsenic As 0.06 1.2 0.017 0.34
Cadmium Cd 0.005 0.09 0.001 0.025
Lead Pb 0.93 19 0.26 5.1
Scandium Sc 0.006 0.12 0.002 0.033
Yttrium Y 1.2 25 0.34 6.7
Lanthanum La 1.4 27 0.38 7.5
Cerium Ce 2.6 51.6 0.71 14
Praseodymium Pr 0.28 5.6 0.077 1.5
Neodymium Nd 1.0 19 0.27 5.3
Samarium Sm 0.19 3.9 0.053 1.1
Europium Eu 0.019 0.37 0.005 0.10
Gadolinium Gd 0.19 3.9 0.053 1.1
Terbium Tb 0.03 0.67 0.009 0.18
Dysprosium Dy 0.25 5.0 0.068 1.4
Holmium Ho 0.05 1.1 0.015 0.29
Erbium Er 0.17 3.3 0.045 0.90
Thulium Tm 0.025 0.50 0.007 0.14
Ytterbium Yb 0.16 3.1 0.043 0.85
Lutetium Lu 0.021 0.41 0.006 0.11
Thorium Th 0.10 2.1 0.028 0.56
Uranium U 0.03 0.67 0.009 0.18
As shown earlier in Table 2, there are German limit values for atmospheric deposition of six
heavy metals: As, Cd, Pb, Ni, Hg and Tl. Calculated deposition rates for arsenic, cadmium
and lead can be compared the German limit values but there is no sample data on concen-
trations of nickel, mercury and thallium in Tanbreez minerals to calculate loads of these
metals.
Table 13 shows the equivalent arsenic, cadmium and lead deposition loads for the maxi-
mum TSP deposition rates calculated by the dispersion model in comparison to the Ger-
man limit values, for the two scenarios. The TSP deposition rates that would result in metal
loads equal to the limit values are also given.

Dust Dispersion Report 31 / 43
TANBREEZ Project
Table 13 Comparison of maximum heavy metal deposition loads to German limit values, for arsenic, cadmium and lead. TSP deposition rates equivalent to the limit values are given, for comparison with plotted TSP deposition levels plotted in Figure 5 and Figure 6.
Maximum Annual Deposition Load German Deposition Limit Value
Fjord Pit Scenario 51.3 kg TSP/ha/yr
Hill Pit Scenario 71.9 kg TSP/ha/yr
Limit Value Equivalent Tanbreez
TSP Deposition
Element µg/m2/day µg/m
2/day µg/m
2/day kg TSP/ha/year
Arsenic As 0.9 1.2 4 235
Cadmium Cd 0.06 0.09 2 1622
Lead Pb 13.1 18.4 100 391
For the three toxic metals with German limit values for annual deposition, it can be seen
that the worst-case loads will be well below the limit values. The maximum arsenic, cadmi-
um and lead deposition loads in the Fjord Pit scenario are respectively 22%, 3% and
13%of the limits values, and 31%, 5% and 18% of the limit values in the Hill Pit scenario.
The TSP deposition would have to be over 235 kg/ha/year to exceed the arsenic limit val-
ues – a deposition rate more than three times higher than the maximum deposition rate
calculated in the Hill Pit scenario. Even more would be required to reach the other limit val-
ues.
Limit values or critical loads for rare earth elements (REE) are not available. The determi-
nation of critical loads depends on the toxicity, solubility and bioavailability of the specific
REE compounds, and the sensitivity of the local ecosystem to those compounds (Chap-
man, 2008). The long-term environmental effects of REE are still in active research. The
fact that Tanbreez dust will be very similar to the natural surfaces on which it lands, and
REE are naturally occurring in the bedrock and surface waters in the area, supports the
conclusion that the impacts of REE loads are also low.

Dust Dispersion Report 32 / 43
TANBREEZ Project
6 CONCLUSION
Most of the dust from the Tanbreez Project will come from travel on gravel roads: 82% in
the Fjord Pit scenario and 91% in the Hill Pit scenario. The dust will come from gravel
made from the local Kakortokite bedrock exposed throughout the project area. Dust falling
on the land surface will be the same material as the surface itself, and will not change the
chemical composition of the surface or runoff. Dust particles falling directly on streams,
lakes and fjords will mostly settle to the bottom, where it will have the same mineral com-
position as the bottom material. The natural water quality will not be altered by dust and no
impact on Arctic char is forseen.
Dust generation will increase ambient particulate matter concentrations close to mine activ-
ity and haul roads. EU limit values for ambient concentrations of inhalable particles (PM10)
apply to populated and publically accessible areas and not in industrial areas. The EU limit
values have not been formally adopted in Greenland, but are used for comparison. The EU
annual PM10 limit value (40 µg/m3) will be exceeded only in a few small areas within the
mining site itself. The EU short-term 24-hour PM10 limit value (50 µg/m3), reflecting occa-
sional adverse dispersion conditions, will be exceeded no more than 500 m from the active
mine pit and haul roads.
In comparison to the Norwegian nuisance limit value for dust deposition of 5 g/m2/30 days
(167 mg/m2/day), dust deposition is at most 0.6 g/m
2/30 days (20 mg/m
2/day) or 12% of the
nuisance limit value – and that occurs at the dustiest location within the mine site. Dust
deposition rates decline rapidly from the maximum level – to less than 2% of the Norwe-
gian limit value within about 500 m of the pits and haul roads.
There is no vegetation over most of the project area, but where vegetation occurs, plant
communities could be affected up to a few tens of meters from the mine pit, haul roads and
crusher area.
The area where dust deposition is more than 20 kg/ha/year (5.5 mg/m2/day) – a level sug-
gested by Canadian research as a lower threshold for caribou avoidance due to dust on
edible vegetation – is limited to within about 500 m from the mine pits and haul roads, simi-
lar to the 500 m buffer area suggested by the 24-hour ambient PM10 concentrations. Cari-
bou are not found in the area, but this threshold might also be relevant for small mammals
such as Arctic hare and birds like Ptarmigan that feed on plant material, where vegetation
exists.
Mineral dust is expected to have the same chemical composition as the natural Kakortokite
bedrock used for gravel, or the Eudialyte and Feldspar minerals being mined. Heavy metal
loads in dustfall can be compared to German limit values for deposition of arsenic, cadmi-
um and lead: 4 µg As/m2/day, 2 µg Cd/m
2/day and 100 µg Pb/m
2/day. Based on the maxi-
mum calculated dust deposition rate (71.9 kg/ha/year, Hill Pit scenario), and the highest
metal concentrations measured in ore and waste rock samples, the maximum loads of ar-
senic, cadmium and lead in dustfall are 1.2 µg As/m2/day, 0.09 µg Cd/m
2/day and 18.4 µg
Pb/m2/day. These are 31%, 5% and 18% of the German limit values, respectively. Dust
deposition rates decline rapidly from the maximum in the mine site, further reducing the
loads in comparison to the German standards.

Dust Dispersion Report 33 / 43
TANBREEZ Project
The entire load of arsenic, copper, cadmium and zinc in emitted dust is no greater than the
dissolved amount naturally flowing into Kangerluarsuk Fjord from a single stream (Lak-
seelv). Only a fraction of the total dust load will fall on Kangerluarsuk Fjord and most of this
will settle to the bottom without significant leaching of metals. Since the chemical composi-
tion of the dust is similar to the composition of the exposed bedrock on the land surface
and under the fjord, changes to water quality would be very small and difficult to detect.
The impact of dust emission, dispersion and deposition is assessed to be low.
Dust Dispersion Report 34 / 43
TANBREEZ Project
7 REFERENCES
Auerbach, N. A., M. D. Walker & D. A. Walker, 1997. Effects of roadside disturbance on
soil and vegetation properties in arctic tundra. Ecological Applications, 7: 218–235.
Babula, P., V. Adam, R. Opatrilova, J. Zehnalek, L. Havel and R. Kizek, 2008. Uncommon
heavy metals, metalloids and their plant toxicity: a review. Environmental Chemistry Let-
ters, 6:189-213.
Boulanger, J., K.G. Poole, A. Gunn and J. Wierzchowski, 2012. Estimating the zone of in-
fluence of industrial developments on wildlife: a migratory caribou Rangifer tarandus groen-
landicus and diamond mine case study. Wildlife Biology 18(2):164-179.
Chapman, P.M., 2008. Environmental risks of inorganic metals and metalloids: A continu-
ing, evolving scientific odyssey. Human and Ecological Risk Assessment, 14:5-40.
DMI, 2001. The observed climate of Greenland , 1958-1999 – with climatic standard nor-
mals 1961-1990. Danish Meteorological Institute, Technical Report 00-18.
Fulgsang, K., O. Schleicher, A. Oxbøl, 2003. Baggrundsdokument for fastsættelse af
grænseværdi for nedfald af støv og regulering af støvemissioner fra diffuse kilder. [Back-
ground document for establishment of a limit value for deposition of dust and regulation of
dust emissions from diffuse sources. in Danish]. dk-TEKNIK ENERGI & MILJØ. Miljøpro-
jekt Nr. 879 2003. Miljøstyrelsen.
Gandhi, N. S.P. Bhavsar and M.L. Diamond, 2011. Critical load analysis in hazard as-
sessment of metals using a unit world model. Environmental Toxicology and Chemistry,
30(9): 2157-2166.
Gustavson, K., 2012. Miljøpåvirkning fra Stenknuseværker I Grønland – Støv og Støj. [En-
vironmental impact of rock crushing enterprises in Greenland – Dust and Noise]. Aarhus
University, Institute for Bioscience, Technical Report fraom DCE nr. 8, 2012 [in Danish]
Hirano, S. and K.T. Suzuki, 1996. Exposure, metabolism, and toxicity of rare earths and re-
lated compounds. Environmental Health Perspectives, 104, supplement I, 85-95.
Myers-Smith, I.H., B,K. Arnesen, R.M. Thompson and F.S. Chapin III, 2006. Cumulative
impacts on Alaskan arctic tundra of a quarter century of road dust. Ecoscience 13(4): 503-
510.
MTHøjgaard Grønland, 2011. Port and Plant Site Infrastructure and Ancillary Facilities.
Tanbreez Project. Doc. REP0009, rev. 2, 30 January 2011.
MTHøjgaard Grønland, 2012. Process. Tanbreez Project. Doc. REP0014, rev.2, 5 March
2012.
MTHøjgaard Grønland, 2012. Mining. Tanbreez Project. Doc. REP0008, 7 March 2012.
Norway, 2004. Forskrift om begrensning av forurensning, FOR 2004-06-01 nr 931. (Regu-
lation on limitation of pollution).

Dust Dispersion Report 35 / 43
TANBREEZ Project
NPI, 2012. Emission Estimation Technique Manual for Mining, version 3.1, January 2012.
National Pollutant Inventory, Dept. of Sustainability, Environment, Water, Population and
Communities, Australia.
Orbicon, 2012. Tanbreez Project EIA, Annex 2 – Climate and Hydrology.
Rudnick, R.L. and S. Gao, S., 2003. The Composition of the Continental Crust, pp. 1-64.
In: Rudnick, R.L. (ed.) The Crust, Vol. 3, Treatise on Geochemistry (eds. H.D. Holland and
K.K. Turekian), Elsevier-Pergamon, Oxford.
TA Luft, 2002. First General Administrative Regulation Pertaining the Federal Immission
Control Act (Technical Instructions on Air Quality Control – TA Luft) of 24 July 2002 [origi-
nal in German]. Federal Ministry for Environment, Nature Conservation and Nuclear Safety,
Germany.
Tyler, G., 2004. Rare earth elements in soil and plant systems - A review. Plant and Soil,
267 (1-2): 191-206.
US EPA, 1995. AP-42. Compilation of Air Pollutant Emission Factors, Fifth Edition, Volume
1: Stationary Point and Area Sources. (using the latest versions of individual sections)
Vermont Agency of Natural Resources, 1994. Vermont Used Oil Analysis and Waste Oil
Furnace Emissions Study. Revised March 1996.
WRAP, 2006. WRAP Fugitive Dust Handbook. Western Governors’ Association, Prepared
by: Countess Environmental.

Dust Dispersion Report 36 / 43
TANBREEZ Project
8 APPENDIX 1 – DETAILS OF EMISSION CALCULATIONS
8.1.1 Drilling
EFTSP = 0.59 kg/hole AP-42 Table 11.9-4
PM10/TSP = 0.52 AP-42 Table 11.9-2
Assumptions for maximum emission rates: 6.7 m/hole; 2 drills each drilling 20 m/hour + 4
minutes/hole to reposition: maximum 4.98 holes/hour, 99.6 holes/day.
Assumptions for annual emission: 595,200 tons/yr / 8400 tons/blast = 71 blasts/yr.
153 holes/blast x 71 blasts/yr = 10,863 holes/yr.
8.1.2 Blasting
EFTSP = 0.00022 x (A)1.5
kg/blast AP-42 Table 11.9-2
where A is the horizontal area of blasting in m2.
PM10/TSP = 0.52 AP-42 Table 11.9-2
Assumptions for maximum emission rates: blast area A= 12 m x 48 m = 576 m2.
1 blast/hr; 1 blast/day
Assumptions for annual emission: 71 blasts/yr (see drilling)
Note that blasting emissions should be omitted from the hourly and daily maximum emis-
sion rates since other activities are suspended in the pit and on the haul road during blast-
ing, but blasting has a smaller emission rate.
8.1.3 Excavator loading of haul trucks
2 excavators: 1 Hitachi ZX450LC-3, 2.65 m3 bucket, 173 m
3 per hour; 1 Hitachi ZX350LC-
3. Drop into haul trucks. Required excavation 163 m3 per hour. Haul trucks Volvo A35E. 17
m3 ore per trip (34 tons/trip).
EFTSP = 0.018 kg/ton AP-42 Table 11.9-4, truck loading by power shovel
PM10/TSP = 0.095 AP-42 Table 11.9-2, truck loading, moisture M = 2%
Assumptions for maximum emission rates: 340 tons/hr; 12 hr/day; 4080 tons/day
Assumptions for annual emission: 595,200 tons/yr
8.1.4 Wheel loader in pit
1 wheel loader, CAT 938H, 2.3-3 m3 bucket. The wheel loader is used to push and pile ore
in the muck pile after blasting so it can be loaded by the excavators. Assume same emis-
sion factor as excavator loading trucks, but half the material volume.

Dust Dispersion Report 37 / 43
TANBREEZ Project
EFTSP = 0.018 kg/ton AP-42 Table 11.9-4, truck loading by power shovel
PM10/TSP = 0.095 AP-42 Table 11.9-2, truck loading, moisture M = 2%
Assumptions for maximum emission rates: 170 tons/hr; 12 hr/day; 2040 tons/day
Assumptions for annual emission: 297,600 tons/yr
8.1.5 Haul trucks and other vehicle travel on unpaved roads
Generation of dust from travel on unpaved roads and work areas is the largest source of
dust emission in open pit mining. The emission factor for unpaved roads depends on silt
content of the road surface and average weight of vehicles travelling on the road.
EFTSP = 1.381 x (s/12)0.7
x ((W x 1.1023)/3)0.45
x ((365-P)/365) x (100-C)/100 kg/km
AP-42 13.2.2, eq. 1a and Table 13.2.2-2, values for
TSP adapted to metric units
where s = silt content in percent and
W is average vehicle weight in tons
P is the number of days with precipitation > 0.25 mm
C is the dust control efficiency in percent
Parameters used:
s = 7% AP-42 Table 13.2.2-1, average of two values for
haul roads
M = 26 t – pit and haul road average vehicle weights (weighted-average by dis-
tance)
M = 13 t – SR04 port service road
M = 7 t – SR service roads
P = 106 days/year DMI (2001), Narsarsuaq, interpolated for days with
more than 0.25 mm precipitation
C = 35% assumed watering and/or chemical dust suppression
equivalent to 75% dust control on 170 frost-free
days per year. 75% x 170/365 = 35%

Dust Dispersion Report 38 / 43
TANBREEZ Project
Emission factors:
Road M, tons EFTSP, kg/km
Haul road and pit 26 t 1.20731
Stockpile area and SR04 13 t 0.88380
Service roads 7 t 0.66892
PM10/TSP = 0.275 AP-42 13.2.2, eq. 1a and Table 13.2.2-2, values for PM10,
ratio to the TSP emission factor
8.1.6 Grading
A Volvo G946B grader will be used to grade the access and service roads and haul routes
in the mine pit. It will also be used for snow removal in the winter, but that is only relevant
for engine emissions. Emission is based on the travel distance and speed of grading.
EFTSP = 0.0034 (S)2.5
kg/km AP-42 Table 11.9-2
where S is the mean vehicle speed in km/hr. S is assumed to be 5 km/hr.
EFTSP = 0.0034 (5)2.5
= 0.190 kg/km
The average grading distances travelled have been estimated based on assumed frequen-
cies of grading and number of passes, on each road and in the pit. The active haul road
(AR-01 or AR-02) is assumed graded daily with three passes and service roads once per
week with two passes. A turnaround time of 0.1 hr is added for each pass. The estimated
distances and times are shown in the table below, with the daily distance representing the
maximum daily grading on each road. The hill access road AR01 is treated as a service
road for the Fjord Pit scenario.
Road hr/day km/day hr/yr km/yr
AR01 (Hill scenario) 4.4 14.1 1285 4117
AR02 (Hill scenario) 0.6 4.2 21 149
AR01 (Fjord scenario) 4.4 14.1 156 499
AR02 (Fjord scenario) 0.6 4.2 175 1226
SR04 0.5 2 146 584
SR 1.5 7.2 53 255
PIT 2 8 584 4672
8.1.7 Haul truck unloading at the ROM stockpile
Note: the emission factor is for PM10. The same PM10/TSP ratio as truck loading is as-
sumed.
EFPM10 = 0.000008 kg/ton AP-42 Table 11.19.2-1, truck unloading, fragmented stone.

Dust Dispersion Report 39 / 43
TANBREEZ Project
PM10/TSP = 0.095 AP-42 Table 11.9-2, truck loading, moisture M = 2%
EFTSP = 0.000008 / 0.095 = 0.000084 kg/ton
Assumptions for maximum emission rates: 340 tons/hr; 12 hr/day; 4080 tons/day
Assumptions for annual emission: 595,200 tons/yr
8.1.8 ROM stockpile stacking
2 wheel loaders, Volvo FL150, will stack ore in the ROM stockpile after unloading by haul
trucks. The ROM stockpile corresponds to about 1-2 weeks of production (16,800 to
33,600 tons).
EFTSP = 0.004 kg/t NPI Mining, section 1.1.15, loading stockpiles
PM10/TSP = 0.433 NPI Mining, section 1.1.15, loading stockpiles
Assumptions for maximum emission rates: 340 tons/hr; 12 hr/day; 4080 tons/day
Assumptions for annual emission: 595,200 tons/yr
8.1.9 Loading of the primary crusher
1 wheel loader, Volvo LF180, is used to load the primary crusher from the ROM stockpile.
EFTSP = 0.03 kg/t NPI Mining, section 1.1.15, unloading from stockpiles
PM10/TSP = 0.433 NPI Mining, section 1.1.15, unloading from stockpiles
Assumptions for maximum emission rates: 100 tons/hr, 24 hr/day, 2400 tons/day
Assumptions for annual emission: 595,200 tons/year
8.1.10 Primary and secondary crusher
Primary crusher: Pegson 400 jaw crusher, mobile. Secondary crusher: Pegson 1000SR
cone crusher, mobile. The output conveyor of the primary crusher drops directly into the
secondary crusher feed hopper. There are no filters on the Jaw and Cone crushers, but on
the Cone crusher there is a dust seal. The secondary crusher feeds a 30 m3 hopper inside
the process building via a closed conveyor belt. The feed hopper of the process plant is
dedusted as part of the process plant dedusting system, so no transfer emission is calcu-
lated.
AP-42 does not list emission factors for primary or secondary crushing, but indicates that
emission factors for tertiary crushing can be used as an upper limit for primary crushing.
Primary and secondary crushers, uncontrolled:

Dust Dispersion Report 40 / 43
TANBREEZ Project
EFTSP = 0.0027 kg/ton AP-42 Table 11.19.2-1, tertiary crushing
PM10/TSP = 0.444 AP-42 Table 11.19.2-1, tertiary crushing
Conveyor transfer from primary to secondary crusher, uncontrolled:
EFTSP = 0.0015 kg/ton AP-42 Table 11.19.2-1, conveyor transfer point
PM10/TSP = 0.367 AP-42 Table 11.19.2-1, conveyor transfer point
Assumptions for maximum emission rates: 100 tons/hr (each crusher), 24 hr/day, 2400
tons/day
Assumptions for annual emission: 595,200 tons/year (each crusher)
8.1.11 Process plant and storage building
All dedusting air in the process plant is discharged through a single exhaust on the roof of
the process building. The dust concentration in the filtered exhaust air is specified to be
maximum 5 mg/m3. The air volume is 100 m
3/minute. The dedusting system is assumed to
be in operation 24 hours/day on all days of mine operation, 292 days/year.
ETSP = 5 mg/m3 x 100 m
3/min x 10
-3 g/mg / 60 sec/min = 0.00833 g/s
PM10/TSP = 0.995 assumed for filtered air
Assumptions for maximum emission rates: 24 hours/day
Assumptions for annual emission: 292 days/year
8.1.12 Ship loading
The ship loading conveyor system is enclosed with dedusting. Eudialyte or feldspar is
loaded into the conveyors system in the product buildings, which are assumed to be de-
dusted by air drawn into the process building dedusting system, or the ship loader dedust-
ing system. The ship loader conveyor has dedusting exhausts at four locations: 1) at the
two points where the storage building conveyors enter the ship loading conveyor (85
m3/min.), 2) at the conveyor transfer point in the middle of the ship loader (85 m
3/min.), and
3) at the end of the ship loader conveyor over the discharge chute to the ship (55 m3/min.).
Only one of the storage conveyor dedusting systems will be in operation at a time.
The Eudialyte production is assumed to be 17% of the annual ore production of 595,200,
and Feldspar is 34% – a total of 303,552 tons of products per year. Ship loading is as-
sumed to occur six times per year, with 50,595 tons loaded per ship. The conveyor system
operates 20 hour/day. The loading rate with 90% efficiency is 750 x 90% = 675 tons/hr.
The ship loading time is estimated to be 75 hours/ship, or 3.75 days.
For the storage conveyor and middle transfer points (85 m3/min):

Dust Dispersion Report 41 / 43
TANBREEZ Project
ETSP = 5 mg/m3 x 85 m
3/min x 10
-3 g/mg / 60 sec/min = 0.00708 g/s
ETSP = 5 mg/m3 x 55 m
3/min x 10
-3 g/mg / 60 sec/min = 0.00458 g/s
For all discharges:
PM10/TSP = 0.995 assumed for filtered air
Assumptions for maximum emission rates: operation 20 hr/day
Assumptions for annual emission: 6 x 75 = 450 hour/yr.
8.1.13 Wind erosion of storage piles
Dust generated by wind on active disturbed areas and storage piles is calculated for the
open pit and for the ROM stockpile next to the process plant.
EFTSP = 1.9 x s/1.5 x ((365-P)/365) x f / 15 kg/ha/day WRAP (2006), sect. 9.3
where s is the silt content of the surface material in weight percent,
P is the number of days with precipitation > 0.25 mm/day, and
f is the percentage of time that the wind speed is greater than 5.4 m/s at the mean height of
the stockpile.
PM10/TSP = 0.5 WRAP (2006), sect. 9.3
Assumed parameter values:
s = 2%
P = 106 days/year >0.25 mm Climate monitoring station at Tanbreez hill site, 2010-
2011.
f = 6.8% Percent of time wind speed at 10m > 9 m/s, based on
threshold of 5.4 m/s at average pile height of 3 m, ex-
trapolated to wind measurement height of 10 m, by log
profile (z0 = 0.5 m). Climate monitoring station at Tan-
breez hill site, 2010-2011.
EFTSP = 1.9 x 2/1.5 x ((365-106)/365) x 6.8/15 = 1.265 kg/ha/day
Active pit area: Assume 200 m x 300 m / 10000 m2/ha = 6 ha
ETSP = 1.265 kg/ha/day x 6 ha x 1000 g/kg / 86400 s/day = 0.0878 g/s
ROM stockpile area: Assume area 60 m x 100 m / 10000 m2/ha = 0.6 ha

Dust Dispersion Report 42 / 43
TANBREEZ Project
ETSP = 1.265 kg/day/ha x 0.6 ha x 1000 g/kg / 86400 s/day = 0.00878 g/s
These values are applied as hourly, daily and annual emission rates.
8.1.14 Power plant
The power plant will have three 2636 kW diesel generator units (1 is reserve) - Wärtsilä
6L32D, SFOC: 198.39 g/kWhe. The fuel is arctic diesel. The stack is 25 m high and about
1.5 m in diameter. There are separate flue gas tubes for each engine, each with inner di-
ameter 0.60 m.
Particulate emission from the diesel engines is specified to conform to max. 50 mg/Nm3
(dry, 15% O2).
Based on information provided by Wärtsilä, the exhaust gas flow per engine is 5.32 kg/s,
wet with 12%v O2 and 5.82%v H2O. The exhaust gas temperature after turbo is 348°C. Ex-
haust gas density is calculated to 1.2907 kg/Nm3, giving 4.122 Nm
3/s, wet at 12%v O2.
Converting to dry flow at 15%v reference O2 concentration, the flow volume is 2.558 Nm3/s.
The 100% load PM emission rate for two engines is:
EPM(100%) = 2 units x 50 mg/Nm3 x 2.558 Nm
3/s x 10
-3 g/mg = 0.2558 g/s
Two units will generate 5,272 kW at full load. The maximum load requirement specified in
the Feasibility Study is 4300 kW, which is 81.6% of full load for two units. The hourly and
daily maximum values are assumed to be at 81.6% of full load:
EPM(81.6%) = 2 units x 50 mg/Nm3 x 2.558 Nm
3/s x 10
-3 g/mg x 0.816 = 0.2087 g/s
For the annual average load, it is assumed two units operates at 81.6% for 292 days and at
25% load the remaining 73 days. The effective average load on 2 units is 70.3%.
EPM(70.3%) = 2 units x 50 mg/Nm3 x 2.558 Nm
3/s x 10
-3 g/mg x 0.703 = 0.1798 g/s
The above PM rates are assumed to be TSP values. The PM10/TSP ratio is
PM10/TSP = 0.822 AP-42 Table 3.4-2, stationary diesel
The maximum hourly and daily PM10 emission rates are thus 0.1716 g/s and the annual
average PM10 rate is 0.1478 g/s.
8.1.15 Incinerator
Containerized incinerator - Atlas 600 SL B WS P. Waste load 200 kg waste per day + 66 li-
ter/hour oil sludge (max). Burn every second day, ca 19 hours combustion for 400 kg waste
+ 66 liter/hour oil sludge (max). Fuel: arctic diesel, 47.007 MJ/kg, 0.2% S (assume entirely
fueled by waste oil without additional diesel oil).
Flue gas: 12450 m3/hr at 350°C.

Dust Dispersion Report 43 / 43
TANBREEZ Project
Stack: 15 m, inner diam. 650 mm, outer diam. 800 mm
Refuse:
EFTSP = 0.126 kg/ton. AP-42 2.1-1, refuse
ETSP = 0.126 kg/ton x 0.2 ton x 1000 g/kg / (19 hr * 3600 s/hr) = 0.000368 g/s
PM10/TSP = 0.80 AP-42 2.1-1, refuse
Waste oil:
EFTSP = 0.00767 x A g/l AP-42 Table 1.11-1
where A is the ash content in percent.
Assume A = 0.5% Vermont Used Oil Analysis and Waste Oil Furnace Emis-
sion Study, rev. 1996.
EFTSP = 0.00767 g/l x 0.5% = 0.00383 g/l
ETSP = 0.00383 g/l x 66 l/hr / 3600 s/hr = 0.00007 g/s
Maximum hourly emission rate: 0.000368 g/s + 0.00007 g/s = 0.000438 g/s
Maximum daily emission rate: 0.000438 g/s * 19 hr/24 hr = 0.000347 g/s
Annual average emission rate, assuming burn every second day, or 292/2 = 146 days/yr.
ETSP = 0.00347 g/s * 146 days/365 days = 0.000139 g/s
8.1.16 Mobile equipment engine exhaust
Emissions for PM from vehicle and mobile equipment emissions are based on EU Stage
IIIB non-road diesel engine standards effective 2011-2013 – PM 0.025 g/kWh. For pickup
trucks, the EU EURO5/6 PM emission standard of 0.005 g/km, effective since 2009 is
used. The US EPA Tier 4 PM standard is similar (0.02 g/kWh), effective 2001-2014.
Total operating times are estimated for each type of mobile equipment in each work area or
road, based on operation schedule and/or assumed numbers of trips and travel distances.