Dusan Drabik & Harry de Gorter The effects of developing countries’ policy responses to the food...
19
Dusan Drabik & Harry de Gorter The effects of developing countries’ policy responses to the food price boom and biofuel policies 17 JUNE 2015 | ICABR, Ravello, Italy
-
Upload
lora-quinn -
Category
Documents
-
view
220 -
download
1
Transcript of Dusan Drabik & Harry de Gorter The effects of developing countries’ policy responses to the food...

Dusan Drabik & Harry de Gorter
The effects of developing countries’ policy responses to the food price boom and biofuel policies
17 JUNE 2015 | ICABR, Ravello, Italy

0
0.5
1
1.5
2
2.5
3
3.5
4
Cereal and oilseed price indicies (January 2005 = 1)
Corn Wheat Soybeans Rice
Silent tsunamis
Earthquake NOT felt round the world
8 years of price turmoil; Real corn prices 75% higher in 2014 than in 2005; wheat 40% higher; rice 30% higher

How biofuel policies the cause? • Caused a link between crop and biofuel prices
• Biofuel-crop price multipliers very high• 2 states of nature for biofuel prices:
1. Linked to energy prices (lowest prices can go)
2. Or float up and away• New counterfactual is the crop-biofuel price
link

200
400
600
800
1000
1200
1400
1600
1800
100
200
300
400
500
600
700
800
Near futures prices for corn, soybeans and crude oil
Corn Crude oil (index) Soybean

Corn-ethanol prices became linked
Corn-ethanol-gasoline-crude oil
Now always locked
Locked or ethanol prices float up & away
Price floor for ethanol (corn) when locked; otherwise mandate premiums and even higher ethanol (corn prices)
Always locked
Evidence?
0
1
2
3
4
5
6
7
8
0
0.5
1
1.5
2
2.5
3
3.5
4
Cor
n ($
/bus
hel)
Eth
anol
Pri
ce (
$/ga
llon
)
Crude oil, ethanol and corn prices 33 months before the earthquake
Crude oil (index) Ethanol Corn MTBE ban
Crude oil > $40 per barrel

Corn-ethanol price link
7
0 CO1 1C EP P c P
r r

How well does the corn-ethanol price link formula forecast?
8
0
1
2
3
4
5
6
7
8
9
10
Sep-
07
Nov
-07
Jan-
08
Mar
-08
May
-08
Jul-
08
Sep-
08
Nov
-08
Jan-
09
Mar
-09
May
-09
Jul-
09
Sep-
09
Nov
-09
Jan-
10
Mar
-10
May
-10
Jul-
10
Sep-
10
Nov
-10
Jan-
11
Mar
-11
May
-11
Jul-
11
Sep-
11
Nov
-11
Jan-
12
Mar
-12
May
-12
Jul-
12
Sep-
12
Nov
-12
Jan-
13
Mar
-13
May
-13
Jul-
13
Sep-
13
Nov
-13
Jan-
14
Mar
-14
May
-14
Jul-
14
Sep-
14
$/bu
shel
Predicted versus actual corn prices
Corn price (actual) Predicted corn price (de Gorter-Drabik-Just formula)

How well does the soybean oil price equation forecast?
9
0.00
0.10
0.20
0.30
0.40
0.50
0.60
0.70
0.80
$/po
und
Prediction Errors for US Soybean Oil Prices
Soybean oil price Predicted soybean oil price

The law of one international relative price of grains & oilseeds due to:
- Competition for land- Substitution in demand
10

-5
15
35
55
75
95
115
135
155
175
-15
5
25
45
65
85
105
125
145
165
185
$ pe
r ba
rrel
Inde
x
Four Revealing Time Periods: Cereal and Crude Oil Price Movements
Cereals Price Index Crude Oil Price
Earthquake not heard round the world
June-10April-11
Jul-2007Dec-2008
Mandatepremiums
Dec-08May-10

Developing country policy responses to food price increases
“Standing up in the stadium effect”• Economists overwhelming argued these policy
responses were self-defeating• And had negative effects on the rest of the world• But that is under the assumption of traditional supply
demand models (model biofuel demand as manna from heaven)
12

The effects of export restrictions on rice prices
Source: Headey and Fen (IFPRI)
100
200
300
400
500
600
700
800
900
Jan-
07Fe
b-07
Mar
-07
Apr-
07M
ay-0
7Ju
n-07
Jul-0
7Au
g-07
Sep-
07O
ct-0
7N
ov-0
7D
ec-0
7Ja
n-08
Feb-
08M
ar-0
8Ap
r-08
May
-08
Jun-
08Ju
l-08
Aug-
08Se
p-08
Oct
-08
Nov
-08
Dec
-08
Jan-
09Fe
b-09
Mar
-09
Apr-
09M
ay-0
9Ju
n-09
Nom
inal
Ric
e Pr
ice,
USD
(Tha
il A1
Sup
er)
Jan: Egypt restrict exports
Jan-Feb: Drought in Iran order 0.8 million mt of Thai rice
Jan-Apr: Philippines buys normal annual quota in just 4 months, including govt-to-govt deal with Vietnam
Mar: India, Vietnam, China & Cambodia impose tighter export restrictions & new Thai govt discusses possibility of ban
Apr: Nigeria scraps 100% tariffs & imports 0.5 million mt Thai rice
Sep-Oct 2007, Vietnam and India place partial restrictions on exports
Sep: India lifts export ban on some higher quality varieties
Q1: Saudi Arabia subsidizes rice imports; imports from Thailand rise by nearly 90% after India’s ban
Strong demand from energy exporters keeps rice prices 25-30% above 2007 levels
Jun: Cambodia removes ban
Jun: Egypt announces re-export of rice from Sep.
Jun: Japan allowed to re-export rice stocks, dollar strengthens, oil & other crop prices fall
The Conventional Wisdom
Or did policies follow prices?
Ch. 6: Developing Country Policy Responses
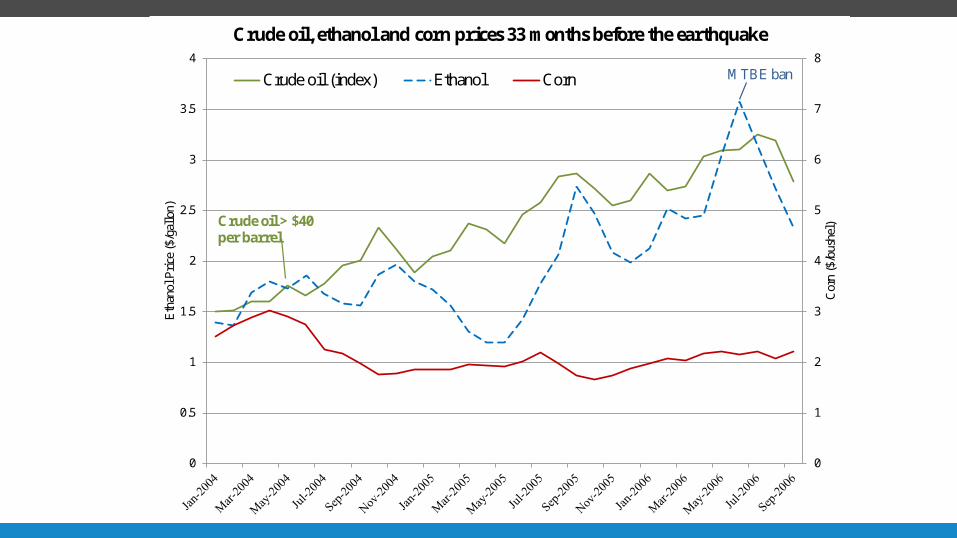
• “Standing up in the stadium effect”• Really?
14
0.5
0.9
1.3
1.7
2.1
2.5Consumption weighted domestic and international prices in developing countries
Domestic International
price trend Jan 06 to June 07
a
b
c
* Price index of rice, wheat, maize and sugar.

India rice prices
15

16
0.00
1.00
2.00
3.00
4.00
5.00
6.00
7.00
8.00
9.00
40
60
80
100
120
140
160
180
$ pe
r bus
hel
$ pe
r bar
rel
What if Brent crude oil prices went up instead?Brent crude oil price
What if Brent went up instead?
Corn price
Lowest corn price if Brent went up instead
$110 average crude oil price Jan 2011 to June 2014
Corn price > $8.00 if tax credit was not allowed to expire (a savings of a possible an other $1 billion per day subsidy!)

• Recent EIA baseline prediction of $141/barrel (2013 prices) by 2040
• If correct, corn prices (in real terms) will never return to its previous long term decline
17
0.00
1.00
2.00
3.00
4.00
5.00
6.00
7.00
8.00
9.00
10.00
0
1
2
3
4
5
6
7
8
9
10
1960
1961
1962
1963
1964
1965
1966
1967
1968
1969
1970
1971
1972
1973
1974
1975
1976
1977
1978
1979
1980
1981
1982
1983
1984
1985
1986
1987
1988
1989
1990
1991
1992
1993
1994
1995
1996
1997
1998
1999
2000
2001
2002
2003
2004
2005
2006
2007
2008
2009
2010
2011
2012
2013
2014
Real Corn Prices
projected trend
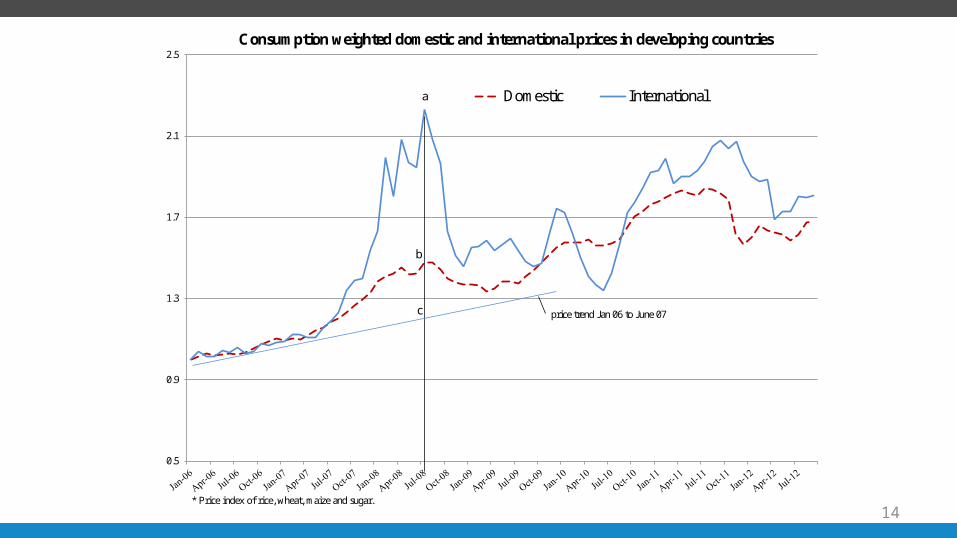
Implications for Food Security?• Best cure for high prices is high prices (8 years
2006-2014)• Best cure for low prices is low prices (one and
only one event sparked 2006-14 price boom)

IFPRI and Biofuels• IFPRI’s 2015 Global Food Policy Report,
one mention of biofuels on p. 28:“Recent food price volatility and spikes…The complex set of factors behind the recent food price crises in 2007–2008 and 2011—including diversion of crops for biofuel, extreme weather events, low grain stocks, and panicky trade behaviors—is still present or has the potential to reemerge”
19