Durham Research Onlinedro.dur.ac.uk/24174/1/24174.pdfhealth, happiness, pleasure, and self-esteem...
32
• • •
Transcript of Durham Research Onlinedro.dur.ac.uk/24174/1/24174.pdfhealth, happiness, pleasure, and self-esteem...

Durham Research Online
Deposited in DRO:
23 February 2018
Version of attached �le:
Accepted Version
Peer-review status of attached �le:
Peer-reviewed
Citation for published item:
Hornsey, M.J. and Bain, P.G. and Harris, E.A. and Lebedeva, N. and Kashima, E. and Guan, Y. andGonz�alez, R. and Chen, S.X. and Blumen, S. (2018) 'How much is enough in a perfect world? Culturalvariation in ideal levels of happiness, pleasure, freedom, health, self-esteem, longevity, and intelligence.',Psychological science., 29 (9). pp. 1393-1404.
Further information on publisher's website:
https://doi.org/10.1177/0956797618768058
Publisher's copyright statement:
Hornsey, M.J., Bain, P.G., Harris, E.A. Lebedeva, N., Kashima, E., Guan, Y., Gonz�alez, R., Chen, S.X. Blumen, S.(2018). How much is enough in a perfect world? Cultural variation in ideal levels of happiness, pleasure, freedom,health, self-esteem, longevity, and intelligence. Psychological Science 29(9): 1393-1404. Copyright c© 2018 TheAuthor(s). Reprinted by permission of SAGE Publications.
Additional information:
Use policy
The full-text may be used and/or reproduced, and given to third parties in any format or medium, without prior permission or charge, forpersonal research or study, educational, or not-for-pro�t purposes provided that:
• a full bibliographic reference is made to the original source
• a link is made to the metadata record in DRO
• the full-text is not changed in any way
The full-text must not be sold in any format or medium without the formal permission of the copyright holders.
Please consult the full DRO policy for further details.
Durham University Library, Stockton Road, Durham DH1 3LY, United KingdomTel : +44 (0)191 334 3042 | Fax : +44 (0)191 334 2971
http://dro.dur.ac.uk
1
How much is enough in a perfect world?
Cultural variation in ideal levels of happiness, pleasure, freedom, health, self-esteem,
longevity, and intelligence
M.J. Hornsey1*, P.G. Bain2, E. A. Harris1, N. Lebedeva3, E. Kashima4, Y. Guan5, R.
González6, S. X. Chen7 , S. Blumen8
Affiliations:
1 University of Queensland, Brisbane, Australia.
2 University of Bath, Bath, UK.
3 National Research University, Higher School of Economics, Moscow, Russia
4 LaTrobe University, Melbourne, Australia.
5 Durham University Business School, Durham, UK.
6 Pontificia Universidad Catolica de Chile, Santiago, Chile.
7 The Hong Kong Polytechnic University, Hong Kong, China
8 Pontificia Universidad Católica Del Perú, Lima, Perú.
Corresponding author: Prof. Matthew Hornsey, School of Psychology, Campbell Rd, St
Lucia, University of Queensland
E: [email protected] T: +61 7 3365 6378 F: +61 7 3365 4466
2
Abstract
The maximization principle – that people aspire to the highest possible level of something
good if all practical constraints are removed – is a common yet untested assumption about
human nature. We predict that in holistic cultures – where contradiction, change and context
are emphasized – ideal states of being for the self will be more moderate than in other
cultures. In two studies (Ns=2392 and 6239) we asked: If participants could choose their
ideal level of happiness, pleasure, freedom, health, self-esteem, longevity, and intelligence,
what level would they choose? Consistent with predictions, maximization was less
pronounced in holistic cultures; they aspired to less happiness, pleasure, freedom, health, self-
esteem, longevity, and IQ than did members of other cultures. In contrast, no differences
emerged on ideals for society. The studies show that the maximization principle is not a
universal aspect of human nature, and that there are predictable cultural differences in
people’s notions of perfection.

3
How much is enough in a perfect world?
Cultural variation in ideal levels of happiness, pleasure, freedom, health, self-esteem,
longevity, and intelligence
If people could attain unlimited amounts of good things – for example if they could
choose their ideal levels of longevity, intelligence, freedom, self-esteem, health, pleasure, and
happiness – what would they choose? One option – which we refer to as a maximization
principle – is that people’s ideal worlds will comprise the maximum possible levels of things
they consider positive. Maximization has been described as “the most basic, unexamined
assumption about human nature” (Howard, 2000, p.511, see also Herrnstein, 1990).1 It carries
the advantage of being intuitive: We know that people aspire to positive things, and that they
have fundamental desires to stay alive (Solomon, Greenberg, & Pyszczynski, 1991), to feel
self-determined (Ryan & Deci, 2017), to be happy (Kesebir & Diener, 2008), to experience
security (Maslow, 1943), and to have positive self-regard (Leary, Tambor, Terdal, & Downs,
1995). So if people could achieve unlimited levels of life, liberty, happiness, and so forth,
then why would they not aspire to it? This maximization principle heavily influenced rational
choice theories of economics, with most neoclassical economists presuming that individuals
wish to maximize their happiness through their consumption and investment choices.
The counter-point to the maximization principle - which we call the moderation
principle – is that people impose mindful ceilings on how much of a good thing they aspire to
in a perfect world. This principle is famously encapsulated by Aristotle’s “golden mean”
(Aristotle, 1967), which maintains that the ideal level is often a point between two extremes:
one of excess and one of deficiency. However, the moderation principle is also threaded
through East Asian philosophies and religions such as Buddhism, Confucianism, Hinduism,
Jainism, and Taoism. According to Nisbett and colleagues (Miyamoto, Nisbett, & Masuda,

4
2006; Nisbett & Miyamoto, 2005; Nisbett, Peng, Choi, & Norenzayan, 2001), cultures
influenced by these traditions develop a holistic way of thinking about themselves and the
world. This holistic orientation incorporates three dimensions – contradiction, change, and
context – and we argue that each of these ways of thinking lead to a relatively moderate
approach to perfection.
First, the principle of contradiction – sometimes referred to as dialecticism - suggests
that positive experiences imply the potential for negative experiences, and the latter can be a
pre-requisite for the former (Peng & Nisbett, 1999; Spencer-Rodgers, Williams, & Peng,
2010). The ancient Chinese principle of yin and yang, for example, maintains that seemingly
contradictory forces co-exist in a complementary, inter-related state, such that one cannot
exist without the other. Evidence confirms that in holistic cultures there is less of an inverse
relationship between the experience of positive and negative emotions than in the West,
where positive and negative experiences operate in a state of hydraulic competition
(Grossmann, Karasawa, Kan, & Kitayama, 2014; Miyamoto, Uchida, & Ellsworth, 2010;
Scollon, Diener, Oishi, & Biswas-Diener, 2005; Sims et al., 2015). These insights suggest a
relatively blended approach to what perfection means in holistic cultures, one that is
comfortable with elements that seem flawed from a non-holistic point of view.
Second, members of holistic cultures are more likely to see experiences and states to
be ever-changing. If internal states are seen to be in constant flux, it implies a futility in
maximizing positive experiences: positive and negative experiences will be seen as
(re)occurring in succession, so the occurrence of one implies the impending occurrence of the
other.
Finally, members of holistic cultures are more likely to construe the self in a way that
is contextually bound and embedded within a social network. To the extent that one has a

5
sense of self that is intrinsically tied to others, a maximalist prioritization of one’s own
health, happiness, pleasure, and self-esteem could be construed as immature and hubristic.
Surprisingly, the tension between maximization and moderation visions of ideals has
not received systematic empirical attention. Where researchers measure ideal states of being,
it tends to be as a benchmark from which to compare actual states (as in self-discrepancy
theory; Higgins, 1987; see also Larsen & McKibban, 2008). One exception is affect valuation
theory (Tsai, Knutson, & Fung, 2006; Tsai, Miao, Seppala, Fung, & Yeung, 2007) which
focuses on the affective levels that are viewed as ideal in Eastern versus Western cultures.
Consistent with the reasoning above, Americans aspire to maximize positive emotional
experiences more than Chinese, particularly high-activation positive emotions like excitement
(Sims et al., 2015; Tsai et al., 2006, 2007). However, there has been no comparison of ideals
beyond emotion. Furthermore, even studies that have been conducted on affect valuation
have primarily focused on comparisons of 2-3 countries, in every case with the U.S. used as a
benchmark.
In response, the current paper measured participants’ ideal levels of happiness,
pleasure, freedom, health, self-esteem, lifespan, and intelligence using multi-national
samples. One research question was purely descriptive: To the extent that people apply a
moderation principle, where do they draw their “golden mean” between excessive and
deficient amounts of something good? The more specific prediction was that members of
holistic nations would report more moderate ideals for themselves than members of non-
holistic nations.
Note that our primary research question involves perceptions of what is ideal at the
intrapsychic/individual level. For comparison, however, we also measured participants’ ideals
for society. We made no a priori predictions regarding the effect of culture on the societal
ideals, and present it here as an open research question.

6
STUDY 1
Method
Sampling and procedure. We sampled nine regions from five continents: Australia,
Chile, China, Hong Kong, India, Japan, Peru, Russia, and the U.S. Drawing on traditional
theorizing, we categorized a region as holistic if it is predominantly influenced by Buddhism,
Confucianism, Hinduism, Jainism, or Taoism (see Grossmann, Huynh, & Ellsworth, 2016, p.
896). In Study 1, four regions met these criteria: China, Hong Kong, India, and Japan. The
other five regions were classified as non-holistic. Participants were 2392 community
members recruited through the online data collection company Social Survey International
(SSI), who responded to an invitation to take part in a survey entitled “Personal ideals and
views”. SSI recruits participants via partnerships and advertising. In order to be included in
SSI’s proprietary panel, participants are required to pass a number of quality control
questions, and response quality is continually monitored across studies. Each participant is
allocated a digital fingerprint that ensures the same person cannot take a survey more than
once. SSI paid participants for their time. The exact payment varied according to region to
provide equivalent and appropriate compensation across countries.
The sample comprised 51.4% females, with a mean age of 39.70 years (SD = 13.84).
Sample size was constrained by budget, but given that sample sizes for holistic and non-
holistic cultural groups exceeded 1000 - and that a power analysis revealed a minimum
sample size of 416 to detect a small effect (d = 0.2) with 80% power - we were confident that
the design was adequately powered. The sample was skewed toward being relatively
educated (40.9% had completed some sort of higher education degree) although, as will be
seen below, education had a very weak relationship with ratings of self-ideals.
Measures. Questionnaires were translated into the native language of non-English
speaking samples by the authors, using translation/back-translation procedures. We prefaced

7
the questions by saying “On the following pages, you’ll be asked some questions about the
ideal society and the ideal life that you’d want to live. Please think carefully about each
answer before responding (try not to just provide an automatic response)”. Three questions
were open-ended. Intelligence was assessed by asking “If you could choose your level of
intelligence, what level would you choose?” and referring participants to an IQ diagram, with
labels for “moderate disability” (40), “below average intelligence” (70), “average
intelligence” (100), “above average intelligence” (130) and “exceptionally gifted” (160).
Participants were told “We would like you to indicate your desired intelligence level using an
IQ score. NOTE: although IQ has no ‘maximum’ score, a score of 100 indicates an average
level of intelligence”. Participants were then asked to write their preferred IQ level in an
open-ended box. Longevity was assessed by asking “If you could choose how long you lived,
how long would that be?” There were two versions of this question. In the first version,
participants were told “Your answer here should presume that you would continue to age at a
normal rate, and that there would be no magic pill of eternal youth”. In the second version of
the question participants were told “Now imagine there was a magic pill of eternal youth.
Please write below (in numbers) how long you would want to live (in whole years).” In both
questions participants were told “If you want to live forever, write ‘Forever’”.
The remaining questions were assessed using closed response scales anchored from 0
to 100. Five of these attributes related to ideals for the self: health (“If you could choose your
level of health, what level would you choose?”; 0 = completely unhealthy, 100 = completely
healthy), freedom for self (“If you could choose the level of freedom in your own life, what
level would you choose?”; 0 = absolutely no freedom, 100 = absolute freedom), happiness
(“If you could choose the extent to which you experienced happiness and sadness in your life,
what level would you choose?”; 0 = only sadness, no happiness ever, 100 = only happiness,
no sadness ever), pleasure (“If you could choose the level of pleasure in your own life, what
8
level would you choose?”; 0 = absolutely no pleasure, 100 = continuous pleasure), and self-
esteem (“If you could choose your level of self-esteem, what level would you choose?”; 0 =
absolutely no self-esteem, 100 = 100% unshakeable self-esteem). These particular
dimensions were chosen because they were unambiguously positively valenced, and because
their antonym is unambiguously negative. We note that some items bear conceptual similarity
to some of Schwartz and colleagues’ (2012) values (pleasure, freedom). We emphasize,
however, that we are considering distinct facets of these constructs from value-based
approaches. Believing that a construct is important (or not) is distinct from the extent to
which one has a maximalist or moderate approach to pursuing that construct. Furthermore,
Schwartz et al.’s (2012) values do not directly address the variables of health, happiness, self-
esteem, longevity, or intelligence.
The remaining nine attributes measured ideals for society: friendliness (0 = absolutely
no friendliness, 100 = absolute friendliness in all things), morality (0 = absolutely no
morality, 100 = absolute morality in all things), equality of opportunity (0 = absolutely no
equality, 100 = absolute equality), ambition (0 = absolutely no ambition, 100 = absolute
ambition in all things), crime levels (0 = widespread crime in society, 100 = absolutely no
crime in society), freedom in society (0 = absolutely no freedom, 100 = absolute freedom),
creativity (0 = absolutely no creativity, 100 = absolute creativity in all things), technological
advance (0 = no technological advances, 100 = cutting-edge technological advances in all
things), and national security (0 = absolutely no national security, 100 = absolute national
security). In each case the wording of the items specified participants’ own nation (e.g.,
Australian participants were asked “If you could choose the level of morality in Australian
society, what level would you choose?”). All the measures of ideals were randomized.
Five demographic variables were included as control variables. First, participants
were asked to provide their “age, in years”. Participants were then asked to record their

9
gender (note that five participants who responded “other” were excluded from analyses
including gender). Income was measured in terms of perceived household income relative to
the average. Participants were given the average household income of their country, and
asked to rate where they perceived their household income to lie with respect to the average
(1 = much lower than the average national income, 5 = much higher than the average national
income). To measure education we provided eight options, and coded the responses such that
high scores reflect higher education levels (1 = did not finish high school or secondary
school; 2 = high school or secondary school; 3 = vocational, technical or trade qualification;
4 = Bachelor’s degree; 5 = Bachelors degree; 6 = Masters degree; 7 = professional degree; 8
= Doctoral degree). Finally we measured political ideology by asking people to rate how
liberal or conservative they are (1 = very liberal, 9 = very conservative).2
Results
Descriptive analyses. There tended to be relatively high correlations among the
measures of self-ideals, and relatively high correlations among the measures of societal
ideals. Accordingly, we combined these items into scales of self-ideals (α = .79; αs ranged
from .68 to .85 across nations) and societal ideals (α = .82; αs ranged from .73 to .91 across
nations). Data for each country are summarized in the left side of Table 1.
Generally, participants’ self-ideals clustered around 70-80% of the way between total
presence and total absence of each of the positive qualities. Only a minority of people
followed the maximization principle (in the sense of aspiring to 100% of an attribute), but
there were substantial differences depending on the attribute. More than one third of
participants maximized on health whereas less than 1 in 10 maximized on happiness.
In terms of intelligence, the mean ideal IQ score was distorted by the fact that a small
group of participants recorded very high ideal IQ scores (> 1000) creating positive skew. To
adjust for this, we placed an artificial ceiling on scores that corresponded to the highest IQ

10
score ever recorded: 228. After winsorizing the 0.3% of participant responses greater than
228, the mean IQ score was 122.52 (SD = 25.23).
Because longevity scores could be infinitely high (people could write “forever”) the
median provides the only interpretable index of central tendency. In the absence of a promise
of eternal youth, the median score on longevity was 90 (only modestly higher than the current
average life expectancy of the respective nations). When participants were asked to imagine
that they could take a magic pill guaranteeing eternal youth, the median score was higher
(median = 120). Even here, however, only 29.3% of participants indicated they would like to
live “forever”, and the median life span was only about 40 years greater than the average
current life expectancy of the nine nations.

11
Table 1. Summary data across nations for each study.
Study 1 (9 nations) Study 2 (27 nations)
n Ideals
self
Ideals
society
IQ
Life
Life +
youth
n Ideals
self
Ideals
society
IQ
Life
Life +
youth
Argentina 222 79.85 69.00 125.13 90 150
Australia 281 79.31 76.54 124.38 90 150 230 79.57 76.92 131.45 90 150
Brazil 214 82.33 71.93 128.80 90 160
Canada 199 80.00 78.97 132.80 95 150
Chile 276 79.54 69.21 122.99 85 127.50 233 74.71 62.29 127.23 86.5 150
China 238 76.70 69.60 118.38 90 199.50 182 78.66 75.06 124.06 90 120
France 197 74.72 70.05 124.12 90 150
Germany 209 72.17 70.46 121.37 90 150
Hong Kong 218 72.87 68.71 118.97 80 99 181 69.58 65.94 123.04 85 100
India 227 75.09 72.63 114.11 75 100 166 75.55 73.08 120.36 80 100
Indonesia 185 81.72 76.30 128.93 80 100
Ireland 184 77.28 76.31 129.45 90 150
Japan 259 73.06 73.19 122.58 85 100 215 71.08 71.15 124.12 85 100
Mexico 207 84.36 71.86 129.89 85 110
New Zealand 202 81.21 78.87 130.02 90 150
Peru 286 79.33 66.95 128.52 85 150 245 74.93 64.46 128.49 88.5 500
Philippines 228 81.92 81.79 123.92 85 200
Poland 200 72.02 64.12 123.79 86 120
Portugal 231 80.84 75.33 124.79 95 200
Russia 333 76.14 69.27 120.22 90 150 207 72.39 68.27 122.00 90 150
Singapore 196 72.72 73.00 130.07 80 100
South Africa 233 76.02 68.00 128.79 90 200
South Korea 214 64.39 61.27 132.38 88 100
Spain 211 81.27 73.03 130.11 90 500
Sweden 201 73.62 69.49 126.17 95 110
UK 222 80.25 77.87 131.81 90 155
USA 274 80.95 78.25 130.62 95 150 236 81.44 79.03 133.55 95 250
Note. Lifespan scores are medians.

Tests of cultural differences. To test our focal prediction, we compared participants
from the four holistic regions – China, Hong Kong, Japan, and India - with those from the
five non-holistic regions. In doing so, we used pairwise deletion, and controlled for age,
income, education, political ideology, and sex (coded -0.5 = male, 0.5 = female). Results are
summarized in Figures 1 and 2.
In line with expectations, on ratings of ideal levels for the self, members of non-
holistic cultures (M = 79.95, SE = 0.42) maximized more than members of holistic cultures
(M = 74.39, SE = 0.49), F(1,1971) = 71.00, p < .001, ηp2 = .04. To ensure that the effects of
culture on self-ideals were not carried disproportionately by one item, we repeated the
analyses for each of the self-ideal items individually.
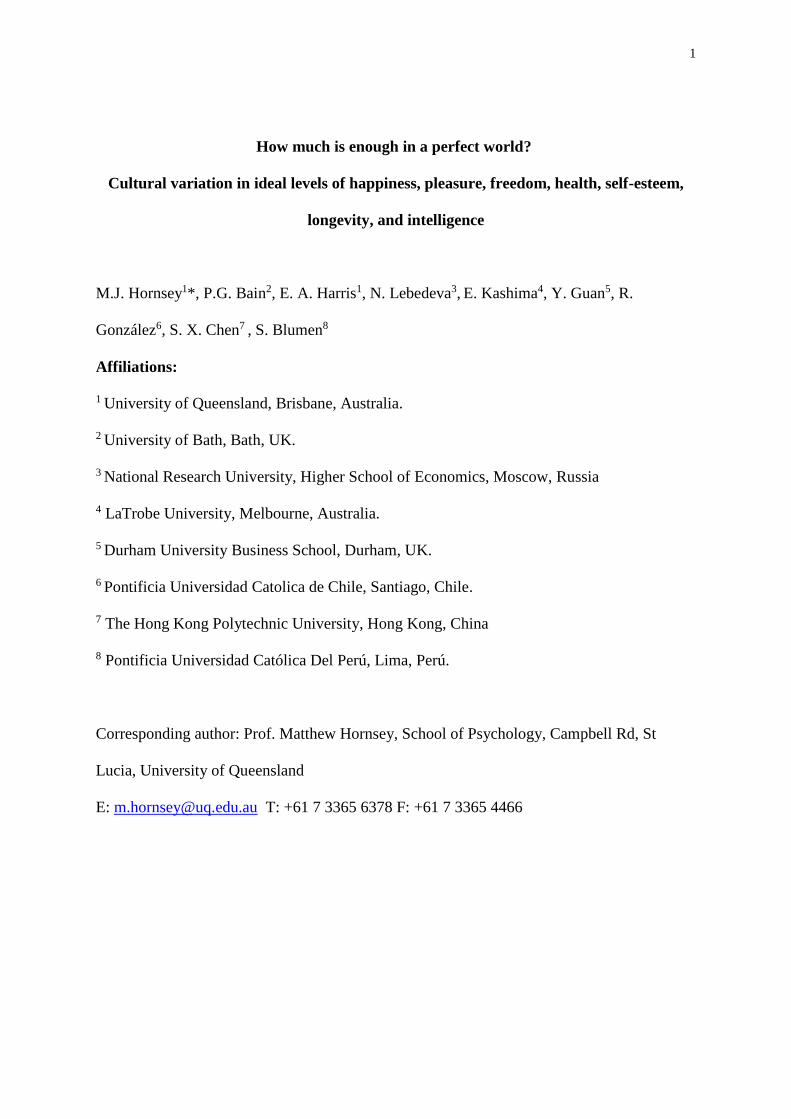
Figure 1. Study 1: Mean ratings of the closed-response items relating to ideals for the self.
100 represents the maximum amount of the attribute. Scores are adjusted means after
controlling for demographics. Error bars represent standard error of the mean.
50
60
70
80
90
Happiness Pleasure Self−esteem Freedom Health
idea
l le
vel
Holistic
Non−holistic

13
Figure 2. Study 1: Ratings of the open-ended items relating to ideals for the self. IQ scores
are adjusted means after controlling for demographics. Error bars on IQ represent standard
error of the mean. Longevity scores are medians.
The tendency for members of non-holistic cultures to maximize more than members of
holistic cultures emerged on all five items: happiness, F(1,1968) = 26.37, p < .001, ηp2 = .01,
pleasure, F(1,1968) = 20.42, p < .001, ηp2 = .01, freedom, F(1,1968) = 38.05, p < .001, ηp
2 =
.02, self-esteem, F(1,1970) = 66.87, p < .001, ηp2 = .03, and health, F(1,1969) = 45.43, p <
.001, ηp2 = .02. Members of non-holistic cultures (M = 126.68, SE = 0.74) also reported a
higher ideal IQ score than did members of holistic cultures (M = 118.32, SE = 0.86),
F(1,1971) = 51.77, p < .001, ηp2 = .03.
In contrast to the consistent relationship between culture and self-ideals, no reliable
effects emerged on societal ideals: members of non-holistic cultures (M = 72.62, SE = 0.47)
reported a higher ideal score than members of holistic cultures (M = 71.24, SE = 0.55), but
only marginally so, F(1,1970) = 3.51, p = .061, ηp2 = .00.
80
100
120
140
160
IQ Longevity(no eternal
youth)
Longevity(presuming
eternalyouth)
idea
l le
vel
Holistic
Non−holistic

14
Because participants in the holistic and non-holistic categories were also nested
within nations, we re-analyzed the data using multilevel modelling. The multilevel model
estimated the fixed effects of holistic (coded -0.5) versus non-holistic cultures (coded 0.5)
after accounting for the random effect of country. We also controlled for our five
demographic covariates. For each analysis, p-values were calculated using the “lmerTest”
package in R, which runs the lme4 models through a Satterthwaite’s approximation test to
calculate degrees of freedom. Because all continuous variables were standardized, and the
dichotomous independent variables was contrast coded, the effects are reported as Betas
below (identical to Cohen’s d). Sample sizes ranged from 1975 to 1978 after excluding
participants with missing values.
Results confirmed that members of non-holistic cultures had higher levels of self-
ideals than did members of holistic cultures (ß = .38, SE = .05, p < .001). To test the stability
of the effects of self-ideals, we repeated the analysis five times, with each individual item
used as a criterion. The significant effects emerged on all five dimensions: happiness,
pleasure, health, self-esteem, and freedom (ßs ranged from .20 to .36, all ps < .042). A
significant effect of culture also emerged on IQ (ß = .35, SE = .11, p = .010). In contrast,
there was no effect of culture on societal ideals, either when analyzed as a scale (ß = .09, SE
= .15, p = .582), or when the nine individual items were analyzed separately (all ps > .125).
For the longevity scores, parametric tests are not possible due to some participants
recording an infinite score (“forever”). But comparison of the medians indicates a clear trend
in line with predictions. In the absence of a guarantee of eternal youth, the median lifespan
score of the members of non-holistic cultures (90.0) was five years longer than that of holistic
cultures (85.0). In the event of a magic pill guaranteeing eternal youth, the divergence was
even greater: the median lifespan score of non-holistic cultures (150.0) was half a century
longer than that of holistic cultures (100.0). Mann-Whitney U-tests confirmed that the

15
distributions of the holistic and non-holistic samples were significantly different for both
measures of lifespan (ps < .001).
The role of demographics other than culture. As discussed above, we included age,
sex, income, political ideology, and education in our multilevel tests of culture. Although
these demographics were included as control variables, it is interesting in its own right to
examine whether there are differences in ideals across these demographic boundaries. For the
record, women (ß = .28, SE = .04, p < .001), older participants (ß = .15, SE = .02, p < .001),
and richer participants (ß = .12, SE = .02, p < .001) had more maximalist self-ideals, but there
was no relationship with education (ß = .01, SE = .02, p = .583) or political ideology (ß = .02,
SE = .02, p = .310). In contrast, ideal IQs were related to education (ß = .08, SE = .02, p <
.001), political orientation, (ß = -.09, SE = .02, p < .001), and perceived household income (ß
= .07, SE = .02, p = .004).
We then ran analyses to test whether the demographic variables interacted with
culture to influence self-ideals. The only interaction effect to emerge was on income (ß = -
.13, SE = .05, p = .006): the difference between holistic and non-holistic cultures on self-
ideals was stronger for those who had relatively low perceived household incomes. The
interaction effects for the other four demographics were all non-significant (ps > .21). When
examining ideal IQ, we found no significant interactions (ps > .12).
Testing collectivism as an alternative cultural dimension. Our prediction is that
there is something specific to holistic cultures that leads to greater moderation relative to non-
holistic cultures. However, there is a degree of covariation between the cognitive dimension
of holism and the social-cultural dimension of collectivism, as demonstrated correlationally
and in terms of cross-over priming effects (Grossmann et al., 2016; Grossmann & Jowhari,
2018; Oyserman & Lee, 2008; Varnum, Grossmann, Kitayama, & Nisbett, 2010). This raises
the possibility that the effects are not driven by cultural differences in cognitive style per se,

16
but rather by socio-motivational processes (e.g., in collectivist cultures there may be greater
vigilance to others’ needs in the social environment, resulting in a more sensitive balance
between personal and interpersonal interests).
To test this possibility, we conducted the same multilevel analyses reported above, but
this time with collectivism scores used as a continuous predictor variable rather than holism
We did these analyses using Hoftede’s replications and extensions of his original cross-
cultural measurements (Hofstede, Hofstede, & Minkov, 2010) rather than GLOBE data,
partly because the GLOBE data does not sample from Peru and Chile. These analyses
showed that collectivism was not a significant predictor of the self-ideal scale (ß = .08, SE =
.06, p = .252) or any of its constituent items (all ps > .082). Neither was collectivism a
significant predictor of ideal IQ scores (ß = .10, SE = .07, p = .185). This indicates that self-
ideals are not well explained by interdependence or a greater emphasis on collectivist values.
A note on Russia. Although Russia does not meet our criteria for inclusion as a
holistic culture (it does not have a strong influence of Buddhism, Confucianism, Hinduism,
Jainism, or Taoism) previous studies have shown that Russians display more holistic
cognitive styles than Americans or Western Europeans (Grossmann & Varnum, 2011;
Varnum et al., 2010). Given this, we re-ran the analyses but this time with Russia included as
a holistic culture. The effects remained the same: holistic cultures reported more modest self-
ideals (ß = .36, SE = .06, p < .001) and more modest IQ scores (ß = .37, SE = .10, p = .005).
Median life-span scores remained identical to those reported above, and the relationship
between culture and societal ideals remained non-significant (ß = .12, SE = .15, p = .431).
STUDY 2
Study 2 replicated Study 1, but with a larger cross-section of cultures. In so doing we
included two nations – the Philippines and Indonesia - that are collectivist but not holistic. If

17
holism is the primary driver of our effects, we would expect that the Philippines and
Indonesia would report self-ideals that are as maximalist as the non-holistic nations.
Method
Sampling. We sampled 6874 participants from 27 nations across six continents
(50.3% women; Mage = 41.20 years). As in Study 1, participants were community members
recruited through the online data collection company Social Sampling International (SSI). In
addition to the data quality checks SSI uses to select high quality responders, we embedded a
screening question and attention check in our second study. Participants who did not report
living in the country being sampled were screened out (n = 442; 6.4% of the initial sample).
Second, participants who did not pass an attention check were excluded from analyses (“To
show that you are paying attention, please select 100 for this question”, n = 782 failed, 12.2%
of the screened sample). It should be noted, though, that the conclusions were the same
regardless of whether or not the inattentive participants were included. Our final sample
comprised 5,650 participants. Summary data for each country – after removing those who
failed the attention check – are included in the right side of Table 1.
We sampled from the same four holistic nations sampled in Study 1, as well as two
new nations considered holistic: South Korea and Singapore. Approximately three-quarters of
Singapore are ethnically Chinese, and the modern state of Singapore was closely guided by
Confucian ethics. South Korea is also heavily influenced by Confucianism: during the Tang
Dynasty, two of the three Kingdoms of Korea were considered tributary states of China, and
Confucian philosophies became embedded in Korean culture from this time.
We used the same non-holistic nations in Study 2 as we did in Study 1, but also added
several more: Argentina, Brazil, Canada, France, Germany, Indonesia, Ireland, Mexico, New
Zealand, Philippines, Poland, Portugal, South Africa, Spain, Sweden, and the UK. To provide
a more focused test of our hypotheses, this group includes two Asian nations – the

18
Philippines and Indonesia - that cannot be considered holistic according to our criteria (i.e.,
predominantly influenced by Buddhism, Confucianism, Hinduism, Jainism, or Taoism). The
Philippines is the only Christian nation in Asia, with approximately 94% of the nation self-
identifying as Christians (Philippine Statistics Authority, 2015). In contrast, Indonesia is a
predominantly Muslim nation (approximately 87% at the latest census, Badan Pusat Statistik,
2010). Confucianism was imported to Indonesia by Chinese merchants, but emerged as a
loose set of individual practices rather than as a consolidated philosophical practice (only
1.2% of Indonesians are ethnically Chinese).
Measures. The measures were presented in a randomized order, and were the same as
those used in Study 1, except education was measured using a 5-point scale (1 = less than
high school; 2 = high school; 3 = trade qualification; 4 = university degree; 5 = postgraduate
degree). As in Study 1, we excluded participants who reported their gender as ‘other’ (n = 7)
and coded male = -0.5 and female = 0.5. Again, closed-response items were combined into
scales of self-ideals (α = .82; αs ranged from .71 to .91 across nations) and societal ideals (α =
.85; αs ranged from .75 to .93 across nations). Questionnaires were translated and back-
translated by a professional translation company. Translations for the self-ideals and the
societal ideals are provided in the Supplementary Materials online.3
Results
Data were analyzed using the same strategy used in Study 1. As can be seen in Table
1, means approximated the same levels as found in Study 1, with ideals for the self mostly
clustering in the 70-80% range. Inspection of the means on self-ideals confirmed that
Philippines and Indonesia were outliers among the Asian nations, reporting the third and
fourth most maximalist self-ideals respectively of the 27 nations. This reinforces our
prediction that the most diagnostic cultural distinction is between holistic and non-holistic
societies, rather than between Asian and Non-Asian societies.

19
Consistent with predictions, members of non-holistic cultures (M = 78.18, SE = 0.24)
maximized more on their ideals for the self than did members of holistic cultures (M = 71.76,
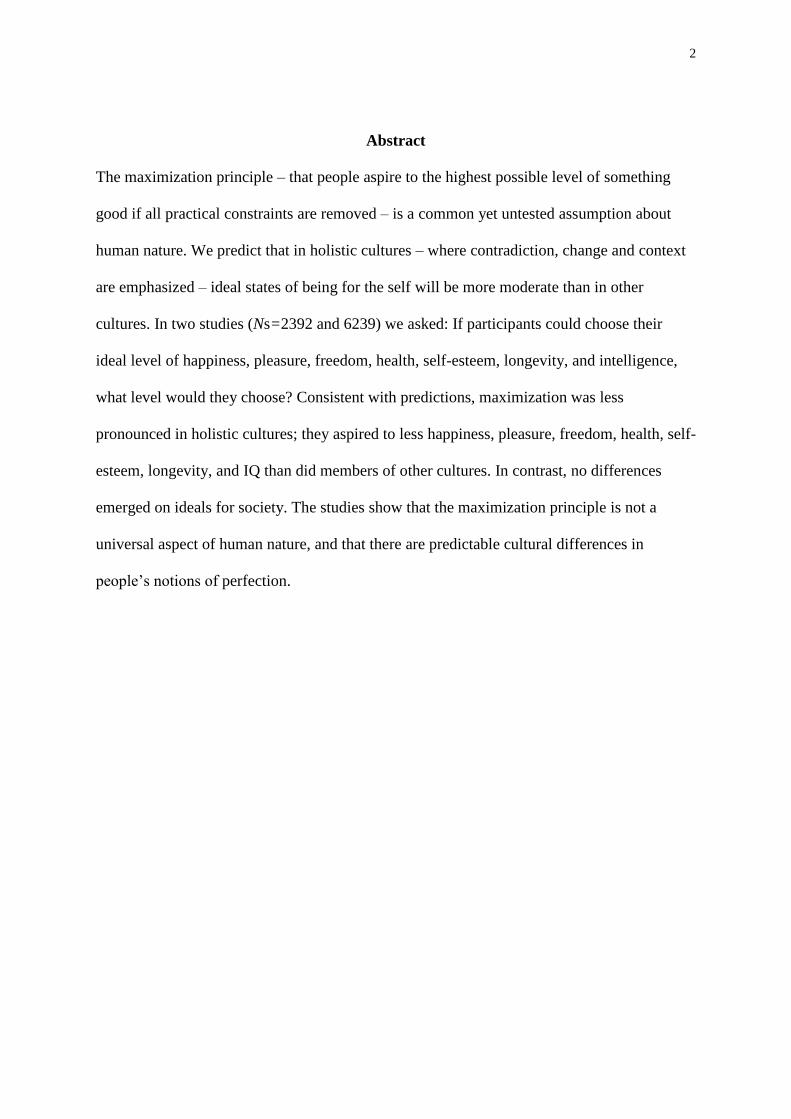
SE = 0.47), F(1,5129) = 145.79, p < .001, ηp2 = .03. Again, individual ANOVAs revealed
significant effects for each of the five dimensions that comprised the scale: happiness,
F(1,5128) = 94.90, p < .001, ηp2 = .02, pleasure, F(1,5126) = 79.32, p < .001, ηp
2 = .02,
freedom, F(1,5127) = 58.25, p < .001, ηp2 = .01, self-esteem, F(1,5126) = 90.08, p < .001, ηp
2
= .02, and health, F(1,5125) = 102.15, p < .001, ηp2 = .02 (see Figure 3). As in Study 1, we
winsorized IQ scores greater than 228 (this applied to 0.6% of the data). Members of non-
holistic cultures (M = 128.42, SE = 0.37) reported a higher ideal IQ score than did members
of holistic cultures (M = 125.24, SE = 0.74), F(1,5125) = 14.71, p < .001, ηp2 = .003, although
this effect was extremely weak (see Figure 4).
The above results were confirmed by multilevel models estimating the fixed effects of
holistic (coded -0.5) versus non-holistic cultures (coded 0.5) after accounting for the random
effect of country and controlling for the five demographic covariates (sample sizes ranged
from 5131 to 5135 after excluding participants with missing values). Results confirmed that
members of non-holistic cultures had more maximalist self-ideals than members of holistic
cultures (ß = .39, SE = .11, p = .002), and that the effect emerged on all five dimensions (all
ßs > .24, all ps < .021). A marginally significant effect of culture also emerged on IQ (ß =
.16, SE = .08, p = .057). However, the size of this effect was very small indeed; as such, it is
fair to say that the effects of culture on IQ were more pronounced in Study 1 than in Study 2,
and that overall the effects of culture on IQ was less consistent than it was for the other
dimensions.

20
Figure 3. Study 2: Mean ratings of the closed-response items relating to ideals for the self.
100 represents the maximum amount of the attribute. Scores are adjusted means after
controlling for demographics. Error bars represent standard error of the mean.
50
60
70
80
90
Happiness Pleasure Self−esteem Freedom Health
idea
l le
vel
Holistic
Non−holistic
80
100
120
140
160
IQ Longevity(no eternal
youth)
Longevity(presuming
eternalyouth)
idea
l le
vel
Holistic
Non−holistic

21
Figure 4. Study 2: Ratings of the open-ended items relating to ideals for the self. IQ scores
are adjusted means after controlling for demographics. Error bars on IQ represent standard
error of the mean. Longevity scores are medians.
Consistent with Study 1, no effect of culture emerged on ideals for society (ß = .15,
SE = .14, p = .284). Examination of the effects of culture on each individual item within the
societal ideals scale revealed significant results in just two of nine analyses: non-holistic
cultures had more maximalist ideals for society on the dimensions of freedom (ß = .25, SE =
.11, p = .028) and creativity (ß = .40, SE = .15, p = .015).
For the lifespan items, the median scores were identical to those found in Study 1: In
the absence of a guarantee of eternal youth, the median lifespan score of non-holistic cultures
(90.0) was five years longer than that of holistic cultures (85.0), a gap that widened
dramatically in the event of a magic pill guaranteeing eternal youth (non-holistic cultures
Mdn = 150; holistic cultures Mdn = 100; see Figure 4). As in Study 1, Mann-Whitney U-tests
confirmed that the distribution of the holistic and non-holistic samples were significantly
different for both measures of lifespan (ps < .001).
The role of demographics other than culture. As in Study 1, women (ß = .10, SE =
.03, p < .001), older participants (ß = .13, SE = .01, p < .001), and richer participants (ß = .10,
SE = .01, p < .001) had more maximalist self-ideals. There was no relationship with
education (ß = .02, SE = .01, p = .171) or political ideology (ß = .01, SE = .01, p = .345).
We then ran analyses to test whether the demographic variables interacted with
culture to influence self-ideals. As in Study 1, an interaction effect emerged on income (ß = -
.14, SE = .04, p < .001), such that the difference between holistic and non-holistic cultures on
the self-ideal scale was stronger for those who had relatively low perceived household
incomes. This time a significant interaction also emerged on education (ß = -.12, SE = .04, p

22
< .001), such that the difference between holistic and non-holistic cultures on the self-ideal
scale was stronger for those who had relatively low education. The interaction effects for the
other three demographics were non-significant (ps > .079). No interaction effects emerged on
ideal IQ scores either (ps > .081).
Testing collectivism as an alternative cultural dimension. As in Study 1, we re-ran
the multilevel analyses, but this time with collectivism scores as the predictor. Again,
collectivism did not emerge as a significant predictor of the self-ideal scale (ß = .06, SE = .06,
p = .315). We also tested the relationship between individualism and each item of the self-
ideals scale and found only a marginally significant relationship between individualism and
health (ß = .10, SE = .05, p = .053), with all remaining ps non-significant (ps > .13). Members
of collectivist countries did report more modest ideal IQ scores (ß = .08, SE = .03, p = .019)
but given that this was the only significant effect of collectivism across 12 analyses (spanning
two studies) we conclude that there is little evidence that collectivism provides a better
explanatory tool than holism in terms of accounting for self-ideals.
A note on Russia. As in Study 1, we re-ran the analyses but this time with Russia
included as a holistic culture. The effects remained unchanged: holistic cultures reported
more modest self-ideals (ß = .42, SE = .10, p < .001) and more modest IQ scores (ß = .19, SE
= .07, p = .014). Median life-span scores remained identical to those reported above, and the
relationship between culture and societal ideals remained non-significant (ß = .20, SE = .13, p
= .141).
General Discussion
We examined two questions: (1) how maximalist are people’s ideal ways of being?
and (2) are ideal ways of being influenced by culture? The first question is purely descriptive,
but also revealing. Data confirm that most people want to be happy, free, and healthy, and
they want to feel self-esteem and pleasure, but not to the exclusion of other more negative
23
experiences (on average they aspired to 70-80% of a good thing). Even when questions
placed no upper limit on the extent to which people could aspire - for intelligence and
longevity - it was illuminating that many people set a ceiling for themselves: about 30%
higher than the existing average on IQ, and 50% higher than the existing average on lifespan
(when presuming eternal youth).
Knowing the limits of the extent to which people see good things as ideal helps
explain behaviors that may otherwise seem paradoxical or self-defeating. For example, it is of
benefit to health professionals to know that there are limits to what people see as ideal levels
of health, happiness, and self-esteem, and for researchers of life extension technology it is
helpful to know that there are limits to how long people want to live. It should also be noted
that these moderation strategies might be functional: recent theorizing and data suggest that
many psychological variables that seem objectively positive can have ironic negative effects
on well-being when experienced in extremely high quantities (Grant & Schwartz, 2011).
We predicted that holistic cultures would report more modest self-ideals than non-
holistic cultures. Although the effects were small-to-medium in size, this prediction was
confirmed with high consistency. Previous studies have shown that Chinese value happiness
and excitement less than Westerners (specifically Americans; Sims et al., 2015; Tsai et al.,
2006; Uchida & Kitayama, 2009). The current data suggest that these effects may be part of a
broader phenomenon that encompasses a wide range of nations and dimensions, including the
desire for self-esteem, freedom, health, longevity, and intelligence.
Research shows that participants from collectivist nations tend to avoid extreme
endpoints when filling out scales (e.g., Chen, Lee, & Stevenson, 1995). However, there are
three pieces of evidence that speak against the notion that our data are an artefact of response
bias. First, our measures of longevity and IQ required participants to write in scores rather
than using scales. These scores are not susceptible to the response bias critique, and yet the

24
predicted effect emerged. Second, in Study 2 we included collectivist, Asian countries that
are not holistic (Philippines and Indonesia). If our data were reducible to a tendency for
Asians to gravitate toward the mid-point, we should see low scores in these countries.
Instead, respondents from these two countries reported relatively maximalist self-ideals.
Third, the effect of holism does not emerge on societal ideals, suggesting that there is not a
blanket tendency for holistic cultures to score closer to the mid-point.
It is well understood that cultural mechanisms are understood at the cultural level, and
so cannot be reliably tested by measuring individual differences in thinking and showing
mediation (e.g., Na et al., 2010; Schweder, 1973; Sims et al., 2015). However, we
acknowledge that we do not measure holism directly, and so cannot show definitively that
holistic ways of thinking are the active cultural ingredient driving our effects. Although we
found no evidence that collectivism/individualism was a better explanatory tool, systematic
disentangling of these cultural dimensions is a priority for future research.
Given the null results on societal ideals, we emphasize that effects of holism are likely
to be specific to intrapsychic, individual-level variables. It seems plausible that the “context”
element of holism – the sense of connectedness of all things, and a conception of self that is
fused with context – would channel the effects of change and contradiction in a way that
specifically promotes modesty and humility on self-related variables, but not at the collective
or relational level. Alternatively, it is possible that participants simply found the process of
recording hypothetical states of perfection for a collective more abstract and difficult than
defining perfection for themselves, creating more error variance. Future research is required
to identify the variables that best capture variance in people’s utopian beliefs about society,
or their ideal levels of socially-embedded variables such as harmony or social sensitivity.
In sum, many advertisements, proclamations, and scientific advances work from the
assumption that people aspire to as much as possible of a good thing (e.g., health, freedom,

25
happiness). Our studies show that this belief is typically less prevalent in more holistic
cultures where religious and other traditions extol the virtues of moderation. In highlighting
this, we hope to encourage a greater appreciation of the ways people differ in their notion of
perfection.

26
Endnotes
1. We use the word “maximization” differently from how it is used in the literature on
maximizing versus satisficing (e.g., Roets, Schwartz, & Guan, 2012; Schwartz et al.,
2002). In that literature, maximization refers to the desire to optimize pragmatic
choices (e.g., regarding which TV show to watch or which gift to buy) and is
compared with the “good-enough” strategy preferred by satisficers. In contrast, our
participants are asked hypothetical questions about abstract, ideal states of being.
2. Other items addressed two distinct research questions. One question related to
euthanasia. In addition to measures tapping end-of-life attitudes, this section
comprised measures of personality, religiosity, superstition, and well-being. The
second section comprised measures of SDO, entity beliefs, and attitudes toward
apologies, which have been published elsewhere. In both studies, participants also
recorded their ideal annual income in an open-ended format. The data proved
unreliable, however: some participants appeared to report weekly or monthly
incomes. Furthermore, there are intrinsic difficulties in comparing income across
multiple currencies and in countries with different standards of living. Thus, ideal
income data are not reported.
3. Also included were participants’ perceptions of control and their attitudes toward
mining. Because these measures were not relevant to their ideals, they are not reported
here. As in Study 1, ideals were measured at the beginning of the survey.

27
References
Aristotle. (1967). The ethics of Aristotle: The Nichomachean ethics (J. A. K. Thomson,
Trans.). London, UK: Penguin.
Badan Pusat Statistik (2010). Population by Region and Religion, Indonesia. Retrieved from:
https://sp2010.bps.go.id/index.php/site/tabel?tid=321&wid=0.
Chen, C., Lee, S-Y, & Stevenson, H. W. (1995). Response style and cross-cultural
comparisons of rating scales among East Asian and North American students.
Psychological Science, 6, 170-175.
Grant, A. M., & Schwartz, B. (2011). Too much of a good thing: The challenge and
opportunity of the inverted-U. Perspectives on Psychological Science, 6, 61-76.
Grossmann, I., Huynh, A. C., & Ellsworth, P. C. (2016). Emotional complexity: Clarifying
definitions and cultural correlates. Journal of Personality and Social Psychology, 111,
895-916.
Grossmann, I., & Jowhari, N. (2018). Cognition and the self: Attempt of an independent
close replication of the effects of self-construal priming on spatial memory recall.
Journal of Experimental Social Psychology, 74, 65-73.
Grossmann, I., Karasawa, M., Kan, C., & Kitayama, S. (2014). A cultural perspective on
emotional experiences across the life span. Emotion, 14(4), 679-692.
Grossmann, I., & Varnum, M. E. W. (2011). Social class, culture, and cognition. Social
Psychological and Personality Science, 2, 81-89.
Herrnstein, R.J. (1990). Rational choice theory: Necessary but not sufficient. American
Psychologist, 45, 356-367.
Higgins, E. T. (1987). Self-discrepancy: A theory relating self and affect. Psychological
Review, 94, 319-340.

28
Hofstede, G., Hofstede, G., & Minkov, M. (2010). Cultures and organizations: Software of
the mind. (3rd Ed.). NY: McGraw Hill.
Howard, G.S. (2000). Adapting human lifestyles for the 21st Century. American Psychologist
55, 509-515.
Kesebir, P., & Diener, E. (2008). In pursuit of happiness: Empirical answers to philosophical
questions. Perspectives on Psychological Science, 3, 117-125.
Larsen, J. T., & McKibban, A. R. (2008). Is happiness having what you want, wanting what
you have, or both? Psychological Science, 19, 371-377.
Leary, M.R., Tambor, E.S., Terdal, S.K., & Downs, D.L. (1995). Self-esteem as an
interpersonal monitor: The sociometer hypothesis. Journal of Personality and Social
Psychology, 68(3), 518-530.
Maslow, A.H. (1943). A theory of human motivation. Psychological Review, 50, 370-396.
Miyamoto, Y., Nisbett, R.E., & Masuda, T. (2006). Culture and the physical environment:
Holistic versus analytic perceptual affordances. Psychological Science, 17, 113-119.
Miyamoto, Y., Uchida, Y., & Ellsworth, P.C. (2010). Culture and mixed emotions: Co-
occurrence of positive and negative emotions in Japan and the United
States. Emotion, 10(3), 404-415.
Na, J., Grossmann, I., Varnum, M.E.W., Kitayama, S., Gonzalez, R., & Nisbett, R.E. (2010).
Cultural differences are not always reducible to individual differences. Proceedings of
the National Academy of Sciences, 107, 6192-6197.
Nisbett, R. R., & Miyamoto, Y. (2005). The influence of culture: Holistic versus analytic
perception. Trends in Cognitive Sciences, 9, 467-473.
Nisbett, R. E., Peng, K., Choi, I., & Norenzayan, A. (2001). Culture and systems of thought:
Holistic versus analytic cognition. Psychological Review, 108, 291–310.
doi:10.1037/0033-295X.108.2.291

29
Oyserman, D., & Lee, S. W. S. (2008). Does culture influence how and what we think?
Effects of priming individualism and collectivism. Psychological Bulletin, 134, 311-
342.
Peng, K., & Nisbett, R.E. (1999). Culture, dialectics, and reasoning about
contradiction. American Psychologist, 54(9), 741-754.
Philippine Statistics Authority (2015). 2015 Philippine Statistical Yearbook. Quezon City,
Philippines: Philippine Statistics Authority.
Roets, A., Schwartz, B., & Guan, Y. (2012). The tyranny of choice: A cross-cultural
investigation of maximizing-satisficing effects on well-being. Judgment and Decision
Making, 7, 689-704.
Ryan, R. M. & Deci, E. L. (2017). Self-determination theory: Basic psychological needs in
motivation, development, and wellness. New York: Guilford Publishing.
Schwartz, B., Ward, A., Monterosso, J., Lyubomosrky, S., White, K., & Lehman, D. R.
(2002). Maximizing versus satisficing: Happiness is a matter of choice. Journal of
Personality and Social Psychology, 83, 1178-1197.
Schwartz, S. H., Cieciuch, J., Vecchione, M., Davidov, E., Fischer, R., Beierlein, C. … &
Konty, M. (2012). Refining the theory of basic individual values. Journal of
Personality and Social Psychology, 103, 663-688.
Schweder, R.A. (1973). The between and within of cross-cultural research. Ethos, 1, 531-545.
Scollon, C.N., Diener, E., Oishi, S., & Biswas-Diener, R. (2005). An experience sampling
and cross-cultural investigation of the relation between pleasant and unpleasant
affect. Cognition & Emotion, 19(1), 27-52.
Sims, T., Tsai, J.L., Jiang, D., Wang, Y., Fung, H.H., & Zhang, X. (2015). Wanting to
maximize the positive and minimize the negative: Implications for mixed affective

30
experience in American and Chinese contexts. Journal of Personality and Social
Psychology, 109(2), 292-315.
Solomon, S., Greenberg, J. & Pyszczynski, T. (1991). A terror management theory of social
behavior: The psychological functions of esteem and cultural worldviews. Advances
in Experimental Social Psychology, 24, 93–159.
Spencer-Rodgers, J., Williams, M. J., & Peng, K. (2010). Cultural differences in expectations
of change and tolerance for contradiction: A decade of empirical research.
Personality and Social Psychology Review, 14, 296-312.
Tsai, J.L., Knutson, B., & Fung, H.H. (2006). Cultural variation in affect valuation. Journal
of Personality and Social Psychology, 90, 288-307.
Tsai, J.L., Miao, F.F., Seppala, E., Fung, H.H., & Yeung, D.Y. (2007). Influence and
adjustment goals: Sources of cultural differences in ideal affect. Journal of
Personality and Social Psychology, 92, 1102-1117.
Uchida, Y., & Kitayama, S. (2009). Happiness and unhappiness in east and west: Themes
and variations. Emotion, 9(4), 441-456.
Varnum, M. E. W., Grossmann, I., Kitayama, S., & Nisbett, R. E. (2010). The origin of
cultural differences in cognition: Evidence for the social orientation hypothesis.
Current Directions in Psychological Science, 19, 9-13.

31
Author contributions
Hornsey and Bain developed the study concept and contributed to the study design.
Translation and data collection were performed by Harris, Lebedeva, Kashima, Guan,
González, Chen, and Blumen. Data analyses were conducted by Hornsey, Bain, and Harris.
Hornsey drafted the manuscript, and all authors contributed to revisions.
Acknowledgements
We thank Angel Gomez, Miguel Fonseca, and Yoshihisa Kashima for feedback on earlier
drafts. Chilean data collection was supported by Centre for Social Conflict and Cohesion
Studies (FONDAP15130009) and Center for Intercultural and Indigenous Research
(FONDAP15110006). Russian data were supported by a subsidy granted by the Government
of the Russian Federation for implementation of the Global Competitiveness Program.