Durham E-Theses Studies of nuclear reactions by micro-gas ...
199
• • •
Transcript of Durham E-Theses Studies of nuclear reactions by micro-gas ...

Durham E-Theses
Studies of nuclear reactions by micro-gas analytical
methods
Byrne, Anthony Robert
How to cite:
Byrne, Anthony Robert (1966) Studies of nuclear reactions by micro-gas analytical methods, Durhamtheses, Durham University. Available at Durham E-Theses Online: http://etheses.dur.ac.uk/8851/
Use policy
The full-text may be used and/or reproduced, and given to third parties in any format or medium, without prior permission orcharge, for personal research or study, educational, or not-for-pro�t purposes provided that:
• a full bibliographic reference is made to the original source
• a link is made to the metadata record in Durham E-Theses
• the full-text is not changed in any way
The full-text must not be sold in any format or medium without the formal permission of the copyright holders.
Please consult the full Durham E-Theses policy for further details.
Academic Support O�ce, Durham University, University O�ce, Old Elvet, Durham DH1 3HPe-mail: [email protected] Tel: +44 0191 334 6107
http://etheses.dur.ac.uk
STUDIES OF NUCLEAR REACTIONS BY
MICRO-GAS ANALYTICAL METHODS
by
ANTHONY ROBERT BYRNE. B, Sc.
Hatfield College
A Thesis presented in candidature of the
Degree of Doctor of Philosphy under the supervision
ofG.R, Martin, B.Sc., F.R.I.C.
This research was performed during the
period September 1961 to December 1964 at the
Londonderry Laboratory for Radiochemistry in the
University of Durham.
July. 1966 Chemistry Dept. ,
University of Durham

ABSTRACT
The development of an apparatus for the measurement of
amounts of helium in the range 10-S to 10·8 cc is described. Studies
were made of the previously unmeasured average fission neutron . • 56 53
cross section for the reactlon Fe (n, a.)Cr and a value of 0. 39 mb.
obtained from irradiations in B. E. P. 0. at Harwell and D. F. R. at
Dounreay. The nuclear reactions Fe54
(n, p).Mn54
and Fe54
(n, CL)Cr51
were also studied and values of the average cross section measured.
The absolute fission yields of Mo99 and Ba140
in the thermal
neutron fission of natural uranium were determined using helium
analysis of an irradiated uranium solution containing boric acid to
obtain the number of fission events. The chemical separation of
the nuclides and the counting and standardization procedures are 99 140
fully described. The results. of 5. 94 and 5. 87% for Mo and Ba ,
respectively. and the errors involved)are discussed in the light of
previous values.
The third section of the work was concerned with the
calibrat5.on of photoneutron sources by destructive analysis of the
beryllium cylinders for helium, also produced in the photo-reaction.
A discussion of neutron source calibrations is included. The design,
and experiments carried out with an apparatus which included a
silver-palladium leak for hydrogen are described. Unfortunately
this work was not completed. but suggestions are included for its
conclusion.
<. ·: · ... ··~::~/~. r~ ' ... , ; I < \ . '-~
. :'

ACKNOWLEDGEMENTS
I would like to acknowledge my debt to the sound
advice and ready encouragement given during this research by
Professor G. R. Martin, formerly Reader in Radiochemistry
in the University of Durham. Also to Mr. J.D. Hemingway for
his friendly help and companionship.
I would also like to thank the (then) Department of
Scientific and Industrial Research for the award of a Research
Student ship.

i.
INDEX OF CONTENTS
Page SECT~ON 1.
INTRODUCTION. 1.
1.1. General 1.
1. 2·. Helium measurement 2.
1. 3. The (n, a.) reaction in iron 2.
1.4. Yields of the fission products Mo 99 and Ba 140 3.
1.5. Calibration of photoneutron sources 3.
SECTION 2.
THE APPAltA T.US s. 2.1. Historical 5.
2.2. General de scription 5.
2.3. The block diagram 6.
2.4. The oxygen re aervoir 9.
2.5. The dissolution vessel 12.
2.6. The circulating syste_m 13.
2.7. The fractionation column 18.
2. 7 .1. General description 18. 2. 7. 2. Operation of the column 20. 2.7.3. Theory and behaviour of the column 21. 2. 7 .4 .. Modifications made to the column 27. 2.7.5. Percentage recovery of heUum 29. 2.7.6. Air analyses 30. 2.7.7. The air apparatus 33. 2.7.8. Results of air analyse a 34.
2.8. The Me Leod gauge and pipetting system 35.
2.9. The eompre a sion bulb 40.

2.10. The Pirani gauges
2.10.1. Design and theory 2. 1 0. 2. Construction of the gauges 2. 1 0. 3. The Pi rani gauge circuit 2.10. 4. Use of the gauge
2.11. Some notes on the apparatus
2.12. Errors
SEC TIOI'!J 3.
AVERAGE CROSS SECTIONS FOR THE FISSION . 56 53 54 51
NEUTRON REACTIONS Ee (n, a.)Cr , Fe (n, a.)Cr
Page
42.
42. 44. 45. 48.
51.
52.
AND Fe54
(n, p)Mn54 54.
3.1.
3. 2.
3.3.
3.4.
3. 5.
3.6.
3.7.
3.8.
Introduction
Average cross sections
Threshold reactions in iron and simple theory
3. 3. 1 . Integration of the excitation function {A)
Measurement of helium in the irradiated iron
3.4.1. 3.4.2.
The dis solution flask Experimental
Neutron flux measurements 56 53
The reaction Fe (n, a.)Cr
3. 6. 1 • Irradiations and helium results 3. 6. 2. Conclusions
The Fe54
(n, a.)Cr51
reaction
3.7.1. 3. 7. 2. 3.7.3.
Chemical procedure Results Conclusions
The Fe54
(n, p)Mn.54
reaction
3.8.1. 3.8.2. 3.8.3.
(i) By subtractive y- spectrometry {ii) By chemical separation of manganese Results and conclusions
54.
55.
57.
62.
66.
66. 68.
69.
70.
70. 75.
78.
78. 79. 81.
82.
82. 84. 85.

3 .·9.
4.1.
4.Z.
4. 3.
4.4.
4.5.
4.6.
4. 7.
4.8.
Integration of published excitation functions (B)
3.9.1. Fe54
(n,p)Mn54
3. 9. z. Fe54(n, o.)Cr51
SECTION 4.
ABSOLUTE FISSION YIELDS OF Mo99 AND Ba140 IN
THE THERMAL NEUTRON INDUCED FISSION OF
NATURAL URANIUM
Introduction
4.1. 1. The present work: Mo 99 and Ba 140
The method
4. Z. 1. Discussion of potential errors
The filling apparatus
The analysing vessel
Helium contents of the capsules
The nuclear properties of Mo99 and Ba140
Radiochemical separation procedures
Counting
4.8.1. 4.0.2. 4.8.3.
4.8.4. 4.8.5.
L!quid counting Preparation of 41T films and their counting Preparation of carrier-free Bal40 and Mo 99 solutions for absolute standardizations. Bunney plots and liquid counter efficiencies Determination of the paralysis time of the liquid counter
iii,
Page
86.
86. 88.
90.
90.
94.
94.
96.
97.
100.
!OZ.
103.
105.
108.
108. 108.
109. 114.
118.
4. 9. Chemical yields in the fission product separations lZO.
4.10. Estimation of uranium and boron 1Z3.

4. 11. Calculation of fission yields
5.1.
5.2..
5.3.
5.4.
5.5.
5. 6.
5.7.
5.a. 5.9.
4.11. 1. Values of parameters assumed 4.11. 2.. Concentration of uranium and boron in
the irradiated solution 4.11. 3. Calculation of fission yields 4.11.4. Results
SECTION 5.
ABSOLUTE STANDARDIZATION OF
PHOTONEUTRONSOURCES
Introduction
5.1.1. 5.1.2. 5.1.3.
General Neutron sources in general Neutron source calibration
Photoneutron sources and the helium method
Description of the sources
Method of measurement
The diffusion apparatus
The dis solution flask
Operation of the diffusion and dissolution apparatus
Experiments and results
Summary and suggestions
REFERENCES
iv.
Page
12.3.
12.3.
12.4. 12.5. 12.6.
130.
130.
130. 131. 132..
135.
139.
140.
143.
145~
147.
148.
152..
154.

v.
INDEX OF FIGURES
Page
FIGURE 1. Schematic block diagram of the apparatus 7.
FIGURE 2. Apparatus for production of pure, 10. helium-free oxygen
FIGURE 3. The circulating system 14.
FIGURE 4. The fractionating column 19.
FIGURE 5. Fractionation curves for helium and neon 25.
FIGURE 6. Fractionation curve for an air sample 26.
FIGURE 7. The air sampling apparatus 32..
FIGURE 8. The gas storage bulbs, the McLeod gauge 37. and gas pipetting system
FIGURE 9. The compression bulb, Toepler pump and 41. the Pirani gauges
FIGURE 10. The Pir.ani gauge 43.
FIGURE 11. The Pirani gauge circuit diagram 47.
FIGURE 12. (a) The penetrability function and the 59. effective energy, Eeff
(b) The variation of (Eeff- E'l() with atomic 59. number Z, for {n, p) and n, a.) reactions
FIGURE 13. The variation of the average cross section, 61. (normalized to a standard nucleus of atomic mass of 25 ), for (n, a.) reactions, with Eeff
FIGURE 14. The excitation function for the Fe56 (n, a.) 63. reaction (Ref. 116)
FIGURE 15. The sample dissolution vessel 67.
FIGURE 16. 59 54 Gamma spectra of Fe and Mn by pulse 83. . height analysea
FIGURE 17. (a) Excitation function for the reaction 87. Fe54(n, p)Mn54, from Ref. (134)
(b) Excitation function for the reaction Fe54(n, a.)Cr51, from Ref. (124)
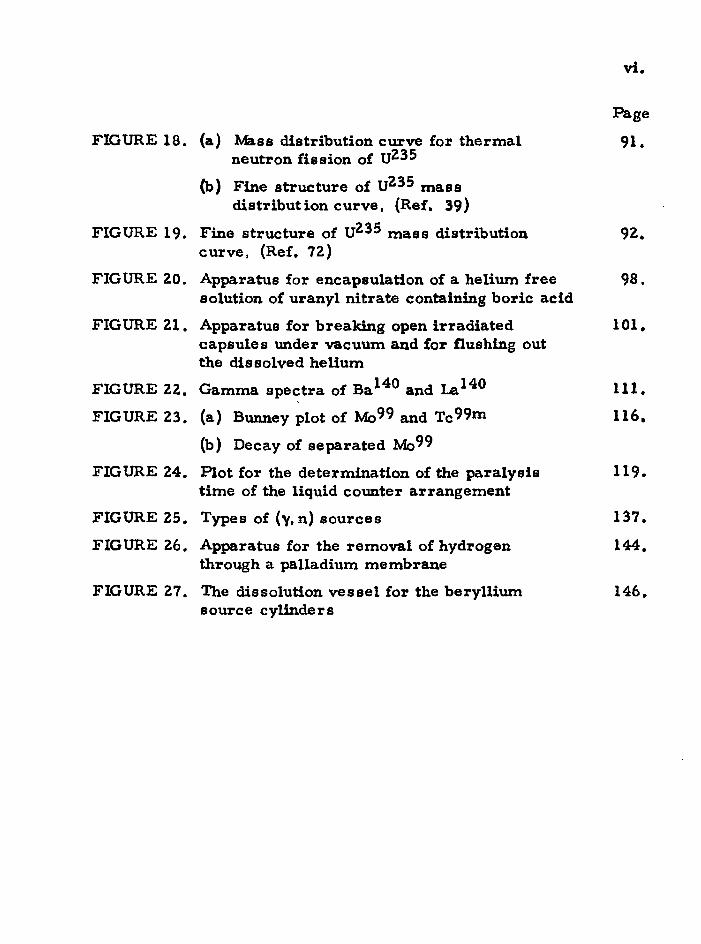
FIGURE 18. (a) Mass distribution curve for thermal neutron fission of uZ35
(b) Fine structure of uZ35 mass distribution curve, (Ref. 39)
vi.
Page
91.
FIGURE 19. Fine structure of uZ35 mass distribution 9Z. curve, (Ref. 7Z)
FIGURE ZO. Apparatus for encapsulation of a helium free 98. solution of uranyl nitrate containing boric acid
FIGURE Zl. Apparatus for breaking open irradiated 101. capsules under vacuum and for flushing out the dissolved helium
FIGURE ZZ. Gamma spectra of Ba140 and La140 111.
FIGURE Z3. (a) Bunney plot of Mo99 and Tc99m 116.
(b) Decay of separated Mo 99
FIGURE Z4. Plot for the determination of the paralysis 119. time of the liquid counter arrangement
FIGURE ZS. Types of (y, n) sources 137.
FIGURE Z6. Apparatus for the removal of hydrogen 144. through a palladium membrane
FIGURE Z7. The dissolution vessel for the beryllium 146. source cylinders

1.
SECTION 1.
INTRODUCTION
1 .1. General
This research was concerned with the application of a
micro-analytical technique for measuring helium gas to three nuclear
problems. The part played by the helium analysis differed in each
study. In one of these studies, that of the magnitude of the average
fission neutron cross section for (n, a) reactions in iron, the helium
measured was the consequence of, and of direct interest to, the
reaction. In the second problem, that of photo-neutron production
in beryllium sources, the helium was produced as an associated
product of the reaction under study. In the third, that of the absolute.
yields ~f Mo 99 and ~a 140 in thermal neutron induced fission of
natural uranium, the helium analysis served as a tool for the
measurement of one of the parameters required for the calculation.
This was the number of fissions occurring in the sample. The
helium measurement was the only link between these otherwise
self-contained problems. To have attempted to write a chapter
introducing the reader to the fundamentals and facets of these three
distinct problems would have produced a fragmentary and chaotic
effect. Hence this 'Introduction' is not so much an introduction to
the problems as a summary of the work. Instead, each of the three
problems is prefaced with its own relevant introduction.

2.
1 . 2.. Helium measurement
The study of inert gases in the atmosphere stretches
back to the observation, in 1785, of Cavendish that about one part
in 12.0 of the air refused to react on repeated sparking with oxygen.
(This is remarkably close to the figure of 0. 941o of argon in air).
The development of apparatus for precise measurements on inert
gases was excellently reviewed by Pa.neth(1 ) in 1953. The basic
apparatus has remained unchanged, except for minor technical
improvements, since the development by Gluecka.u£(2.) in the early
forties of the gas- solid chromatographic unit, termed the column, for
separating the inert gases from one another and from residual traces
of other gases. The last basic atmospheric research on the rare
gases was the accurate determination of the xenon and krypton content
of the air by Glueckau! a.nd Kitt in 1956 (3 ).
In this present research, the amounts of helium -5 -8
measured were in the range of 10 to 10 cc. at N. T.P., the
'blank' on the apparatus being normally about 1 to 2. x 10- 9 cc.
1. 3. The (n, a.) reaction in iron
The aim of the work was to measure the average cross
section for the reaction Fe56(n, a.)Cr53 with fission spectrum neutrons.
The meaning and importance of average fission cross
sections is discussed. The apparatus used and results for helium
production in natural iron and isotopically pure Fe 56
are presented.
In most of the experiments samples of about one gramme were
irradiated at Harwell in B. E. P. 0. Two samples were irradiated in
the fast reactor, D.F.R., at Dounreay which has a large fast nux with a negligible thermal neutron component. The results obtained
were iri good agreement with simple cross section theory.

3.
. Average fission cross sections for the reactions 54 51 54 54 .
Fe (n, <1)Cr and Fe (n, p)Mn were also measured on solutions
of the irradiated natural iron used for helium analyses. The results
are discussed in the light of previous values obtained by earlier
workers.
1. 4. Yields of the fission products Mo 99 and Ba 140
The aim was to measure as accurately as possible the . 99 140 absolute fission Yields of the nuclides Mo and Ba in the thermal
neutron induced fission. of natural uranium, that is, effectively in
tr35• The helium apparatus was used to measure the extent of the
B 10
{n, <1)Li 7
reaction occurring in boric acid irradiated homo
geneoualywith the uranyl nitrate solution. This, with a knowledge of
the cross sections for the boron reaction and fission, and together
with the proportions of boron and uranium, enabled the absolute
number of fissions to be calculated. The radiochemical, counting
and ca~ibration procedures are fully described. The yields were
determined to about :!' 3'?'o and the values are discussed in the light
of previous measurements.
1. 5. Calibration of photo-neutron sources
The aim of the work was to obtain an accurate (about
~ 1 '1o) absolute calibration of three of the six British beryllium (~. n)
sources by destructive analysis for helium. Measurement of the
helium accumulating by the reaction
Be 9 + y ~ n + ZHe 4
in a known time gives the neutron emission rate.
Various (<1, n) and (y, n) sources are discussed and methods
of standardization briefiy surveyed. The assumptions involved in the

4.
application of the helium analysis to the standardization of the (-y, n)
sources are discussed. Problems associated with micro-analysis
of helium in large quantities of beryllium, and the method chosen and
the apparatus constructed are described. Various tests and
experimental runs performed are considered. The sources were not
measured because of the failure of the palladium 'leak' apparatus
for hydrogen removal and lack of time. Suggestions for completion
of the work are included.

5.
SECTION Z.
THE APPARA T.US
2. 1 . Historical
Paneth (l) has reviewed the historical development of
techniques for the measurement of micro quantities of inert gases.
Early methods used manometric techniques or measurement of the
intensity of the characteristic spectral lines(4
); both relied on very
large sampling systems. The apparatus used in the work described
here was a development of that used by Gluecka.uf and Paneth(s),
which followed the introduction, by Gluecka.uf(z), of the fractionation
'column• for the separation of the inert gases from each other. This,
together with a specially sensitive Pirani, or bot wire gauge, enabled
them to show, from small bottled sampies, that the helium and neon
content of ground level air is a geophysical constant.
Later workers, using slightly modified apparatus, have
measured the helium and neon contents of meteorites for cosmological
studies (e.g. 6 • ?); the helium, neon and argon content of stratos
pheric air for evidence of gravitational separation(S, 9 ): and a whole
range of problems associated with alpha particle production in
nuclear reactions, ranging from spallation to studies of inert gas
dif'f . . 1
(e. g. 10, 11) us1on 1n meta s .
z. Z. Gen~ral descr;.ption
Before discussing the general scheme of the apparatus
and its component parts, mention must be made of the salient features
of the system. With the only exceptions of the mercury diffusion
pumps and the Pirani gauges, the entire apparatus was built from
soda (soft) glass. This was necessitated by the relatively high
permeability of pyrex glass to atmospheric helium.

6.
When taps were being fitted to the system, the key of the
tap was always checked to make sure that it was soda glass, as many
manufacturers use pyrex keys in soda barrels.
The Pirani gauges and galvanometer suspension were
sensitive to vibration, so the bench on which the apparatus was built
had deep foundations separate from those of the laboratory, and the
rotary oil pumps were mounted independently of the bench with
vibration damped vacuum leads to the apparatus.
The 'primary' pumping system consisted of a rotary oil
pump and two mercury diffusion pumps connected to the various parts
of the apparatus through a wide bore tube termed the manifold. 'I'hls
pumping system was duplicated at the other end of the manifold, so
that different sections of the apparatus could be pumped out separately
as the need arose. Another rotary oil pump was connected to the
•secondary' line, used for lowering mercury in the various Toepler
pumps, the pipetting system and mercury cut· offs.
All stopcocks were lubricated with Apiezon N, except
those which, being near to outgassing furnaces, required the higher
temperature grease T. Permanent and semi-permanent cones and
sockets were joined with Apiezon W wax.
2.3. The Block Diagram
The block diagram, Fig. 1, shows the main sections of the
apparatus. A full description of each section, and its uses, follows
under the separate section headings, but first a brief summary of
the complete procedure is given here.
The helium containing specimen, usually in the form of
a piece of metal of up to a few gramme s in weight, was dissolved in
an appropriate solvent in the dissolution vessel after this had been

7.
FIGURE 1.
Schematic block diagram of the apparatus

I'
-
AIR SAMPLE PURE 02 APPARATUS
'~ ' I Dl SSOLUTION
CIRCULATING VESSEL
FRACTIONATING
' '" or ) , SYSTEM , C 0 LUMN
(CAPSULE BREAKER
' . + ....
Pd TUBE ~- (H2 REMOVAL) STORAGE
"' PI RAN I
BULB ,
GAUGE ·
I

8.
outgassed and fiushed free from helium by the pure oxygen from the
oxygen reservoir. (A blank run had, of course, been performed
on the oxygen, before dissolution of the sample, to check the purity
of the oxygen'). The gases released by dissolution of the sample
were fiushed into the circulating system, where they were pumped
magnetically over a hot palladium catalyst and the great bulk of the
hydrogen {if any) removed as water. If very large amounts of
hydrogen were released by the dissolution (for example, from large
samples of beryllium) the bulk of this was first removed in the
palladium diffusion leak section. The great bulk of the condezasable
gases was then adsorbed onto the cooled charcoal in the circulating
system, and the helium, with a little oxygen, was transferred by
Toepler pump into the first unit of the column. This section
fractionated the helium from the neon (if any) and delivered the gas
into the storage or compression bulb. The mercury was then raised
in the bulb, compressing the pure helium into a small space above the
measuring Pirani gauge. The tap above the gauge was opened and
the galvanometer deflexion measured on a suitably sensitive scale.
Since the sensitivity of the gauge varied a little from
day to day due to slight variations in temperature and voltage, and an
ageing effect in the delicate filament, it was calibrated after each
me:'l.surement with a known amount of helium. (Typical day to day
variation was about l'?o ). This was measured out in the calibrated
volumes of the McLeod gauge, diluted by the gas pipetting system,
and finally allowed into the re-evacuated storage bulb. The
deflexion obtained from this accurately known amount enabled the
unknown helium sample to be determined by simple ratio.
The function of the air apparatus was to allow a known
volume of air, and hence helium, into the circulating system to make

9.
periodic checks on the correct functioning of the apparatus.
A full de scription of these various sections now follows.
2.. 4. The oxygen reservoir
The apparatus is shown in Fig. 2..
Oxygen has been used in this type of work for flushing
solutions and as a carrier gas for two main reasons~
{i) it removed hydrogen by combination in the
circulating system;
(ii) it was easily handled in the vacuum system by
condensation with liquid nitrogen and adsorbtion on
cooled charcoal.
The method of purifying oxygen from helium and neon was as follows.
With taps T1
, T2
and. T4
open and T3
closed, the apparatus was
rigourously evacuated (through T 1
) for several hours, the charcoal
bulb, which contained about 50 gms. of coconut charcoal, being baked
out at about 300°C. After the charcoal had cooled and a hard vacuum
obtained in the Toepler bulb attached to the pumping line, (i.e., a -6
pressure of better than 10 em. Hg. attained), T4
was closed and
oxygen gas from a cylinder admitted slowly into the system through
T3
. Before opening T3
, the rubber connections and glass arms
were thoroughly flushed out with oxygen via the mercury bubbler B,
which acted as a non- return valve to prevent air entering the system
should T3
be opened too rapidly. When the pressure of oxygen in the
system registered by the manometer had reached one atmosphere,
T 3
was shut. The small bulb adjacent to tap T 2
was then surrounded
with liquid nitrogen and the bulk of the oxygen condensed into it.
A vapour pressure of 16 or 17 ems. of oxygen was then registered on
the manometer. T 2
was closed and the charcoal bulb was also

FIGURE Z.
Apparatu~ for production of pure,
helium-free oxygen
1 o.

TO Dl SSOL U TION
VESSEL
- N 0 N -RE T U H'N
VALVE
02 STORAGE
BULB
4L
VACUUM
! "
CHARCOAL
LIQ. 02 IUL B
0 2 FROM
CYLINDER

11.
surrounded with liquid nitrogen. After a few minutes, the manometer
showed less than 1 mm. oxygen pressure and T1
was opened to 6e
pumps. By this means, an appreciable proportion of the least
adsorbable gases {helium and neon), together with a little oxyge!l,
were pumped away. After about 15 minutes, T1
was closed and the
liquid nitrogen removed from around the charcoal, T 2
was opened
and the liquid oxygen· allowed t6 evaporate.
When the oxygen had all desorbed, and the pressure '
reached one atmosphere again, the liquid oxygen bulb was again
cooled and the whole process of condensation, adsorbtion and pumping
repeated.
In practice, it was found that 10 to 12 cycles were
required to reduce the helium contamination to a leve~ such that an
oxygen sample of about 25 cc at N. T. P. contained around
1 x 10- 9 cc of helium. This was the quantity of oxygen normally used
in a run.
It appeared that the processes limiting the speed of
purification were:
(a) the volume of the dead space in the liquid oxygen bulb;
(b) the solubility of helium in liquid oxygen;
(c) the adsorbtion of helium on the large mass of charcoal;
(d) back diffusion of helium past the pumps when relatively
large quantities of oxygen were bemg pumped away.
By this method about four litre s (the volume of the storage bulb) of
substantially helium-free oxygen could be prepared at one or two
centimetres below atmospheric pressure. Initially, electrolytically
prepared cyclinder oxygen was used, as this should have less
atmospheric contaminants, but after this was exhausted, ordinary

lZ.
cylinder oxygen was used with equal success.
It was found that the oxygen slowly became recontaminated
with helium from the walls and by diffusion through the glass, but
two or three purification cycles per week were sufficient to maintain
the purity leve 1.
Oxygen being used for flushing was allowed out of the
system through T 4
and the bubbler. The latter prevented any back
diffusion of gas from the delivery tube into the pure supply.
Z, 5. The Dissolution Vessel
Three different types of dissolution vessel v:•ere used in
the course of the work. Since their design and operation are
integrally connected with ·the type of investigation, they are fully
described below in the relevant chapters,
{a) A small dissolution vessel which contained about
lOOcc of solvent, used for samples of iron up to about
a gramme. This is described below in Section 3 on
cross section measurements.
(b) A vessel of fundamentally the same design as in (a),
but capable of holding 1 litre of reagent. This was
used for runs on large quantities of beryllium,
circa 6 gms. In conjunction with this, was the hydrogen
removing palladium diffusion apparatus. Both of these
are described in the work on photo-neutron sources in
Section 5.
(c) A vessel designed for breaking open small irradiated
glass capsules, containing a uranium and boron solution,
under vacuum; and for flushing out the helium in this

13.
solution as in {a) and (b). This was built for the studies
of fission described in Section 4.
For the sake of continuity, however, we can describe the
function of these pieces of apparatus as the release of helium from the
samples and its transfer, by flushing with pure oxygen, into the
circulating system. The solvent used in {a) and (b) depended on the
nature of the specimen but was usually a saturated aqueous solution of
potassium cupric chloride (K2
CuG14
).
2.6. The Circulating System
The circulating system, Fig. 3, was designed to remove
relatively small amounts of hydrogen {of up to about 20 cc at N. T. P.)
from the gas flushed into it with the oxygen from the dissolution
section.
In the work concerned with the dissolution of beryllium,
the bulk of the hydrogen was removed by the palladium thimble device,
but amounts of hydrogen of the above order were still present, as the
diffusionbecame extremely slow when only a small pressure existed
across the thimble. Diffusion was not practicable below a pressure of
about 2 ems. of hydrogen. When iron samples had been dissolved,
however, in K2 GuG14
reagent, the amount of hydrogen present, if any,
in the carrier gas was very small.
The construction of the system is best understood by
describing its oper-ation:
The helium-carrying oxygen gas, together with the
hydrogen, entered the system through tap T 1
after taps T 2
and T 4
had
been closed. The gas gently bubbled past the mercury in the 'Ventil V,
acting as a non- return valve by being raised around the U bend just
sufficiently to prevent the gas from forcing a permanent entry. The

14.
FIGURE 3 •
. ~he circulating system


15.
gases were adsorbed on the nitrogen-cooled charcoal in C, which
contained about 5 gms. of coconut charcoal previously baked out.
This prevented the pressure from building up in the system, which
would have vitiated the action of the ventil V. When all the gas had
been flushed through V into the system, the mercury in V was raised
until the ground glass floats seated in their sockets. The liquid
nitrogen was then removed from around C and the gases desorbed • .l
The gas was now confined to what was in effect a closed
circle or loop of tubing, around which it was caused to circulate by
the magnetic pump P. A glass enclosed iron slug acted as a piston in
its surrounding tube. i.Nhen the solenoid was activated, the piston
leapt up drawing gas through the ball valve BZ while Bl remained
shut. When the solenoid was deactivated, the piston d;ropped, forcing
gas past Bl while BZ was forced to shut. A make-and-break device
supplied an intermittent current to the solenoid so that a continuous
pumping action ensued, and the speed of the pump could be controlled
at will. The springs above and below the piston, and the loops in
the tubing were designed to absorb the shock of the plunger.
The float valve S was lifted from its seat above B
magnetically to allow the free circulation of gas in an anti-clockwise
direction around the loop.
The gas was thus forced through the catalysing system J.
This was a spiral of palladium wire wound around the inner tube of
a trap. Outside the trap and joined to it by the cone and socket was a
wire wound jacket. The heater current was adjusted by a rheostat
until the element glowed a dull red and the palladium spiral was
heated by radiation to about three or four hundred degrees. The
whole system was immersed in a water bath. In practice, the heating

16.
of the trap was not found to add any helium to the oxygen blank, but an
initial degassing was always undertaken.
At the temperature of the palladium, any hydrogen
combined with the excess oxygen and the water formed was trapped
out in T. The trap was not actually immersed in nitrogen as this
would have condensed the oxygen, but was surrounded by a Dewar
flask containing a few ccs of nitrogen at the bottom, to keep it well
below 0°C.
When large quantities of hydrogen were present, the
mercury level in B could be seen to rise as the hydrogen was removed.
Usually circulation was continued for 15 to 20 minutes.
The furnace was now switched off and circulation
terminated, C was re-immersed in nitrogen and the trap T topped up.
Tap T 3
was closed and the mercury raised in the Toepler bulb B to
around the float valve S, When the solenoid surrounding it was
de-activated, the float rested on the mercury. The mercury was then
sucked down to below the side arm, leaving the float trapping a collar
of mercury above B which retained the gas formerly in B to the section
between S, T 3
and T 4
. The mercury was held down for a few
seconds to allow the gas in the rest of the circulating system to
re-equilibrate with the volume B, and then a further Toepler stroke
was begun. 30 Toepler strokes were performed in all to ensure
effectively complete transfer of the helium. The mercury in the
column was lifted up to its starting position before the commencement
of Toepler action, so that after three or four operations tap T 4
could
be opened to allow the gas to equilibrate with the first charcoal of the
column. This also helped to accommodate the oxygen which desorbed
from C each time the charcoal was exposed to the evacuated space B.
17.
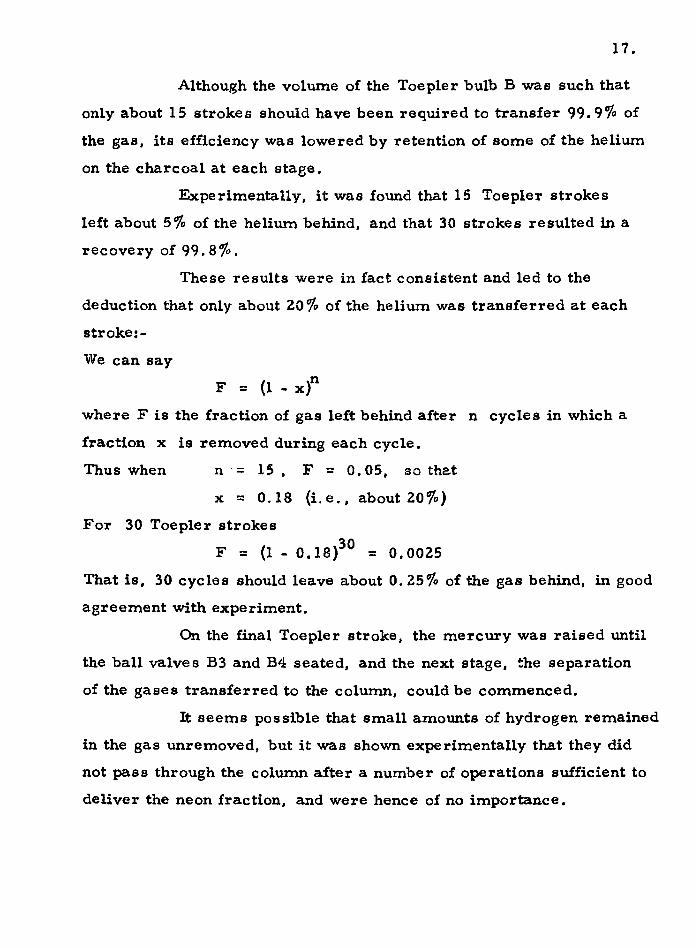
Although the volume of the Toepler bulb B was such that
only about 15 strokes should have been required to transfer 99. 91o of
the gas, its efficiency was lowered by retention of some of the helium
on the charcoal at each stage.
Experimentally, it was found that 15 Toepler strokes
left about 5% of the helium behind, and that 30 strokes resulted in a
recovery of 99. 8 ro. These results were in fact consistent and led to the
deduction that only about 20% of the helium was transferred at each
stroke:-
We can say n
F = (1 - x}
where F is the fraction of gas left behind after n cycles in which a
fraction x is removed during each cycle.
Thus when n · = 15 , F = 0. 05, so that
x = 0.18 (i.e., about Z01o)
For 30 Toepler strokes
F = (1-0.18)30 = 0.0025
That is, 30 cycles should leave about 0. 251o of the gas behind, in good
agreement with experiment.
On the final Toepler stroke, the mercury was raised until
the ball valves B3 and B4 seated, and the next stage. the separation
of the gases transferred to the column, could be commenced.
It seems possible that small amounts of hydrogen remained
in the gas unremoved, but it was shown experimentally that they did
not pass through the column after a number of operations sufficient to
deliver the neon fraction, and were hence of no importance.

Z. 7. The Fractionation Column
The column was basically a gas- solid chromatography
unit, using liquid nitrogen cooled charcoal as the adsorbent.
Z. 7. 1. General descrietion
18.
The column is shown in Fig. 4. It consisted of two
parallel lines of tubing, each connected to a separate mercury
reservoir. 15 vertical stems sprouted from each line, supporting
bulbs of capacity about 25 ccs, viz. A1
_15
and B1
_15
• Below each of
the bulbs A was a side arm connected to a small bulb C, containing
about . 75 gm. of activated coconut charcoal. These charcoal bulbs
were grouped together into four clusters; the first, bulbs cl- 3' and
the three others containing four bulbs each. This enabled the 15 bulbs
to be cooled or degassed conveniently in four small Dewar flasks or
four small furnaces (at about 300°C). Bulb c1
hung below Cz and
c3
so that it could be cooled separately; in this way it would hold
back the condensable gases from the circulating system while the
other bulbs were successively allowed to warm up to speed the
passage of neon through the column once the helium had aU been
removed. In practice, no experiments were performed in which a
complete neon recovery was required.
Each unit, of which there were 15, consisted of the
equilibrium gas volume A , the charcoal bulb C and the gas n n
transfer bulb B . The basic process was the exposure of the n
volume A , containing gas, to the charcoal C when equilibrium was n n
established between the adsorbed (or condensed) and gas phases, and
the transfer by Toepler action of the gas phase via the bulb B into n
the next unit, (n + 1 ), where equilibrium was again ef:!tablished.

19.
F:W:GURE 4.
The fractionating column

e
J "'oq ~-i ' ~..,
t --i .. ~
z ~
l ------
r ... z ~
!

20.
2. 7. Z. Operation of the col~
With the mercury drawn down into its reservoirs, the
apparatus had previously been evacuated through taps T2
and T 3
, and
the charcoals outgassed. After a good vacuum had been obtained, the
mercury was raised to levels E and D as described during the transfer
of the heliwn sample into the first unit. Tap T 2
was shut but T 3
,
leading to the evacuated compression bulb, remained open so that the
gas fractions were delivered into the compression bulb during the
operation of the column. The helium sample was present in the glass
tubing on each aid~. of T 1
and partially adsorbed on c1
.
The mechanical operation of the column was fully
automatic, but it could also be operated manually for special purposes
or in an emergency. The movement of mercury in the colwnn was
controlled by magnetically operated valves, opening either to the
vacuwn pump, o:r: to the atmosphere, and activated through a relay
system by the electrical contacts made with the mercury at D, E, F,
and G and two other common contacts, one on each stem.
On switching on the column mechanism from the 'hold-up'
position, the mercury was sucked down the bulbs A away from
contact D. When the mercury dropped below F, breaking contact, the
relay system closed the valve to the pump and opened a valve to the
atmosphere causing the mercury to rise back to D. When contact
was renewed at D, the rise of the mercury in the bulbs A was
terminated and the mercury sucked down the bulbs A away from E.
This movement was similarly reversed after contact G was broken,
and the mercury rose again to E, whereupon the mercury in the
bulbs A once more began to fall. This process was continued until

Zl.
35 cycles had been registered on the Post Office relay counting
device, One cycle comprised the lowering and raising of mercury in
both sets of bulbs, A and B.
When the mercury dropped below F, the gas adsorbed
on charcoal c1
was exposed to the volume ~ and equilibrium was
established between the two phases. (This was a rapid process,
substantially complete in the five seconds or so for which the
exposure lasted). The gas phase in A1
was then driven by the rising
mercury into the small section of tubing between the levels E and D.
'When the mercury then dropped below G, the great bulk of this gas
was collected in the transfer bulb B1
• The rise of the mercury to E
compressed the gas into the small section of tubing above the charcoal
in c2
: when the mercury dropped from D, equilibrium was set up
between the gas phase and adsorbed phase in A2
and c2
• Simultaneously,
equilibrium was re-established for the remaining gas in the first unit
between c1
and A1
. On the next operation, this second gas fraction
would be pumped into the second unit and so on. The overall effect
of this process was the rapid passage down the column of the least
strongly adsorbed gas, helium, followed by the next least adsorbed
gas, neon.
Z. 7. 3. Theory and behaviour of the column
The theory of the column has been derived by
Gluecka.uf(z). This t:IUmmary of his treatment is included for
completeness.

zz.
Langmuirs isotherm is normally written
C = K1
C I ( 1 + K2
C ) s v v ---------- {1)
where C and C are the equilibrium concentrations in the solid s v
and gas phases.
The amounts of gas are so small that we can write
C = aC s v -----~--- {Z)
where a is the adsorbtion coefficient for the gas.
Consider a quantity of helium A , allowed to equilibrate 0
between a volume V and a mass of adsorbent S. Then the gas in the
gas phase, A1
, will be given by
or
A1 /A = VC /(VC + SC ) 0 v v s
= A [1/(1 + SC /VC } 0 s v
A1
= A 0
[1/(1 + aS/V)] -------(3)
= A a 0
--------- (4)
where a is the fraction of the gas in the gas phase,
A1
/A0
, termed the distribution factor:
a = 1/(1 + aS/V) -----~--- (5)
Similarly, for a second gas B (e.g., neon),
b = B1
/B0
= 1/(1 + (38/V)-------(6)
Glueckauf has shown that the best separation of two gases
in one unit may be considered to have been achieved when the
maximum proportion of one substance would have to be transferred
to the other phase in order to produce equal ratios of the two gases in
both phases.

23.
This condition indicates that (a - b) should be a
minimum; that is
d(a - b)/d(S/v) = 0 ;
the solution of which, in accordance with equations (5) and (6)
above is
vIs = .r;;rr --------- (7)
This result also leads to the result, from {5) and (6) that
(a +b) = 1 --------:(8)
Equation (7} defines the design parameters 5 and V for the separation
stage. a. and I'J, the adsorbtion coefficients, are quoted by Glueckauf
as 10.6 and 110.7 for helium and neon respectively in units of -1
cc. gm. These values were remeasured in an experiment
described below and values very similar in magnitude obtained.
Now Von the column was about 25 cc so that S should
be 0.73 gm.
The actual weight of charcoal used in the bulbs was about
0. 8 gm (to allow for the volume of the side arm tubing).
Glueckauf considers the amounts of material in the
various units, m, after n operations and derives the following
expressions:
A (ii'- l) ~ 0 = (m - 1) ! (n - m)
A (n • 1) ! Am ( S) = -:--"-0-~--:-----::-
n (m - 1) ! (n - m)
l'n( )n - m a 1 -a _ (9)
m - 1 (1 )n- m + 1 a -a - (10)
Am (V) and Am (S) refer to the amount of gas in the volume or solid n n
phases in the m th unit after n operations. For a system of m units,
the amount of gas A transferred to the storage bulb after n operations

is
A = Am + Am + Am Am (11) T m m+l m+2+ ...... + n-
the summation beginning at the m th process since no gas can be
delivered until m operations have been performed.
Also, the amount left on the column must be
A c Am + Am + Am Am (12) R n+l n+2 n+3+ ..•... + cO-
Similar expressions hold for gas B.
Z4.
In the course of fractionation of two gases A and B, the successive
fractions delivered to the storage bulb are
F = Am + Bm X X X
consisting of a mixture of both gases.
As the process continues, both the quantities Am and Bm go through
a maximum, as illustrated by the helium and neon curves in
Fig. 5,. and the air sample curve Fig. 6. (Both these curves were
obtained experimentally). In reality, the function is a step function,
not a smooth curve as drawn.
Consider the meaning of the term 'best separation' for a
column of a given number of units, m. The earlier the fractionation
is stopped, the purer will be the helium, but its delivery less
complete. The best point at which to stop is reached when the amount
of helium still to be delivered is equalled by the amount of neon
contamination.

FIGURE 5.
Fractionation curves for he Hum and neon -----:~~~~~~~~~~,~~~~--~
25.

z z a. ~ :I :I ::1 ::1
w ..J _, ... 0 8 ll !!!:
c(
!l ..J I ..
:
·!·
0
... :I Ul ·-ZN
X
\
DEFLECTION~ --- (ur:l't -- .. ___ _!_ ary t~nits.)
~-:
0
"'

26.
FIGURE 6.
Fractionation curve for an air sample

20
(j) 5 I
14 16 18 20 22 24 26 28 30 32 OPERATIONS
36 38 40 42 44 46 48 50

27.
Glueckauf showed that this condition occurs when
n =2m- 1 +[log A0/B
0]/[log(l - b)/(1 .. a)] (13)
so that if the initial amounts of the gases A and B are of the 0 0
same order,
n~ Zm (14)
All the above expressions are applicable to an ideal system,
obeying La.ngmuirs Isotherm, having zero dead space, lOO'?'o equili
bration and transfer, and identical unit~. hl. practice, the column is
calibrated experimentally. The column contained 15 units,
i.,.e. m = 15, so equation (14) indicates that fractionation should be
stopped at about operation 30. Fig. 6 indicated tha,t the actual best
separation was achieved at operation 35.
2. 7. 4. Modifications made to the column
The apparatus initially produced the helium and neon
chromatograms of Fig. 5; the helium curve being that plotted as
1old column 1 and the neon curve that at 1liquid air temperature 1•
These curves showed very poor resolution between helium and neon,
and an air sample check on the functioning of the helium separation
was almost impossible. The helium 1tail 1 was also excessive even if
r.o neon were present in a sample for analysis {as was the case in
almost all the samples). The charcoal used in the column was
placed in a simple experimental system to enable the adsorption
coefficients a and ~to be determined. This simply consisted of
connecting a gramme of the charcoal to the large McLe-od gauge,
which was of lmown volume, and measuring the change in pressure
of the helium or neon when the charcoal was cooled in liquid nitrogen
for about an hour.

28.
The following values were obtained:
a Ei; 10.7; f3 = 116 where -1
the units used were gm. cc . These are in excellent agreement with
the values quoted by Glueckauf:
a. = 10.6; f3 = 111.
Clearly then, the charcoal was not at fault.
It was then realized that the dead space in the tubes connecting the
equilibrium volumes, An, to the next charcoal, Cn + 1 , was an
important factor in the separation. When the mercury dropped round
the 1T 1 junction at level Gin the column, a good deal of the gas would
not pass forward into the next unit. To ensure this transfer was
almost complete, the bulbs B were built into the tubing. n
The much improved pas sage of helium achieved by this
modification is shown in Fig. 5 under points marked 'new column'.
It will also be noticed from the same figure, that the
passage of neon through the column was retarded by the modification,
though to some extent this was due to the use of liquid nitrogen
rather than liquid air, as coolant.
Some evidence was obtained that the passage of neon
throug-h the column is fairly sensitive to the tempe.ratu·r.e of the
charcoal.
The ratio of successive fractions of gas delivered by the
column's mth unit, is, from equation (9) :-
= n(1 - a).J·(n - m + 1)
This equation e;:: .. :'.bles .the constant a, and similarly, b, .to be
determined from the experimental curve :-
a = 0. 64
b = 0. 24

2.9.
These values are constant over a fairly wide range; e. g., a is 0. 64
in the range from operation 18 to 2.9.
Now it has been shown that {a +b)= 1. The above figures,
(a + b) = 0. 8 8, show the deviation from ideal behaviour.
z. 7. 5. Percentage recovery of helium
In all the samples analysed for helium, there should hav.e
been no neon present. However, it v.:ras safer and quicker to measure
the helium at operation 35 than to attempt to collect all the helium
1taill which only amounts to about 1 <1'o of the helium. It was thus
necessary to measure accurately what fraction of the helium in the
circulating system was actually measured by the standardized
procedure; namely 30 Toepler strokes in the circulating system and
35 operations of the column. (The only exception to this absence of
neon was the analysis of air samples and this is discussed in the
next section).
The following standardization procedure was adopted.
A knowz:. amount of helium was measured out in the pipetting system
and delivered to the compression bulb, C. {See Fig. 9). This was
then collected in the small transfer pipette B by the joint action of
the r.ompl"ession bulb and the mercury in T. Raising the mercury
in the compression bulb followed by three Toepler strokes of T pact
tap T 2. transferred the bulk of the helium into B; a further lowering
and rais:L."'lg of the :mercury in the compression bulb and three more
Toepler strokes of T ensured that over 99. 95 <1'o of the helium had been
transferred. T2
was closed after the final stroke, (the mercury being
brought up into the key of the tap), and the pipette B removed from
the apparatus at the B.!O joint. It was then re-fitted on another B.lO
cone attached to the circulating system through a tap. The space

between the taps was thoroughly evacuated and then the helium in
B could be allowed into the circulating system.
30.
The helium remaining in the pipetting system was not
pumped away but a second fraction cut off in the second pipette P z. From the known volumes, this consisted of 98. O% of the first
fraction previously transferred via B to the circulating system. Thus
a comparison of the first fraction passing through the column with
the second directly measured eliminated the necessity of measuring
the amo\Ult of helium in the Me Leod gauge absolutely. The percentage
efficiency of the helium procedure followed with the gas transferred
to the circulating system was given by
D1 being the helium rWl through the column;
D2 being the Znd helium fraction. equal to 98. O% of the first;
the amoWlta of helium ~eing measured by their defiexions n1
and D2
on the ·gn.lvonometer connected to the Pirani gauge.
Two such calibration experiments showed the efficiency
to be 98. 8%. This is in accordance with the experimental
observations that 1. oro of the helium was not delivered by operation
35 and a small amoWlt of approximately 0. Z% was not transfel'red
into the column from the circulating system; as mentioned above.
Z. 7. 6. Air analyses
Since it was established by G1ueckauf and Paneth in
1944 (5
) that the helium content of the atmosphere at ground level is
constant, the air of the laboratory has served as a helium standard

31.
and a convenient check on the correct working of the apparatus.
Below are tabulated some of the results of such
measurements in the Londonderry Laboratory:-
Glueckauf 1944 5.24 X 10- 6 + 0.03 cc/cc (5)
-
Glueckauf 1945 5. 239 X 10 -6 + 0.004 cc/cc
(5)
Reasbeck 1953 -6 + 0.01 cc/cc (?) 5.285 X 10 -Hall 1958
-6 + 0.006 cc/cc (12 ) 5.279xl0 -{The errors quoted being standard errors of means).
The above results, except Hall's, ultimately depended on the ratio of
nitrogen plus argon to total air, which had previously been determined
to be constant. Hall used a small air space between two greased taps
which was of known volume, and measured the helium directly. This
method was used initially by the present author, but low and
divergent results led to a realization of the likely errors inherent in
the method. A rather serious error could be introduced by the small
amount of grease extruded from the taps into the side arms of the
air pipette, which was necessarily small on account of the limited
handling capacity of the measuring system. It was discovered that
up to 3 or 41o of the volume of about 0. 2 cc could be filled with grease
from well-turned taps.
Accordingly, a new greaseless air sampling system was
built using a mercury cut-off.

32.
FIGURE 7.
The air sampling apparatu$

TO
CALIBRATED VOLUME
VIA DRYING TUBE
TO VACUUM
MANOMETER
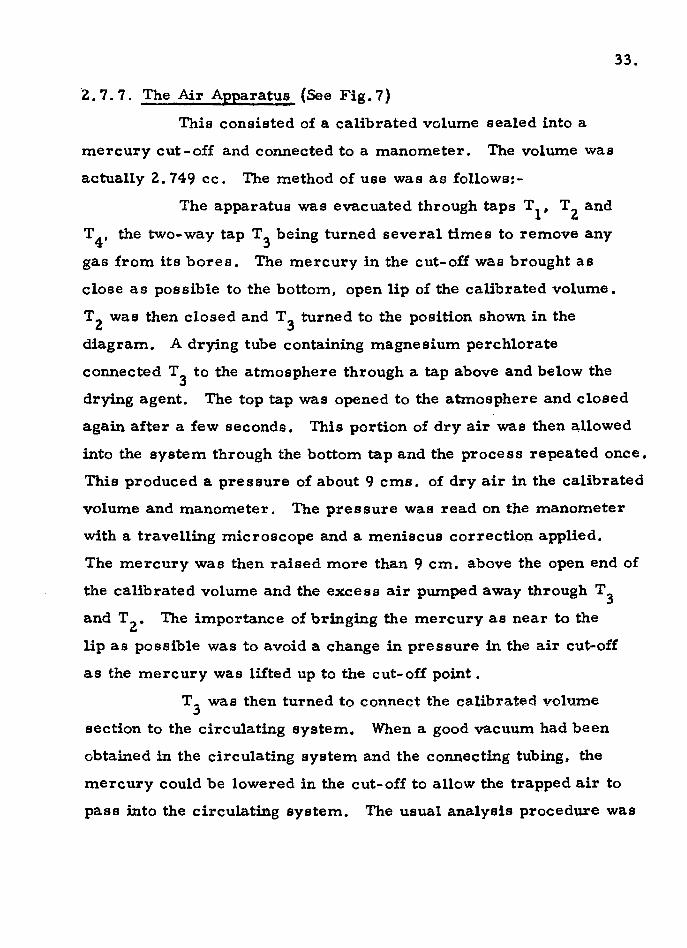
·z. 7. 7. The Air Apparatus (See Fig. 7)
This consisted of a calibrated volume sealed into a
mercury cut- off and connected to a manometer. The volume was
actually 2. 749 cc. The method of use was as follows:-
The apparatus was evacuated through taps T1
, T2
and
T 4
, the two-way tap T 3
being turned several times to remove any
gas from its bores. The mercury in the cut-off was brought as
close as possible to the bottom, open lip of the calibrated volume.
T 2
was then closed and T 3
turned to the position shown in the
diagram. A drying tube containing magnesium perchlorate
33.
connected T 3
to the atmosphere through a tap above and below the
drying agent. The top tap was opened to the atmosphere and closed
again after a few seconds. This portion of dry air was then allowed
into the system through the bottom tap and the process repeated once.
This produced a pressure of about 9 ems. of dry air in the calibrated
volume and manometer. The pressure was read on the manometer
with a travelling microscope and a meniscus correctio~ applied.
The mercury was then raised more than 9 em. above the open end of
the calibrated volume and the excess air pumped away through T 3
and T 2
• The importance of bringing the mercury as near to the
lip as possible was to avoid a change in pressure in the air cut-off
as the mercury was lifted up to the cut-off point.
T _ was then turned to connect the calibrated vohtme ,j
section to the circulating system. When a good vacuum had been
obtained in the circulating system and the connecting tubing, the
mercury could be lowered in the cut-off to allow the trapped air to
pass into the circulating system. The usual analysis procedure was

34,
then carried out and the helium found expressed as ccs per cc of air
admitted.
It can be pointed out that this was an occasion where two
primary pumping systems were useful; pumping out the unwanted
air through T2
could be done while the circulating system and column
were being evacuated in preparation for the measurement.
2. 7. 8. Results of air analyses
Air samples were measured at regular intervals during
the work to check the correct functioning of the apparatus. Below,
some of the results are listed:-
He found in cc (N, T. P.) per cc (N. T. P.) of dry air:-
( -6 1) 5.30xl0
(2)
(3)
(4)
(5)
(6)
5,27 X 10 -6
5, 20 X 10 -6
5, 30 X 10 -6
5. 30 X 10 -6
-6 5.19xl0
Average = 5. 26 x 10-6 ± 0. 02(3) cc Icc
where the error is the standard deviation; the result quoted with the
standard error of the mean is 5. 26 "t 0. 01 cc Icc.
This compares well with the results listed above,
The air sample curve and the pure helium curve,
Figs. 6 and 5, were used to evaluate the correction required to the gas
measured at operation 35. From the experimentally determined value
of b and the known relation between successive fractions, the amount
of neon evolved by operation 35 was determined. It turned out that,

35.
within the uncertainty of the measurements, the helium not delivered
was just balanced by the neon present (in terms of deflexion of the
gauge).
The shape of the neon fraction was found to vary slightly
according to the 'age 1, i.e., the temperature, of the liquid nitrogen
used on the column charcoals. This was a small effect and was
further reduced by always using fresh nitrogen on the column.
In view of these small uncertainties of the order of )4%
the results above are quoted to 3 significant figures only, as the
fourth figure, i.e., part:~J in 5000, is of little value,
It should be pointed out that these uncertainties do not
apply to the rest of the helium analysis work, where no neon was
involved.
The accuracy with which the helium content of neon
containing samples could be measured depended on the size of the
minimum between the helium and neon fraction peaks. In the apparatus
under discussion, this was about 41o of the helium peak height. A
similar apparatus in the Londonderry Laboratories achieved a
considerably better separation for no clear reason. The possibility
of achieving much better separation for such work by the use of
more selective adsorbents, i.e., molecular sieves, is worthy of
consideration.
2. 8. The McLeod Gauge and Pipetting Sy_atem
The normal amounts of helium measured during this -6 -8
work varied from about 1 x 10 to 1 x 10 cc at N. T. P., though -9
'blanks 1 on the oxygen apparatus were as low as 1 x 10 cc. The
pipetting system shown in Fig. 8 was capable of measuring out amounts

36.
-..s -8 of helium from 1 x 10 to 1 x 10 cc for calibration of the Pirani
gauge.
The Me Leod gauge R, with a bulb of over 800 cc, was
normally used for measuring the pressure in various sections of the
apparatus connected to it through tap T 1
and the manifold of the
vacuum line. It was also used in conjunction with the pipettes to
measure out a known amount of helium.
As regards its first use, as a pressure gauge, a 'stick'
in the instrument represented a pressure of better than 5 x 10⁻⁷
em.
of mercury; the pressure P1
in the system will be given
P2V2
vl by =
where vl is the volume of the bulb.
P2
is the pressure difference between the open and
closed limbs when the gas is confined in a volume V 2
in the closed
limb.· When the mercury was brought to the topmost, or first, etch
mark (the volume V 2
being 0. 2 cc) no pressure difference could be
read off between the closed and open levels on a telescope reading
to better than 0. 002 em.
H~nce P1 <
<
0. 2 X , 002 800
5 x 10- 7 em.
The operation of the calibrated Me Lead in conjunction with the
system of pipettes for measuring out helium (or neon) was as
follows.

FIGURE 8.
The gas storage bulbs, the Me Leod _gau_g_e
and gas ~petting system
37.
-·

38.
The apparatus was pumped out rigo:Fously through T 1
and through the compression bulb section until a hard vacuum was
obtained. Naturally, taps T3
and T6
were kept closed, confining the
helium and neon to the small bulb fitted with a manometer (which
was maintained at about 3 or 4 ems. pressure). Taps T2
, t5
and T8
were open. The mercury in the pipettes A and B was raised to the
levels shown, and to the etch marks M1
and ~ in the two other limbs.
T 2
was then closed and T 3
opened and closed, allowing a small
amount of helium to be trapped between T 2
and T 3
• T 1
was closed
and the helium allowed into the McLeod bulb by opening T2
•
(A similar procedure with tapa T 5
and T 6
was followed for neon).
T 1
was then opened to the pumps for an interval dependent on the
amount of helium required, to remove excess gas. The mercury
was raised in R and if the volume of gas trapped in the closed limb
was too large, the mercury was lowered and T 1
opened again for a
brief interval.
The closed limb was marked with five etched lines
_marking off volumes from 0. 2 to 1. 0 cc; and a pressure difference
of up to 10 ems. could be read off. After the bulk of the gas not
trapped in the closed limb had been pumped away, the pressure
difference between the open and closed levels was read off on a
trav~lling microscope, after the mercury in the closed limb had
been accurately aligned so that the bottom of the meniscus was
exactly on the etch mark. The temperature of the gas was noted
with a thermometer reading to 0.1 °C and the meniscus heights also
measured so that a meniscus correction could be applied to the
pressure reading.

After about 20 minutes when all the unwanted gas had
been pumped away, T 8
was shut and the mercury level at ~ checked.
The mercury was then lowered in R as far as the mark M, allowing
the measured helium to expand into a known volume comprised of the
bulb, the side tubing between T8
, M and the first pipette to ~.
This volume was 883. 87 cc. By raising the mercury in the cut-off A,
the known volume of the pipette P 1
was isolated from the main bulk
of the helium; the fraction was 8~·3:~~ . The helium in P 1 was
then allowed to expand into the bulb C and second pipette P 2
by
lowering the mercury from ~ to the black wax mark ~. This
new volume exposed was 166. 38 cc. The mercury level at Mz was
checked and the mercury in B then raised cutting off in P 2
a fraction 3. 2 8 3 2. 94 7 . . . B · h
!66 . 38 x 883 • 87 of the or1g1nal bellum. y lowermg t e mercury
from ~· this gas was expanded into the compression bulb which was
of about one litre capacity. This gas was then measured in the Pirani
gauge as described below.
The amount of gas originally in the McLeod gauge was
273.2 PV 76(273. 2 + T)
where P was the difference between the open and closed levels (in
ems.) in the volume V {cc) in the gauge, measured at temperature
T (°C).
or
Hence the amount delivered to the compression bulb was
PV 273.2 U X (273. Z + T) X
3.283 166.38
2.947 X 883.87
273.2 -7 PVx (273 _2 + T) x 8.657 x 10 cc at N.T.P.

40.
As regards the accuracy of the process, the errors involved
(disregarding any systematic error in the calibrated volumes) were
small; the alignment of the etch marks could be achieved, with a
magnifying glass, to better than 0. 2 mm., which was a negligible
portion of the length of the pipettes. The .McLeod gauge pressure was
read to 0. 002 ern., so that errors were only significant when low
pressures were being read,
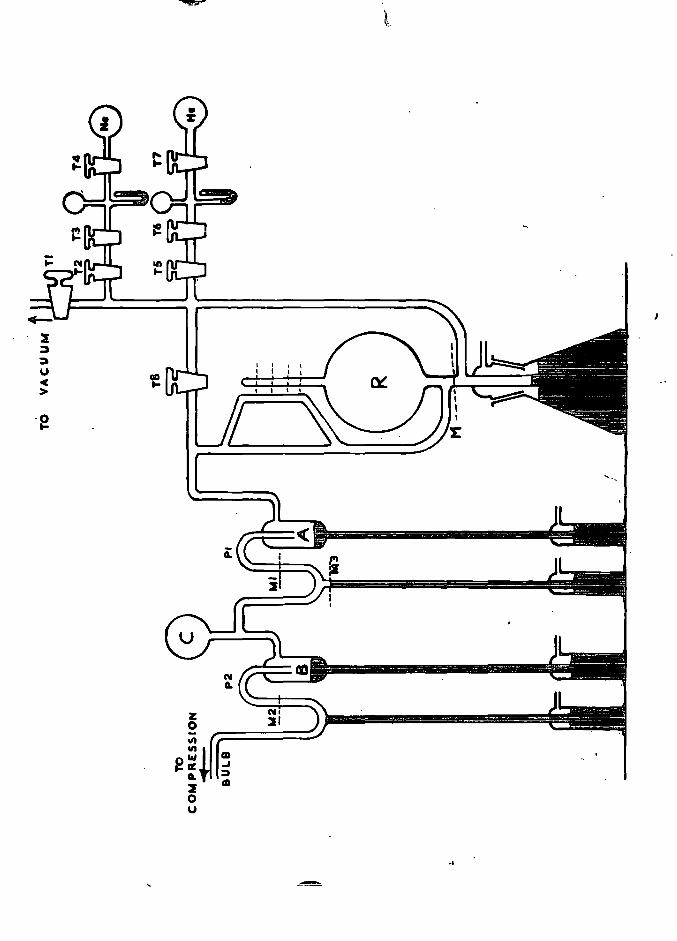
2. 9. The Compression Bulb
The large one litre bulb C, (see Fig. 9), was connected
to the column through tap T 1
and to the pipetting system through P 2
;
a tube led from the top of the bulb to the measuring Pirani gauge
through T6
.
The method of use was as follows; if fractions from the
column were to be collected, the mert;:ury in the column was raised
to its starting or 'hold-up' position, tap T 1
was opened and the
bulb and tubing evacuated through tap T 4
until a hard vacuum was
obtained. The mercury in the Toep1er bulb T was permanently
raised to the tap T 3
and the ball valve B3
, since this Toepler was
only used on very rare occasions, for example, in the percentage
recovery experiments on the column. The mercury in C was sucked
down to its lowest level. The side arm leading to the pipettes was
shut off by raising the mercury in P 2
to the mark ~ as shown.
The helium fractions from the colurnn were then
collected in the bulb C, and the gas was then measured in the gauge
as described below. The gas was then pumped away through taps
T 4 and T 6
and the gauge calibrated with helium from the pipetting
system, measured out as described above.

FIGURE 9.
The compression bulb, Toepler pump and
the Pirani gauges
41.

t B TO VACUUM
FROM COLUMN
r
Tl
II
P2 ··
p
42..
The delivery of the gas fractions from the column to
operation 35 took about one and a quarter hours, durine which the
bulb C was of course shut off from the pumps. Nevertheless, no
appreciable accumulation of helium occurred by leakage or diffusion,
as was shown by the very small blanks obtained on the column, -9 usually around 1. 5 x 10 cc of helium.
2.. 10. The Piz:ani Gauges
2..10.1. Design and Theory
The Pirani gauges, one of which is shown in Fig.lO,
were the only part of the apparatus, except the diffusion pumps,
to be made of pyrex glass. This was because the pinch seal
supporting the tungsten hooks and spring, and the Dewar seal round
the top were incapable of surviving the thermal shock of immersion
in liquid nitrogen when soda glass was used in their construction.
Leakage of atmospheric helium was negligible, however, as the
great bulk of the gauges was cooled in the nitrogen bath, and
diffusion was very slow at such temperatures. The discussion of
the theory of the sensitivity of the Pirani gauge has been excellently
treated by Ellet and Zarbel (l 4 ). Their results may be summarised
as follows:
(1) In a bridge circuit operated at constant watt input,
the galvanometer deflexion should be proportional
to the pressure.
(2.) The sensitivity of the gauge is proportional to the
square root of the area of the wire.
(3) The Wire should be as long as convenient and its
resistance should be of the same order of magnitude
as the galvanometer.

43.
FIGURE 10.
The· Pirani Gauge

TUNGSTEN HOOKS
&
(
'}
5 P Rl NG+--Hliil.
Ni TAPE
CHARCOAL
GOLD

44.
{4) The sensitivity of the gauge will be greater when the
walls are cooled, though the relationship is a
complex one.
These deductions were put into practice in the gauge
shown in Fig. 10. The W shaped filament enabled the greatest
length of wire to be fitted into the volume of the gauge of ZS cc, which
was as small as was possible to create the largest pressure change
on admittance of the gas. The fine nickel !~lament was of flat section
in accordance with {Z), the section being 0.05 x 0.0003 mm. The
gauge, with a compensating 1dummy 1, was immersed in a liquid
nitrogen bath. Thin gold foil was placed in the gauge to give
sa~rificial protection to the soft soldered joints between the hooks
and the tape from attack by mercury vapour. The charcoal served
to mop up any trace of condensable gases (for example, from the
tap grease), while its mass was so small relative to the volume of
the gauge that only negligible amoWlts of helium were adsorbed.
Z.lO. z. Construction of the gauges
The tungsten hooks and spring, previously clad in glass,
were pinched together at the end of a glass tube and the tape
supporting rod fused on. The hooks were cleaned with molten
sodium nitrite, washed and covered with copper by electroplating in
a copper sulphate solution. This was necessary to get the solder to
1take 1• The hooks were then tinned and the tube clamped at about
Z0° from the vertical. About 18 inches of the nickel tape was
carefully unrolled onto a glass sheet. This was picked up and
manoeuvered by two small glass rods having a dab of soft black wax
on their ends. After making sure that the wire was free from kinks,

45.
it was draped over the hook of the spring, down and over the
supports at the end of the glass rod and up and over the tinned
tungsten hooks. The glass rods were allowed to hang down to tension
the tape. Small auxiliary weights of up to 5 grammes in all at each
end of the tape could be added, though it was best to use glass rods
of about this weight initially. After a few minutes, the tape was fused
onto the hooks by touching the ends of the hooks cautiously with a
hot soldering iron. A sharp tug on the pendant glass rod would snap
off the excess tape at the hook. The wired-up inside of the gauge
had then to be glass blown into its jacket by making the Dewar or ring
seal around the top. The distance at which this seal was made from
the pinch seal had to be sufficient to prevent the heat from the joint
melting the solder on the tungsten hooks.
After inserting three or four small pieces of charcoal
and a small roll of gold foil, the gauges were attached to the apparatus
through the black-waxed B7 joints.
The life of the measuring gauge was normally about four
to six months, while the compensating or 1dummy 1 gauge lasted
almost indefinitely.
2.10. 3. The Pirani gauge eire~
The two Pirani gauges P 1
and P z formed part of a double
Wheatstone network as shown in Fig.ll. The compensating or
1dummy' gauge never had gas admitted to it and was kept at a good
vacuum. By being subject to exactly the same environment as the
measuring gauge, spurious deflexions due to stray electric or
magnetic fields, vibration or changes in temperature or incident
light flux were avoided or at least minimised.

46.
The switch s2
was almost invariably kept in the vertical
position so that the second bridge arm consisting of R5
, R6
and R 7 was inoperative. This arm was used for checking purposes only:
for example to check the free swinging of the galvo spot without having
to wait for the Pirani gauges to settle down.
The accumulator shown provided a voltage of one volt
across the Piranis and this could be checked on the terminals shown.
As mentioned above, a gauge constructed as described had a
resistance of 150 to 250 ohms. R 1
, R5
and R2
, R6
were respectively
150 and 50 ohms high stability wire wound resistors, while the
variable resistors R3
, R4
and R7
were decade boxes of up to
1000 ohms. The galvonometer G was a sensitive quartz fibre
suspension instrument, throwing a light spot onto a metre scale just
under a metre away. Its internal resistance was about two thousand
ohms, as deduced from its sensitivity to various values of the range
box, R. B. This contained resistors from zero to 25, 000 ohms, thus
providing an approximately twelve-fold sensitivity range for normal
use, Thus, if a one em. deflexion on the most sensitive scale
corresponded to about 1 x 10⁻⁸
cc of helium, (as it did), a 50 em.
deflexion on the least sensitive scale would be 600 x 10-B or -6
6 x 10 cc of helium, Larger amounts of helium than this were
never measured but could have been accommodated by an auxiliary
shunt across the galvanometer. In practice, a 500 ohm shunt was
connected directly across the galvonometer to protect it from violent
fluctuations when the gauges were being immersed in, or withdrawn
from the liquid nitrogen bath. The advantage of the system described
was that the ga1vonometer was maintained in a constant resistance
circuit giving slight over-damping, thus avoiding the difficulties of

47.
FIGURE 11.
The Pirani gauge circuit dia_gram

~------------~ 2V S1
i I VOLT CHECK
l R.B. c=o RANGE BOX
R1,R5 = ISO .n. (HIGH STAB ILl TY REs.)
R2·'\ = 50 .n ( ... " II )
R3,\,R7 -flooo.n(vARIABLE DECADE REs)

Wlder-damping which would occur on the sensitive scales of an
ordinary series resistance sensitivity system. The la-:::er system
48.
was initially in use on the apparatus but was changed to that described.
Before immersing the gauges in a tall two litre Dewar of
liquid nitrogen, the galvanometer range box was turned to the least
sensitive range and the shunt brought into operation. The current
was switched on through the Piranis by s1
and they were slowly
surrounded by the coolant. R3
was altered to keep the light spot on
the scale during the initial rapid drifting. The galvanometer spot
drift gradually decreased with time, but it normally took four hours
before measurements on a sensitive scale were practicable.
2.10~4. Use of the gauges
The gauges were first rigo]:lrously evacuated through the
taps T5
, T6
and T4
above the B7 sockets; see Fig. 9. The charcoal
in the gauges was outgassed with a small gas flame for about five
minutes. After about fifteen more minutes the pressure was checked
on the McLeod gauge and if a 'stick' was obtained, the taps T5
and T6
were shut. T 5 , the tap to the compensating gauge, remained ~hut
throughout all the measuring procedures.
The current was switched on through the gauges and they
were immersed as described above. When stability had been attained,
they were ready for use.
The helium fractions from the colutnn had been collected
in the compression bulb C, with the mercury in T raised to T3
and
B3 beforehand, and the pipette P 2
shut off as shown. The mercury in
C was brought to the lower fixed mark, namely the internal seal just
above the reservoir. T 6
was then opened and the helium allowed to

49.
equilibrate between C and the Pirani gauge. A small deflexion
(about 5 o/o of the de flexion to ·b2 measured) occurred; the reason
for this procedure is explained later. T 6
was then closed and the
mercury raised in C to the ball valves B1
and B2
, compressing the
helium between these and the ball valve B3
and the taps T 6
and T 4
.
The small fraction of the gas trapped in the side arm above B1
was
a constant fraction of the total and hence immaterial.
T 6
was then opened and the galvanometer swing
measured (on a suitably sensitive scale). Since the deflexion slows
down in an exponential fashion, the readings of the spot were noted
at minute intervals for five minutes. The deflexion could be
extrapolated to infinite time, but in practice, since the calibration
was always performed with a nearly equal amount of helium, the
reading after five minutes was taken as the actual swing. The use of
nearly equal swings in the calibration also made corrections for
the non-circularity of the scale wmecessary.
T 6
was shut and the mercury drawn down in C to the
lower fixed mark. T 6
was again opened and the galvanometer spot
swung back to its original position. The readings of the 1up 1 and
1down 1 strokes of the mercury were repeated in this manner until
sufficient statistical accuracy had been achieved. The reason for
opening T6
initial!y should now be clear; if this had not been done,
the initial 1up 1 reading would have been greater than subsequent
readings, since the gas would have been expanding into a vacuum
and not the equilibrium pressure of the gas at the lower fixed mark.
The open~.ng of tap T6
for the 1up 1 and 1down 1 readings
was strictly regulated by a stop-watch; in this way, the drift of the
spot in a direction contrary to the subsequent reading was always of
so.
an equal magnitude. Some random spurious movements of the
spot occasionally occurred, but by noting the reading every minute,
spurious results were usually detected and the reading ignored.
H very small deflexions were being measured on the sensitive scale,
this problem was more important and a larger !:.\umber of swings was
measured; the fluctuations should then have cancelled out in the
average. Some Piran~. gauges did not suffer much from this trouble,
being very stable, but others were rather temperamental.
Mter the measurement, the helium was pumped away
through taps T 4
and T 6
, about ten minutes being sufficient for
complete removal. The gauge was then calibrated with an almost
equal quantity of helium from the pipetting system in an analogous
manner.
All measurements were macle in the dark, relieved only
by a small electric lamp, for two reasons:
(i) the light spot was easier to read
(ii) the gauges were sensitive to the incident light flux and
variations in this could cause spurious deflexions of
several mm. on the most sensitive scale.
The gauge here described has some disadvantages,
notably its short Efe a.:.1.d d:i.fficulty of manufacture. An attempt was
made to replace the heated iilament with a thermistor. Thermistors
have successfully been used in differential gas analysis, for (113)
example by Walker and Westenburg . Two types were tried;
•Stantel, type A 1 and 1Stantel, type U 1 of respectively 100 and
25 milliwatts consumption. The latter type when soldered into a
small hollow brass cylinder as the vacuum envelope, and immersed
in an ice bath at 0°C, was found to be some five times less sensitive
51.
to helium than the normal Pirani gauge. Leaks in the metal to metal
joins proved extremely vexatious when immersion in liquid nitrogen
was attempted. Stability was not good for the 1U 1 type and could not
be achieved at all with the 1A 1 type, so the experiments were
abandoned.
Another type of gauge using a vertical stainless steel
jacket containing a single strand of the nickel tape, soft- soldered at
each end, was also tried. In practice this turned out to be almost as
difficult to make as the glass gauge, and the glass-metal seal through
which the filament passed failed to withstand immersion in liquid
nitrogen.
2.11. Some notes on the apparatus
The apparatus has been dismantled on the termination
of this research. An improvement worth incorporating into a rebuilt
model is thermostatic control of the laboratory atmosphere. One
reason is the greater accuracy of gas volume and pressure measure
ments that would ensue. Secondly, for long tap life, that is, long
intervals between regreasing the keys, the taps should only be turned 0
between about 19 and 23 C. This applies to Apiezon N grease whose
viscosity is very temperature dependent. High temperatures are also
inimical to the grease in the 'wedge 1 type of tap where the key has
the pressure of the atmosphere holding it against the barrel; the
apparatus contained some taps of this type. Silicone grease is not
recommended because, being colourless, it is very difficult to judge
the condition of a tap or whether it is 'streaked', that is, a potential
atmospheric leak. It is also difficult to remove from glassware.
52.
The apparatus was a .bulky and complex vacuum system
containing about one hundred greased taps. Because of the
experimental handling difficulties, its slowness and lack of
versatility, this type of apparatus has been largely displaced by mass
spectrometers. However, for extremely accurate absolute
measurements on very small amounts of gas, it is still unrivalled. . (114) 3 4
For example, Hoffman and N1er , who measured He and He
in meteorites, quote their mass spectrometer accuracy as t So/o on
samples of about 3 x 10- 6 cc. Reynolds(llS)' using similar apparatus
for argon and xenon, quotes similar values: more recently (in 1965)
Lipschutz (133
) has published results on iron meteorites.
?-.12. Errors
It has been stated above that the accuracy of helium
measurements is better than lo/o. Consider the expression used for
calculating the amount of helium: PD
1 Helium = k 1 k 2 D
2
k1
is the volume calibration constant, D1
and D2
are the average
galvonometer deflexions for the sample and the standardizing helium,
Pis the pressure of the standardizing helium, read off by
microscope, and k2
the percentage recovery (or efficiency) factor
for the apparatus. The accuracy will depend on the amount of
h 1. ... b d b 1 1 o- 7 . . 1 f' ... h e lUl"n 1.0 e measure , ut x cc 1s a typ1ca 1gure. Jn sue a
case, Pis about 2 em. and D1
and D2
about 10 em. P can be read
to 0.002 em. and gives rise to an error of O.lo/o. D1
and D2
can
be read to 0. 02 em. and each is compounded of at least 6 readings;
this leads to a small error. However, it is more realistic to assess

53.
limits of spurious errors due to instability in the gauges. The
criterion adopted is that at least 3 pairs of averages of D lie within
one percent; this was always achieved in practice. On this criterion
the war st case leads to a maximum standard error of the mean of
0, 4o/o,
In addition, a possible error of up to 0. 2 o/o exists in
the percentage recovery factor of 98. Bo/o, derived in Section 2. 7. 5.
Treating these errors as standard errors, the total
error is 0. 6o/o. Thus for normal use, we can say that results are
accurate to better than 1%. This is borne out by comparison of the
results obtained with different apparatuses, and also by the results
of air analyses.

54.
SECTION 3.
AVERAGE CROSS SECTIONS FOR THE FISSION 56 53 54 51
NEUTRON REACTIONS Fe (n, CL)Cr , Fe (n, a.)Cr
AND Fe 54
{n, )2) Mn 54
3.1. Introduction
The (n, a.) and (n, p) reactions induced by fast neutrons
from a nuclear reactor are usually referred to as threshold reactions.
This is something of a misnomer since in many cases there is no
energy threshold as the reactions are exoergic. However, a
threshold exists insofar as emission of charged particles is normally
prevented by the Coulomb barrier below excitation energies of a
few Mev.
Threshold reactions are of great importance in reactor
technology and in the production of radionuclides. They are
commonly used to monitor fast fluxes [for example, the m58(n, p}Co
58
reaction] and to determine the energy spectra of unknown fluxes.
Their occurrence in structural materials, moderators or coolants
leads to undesirable effects, such as the weakening of metals by the
growth and diffusion of gas bubble~(l 5 ), or the accumulation of
activity or of neutron 1poisons •. A knowledge of the cross sections
of such re3.ctions is clearly vital, not least in the economic production
of artificial radionuclides.
The work here described was primarily concerned with
value of the cross section for fissioJl. neutrons of the reaction 56 53 .
Fe (n, a.)Cr , notably from the standpomt of its use in reactor
structures •. Cr53 is stable and measurement of the cross section

55.
was made by direct estimation of the hel~um produced in iron
samples subjected to a known neutron flux. [This method can be
applied to all (n, a.) reactions with stable products, provided that
enough helium results to be measurable]. This important cross
section has not been previously experimentally determined; the value
folUld in the literature is an extrapolated one [e.g. (Z4 ), (137 )]. This
extrapolated value and a value derived from a theoretical excitation
flUlction of Bullock and Moore (ll 6 ) are discussed below.
Irradiation of samples of iron of natural isotopic
composition led to the measurement of the average cross sections of
the reactions Fe54
(n, a.)Cr51
and Fe54
(n, p)Mn.54
• The results obtained
are compared with previous results [in ·the case of Fe 54
(n, a.), only
one previous measurement seems to have been reported] and with
values obtained by integration of their excitation functions.
3. 2. AverAge cross sections, cr A fission spectrum of neutrons has an energy range from
zero to about ZO Mev. Their distribution as a function of energy E
is well represented by the expression
N(E) = e- E sinh JZE --------- (1)
To calcuiate the rea.ct:.on rate per atom of target. R, one also needs
to know the way in which the cross section, CT"(E). varies with
energy, i.e., the excitation function for the reaction. One can say
1 ~(E)N(E)dE 0
R= --------- (2)
The average cross section for a fission spectrum of neutrons, ~,
is defined as the constant cross section which will give the same
reaction rate:

56.
R = crJllON{E)dE --------- (3) 0
or CT" = J~ (E) N{E) dE 0
(4)
100N(E)dE
0 . The total flux distribution in a reactor is not of course r~presented
by equation (1 ). but contains a much larger proportion of low energy
neutrons due to scattering. However, the equivalent fission flux, Fe,
say, for a reaction with a threshold of several Mev, where there is
little distortion of the flux from that represented by equation (1 ), may
be used to calculate the proportion of neutrons in a given energy
range. say E 1 to E2.:
Fe l Ez e- E sinh ..{?:r dE .. E
1 loa e- E sinh ..rzr dE ----(5) =
Hughes(l 9 ) and Mellish(ZS) have shown that it is probable that the fast
flux in a reactor is very close to a fission flux given by equation (1 ),
above two or three Mev.
Until fairly recently. measurements of C!i- for various
threshold reactions suffered from the lack of an agreed standard
or reference cross section: e. g. see Rochlin(l6
). However,
Mellish (l?) has shown that many apparently discordant results are
iA reasonable agreement if they are normalized to a value of 60 mb.
for the reaction s3Z(n, p)P3Z. Boldemann (lS) quotes the following
values of cr calculated from their respective excitation functions:-
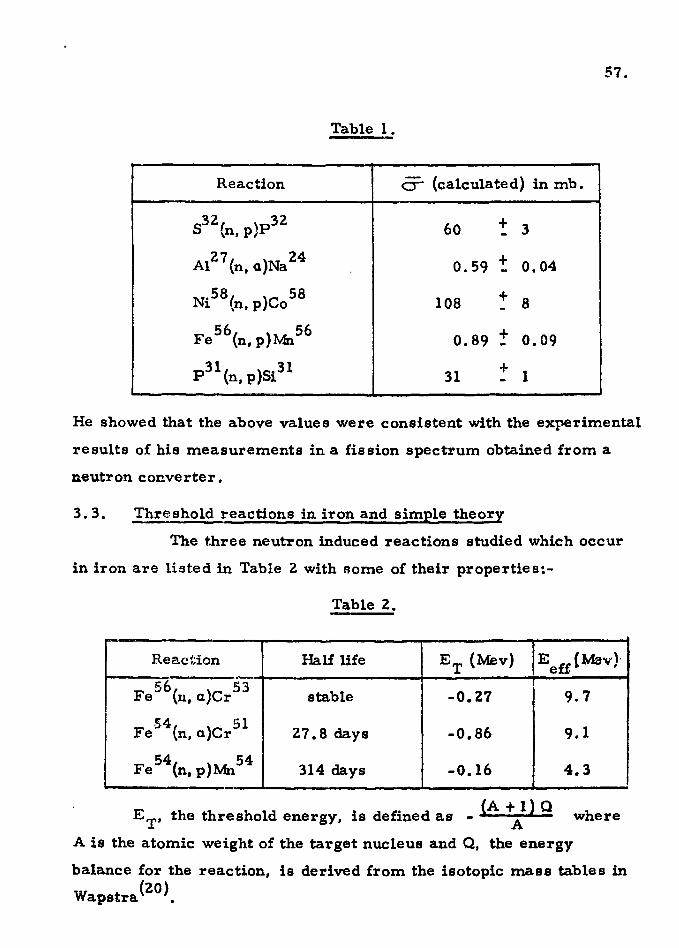
57.
Table 1.
Reaction c:r (calculated) in mb.
53z, \p32 60 + 3 ,n, p, -AI
27 {n, a)Na
24 0.59 + 0.04 -
N.58( )C 58 1 ,n, p o 108 + 8 -Fe56(n, p)Mn56 0.89 + 0.09 -p31 (n, p)Si 31 31
+ 1 -He showed that the above values were consistent with the experimental
results of his measurements in a fission spectrum obtained from a
neutron co:c.verter.
3. 3. Threshold reactions 3n iron and simple theory
The three neutron induced reactions studied which occur
in iron are listed in Table 2 with Rome of their properties:-
I-;: ~
54 Fe
Fe 54
action ·-
( \c 53 n, a1 r
{n, a)Cr 51
(n, p)Mn 54
-
Table 2.
Half life ET {Mev) IE (Mevl· ef£ '
stable -0.27 i 9.7
Z7.8 days -0.86 9.1
314 days -0.16 4.3
. {A+ 1) Q ET' the threshold energy, is def:tned as - A where
A is the atomic weight of the target nucleus and Q, the energy
balance for the reaction, is derived from the isotopic mass tables in
Wapstra (ZO).

58.
Negative values indicate exoergic reactions but the
excitation of the compound nucleus from neutrons of low kinetic
energy is not sufficient to overcome the potential barrier to charged
particle emission. The probability of penetration of this barrier, or
penetrability, P, is given by Bethe (21 >as
. [( 4z Ze 2 fM") f -1 (E )i (EB )~ 1.1 _ ~B)~)·}- (6) P = exp - r 11 v ZE l cos B' - lJ
where z :: charge on emitted particle
E = energy of emitted particle
M :: mass of emitted particle
z = nuclear charge of imal nucleus
B = barrier height
e =· electronic charge
1i = h/2'tt" (h is Pla.DCk 1s constant)
The height of the barrier, B, is equal to the electrostatic
potential energy of the particle and residual nucleus at contact, and
is shown by Hughes (22 ) to be given by
B = O. 96 zZ
{A)lf3
Hughes(23
) introduced the concept of the Effective Energy, Eeff'
which he found useful for correlating and predicting values of 5=- for
(n, a.) and (n, p) reactions. The only previously known value of Ci- for
the reaction Fe56
(n, a.)Cr53
was based on Hughes 1 extrapolations.
Using. equation (6 ), P may be calculated for various reactions. This
is shown diagrammatically in Fig. 12(a) with the neutron distribution
function N(E). Assuming that the c~oss section is proportional to P,

FIGURE lZ.
(a) The penetrability fnnction and the effective
enersy, E f! .e
(b) The variation of (Eeff..:....§T) with atomic number Z,
for (n, p) and (n, a.) reactions
59.

0
90
I
~ ·t ~ 70-1-. ll: •
~
... 0 .. ~ 40-~ 0 .... "'l
30
20-
10-
28
0 2 3 4 5 6 1 8 9 ~ H a B M E." -Er FORfn.p)REACTIONS,IIew

the reaction rate will be given by P x N{E) which is also plotted
in the figure as the weighted yield curve. E eff is drawn where area A
is equal to area B, and can be expressed as the threshold energy
above which the reaction occurs with unit penetrability, while neutrons
of lower energy contribute nothing to the reaction. E eff is always
greater than ET and (E eff - ET) is independent of ET. Hughes 1 plot
of (Eeff- ET) against Z, the atomic number of {here) the target is
shown in Fig. 12{b) for {n, a.) and {n, p) reactions. Now it would be
possible from N{E) and (Eeff- ET) to predict the cross section Cf if
the value at unit penetrability, c:::r- , were lmown. 0
fooO N(E)dE
s: N{E)dE eff ------(7)
Now o-0
, on a simple treatment, should 'Qe proportional to the
nuclear area., ."Tf R2
, and in general will be some fraction of it
because of competing modes of decay in the compound nucleus. The
nuclear si:r.e is also proportional to {A)2/3. If now the experimental
values of a=- are platte~ against Eeff' the ~ints lie on a curve which
is the integral of the fission spectrum, JE N(E) dE, in accordance
with equation (7) and the assumptions about Eeff" The quantity
plotted (see Fig. 13) is not the observed ·cross section cr- but a 2~ -
factor -~ ZJ is introduced to normalize o- to a standard sized (A) 3 2L
nucleus for which (A)'~ = 25, i.e. A= lZS.
Thus from this curve we can derive unknown values of
a=- from Eeff' obtained ultimately from the function for P, equation (6).
By this method we are usually within a fa.ctor of two of the observed
cross section.

FIGURE 13.
The variation of the average cross section, ~.
(normalized to a standard nucleus of atomic
mass of 25), for (n, a.) reactions, with Eeff
61.

10
•I
·001
•0001
2
16 X 2 5 (mb.) [Aps
4
• 0
... ......
' ' ' ' ' ' ' .... ....
0 ....
0 DO-A TAR C E T }
EVEN-A II
.... ....
·.
• '··
0
10 12
'·
' ...... ' '
14
....
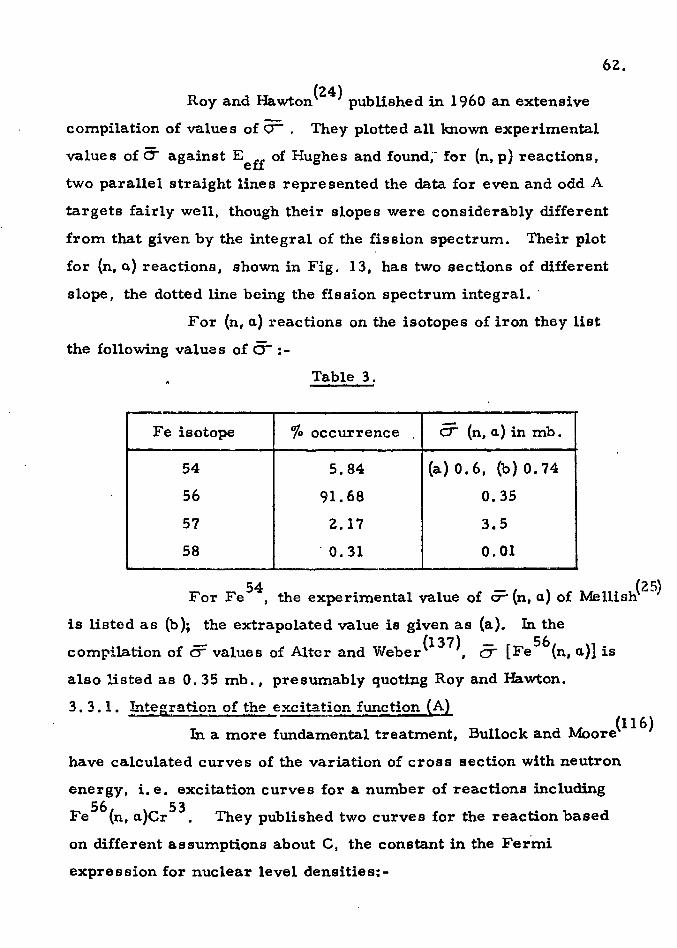
62..
Roy and Hawton (2.4
) published in 1960 an extensive
compilation of values of o- . They plotted all known experimental
values of C5- against Eeff of Hughes and found~- for (n, p) reactions,
two parallel straight lines represented the data for even and odd A
targets fairly well, though their slopes were considerably different
from that given by the integral of the fission spectrum. Their plot
for {n, a.) reactions, shown in Fig. 13, has two sections of different
slope, the dotted line being the fission spectrum integral. ·
For (n, a.) reactions on the isotopes of iron they list
the following values of a-:-Table 3.
Fe isotope ':fo occurrence Ci (n, a.) in mb.
54 5.84 (a) 0 • 6, (b) 0. 7 4
56 91.68 0.35
57 2..17 3.5
58 . o. 31 0.01
54 - ( ) Me . (2.5) For Fe , the experimental value of c:r n, a. of lhsh
is listed as (b); the extrapolated value is given as (a). In the
compilation of a= values of Alter and Weber(137
), cr [Fe56
(n, a.)] is
also listed as 0. 35 mb., presumably quoting Roy and Hawton.
3. 3. 1. Integration of the excitation fU-'lction (Al (116)
In a more fW1damental treatment, Bullock and Moore
have calculated curves of the variation of cross section with neutron
energy, i.e. excitation curves for a number of reactions including 56 53
Fe (n, a.)Cr . They published two curves for the reaction based
on different assumptions about C, the constant in the Fer.mi
expression for nuclear level densities:-

The excitation function for the Fe 56
(n, a.) reaction
(Ref.ll6)
63.

0 Gl N
0 oO N
I I
0 .. N
I
I I
' , ,
\
' ' ',
0
"' ..
' ' ' .... ....
0 0 •
....
0 Gl
0 oO
' ....
0 ..,
.... .... .... ....
0
"'
.... ,
8 0 Ill
........
0 ...
' '
' ',
0 N
' ' \ \
I
. . I
0
0 N
QO
all
r--
.0
Ill
..,
.....
"' "";"' .. :::E ..__ )oo
"' a: 0 .....
z .....
z 0. 0
a: 1-';)
'" CID z
...
.0
"'
"' ,.,
"'
0

64.
f(E) = C exp (2 ..JaE) (8)
where a and C are constants. In the first, they applied values of
C, derived strictly for odd atomic masses only, by Blatt and
Weisskopf(117
); in the ~econd, they modified this so that
iCODD-ODD = CODD-EVEN = SCEVEN-EVEN- {9)
The second of their two excitation functions is shown in Fig. 14.
From this we can derive a value of o- for the reaction. The
probability of finding a neutron of energy. E per Mev can be
calculated from the expression
N(E) = 0,48e-E sinhv2E ------- (10)
By multiplying the cross section at various energies by this
probability, a weighted yield curve is produced which on integration
cr c Jo cr(E) N(E)dE 0
N(:J;;) dE
gives a-, since 00
jJoO
and the neutron probabilities are normalized for r N(E)dE to be 0
unity. An empirical formula which also has been used to represent
the fission neutron energy spectrum by Hinves and Parker(135
),
based on the experimental work of Granberg ~~136 ) is
N(E) = 0.4572 exp (-F/0.965)sinh(2.9E)i --- (11)

65.
The following Table 4. may now be drawn up; the
use of both equations 10 and 11 is tabulated.
Table 4.
E o-(E) N(E) per Mev N(E) per Mev IO'(E)x N(E) p-(E)x N(E) in Mev inmb. Equation 10 Equation 11 Equation 10 Equation 11
6 ~1 1.89 X 10 -2
1. 84 X 10 -2
0.0189 0.0184
7 8 9.31 X 10 -3
8. 77 X 10 -3
0.0745 0.0702
8 20 4.42 X 10 -3 4.10 X 10
-3 0.0884 0.0820
9 45 2. 07 X 10 -3
1.89x10 -3
0.0932 0.0850 .. -4 -4 10 80 9. 53 X 10 8.56 X 10 0.0762 0.0685
11 115 4.38x10 -4
3. 84 X 10 -4
0.0504 0.0442
12 150 l.99xl0 -4
1. 70 X 10 -4
0.0298 0.0255
13 185 8.95x10 -5
7.48 X 10 -5
0.0165 0.0139
14 218 3.95x10 -5
3. 26 X 10 -5
0.0086 0.0071
15 235 1.75x10 -5 1.41 X 10
-5 0.0041 0.0033
16 237 7.73x10 -6 6.07 X 10
-6 0.0018 0.0014
17 225 3.9 X 10- 6 2.6 X 10- 6
0.0009 0.0006
Below 6 Mev, o- becomes negligible, while above 17 Mev N{E) becomes
so small that the product N{E)<::r(E) becomes negligible.
Graphical integration of the weighted yield curves giveo
the values of iT [Fe 56
(n, a.)] as
(i) 0. 46 mb. (from Equation 10)
(ii) 0. 42 mb. (from Equation 11)
Thus to summarise, the simple theory of Hughes developed by Roy and
Hawton(24
) leads to an estimated value of o= [Fe56 (n, a.)] of 0. 35mb. i

66.
(116) the theoretical treatment of Bullock and Moore leads variously
to the values of 0.46 and 0.42 mb., according to the neutron
distribution used.
A similar treatment of the excitation functions for
Fe54
(n, p) and Fe54
(n, a.), but based on published experimental work,
is given below in the relevant sections (3. 9.l.and 3. 9. 2. ).
3. 4. Measurement of helium in the irradiated iron .~~~~~~~~--~~~~~~----
The samples were in the form of either thin (about 0. 01 in.)
pure sheet iron of natural isotopic composition, or spheres of 0.1
to 1 gramme. This amount of iron was dissolved within an hour by
a cold aqueous saturated solution of potassium cuprichloride, provided
that the iron was agitated to prevent the accumulation of thick copper
deposits on the surface. Nash and Baxter(26
) list various iron
solvents but K2
CuC14
was found very satisfactory especially since no
hydrogen was evolved, and a clear solution was obtained. The copper
originally displaced was redissolved by the cupric ions, the net
effect being a partial reduction of the solvent to the cuprous sta:te ..
At first, the K2
CuC14
solution contained about l01o mercuric• chloride
as this mb::ture dissolved iron a little faster than K2
CuC14
alone, but
the drawback of a grey sludge which formed led to the adoption of
K2
CuC14
solution alone.
3.4.J .. The dissolution flask used in this work is shown in Fig. 15.
·The flask normally contained about 100 cc of reagent. Two or three
samples or blanks were placed in the sample arms, connected to the
flask by an extension tube, to protect the samples from accidental
splashing with reagent during the outgassing of the solution. A small
glass enclosed iron slug (not shown in the figure) was placed at the

67.
FIGURE 15.
The Sample Dissolution Vessel

z 0 .... ;::) ..J 0
"'
.,

68.
bottom of the flask. This was used for stirring the solution and
agitating the sample, and was also helpful in outgassing the solution
when the flask was first evacuated.
3.4.2. Experimental
With tap T2
open and T 1
shut, the appa_ratus was
evacuated through T3
, the water t11ap T and taps T4
and T5
• Dissolved
gas was rapidly evolved by rolling the glass enclosed slug up and
down the flask walls with a magnet. All traces of helium were
removed from the solution by flushing with pure oxygen as follows.
Taps T 3
and T 2
were closed, and T 1
opened extremely cautiously
to allow oxygen to bubble slowly from the tip of the tube immersed
in the solution. By careful adjustment of T 1
(in conjunction with the
drawn-down tip of the tube) an excellent flushing action was achieved,
the oxygen bubble spreading from wall to wall across the flask in its
passage to the surface. When an oxygen pressure of about 1. 5 em.
was registered on the manometer, T 1
was closed and the flask
evacuated through T 3
with trap T surrounded by liquid nitrogen.
This flushing procedure when repeated a further nine
times would·remove all the atmospheric helium from the flask and
solution. The effectiveness of this flushing and the purity of the
oxygen was then tested by flushing the flask nine times to 1. 5 em.
pressure, and allowing the oxygen to bubble through the ventil V into
the circulating system after each of the nine flushes, tap T5
being
closed. The oxygen was condensed on the cooled charcoal of the
circulating system to prevent a back pressure building up in the
circulating system. This oxygen was then examined for any traces of
heliwn by operation of the apparatus as P.reviously described. If the

69.
helium found was not negligible compared with the expected helium
content of the sample to be dissolved, then the oxygen was further
purified.
Having achieved a successful oxygen blank, the sample
was drawn down magnetically into the solution. It was stirred by
positioning a small intermittent electro- magnet (operated from the
voltage supply to the circulating system 1s magnetic pump) ~gainst
the flask about two inches above the bottom. When the sample was
completely dissolved, the solution was flushed out in exactly the same
manner as that described above for the oxygen bl?."n'k. The helium
content of a known weight of target was thus determined.
3, 5. Neutron flux measurements
Most of the neutron irradiations were done at Harwell
in B. E. P. 0. and the flux monitored by the pile operators with nickel
[Ni58
(n, p)Co58
] and cobalt (co59(n, -y)Co60 ] for fast and thermal
neutrons respectively. Two of the batches of samples were monitored
for fast neutrons by the author with the s32(n, p)P
32 reaction.
About 100 mg. of LiS04
• H2o was encapsulated in a silica
tube and irradiated alongside the iron samples. After irradiation they 3- 2.-
were broken open under a solution of (P03
) and (HP02
) carriers
in dilute hydrochloric acid. Bromine water was added, the solution
was stirred and warmed nearly to boiling point, It was then carefully
transferred to a volumetric flask: the beaker was washed out
several times with acidified carrier solution and the washings added
to the flask. The flask was made up to the mark and reweighed to
obtain the weight of P32
solution. A suitable weight of this solution
was then taken and diluted in a 50 cc flask with carrier solution and

70.
a 10 cc aliquot counted in a standardized liquid Geiger counter.
T ib, hen the fission flux, L in neutrons per sq. em. per
minute, will be given by X.t
- T( -X.T) -A= e. f. Ns. a-. 2 1 - e e ----'(12.)
where A is the measured activity (c. p.m.)
e is the counting efficiency
f is the fraction of the activity counted
N is the number of s32 atoms
6 - · . 532.( )P3Z a- 1s the average cross sect1on for n, p
X. is the decay constant for P32
(half life 14. 55 days)
T is the irradiation time
tis the time from irradiation to counting.
- 32. 32. . The value of a- for the S (n, p)P reactlcn is often quoted as
60 mb. or occasionally as 65 mb.; this value is commonly used as
a reference cross section for all other threshold reactions, as indeed
we are using it here for reactions in iron. Values of the fast flux
calculated by Harwell are referred to Ci as 65 mb. (2.7 ) so although
60 mb. is perhaps more commonly used, all fluxes and cross sections
in this work are referred to u as 65 mb. unless noted otherwise.
3.6. . 56 53 The reac!!_on Fe (n, a.JC;:
3. 6.1. Irradiations and helium results
Initially, samples of pure sheet iron of natural isotopic
composition were irradiated. The results are collected in Table 5
below. The fast neutron dose measured by Harwell is termed DH'
and that measured at Durham by D0
; the thermal dose is DT.. The
agreement between DH and n0
is excellent in view of the different

71.
standardization and counting techniques involved (using nickel and
sulphur monitors respectively).
The value of cr- for Fe (n, a) reactions is calculated from
where NHe is the number of helium atoms measured,
NFe is the number of iron atoms irradiated,
and DF is the fission neutr.on dose (neutrons cm:2
).
Table 5.
No. Weight
Type Code He content
DH (g.) (cc /g. )
0 0.905 Nat. Fe Blank 1 -8 O.Z7xl0 0
0 1. 60 Nat. Fe BlankZ -8 0.33xl0 0
-8
Dn
1 0.564 Nat. Fe 55A(i) lZ.ZxlO 3.93xlo
17 IJ4. OZx 1017 -8 z 0.531 Nat. Fe (ii) 17.7xl0 ,
3 0.569 Nat. Fe 55B(i) -8
Zl.4xl0 3. 99 X 10
17 4.14x 10
17 -8 4 0.498 Nat. Fe (ii) Z.llxlO
(13)
DT
4.79x1Cf7
4.73xlo1?
The results called Blanks 1 and Z were preliminary
measurements of the initial helium content of the unirradiated foil.
It will be noticed that this was quite small, being about 3 x l0-9cc/g.
The iron foil thicl<..'"less was about 0. 01 inches. Samples 55A and SSB
were two rolls of foil each divided into (i) and (ii) for duplicate
analysis. The helium contents of these halves do not agree well and
their sums for A and B are not in agreement either. No precautions
against thermal neutron reactions or recoil alphas from the

72.
environment were taken, so it may be that part of the disagreement
is between the outside and inside halves of the roll. It seems likely
that result 4 is incorrect, since in the light of following measurements,
it indicates a value of CJ much too small. The thermal flux almost
certainly accounts for the inconsistent results. Although it was
requested that the samples be cadmium wrapped before irradiation,
this was not done. Now the cross section for slow neutron produced
alpha particles in boron from the reaction B10{n, a.)Li
7 is at least
106
times as great as the fast neutron cross section in iron
(760 barns to less than 0. 7mb., say), so that the presence of a boron
impurity of only one part in 107 will produce a 10% excess of helium
when the slow neutron flux is the same as the fast neutron flux.
Another question which arises in the presence of a
considerable slow flux is the magnitude of the cross section for the
reaction Fe 56
(n, a.) with slow neutrons. Some charged particle
reactions are known to occur even with such low energy neutrons.
The reaction has been investigated by study of tracks in iron coated
or iron loaded nuclear emulsions. Hanni and Rossel(llS) claimed to
find a cross section of 40 ~ 20 mb. (119)
Longchamp repeated the
work in 1952 and expressed his results as 0.1 mb. ~ o- ~.0. 24mb.
Faraggi{120
) in attempting to decide between these results, failed to
observe the reaction and ascribed pre·vious values to lack of
discrimination between alpha particles and protons in the emulsion. -2
He concluded that o- was less than 10 mb. It would therefore seem
that the reaction is not of significance.
Unfo1·tunately, the second set of irradiations, set out
below in Table 6, were commenced before the results of Table 5 had
been obtained in full, and again the cadmium wrapping was omitted
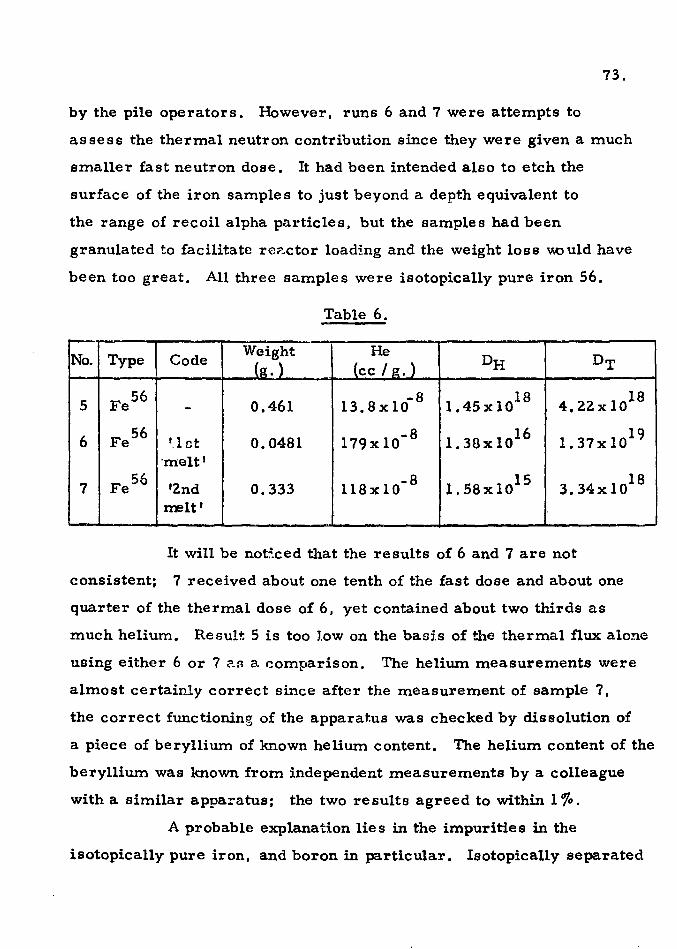
73.
by the pile operators. However, runs 6 and 7 were attempts to
assess the thermal neutron contribution since they were given a much
smaller fast neutron dose. It had been intended also to etch the
surface of the iron samples to just beyond a depth equivalent to
the range of recoil alpha particles, but the samples had been
granulated to facilitate rc<>:.ctor loading and the weight loss \\0 uld have
been too great. All three samples were isotopically pure iron 56.
Table 6.
No. Type Code Weight He
DH DT (g.-) (cc I g_.J
5 Fe 56 0.461 -8 1. 45 X 10
18 4,22xio
18 - 13.Bxl0
6 Fe 56 1.1 ct 0.0481 179xlo- 8 1.38xlo
16 1.37xlo
19
·melt'
7 Fe 56 12nd 0.333 118xlo- 8 1.58xlo
15 3. 34x 10
18
melt'
It will be not~ced that the results of 6 and 7 are not
consistent; 7 received about one tenth of the fast dose and about one
quarter of the thermal dose of 6, yet contained about two thirds as
much helium. Result 5 is too low on the bas:i.s of the thermal flux alone
using either 6 or 7 ?.s a. comparison. The helium measurements were
almost certainly correct since after the measurement of sample 7,
the correct functioning of the apparatus was checked by dissolution of
a piece of beryllium of known helium content. The helium content of the
beryllium was known from independent measurements by a colleague
with a similar apparatus; the two results agreed to within l'?o. A probable explanation lies in the impurities in the
isotopically pure iron, and boron in particular. Isotopically separated

74.
elements are known to have high impurity levels, as Boldeman (l8
)
found in titanium and Martin (28 ) has pointed out. Recoil alphas were
of no importance, since result 6 was obtained on centre of a larger
roughly spherical iron sample, the outer layers of which had been
dissolved in an abortive measurement.
The third series of measurements, listed in Table 7,
show better agreement.
Table 7.
No. Type Code Weight He
DH Dn ~mb.) tTn(mb.) (g.) (cc I g.)
I -8 8 Nat. Fe I c (i) 0.437 4.39xl0
tJ.l9x1d7 17 0.352 0.354
3. 94x 108 3.18x10
9 Nat. Fe ' (ii) 0.457 J 0.309 0.310
10 Nat. Fe E (i) 0.454 -8 (0. 64) (o. 64) 8. 59x 10
3.35x1d7 17
-8 ~- 32x 10 11 Nat. Fe (ii) 0.452 6. 68x 10 (0. 50) ~-0. 50)
12 Fe 56 D 0.739 -8
4.92x10 17 17
3.03x10 3.15x10 0.406 0.390
13 Fe 56 Doun- 0.0383 -6
6.19xl0 4.02xlo19
0.384 reay1
14 Fe 56 Doun- 0.224 -6
6. 46x 10 4.02x1o19 0.402
reay2
15 Fe 56 Blank 0.126 <5xlo- 10 - -
Samples 8 to 12 were irradiated in B. E. P. 0., and were
wrapped in thin iron sheet and sealed into an evacuated silica tube
before irradiation. Samples 8, 9 and 12 were also wrapped in.
cadmium sheet, but not 10 and 11. 10 and 11 produced roughly twice
as much helium on irradiation. 10 consisted of the outer layers, and
11 the inner layers, of a single sample of rolled sheet. From their

75.
helium contents it appears that some shielding effect was present.
Samples 8 and 9 were produced by cutting the roll across the middle so
the smaller helium content variation cannot be due in their case to an
effect of this type. Samples 13 and 14 were specimens of Fe 56
irradiated in the fast reactor D. F. R. at Dounreay. This reactor
has a flux with virtually no thermal neutron component.
AU the samples B - 15 were etched before dissolution
with sulphuric acid to remove about 5 mg. cm.-Z. Sample 15 was a
blank on the iron 56 and showed a negligible initial helium content.
3.6.Z. Conclusions
Results 1Z, 13 and 14 are in excellent agreement about
the value of 0. 39mb. for the reaction Fe56
(n, o.)Cr53
• The agreement
achieved between irradiations in different reactors is a solid ground
for the reliability of the result. However, it is surprising that the
results B and 9 of natural iron irradiation should be rather smaller
(an average of 0. 33mb.). Table 3, given earlier in Section 3. 3.,
indicates that the contributions of iron 54 and 57 to the reaction would
lead to a higher result for u(n, a.) for natural iron. Fe57
, like Fe56
,
gives a stable chromium isotope by {n, a.) reaction and so the extra
polated value derived by Roy and Hawton (Z4 ) cannot be determined
experimentally except by a helium analysis method on separated or
enriched Fe 57 . However, Fe 54 gives Cr51
by (n, o.) reaction and the
reaction cross section has been determined by :Mellish~- (ZS) as
0. 74 mb. Since this cross section is of interest to the interp;retation
of the helium measurements, and since Mellish 1s result appears to be
the only reported value, the measurement was repeated. The method
and results are described below in the next section (3. 7. ). It suffices
here to say that the result was higher than that of Mellish and so th~.
problem of the result 8 and 9 remains.

. ..0 I-
Table 8 .
Helium contents, neutron doses and cross sections for iron samples
'
T Weight j! He content - - I No. Type Code ! (e.-) (cc I
2• ) DH Do DT v H(mb.) lJD(mb.)
I i I -8' I 0 1~ Nat. Fe. Blank 1 I 0. 905 I 0. 27 x 10 - 1 - - - - 1
I I -8 I 0 Nat. Fe Blank 2 1. 60 I 0. 33 x 10 - l - - - - I
( ~ - 8~ ~ 1 Nat. Fe i) 55A 0.564 12.2 x 10 l? 17 17 2 INat.Fe(ii) 0.531 17 _7 xl0-8 3.93x10 ]4.02x10 4.79x10
· ( ) I -8~ 3 'Nat.Fe i 55B 0.569 21.4x10 17 17 17
41Nat.Fe(ii) 0 _498 2 . 11 x 10-8 3.99x10 4.14x10 4.73x10
56 I -8 18 18 5 Fe 0.461 j13.8x10 1.45x10 - 4.22x10
56 ' -8 161 19 6 Fe
1
0.0482 1179 x 10 1.38 x 10 - 1.37 x 10 56 -8 15 18
7 Fe
1
0.333 I 118 x 10 1.58 x 10 - 3.34 x 10
8 Nat.Fe(i)'C' 1
o.437 j4.39x1o-8
17l
17 0.352 0.354
9 Nat.Fe(ii) ~0.457! 3.94x10-83.19x10 3.18x10 C~wrapped 0.309 0.310
10 Nat. Fe (i) 1E 1 0.454 8.59 x 10⁻⁸
17) 17 (0.64} (0.64)
11 Nat. Fe (ii) 0, 452 6. 68 x 10- 8 3 · 35 X
10 ) 3 · 32 x 10
(0. 50) (0. 50) 56 -8 171 17 12 Fe 'D' 0.739 4.92x10 3.03x10 3.15x10 Cdwrapped 0.406 0.390 56 -6 19
13 Fe Doun- 0.0383 6.19x10 4.02x10 -· 0.384
56 reay 1
14 Fe " 2 0. 224 6.46 x 10⁻⁶
4. 02 x 1019
-· 0.402 56 -10 i
15 Fe Blank 0. 126 1
< 5 x 10 - j ·· -

It must be said that the earlier results 1 to 7 are of
little value. In the absence of Cd shielding, the most likely
interpretation is the presence of variable amounts of impurities,
most probably boron.
77.
Something must be said of the different neutron spectra
of B.E.P.O., a graphite moderated thermal reactor and D.F.R.,
a fast reactor. It could be argued that the 'harder 1 spectrum of
D. F. R. raises results 13 and 14 above 8 and 9, while lZ is larger
than it ought to be because of residual thermal neutron and epi-thermal
reactions with boron impurities. This is to place· too much emphasis
on the one result lZ, while ignoring the agreement of 8 and 9 with
13 and 14. Also the spectra of B.E.P.O. and D.F.R. are known to
be quite close to a fission spectrum at least up to 10 Mev" from about
3 to 4 Mev, [for example, Wright (150 )] .
Measurement and calculation of pile neutron spectra
are not much better than 10% so it is rather fruitless to discuss the
anomalie_s in the results quantitatively in terms of the spectra
involved.
To summarise, a value of a-[Fe56
(n, a)] of 0. 39 mb. has
been fou.."ld, which while not entirely satisfactory, represents a vast
improvement on the previous position where only a dubious
extra.polati.-;::l e:ds~ed.
Great accuracy cannot be attained in the measurement
of small average cross sections but the scatter of the experimental
values and the agreement between B. E. P.O. and D.F.R. is good.

78.
3.7. 54 51 .
The Fe (n, e1)Cr reaction
The K2
CuC14
solution containing sample 4 was washed
out of the dissolution vessel with concentrated hydrochloric acid and
added to the similar residues of sample 3. This gave a joint solution
of the known weight of irradiated iron called 155B 1• The other
activities present besides Cr51
were Fe 59, Mn54
and a little Fe55
;
all shorter liv~d isotopes like Mn56
having decayed away in the. month
since irradiation. It would have been better to·. have used the solution
of samples 8·and 9 which had been cadmium wrapped, but this
investigation was begun before 8 and 9 had been irradiated. This
would have avoided any danger of production of Cr51
by Cr50
(n, y)
reaction with thermal neutrons on any chromium impurity in the iron.
The possible influence of this reaction is discussed later.
Cr51
decays by electron capture and weak y emission;
it exhibits a photo-peak at 0. 32 MeV on a Nai (Tl) crystal
scintillation counter. This was completely swamped by the Compton
and back-scatter peaks of the other activities which are present in
much higher concentrations. It was necessary therefore to separate
the Cr51
activity to measure it. The procedure for separation of
chromium is based on that of Brookshier and Freund(3o).
3. 7. 1. Chemical procedu:t"e
(l) A kno·.vn fraction of the iron solution vv-a.s pipetted (5 cc)
into a beaker ccnta:i.n~.ng 50 mg. of Cr·3 + carrier. NH40H was added
until the copper hydroxide redissolved as the cupramine complex,
and the solution was boiled briefly and cooled.
(2) After filtering and discarding the filtrate, the precipitate
(iron and chromium hydroxides) was washed into a beaker with

79.
dilute H2so4 . Boiling with s2o
8- converted the Cr (ID) to Cr (VI) and
the solution was cooled and NaOH added. The Cr (VI) solution was
filtered to remove the Fe(OH)3
and evaporated down to ZO cc,
{3) The solution was acidified with HCl and buffered to
pH 1. 7 "t 0. 1 (pH meter) with NaCl- HCl buffer. After cooling to
below l0°C, the solution was transferred to a oeparating funnel,
50 cc ethyl acetate were added and a few drops of 5'?o H2
02
and
the solution shaken to extract the viol~t perchromic acid into the
organic layer.
(4) The extraction was repeated and the organic fractions
combined; then the chromium was stripped by addition of NaOH and
back extraction into the aqueous phase. This. solution was evaporated
to small volume and made up to ZS ml. in a volumetric flask.
The chemical yield of the separation was determined by
titrating an aliquot of the separated Cr (VI} solution, added to
acidified KI solution, with sodium thiosulphate. The titration was
carried out according to the method of Voge1(3l).
The purity of the separated Cr51
was checked by
examination of its y spectrum in a hundred chaimel pulse height
analyser co:ru-:.ecte-:1 to a Nai crystal. Negligible high energy componer..ts
were detected and t~e shape of the spectrum was in excellent
agreement with that given in Heath (3Z). Routine counting was done in
a tl/z inch well-type crystal using a s:l.ngle chaimel to count the
photo-peak. The haU Efe was checked and found to be in good agree
ment with the accepted value of Z7. 8 days. The crystal had previously
b l 'b d f c 51 d . d . 1 . dit' (lS) een ca 1 rate or r un er 1 entica operating con 1ons •
3.7.Z. Results
The cross section cr- for the production of Cr51
will

80.
be given by
----------------(14)
where I is the absolute disintegration rate of Cr51
in the iron solution
t . . N . f F 54 · con ammg Fe54 target atoms o e , at a time t after an
irradiation of duration T in a fiux density of ~ .
Also A 100 100 1 I=--x-x-x- ------- (15)
f y c p
where A is the measured activity of a fraction f of the extracted
Cr51
, obtained in chemical yield, y"/o. Also C.: is the counting
efficiency {"/o) and p the fraction of the initial irradiated iron
solution.
Two extractions were made, and the values of c;- for
Fe54
(n, a.)Cr51
found were
(a) cr = 1.52mb.
(b) cr = 1. 49 mb.
Mean value = 1. 50 mb.
. - 32 32 -Relative too for S (n, p)P of 60 mb., cr = 1. 38 mb.

81.
3. 7. 3. Conclusions
The accuracy of the above results is not high: the counting
relied on a previous calibration and is accurate to about 5%. Errors
in the chemical determinations and dilutions probably amount to 3o/o
and in the flux determination to about 5o/o. The total accuracy is
thus better than lO'?o {standard error 8'?o).
Mellish et al. (l5
) determined this cross-section as 0. 74mb.
[relative to s32(n, p) as 60 nib.], or 0. 80 mb. [relative to s32 (n, p)
as 65 mb.]. Mellish (whose work seems to be the only published
value) measured 5- in a fission flux under two conditions; in the
first, the thermal flux and the fast flux were approximately equal
(inside the slug) and, secondly, in an irradiation position where
the fission flux was only 0.17 of the thermal flux. The identical
results showed thermal reactions were not significant, The thermal
neutron cross-section for Cr50
(n, "V)Cr51
is 16 barns(33
) and the
isotopic abundance 4. 3o/o. Thus for a thermal dose equal to
the fast dose (as in samples 3 and 4) the presence of one part
chromium in a thousand of iron would produce a spurious fast
cross-section of about 0. 7mb. However, analysis of the iron by
the suppliers, United Steel, showed less than 5 p. p.m. chromiu..--n.
Thus this is not the reason for our larger answer of 1. 5 mb.
It should be pointed out that since 1958 1 the date of Mellish's
publication, most of his results have proved to be rather low.
This is touched upon in the next section, on Fe54
(n,p)Mn54
.
Another independent result would be instructive.

3.8. 54 54 .
The Fe (n, p)Mn reaction
Partly because it was convenient to perform (having a
solution which had received a known neutron dose) and partly as a
check on the Fe54
(n, a.)Cr51
result, it was decided to measure the
82.
Fe 54
(n, p)Mn 54
cross section. As regards the latter point, it had
been noticed that Mellish (25
) had measured the (n, p;) cross section at
the same time as the (n, a.) and it was instructive to see how the latter
would agree with the result we obtained. Also, Mellish's result(34
)
for the (n, p) reaction of 46 mb. is considerably lower than the four
recent results quoted in Boldeman (l 8 ) which have an average of
62mb., and the two most recent results of 65 and 66mb. (35
• 18
)
seem to indicate a measure of re-evaluation worth investigating.
The results of Martin and Clare(151 • 152 ) of 67 and 68mb. confirm
this upward trend [all values quoted here relative to s32(n, p) as 60mb.].
3. 8.1. (i) By subtractive y-spectrometry
The solution of natural iron samples 3 and 4 showed the
main features of a mixture of Mn 54
and Fe 59
. The continuous line
in Fig. 16 shows the shape of the y spectrum of the mixture. The
contribution of Cr51
is negligible relative to their peak heights.
Peak A is as signed to the 0. 84 MeV peak of Mn. 54
and peaks B and C 59 to the 1.10 and 1. 29 MeV peaks of Fe . 54 59
hl order to count the Mn peak, the Fe component
must be 'peeled off'. An Fe 59 source was prepared by extraction of
the iron from the mixture with di-isopropyl ether in 6N HC1{36>. The
organic layer was stripped with water and evaporated down to a
suitable small volume. The Fe 59
source was then counted on the
multicharmel analyser at exactly the same settings. Both spectra are
plotted on semi-log paper as this allows the Fe 59
component to be
normalized and subtracted by simple superimposition. The Fe 59

83.
FIGURE 16.
59 54 Gamma sp~ctra of Fe and Mn by
2,ulse height analyses

5
4
10
7
5
4
3
2
.... ·~ i i
.f i..:"\!\ ... ·/\ ..... ·· '•
.. ' I .
I , I ;
i
: ,• ,,•'', I 1''•,,:•.: . : ..
I i i I
t.An54+ F,59
SEP~r=t59 THUS:
II
A DIFFERENCE " -·-·-·-
. . ·•. I
'.,.j • r. ··. . ! ··,,··
CHf;NNEL NU&!BEB

94.
source spectrum, shown as the dotted line inFig.l6, is moved on
top of .the unbroken line until the Fe 59
peaks B and C are superimposed.
The Fe 59
curve is then traced through onto the mixed spectrum and
subtraction produces the dashed spectrum of Mn 54
•
The counting arrangement was standardized by.,counting
a Mn 54
solution which had previously been standardized absolutely(38
)
by 411' X-ray-y coincidence counting. The Mn54
spectrum obtained
by subtraction was identical with the spectrum of the. standard Mn 54
.
It will be noticed that the Fe59
peaks do not correspond exactly, but
the effect is small and probably due to variations in amplifier gain.
As a check on the radionuclidic purity of the extracted Fe 59
, a second
extraction was performed on the sample once extracted. The spectrum
of the repurified solution was unchanged.
3. 8. 2.. (ii). By chemical separation of manganese
An aliquot of the solution of irradiated iron was added to
a known amount of Mn. (II) carrier solution (as sulphate) and a little
chromium (m) carrier.
(1) NH4
0H was added until the copper (from the K2
CuC14
reagent) was complexed, and then the solution was filtered. The
precipitate was washed carefully twice to remove all chloride ion
[which prevents precipitation in (2.)] with dilute NH4
OH.
{2) The p:-ecip~.~ate was dissolved in concentrated HN03
, with
a drop of H2
02
if necessary. Solid KC103
was added and the
solution boiled cautiously to precipitate Mn02
which was washed twice
with HN03
and centrifuged.
(3) The precipitate was dissolved in the minimum of HCl with
5 drops of added 5'?'o H2 o
2; ferric iron holdback carrier was added

85.
and the solution taken to dryness to remove HCl. The residue was
redissolved in concentrated HN03
and Mn02
re-precipitated, as
in (2).
(4) The precipitate was washed twice with concentrated HN03
and once with water, then filtered onto a tared glass paper and
washed successively with hot water, alcohol and ether. It was then
dried in a dessicator and weighed as Mn02
. H20.
The Mn02
precipitate9 were counted by dissolution in
dilute HCl, with a little H2
02
, and transfe1· of the solution to a
lllz inch well-type Nai crystal, which was standardized with the
absolutely calibrated Mn 54
solution.
3. 8.-3. Results and conclusions
Relative to 6- for the s32(n, p) reaction of 65 mb. assumed
in the flux measurements, the average fission cross section for
Fe 54(n, p)Mn
54 was:-
By method (i), 3.8.1., (a) 66.4, (b) 65,4 mb.
By method {ii), 3. 8. Z., (a) 72, (b) 72, (c) 71 mb.
Hence mean, relative to s32 of 65 mb. , is 69 mb.
c:.nd ~~ relative to s32 of 60mb., is 64mb.
Thio result is in exceU.ent agreement with recent measurements.
Boldeman(l8
) lists the foHowing values of o- [Fe54
(n,p)], relative to - 32 cr [S (n, p)] of 60 mb ., aftBr correction to the now accepted value of
314 days fer the Mn 54 half life (1 21 ):-
RochliJ16), (1959) 60mb.
Passel and Heath(37 >, (1961) 58mb.
Hogg and Weber(35 >, (1962) 65mb.
Boldeman(18 >, (1963) 66mb.
Since then, Clare et al. (151 ) and Martin and Clare (lSZ) found 67. 5
alld 68 •. 3 mb. respectively.

86.
The agreement between these values and the value of
64mb. found speaks for itself. Mellish's value of 46mb. indicates - 5t.J: 51
that his value for a- Fe (n, a.)Cr may be too low at 0. 74 mb.
The disagreement between this and the result of 1. 38 mb. here
reported may be thus partly alleviated.
3. 9. Integration of published excitation frmctions, (B)
In a recent paper, Salisbury and Chalmers(134
) published
their own experimental results and a compilation of previous values
of cress sections for Fe54
(n, p) and Fe54
{n, a.) at various bombarding
energies. These are reproduced in Fig. 17 (a) and_ (b). [For reference~
see (138) -:to· (147)]. FoUowing the treatment of 3. 3.1., we may
derive values of a by integration.
3.9.1. Fe54
(n.£}Mn54
The values of cr given in Table 9 are derived from the
dashed line (due to Salisbury and Chalmers) of Fig. (17}(a).

FIGURE 17.
(a) Excitation function for the reaction 54 54
Fe (n, p)Mn , from Ref. (13i}_
(b) Excitation function for the reaction
Fe 54~. a)Cr
51 (134)
87.
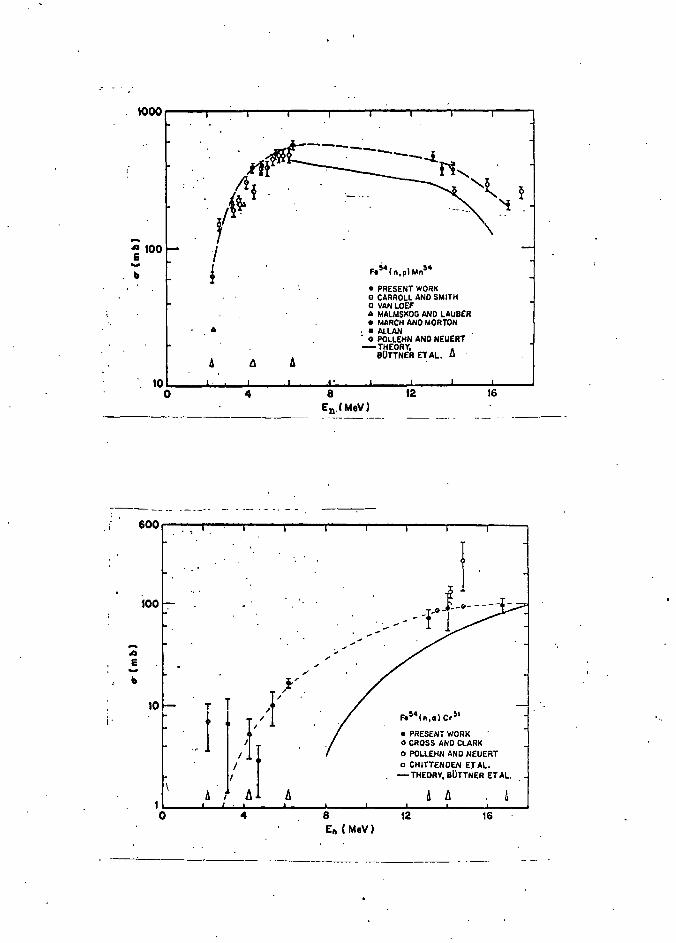
i
i·
A 100 E
. b
..
Fe;4 ( n,p) Mn'4
• PRESENT WORK a CARROLL AND SMITH D VAN LOEF • MALMSKOG AND LAUBER e MARCH AND MORTON
. • ALLAN
. o POLLEHN AND NEUERT -THEORY,
BUTTNER ET AL. ~
10~--~----~--~--~~--~--~----~--~--~ 0 4 8 12 16
En.CMaV)
- . --· . - .. - - ------600
l 100
~ ~-- / -_!_o-r--0-- --
, .... , A ;,
E /
b j' T T ,rr _j
j I Fe'41n,a) Cr~ 1
• PRESENT WORK 0 CROSS AND CLARK
/J 0 POLLEHN AND NEUERT o CHITTENDEN EJ AL.
-THEORY, BUTTNER ET AL.
A I!J A t:. I 0 4 8 12 16
En (MeV)
. ·------------ - ·····------ -·-··

88.
Table 9.
E {Mev) a-(E) N(E) N(E) CT(E) x cr-(E) X
mb. Eqn. (10) Eqn. (11) N(E)10 N(E)11
2 t\ v
2.5 106 1. 84x 10 -1
1. 84x 10 -1
19.5 19.5
3 185 1. 38 X 10 -1
1, 38 X 10 -1
25.5 22.5
3.5 225 1. 02x 10 -1
l.02x10 -1
23.0 26.0
4 335 7. 40x 10 -2.
7,38x10 -2
24.8 24.7
5 450 3. 84x 10 -2
3.75x10 -2
17.3 16.9
6 530 1.89x10 -2 1. 84x 10
-2 10.0 9.75
7 580 9, 31 X 10 -3
8, 77 X 10 -3
5.40 5.08
8 550 4. 42x 10 -3
4.10x10 -3 2.43 2.25
9 540 2. 07 X 10 -3
1. 89 X 10 -3
1.12 1. 02
10 510 9. 53 X 10 -4
8.56x10 -4
0.49 0.44
11 480 -4 I -4 0.21 0.18 4.38xl0 3.84x10
12 460 -4 1 -4 0.09 0.08 1. 99 X 10 I 1. 70 X 10 -
Integration produces values of 89mb. [Eqn. (10)] and 54 54
88 mb. [Eqn. (11 ), the Granberg spectrum] for Fe (n, p)Mn . This
can be regarded as fair agreement with the value found and the·
literature values. The weighted yield-curve gives greatest weight to
t_he low energy points where the slope is very steep and the points
moat uncertain.
54 51 3. 9. 2. Fe (n, a.)Cr
Here the situation is much worse experimentally, see
Fig. (17)(b), and also the low energy a- value:s are very imprecise

leading to very great imprecision in cr . The dotted line is an
attempt by the present author to a best fit for the points: the full
line is a theoretical function due to Buttner (144
).
Table 10.
89.
E(Mev) cr{E)ARB cr(E\144) N(E)11
o-(E) ARB -:r{ E)( 144}
X N(E) X N(E) I
3 0 0 0 0
3.5 2..5 0 1. OZx 10 -1
0.2.5 0
4 4 0 7.38x10 -2
0.2.95 0
5 G 0 3.75x10 -2.
0.30 0
6 13 0 1. 84x 10 -Z
0.2.4 0
7 2.0 0 8,77x10 -3
0.175 0
8 27 3.1 4.10xl0 -3
0.11 0.013
9 38 7.8 1.89x10 -3
0.07 0.015
10 45 12. 8.56xl0 -4
0.04 0.010
11 55 2.0 3. 84x 10 -4 o.oz 0.008
12. 63 2.7 1. 70 X 10 -4
0.01 0.005
13 70
1
37 -5
0.005 0.003 7.48 X 10
14 87 47 -5 0.003 0.0015 3. 2.6x 10
Integration with the Granberg spectrum of the dotted C:urve
" ( ) , - 54. ) 51 Lo- E ARBJ gives cr for Fe (n, a Cr as 1. 34 mb. ; Buttner 1s
curve gives 0. 06 mb. The agreement between this value of 1. 34 and
our experimental value of 1. 50 mb. is mainly fortuitous in view of
the large Wlcertainties in the method. It does weigh slightly against
the value of Mellish (0. 80mb.), as our dotted 'best fit' tends to
underestimate the values of cr {E) at low neutron energies found by
Salisbury and Chalmers(134>.
90.
SECTION ·4.
AB.SOLUTE FISSION YIELDS OF Mo99 AND Ba140
IN THE
THERMAL NEUTRON INDUCED FISSION OF NATURAL URANIUM
4, 1. Introduction
Since the discovery of the fission process·, a vast amount
o£ theoretical and experimental work has been done by physicists and
chemists for mechanistic studies. The mass yield curve, that is,
the proportions in which the various fission products are produced, is
the fundamental fact which any theory of fission must reproduce and
explain. Mass yield curves for heavy nuclei at low bombarding
energies are typically asymmetric, as the familiar two-humped curve
for the thermal neutron fission of if35, Fig.18(a), shows. The curve
is not smooth at the maxim~, and this fine structure, shown in more
detail in Fig. 18(b) [data from Ka.tcoff(39 >], and Fig. (19), (data from
Farrar· and Tomlinson (?l)], has been the subject of great and continuing
discussion.
The folloVV'ing account is mainly concerned with the
thermal neutron induced fission of if35. Methods of measuring
fission product yields are of two main types; radiometric
(radiochemical) and mass spectrometric. Absolute measurements of
both types consist of two main steps; (a), measurement of the
number of fissions that have occurred in the sample and (b),
measurement of the number of atoms of fission product or products
in question that have been produced. Relative measurements simply
91.
FIGURE 18.
(a) lv'Iass distribution curve for thermal neutron
f. . f _ _235 lSSlOn 0 u-
(b) F . f u235 eli "b • 1ne structure o mass str1 utlon curve
(Ref. 3!!)

10
1·0
0•1
Yl ELD %
•0 I
•001
•0001 70
7
6
s YIELD %
4
3
~ [f....,..
1 \ If \I I
I ~ I I I
1\JI I
I I I
90 110 130 ISO 1 MASS No,
I I I
95 90 ss eo
--HEAVY
-----LIGHT
(a.)
(b)

92.
FIGURE 19.
Fine structure of lf35 mass distribution curve, (ref. 72)
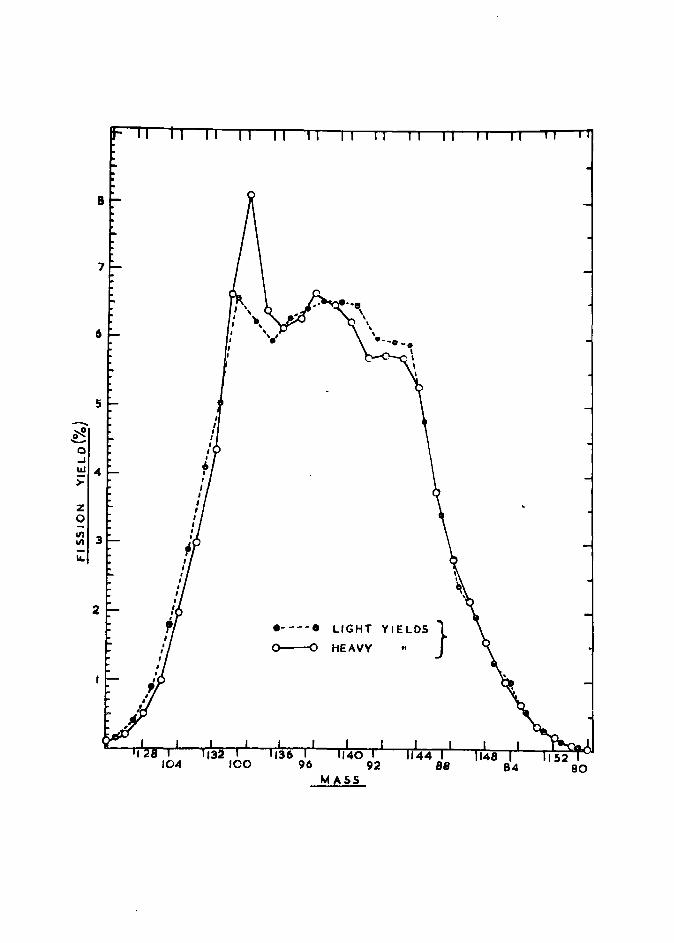
z 0
104
·----· o---o
LIGHT Y I E11
LDS }
HEAVV
MASS 84

93.
consist of step (b) performed on several nuclides from the irradiated
sample. The terms radiometric and mass spectrometric really apply
only to step (b), since methods common to both have been employed
in (a). Common methods used in step {a) are:
(i)
(ii)
(iii)
(iv)
59 60 the use of a flux monitor, such as Co (n, y)Co
U238( )U239 or n,y ,
the use of the B 10
(n, a.)Li 7
reaction to measure the
change in the B 1 0
/B 11
ratio by spectrometry,
the use of a fission chamber (counter), or
the normalization method.
Methods (i) and (ii) also require a knowledge of the
u235(n, f) cross section, which ultimately depends on a fission
chamber measurement. A great deal of work has been done
internationally to establish an accurate value of CT f:(ul 35); its use
is probably more accurate than employing a conventional fission
c'hamber. Also the form of the uranium sample used in the method
described below is difficult to reconcile with fission counter geometry.
The normalization method (iv) entails relative measurements of the
individual fission products by step (b) over the whole mass curve.
Normalization of the sum of the yields to 200o/o total yield or lOOo/o for
both light and heavy peaks in the case of lf35 follows.
As regards step (b), radiochemical methods entail the
separation of a f3- emitting precursor of the stable chain product
and absolute measurement of its number of atoms by the use of a
calibrated counter. This is justified since it has been shown by . (40) (41)
Glenden1n ~- , and Wahl , that the last two or three members
94.
of the chain have virtually zero independent yields, that is, they are
formed almost exclusively from the decay of their precursors. :Mass
spectrometric methods employ the isotope dilution technique to
determine the number of atoms of a particular nuclide formed.
The complete radiochemical method using the
normalization technique is generally quoted to an accuracy of±' lOo/'o.
Using methods (i) to (iii) in step (a), however, both the radiometric
and mass spectrometric methods are claimed to be accurate to about
t 3o/o. These errors are discussed more fully in the next Section,
(4. 2. ), after the method used has been described.
99 140 4. 1.1. The present work : Mo and Ba 99 The two fission products chosen for study were Mo
140 and Ba . Both nuclides have frequently been used as standards in
relative yield work, though the yields, in particular for Mo 99 , are
not very well defined. Both appear in the fine structure region near
the maxima of the light (Mo 99 ) and heavy (Ba 140
) peaks. For these
reasons, and because the method (see below) promised accurate
values, these two nuclides were chosen. Also advantageous are their
large yields, suitable half lives, ease of separation and relatively
non-complex delay echemes.
4. 2 . The method
The method was radiometric in step (b) and used a new
method of measuring the fission events, step (a). The use of the
B 10
(n, a.)Li 7
reaction has been mentioned above, the alteration in the
B10 ta11
· b · d Th' h 11 k h f ratlo e1ng measure • 1s as usua y ta en t e orm, " (42) e. g. Yaffe~· , of simultaneous irradiation of a vessel of BF 3
with the uranium sample close by. Knowledge of the cross sections

95.
10 _ _235 . of B (n, a.) and u- (n, f) enabled the number of fissions to be
calculated. In the present work, boron as boric acid, was thermal
neutron irradiated in an uranyl nitrate solution, and the helium
produced by B10
{n, a.) meas~red by the micro gas analysis apparatus.
Having measured the helium produced in the solution, the fission
products Mo 99 and Ba 140
were radiochemically separated using
carrier solutions. Measurement of the numbers of their atoms was
carried out by coWlting in a calibrated liquid Geiger counter. · The
counter was previously standardized for the two nuclides with known
amoWlts of solutions of known absolute radioactive concentration,
determined by 41rf3- co\mting of weightless sources.
Consider the accuracy of the method, especially with
regard to mass spectrometric methods. The helium determination
is accurate to better than lo/o. Some errors occurring in mass
· h d · h b d The use of the B10
/B11
spectrometnc met o s m1g t e mentione .
ratio change is of only fair accuracy; changes in the isotope ratio
may be accurate to typically 0.1 %, but the change of the ratio is of
the order of 1..03 (4 Z, 71
); i.e. an accuracy of about 3o/o. Long
irradiations are required to achieve even this isotopic ratio
alteration. The use of the isotope dilution techn:.que, in itself is
more accurate, (better than lo/o ), than absolute counting of the
separated fission products but introduces other errors. Large
samples and long irradiation periods are required to produce enough
fission product to apply the dilution technique accurately. Large
samples lead to large self- shielding corrections, and long irradiation
periods are also clearly undesirable. It is interesting to note that
Yaffe et al. in 1960(7!) changed over, for his more accurate
96.
determination of Ba140
, from the B10
/B11
method of 1954(42
), to a
Co 59
monitor technique, while retaining radiometric measurements on 140
Ba .
4. 2.1. Discussion...2!..P..otential errors
In the method outlined above it is assumed that there
is a constant relation between the number of fission product atoms
produced and the helium produced. We must consider other processes
occurring and show that they are negligible. Firstly, helium may be
produced by other mechanisms than the reaction B10
(n, a.). The use
of an irradiation blank of encapsulated water was used to show that
negligible amounts of helium were produced by heating or (n, a.)
reactions in the vessel or its aqueous contents. Some helium will
be produced by ternary fission: Fulmer and Cohen (45
) found that
0. 3'?o of fission events gave rise to an alpha particle. However, this
small figure is diminished to negligible proportions by the
consideration that about twelve times as many B10
(n, a.) events
occurred in the solution as fissions, as a result of the proportions
of boron and uranium used. Production of helium from decay of
th . . (u238 0 234 "d d) . . e uran1um ser1es and need only be cons1 ere g1ves r1se
to completely negligible amounts of helium from the 200 mg. of
uranium per capsu~.e in the period of less than a month which the
irradiation and analysis encompassed.
Another point must be considered; thermal fis sian of
lf35 will produce a small fission spectrum of neutrons, some of
which will produce fast fission of the u238
. The point is not that the
fast fission yields of lf38 in the region of the mass yield maxima
are 5-lO'?o different from thermal fission yields of u235
(since the

97.
proportion of fast fissions is small) but that some fission events will
have occurred for which no corresponding B10
{n, a) reactions have
occurred (or with a very much smaller probability). By considering
the worst case it can be shown that this is a negligible effect. On the
very unrealistic assumptions that no fission neutrons escape and that
the u238 is subjected to an unmoderated fission spectrum of neutrons
(far from the case in a dilute aqueous solution, of course), one may
proceed as follows. Since u238 has an almost constant fission eros's
section of about 0. 5 barn above a threshold of 1 . 5 Mev (l4 7 ) its
average fission cross section will be roughly 0. 25 barn. Knowing the 238
amount of U and the thermal flux, it may be shown that less than
one in a thousand fission events is due to u238 fast fission, even in
this 'worst case 1 example.
The next sections are descriptions of the two va_cuum
systems, one for filling the capsules with a helium free solution
containing a known ratio of boron to uranium, the other for breaking
open the capsule after irradiation and flushing the gas into the main
helium measuring section.
4.3. The filling ap_£aratus
The filling apparatus shown in Fig. 20 was designed to
fill five lead glass capsules with a helium free solution of uranyl
nitrate containing boric acid.
The five capsules joined on the bottom of the filling
chamber (only one is shown in the figure for the sake of clarity) were
made of lead glass since all other glasses were unsuitable. Silica
has much too large a permeability to helium; pyrex not only has a
high permeability but also a considerable boron content. Soda glass

FIGURE 20.
Apparatus for encapsulation of a helium free
solution of uranyl nitrate containing boric aqid
98.

iTO VACUUM
(VIA WATER TRAP)
~--~ ~
MAGNETIC I RON ---++---4---HI
DELIVERY TUBE __ -+~~~
r r _ 41 LEAD GLASS CAPSULES
WAST!

99.
becomes active by the reaction Na23
(n, y)Na24
(cross section of·half
a barn) giving rise to handling problems. ~ad glass forhmately
could be glass-blown directly onto the soda glass of the filling vessel.
The capsules consisted of specially made B.l4 cones, sea~ed off
behind the cone and drawn out in front to form a narrow tube rea_dy
to be sealed off after filling. The volume of the capsule was
4 to 5 ml. They were arranged in a circle around the base of the
filling device or 'pig 1 so that each could be filled in turn through the
swivelling delivery tube. Flasks A and B, of about 150 ml., were
respectively half full of an uranyl nitrate plus boric acid solution
and with slightly acidified water. Each was fitted with two platinum
electrodes.
The operation of the apparatus was as follows. The
apparatus was first evacuated through tap T 3
with T 1
and T 2
open.
The solutions were then outgassed to remove dissolved helium. In
the absence of a flushing gas stream, electrolysis has been found to
be an effective method by previous workers. However, the uranium
solution could not be electrolysed for fear of plating out some of the
uranium. Flask B was outgassed in this way, however. T 2
was
closed and electrolysis continued for some minutes to build up a
pressure of H2
and 02
of several centimetres, then T2
opened to
the pumps for a few seconds and the process repeated ten or twelve
t" -lmes. Solution A was outgassed by swirling the flask by rotation
in the B. 10 socket just beyond T 1
and periodic pumping of the
flask through T 1
• After periodic pumping for 2 days, the solution
was found to be heli'!lm free.
The method of filling the capsules was first to obtain a
good vacuum in the pig, (with T 1
and T 2
closed). The swivelling
100.
delivery tube was then brought over the waste reservoir by a magnet
acting on the iron collar around the tube. Tap T 3
was closed, T 1
opened, and the flask A was turned upwards in the B.IO socket until
the solution just commenced to pour through T 1
and down the delivery
tube. It was found that the solution could be readily controlled; the
delivery tube was positioned over each of the five capsules in turn
and about Z - 3ml. of solution poured into each. The delivery tube
was washed out with water from B into the waste reservoir and the
narrow capillary tubing connecting the capsules to the pig washed out
in turn with water. This was to remove any uranium and boron from
the capillary walls before sealing off the capsules with a torch flame.
Five capsules were filled with uranium-boron solution
and one with just acidified water. The blank tests and irradiations
are described below.
4.4. The analysing vessel
This apparatus was designed for breaking open the
capsules under vacuum and flushing out the dissolved helium from the
solution with oxygen, as in the dissolution vessel used for iron
samples in Section 3.
The apparatus, of about 30 to 40 cc. in volume, was
connected to the oxygen line and to the circulating system through
two B.lO joints as shown in Fig. 21. The capsule containing the
solution from the filling device was fitted into the greased B.l4 socket
as shown, after a scratch had been made on the capillary tip with a
glass knife. The apparatus was then rigourously evacuated through
the tap leading to the circulating system. This tap was closed, and
the breaking arm slowly turned, while holding the capsule in position
J /

FIGURE 21.
Apparatus for breaking open irradiated capsules
under vacuum a~d for flushin.a out the dissolved helium
101.

TO CIRCULATING
SYSTEM>
LEAD GLA~.SS
CAP~ULE

102.
in the B. 14 socket, so that the capillary was broken off at the scratch
mark. The liquid then spurted out under the pressure of its vapour
leaving only one small drop on the tip of the capillary. The solution
was then flushed out with oxygen through the tube passing below the
liquid surface to the bottom of the vessel. The flushing procedure was
very similar to that outlined in the section on iron sample analysis.
The mercury in the ventil of the circulating system was adjusted to
allow the oxygen of each flush to bubble past when the connecting
tap was opened, and be adsorbed on the cooled charcoal of the
circulating system. This process was repeated a further eight times
to ensure complete removal of helium from the analysingvessel to
the -circulating system. The completeness of this transfer was
demonstrated by flushing the vessel a further nine times after one of
the irradiated capsules had been analysed and no helium was found to
have been left behind by the first nine flushes.
Before breaking open the capsule to be analysed, the
purity of the oxygen was checked by operating the flushing procedure
with the same amount of oxygen as that used on the solution for
analysis and detecting the helium pre sent, if any. Typical oxygen
blanks were around 2 x 10- 9 cc of helium, this being about 0.1 o/o of
the actual helium content of the capsules after irradiation.
4. 5. Helium contents of the capsules
A complete batch of samples consisted of five capsules
filled with uranium-boron mixture and one filled with acidified water.
One of the capsules was examined for helium immediately after
sealing of£ the outgassed solutions to check on the coml:'leteness of
the helium removal. This was termed the 'initial blank', a second

103.
one was kept back to be measured after all the other samples had been
irradiated and measured; this 'final blank' showed that no appreciable
leakage or diffusion had occurred in the capsules during the three or
four weeks that the experiments took. The capsule filled only with
water was irradiated with the other three to ensure that the process of
irradiation did not give rise to helium.
The helium contents of the six capsules are listed below:
Code Treatment I He content (cc)
(1) X2 •Initial blank I < 1 X 10- 9
(2} BZ 'Final blank.' < 1 X 10- 9
(3) X1 Irradiation blank 2,5x1(). -9
(4) B3 Irradiated . . -6
l.309x10
(5) B4 Irradiated 2. 075 X 10 -6
(6) BS Irradiated 1. 563 X 10 -6
(The different helium contents of B3, B4 and B5 reflected
the different amounts of solution each capsule contained).
Each of the irradiated capsule solutions B3 - 5 was then
examined radiochemically to determine the number of active atoms of 99 140 .
Mo and Ba produced 1n each.
4.6. . 99 140
The nuclear properhes of Mo and Ba
The 13- decay fission chains in which the two species occur
are listed in Katcoff(46
) as:

(i)
(ii)
104.
Zr 99(33s.) ~ ·Nb 99 (2. 4m.) -::> Mo 99(66. Sh.) -> Tc 99m(6. Oh.)
~'99~99 Tc -> Ru (stable)
(2xlo5y.)
Xe140
(16s.)-> Cs140
(66s.)-::> Ba140
{12.8d.)->
La140
(40. 2h.) -::> Ce140
(stable)
Both nuclides are in transient equilibrium with their shorter lived
daughters. More details of their modes of decay are listed:
(i)
-+---1..,..., D. 1'81
\l/1 Tc 99m l 0 · .1.42
w Tc99 J 0.140
99 - f u1 Mo f3 Energies: 0.45 MeV- 13to 1. 23 MeV- 87o/o
The half lives used were: Mo 99 , 66.0 hours; Tc 99m, 6. 01 hours
and Tc 99 considered as a stable isotope.
(ii) 140 - { 'u1 Ba 13 Energies: 0.48 MeV- 25to 0. 6 MeV- lOtfo 0.9 MeV- So/o 1. 02 MeV- 60o/o
~- ""' l = = = = = = = : = = = = cel40
140 -La 13 Energies:
...
0, 8 :MeV- 12o/o 1.1 :MeV- 25% 1. 38 MeV - 45o/o 1 , 7 ·:MeV - 1 0 o/o 2.2 MeV- 7%
Half lives: Ba 140
, 12. 8 days and La.140
, 40. 2 hours.

105.
The half life values quoted were taken from 1Nuclear Data (121) 99
Sheets 1 ; however, there was a spread of values for Mo between
66 and 67 hours. It was found experimentally from the irradiated
Mo03
used for the counter calibrations that the dec~y followed a half
life of 66. 0 hours.
4. 7. Radiochemical seE!;ration procedures
The analysing vessel containing the irradiated solution
after helium analysis was detached from the vacuum line at the B; 10
joint. It was thoroughly washed with a 2N nitric acid solution
containing accurately known amounts of barium and molybdenum
carriers. These consisted of 50 mg. of barium as nitrate, and 50 mg.
of molybdenum as ammonium molybdate. The vessel was then
washed with 0. SN nitric acid to recover all the carrier, and to produce
a combined solution of about 1 N nitric acid containing all the added
carrier and activity in a volume of about 30 ml. (This strength acid
solution was suitable for the initial precipitation of molybdenum).
Boiling with a few drops of bromine water ensured radiochemical
equilibrium between the active molybdenum and the carrier.
The barium separation consisted of precipitations as the
carbonate, the nitrate (twice), the chromat.e and the chloride {twice);
the molybdenum separation of precipitations of the a.-benzoin oxime
(three times) and the 8-hydroxy quinolinate. This molybdenum
procedure is based on that of Ballou(47 >. (a) Molybdenum
(1) The. solution was cooled in ice and 10 ml. of Zo/o
a.-benzoin oxime added with stirring. The supernate after
centrifugation ·forms the b-ad"!-lm po1:tion.

106.
(2) The precipitate was washed twice with water and dissolved
in 5 ml. of fuming HN03
. This was diluted to 30 ml. , partially
neutralized to IN HN03
with ammonia solution, cooled in ice,
and molybdenum re-precipitated as in (1 ).
(3) (2) repeated.
(4) The precipitate was converted to Mo03
by taking almost
to dryness with a mixture of concentrated HN03
and HC104 .
(5) The oxide was taken up in a little NH4
OH solution, just
acidified and 5 mg. iron (Fe3 +) carrier added. The solution
was re-made alkaline and the scavenge iron precipitate
discarded by filtration.
(6) 10 mg. of rhenium 'holdback' carrier were added to the
molybdate solution, with 2 ml. of 10 '?o E. D~ T. A. solution.
The solution was buffered at pH 4. 5 with acetic acid-ammonium
acetate buffer, and heated almost to boiling. 3'?o a-hydroxy
quinoline (alcoholic solution) was added dropwise to excess
and the precipitate washed with hot water and 5 ml. of ethyl
alcohol.
(7) The precipitate was dissolved in fuming HN03
, diluted
and neutralized to IN acid, and made up to 12 ml. in a
volumetric flask, ready for liquid beta counting.
(b) Barium
(1) T"ne supernate from stage (1) of the molybdenum
separation was treated with excess solid Na2co
3 and the
BaC03
precipitate centrifuged.
{Z) The precipitate was dissolved in a little concentrated HN03
,
25 ml. of fuming HN03
were added, and the nitrate precipitated
at 0°C in an ice bath. Mter centrifugation, the supernate was
discarded.
{3) The nitrate was dissolved in a little water, then
re-precipitated with fuming HN03
as in (2).
107.
(4) The precipitate was dissolved in 10 ml. water and an
iron scavenge precipitation performed by addition of 5 mg •.
Fe 3
+carrier and then dilute NH4
OH. The solution was
filtered and the precipitate discarded.
(5) The solution was just acidified with dilute HN03
, 5 mg.
of strontium 'hold back' carrier were added, and the solution
buffered at pH ".1:. 5 with acetic acid- sodium acetate. The
chromate was precipitated hot with excess 1. 5 M K2Cr0
4 solution added dropwise, and the solution centrifuged after
addition of a wetting agent (teepol).
(6) The chromate wae washed in hot water and dissolved
in 3 ml. of 6N HCl. 25 ml. of HCl-ether reagent were
added, the solution was chilled to 0°C and stirred, and the
Bact2H2
0 centrifuged. The supernate was discarded.
(7) The chloride was redissolved in the minimum amount of
water and reprecipitated as in (6).
(8) The precipitate was filtered onto a glass sinter, and washed
with 5 ml. ethyl alcohol containing 5 drops concentrated HCl,
three times. The precipitate was washed through into a
volumetric flask with water and made up to the mark for
liquid counting.
NOTE: The HCl-ether reagent was a 4 : 1 cone. HCl and
diethyl ether mixture.

108.
4. 8. Countin_g_
4, 8. 1. Liquid countin_g
The two nuclides were counted in a calibrated liquid
Geiger counter by taking a 10 ml. aliquot of the separated solution
after sufficient time had elapsed for transient equilibrium to be
re-established (10 daughter half-lives). This method was simple and
effective once the counter had been calibrated. The growth and decay
of the separated nuclides was followed for several half-lives to check
their radionuclidic purities; they were found in all cases to follow
their expected decay accurately. Typical count rates of the
separated fission products were of the order of several thousand per
minute.
The liquid counter was standardized with a solution of ,, ' the nuclide made up from a known weight of a carrier free solution
whose radioactive concentration had been accurately determined by
absolute 4'1( 13- counting. The chemical composition of the standard
izing solution in the liquid counter was the same as the separated
fission product solution. The preparation of the carrier free parent
nuclides for absolute 471 counting to standardize the liquid counter
is described below. The necessity for the separation of the parent
activity is discussed in Section 4. 8. 3.
4. 8. 2. Prepar_~tio~_of 41J' films and their counting
The 4Tr films were prepared from V. Y. N. S. resin
(polyvinyl chloride-acetate copolymer), dissolved in cyclohexanone,
according to the method of Pate and Yaff~(48 >. They were supported
by thin flat aluminium rings about 1 n in diameter. From information
in reference (48), it could be inferred that their thicknesses were

109 .
.10-20 ·~..~-g./cm 2 . They were -coated with gold on one side of about
5 ~..~-g./cm 2 in an evaporator to make them conducting. The central
portion of the film was made hydrophilic by application of a thin
coating of insulin (by evaporation of a dilute solution). After the
active solution had been weighed out on the film, it was evaporated
under an infra-red lamp to produce a dry, thin, evenly spread
active source. The source was then transferred to a 411' beta counter.
The filler gas used was a dry, oxygen free mixture of 90% argon
and lOo/o methane. The counter was operated as a proportional
c·ounter at 1400 volts. Four sources were made and the films
interchanged in the counter. This avoided the catastrophe of a single
source breaking. The sources were found to be of constant
radioactive concentration. The 471 and liquid counts were recorded
by a print-out machine on punched tape in binary notation at half
hourly intervals. These counts and times were fed directly into a
programmed Elliot 803 computer as· one of the data tapes. The
programme produced a Bunney and Freiling plot(132
) and calculated
the slope and intercept on a least squares basis for both the 4 7T and
liquid counts .
140 99 . 4. 8. 3. Preparation of carrier-free Ba and Bo solutlons
for absolute standardizations
B h B 140 d Mo99 . 'l'b . 'th ot a an come to trans1ent eqUl 1 r1um Wl
their . 140 99m shorter hved daughters, La and Tc . Since it cannot be
assumed that both parent and daughter activites count with an lOOo/o
efficiency in the 4rr counter, in order to estimate their individual
contributions to the counting rate, it is necessary to separate the
parents and follow the growth of the daughters from the time of

110.
separation. A complete parent separation makes the equations
solvable. The results are drawn up in the fcrm of the Bunney plot
(see Section 4,8,4, below).
(a) Barium 140
A commercial carrie-r-free solution of Ba 140
and La 140
was bought from the Radiochemical Centre, Amersham. Many
methods have been described in the literature for the separation of
barium and lanthanum. The production of 4 7T sources requires that
~he activity be separated into an almost weightless solution of a
reasonably volatile solvent which does not attack the film. The ion
exchange methods of Perkins (49 ) and Farabee (SO) fit the condition
most easily. The former was chosen since the barium was eluted
first from the column, whereas in the latter, a cation exchange
method, all the lanthanum must first be eluted.
Perkins 1 method uses a filtration-precipitation teclmique
on Dowex-1 anion exchange resin. A column, 4 x 200 mm., was first
activated with IN HCl and water in three alternate washings and then
converted to the hydroxide form with 20 cc of 1 N NaOH. The column
was washed until the effluent was neutral to B. D. H. indicator paper.
A drop of the concentrated active stock solution 9f Ba 140
and La 140
(as chlorides) was put on top of the column, and leached with water.
The trifunctional La(OH)3
was retained strongly by the column, while
the Ba was eluted. (The La could be removed from the column by
eluting with 6N HN03
). The effectiveness of the separation was
determined by pulse height analysis using a 3 inch flat-top Nai(Tl)
cryntal with a 100 channel pulse height analyzer. The spectra of
B 140 Lal40 . . 'b . d f d B 140 h a and 1n equll1 r1um an o separate a are s own
in Fig.22. The O.B and 1.6 MeV peaks of La140
prominent in the
111.
FIGURE 22.
140 140 Gamma spectra of Ba a~ La

2000
t COUNTS
PER
MIN,
I
1000
II I I I I
I I I I
I
I \ I I~
'/'I
II I
I I
' I I I I II
II
I
1. \I I
SEPt!' BA140
THUS
B¥LA MIXTURE
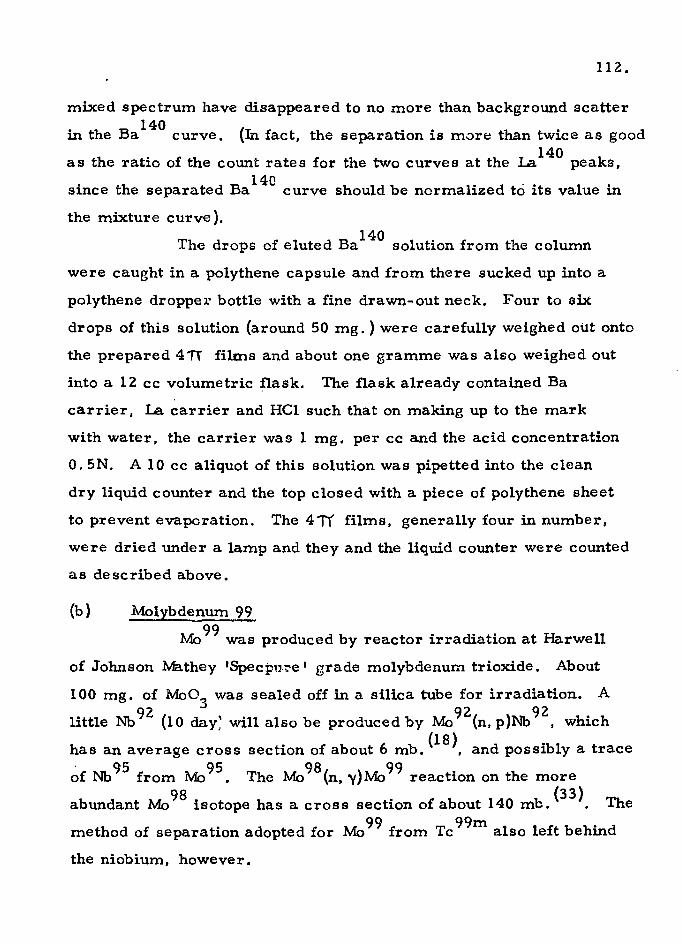
112.
mixed spectrum have disappeared to no more than background scatter
in the Ba 140
curve. (In fact, the separation is more than twice as good
as the ratio of the count rates for the two curves at the La140
peaks, 14C
since the separated Ba curve should be normalized to its value in
the mixture curve).
The drops of eluted Ba140
solution from the column
were caught in a polythene capsule and from there sucked up into a
polythene dropper bottle with a fine drawn-out neck. Four to six
drops of this solution (around 50 mg. ) were carefully weighed oUt onto
the prepared 4 TI films and about one gramme was also weighed out
into a 12 cc volumetric flask. The flask already contained Ba
carrier, La carrier and HCl such that on making up to the mark
with water, the carrier was 1 mg. per cc and the acid concentration
0. SN. A 10 cc aliquot of this solution was pipetted into the clean
dry liquid counter and the top closed with a piece of polythene sheet
to prevent evaporation. The 411 films, generally four in number,
were dried under a lamp and they and the liquid counter were counted
as described above.
(b) Moly~denum 99
Mo 99 was produced by reactor irradiation at Harwell
of Johnson .Mathey 1Specpu.-;:-e 1 grade molybdenum trioxide. About
100 mg. of Mo03
was sealed off in a silica tube for irradiation. A
little Nb 92 {1 0 day~ will also be produced by Mo 92
(n, p)Nb 92
, which
has an average cross section of about 6 mb. (18
), and possibly a trace
~f Nb95
from Mo95. The Mo
98(n, y)Mo99 reaction on the more
98 . . (33) abundant Mo 1sotope has a cross sect10n of about 140 mb. . The
method of separation adopted for Mo 99 from Tc 99m also left behind
the niobium, however.

113.
Various ion-exchange methods for the carrier-free
separation of Mo and Tc have been described. Fisher and Meloche (51
)
and Boyd and Larson (5
Z) have shown that MoO 4
- can be eluted from
Tco4
- on an anion resin in the Clo4
- form with 2N NaOH, and Hall
and Johns {53
) used a very similar technique using a mixture of 0. 5 N
KOH and 0. 5M potassium oxalate as the elutant. However, these
elutants are not suitable for the preparation of 4T( sources and
although they could be altered by passage through a second,
hydrogen-form, cation exchanger, it is simpler to use the oxide
volatilization technique of Perrier and Segre(55 >. The irradiated
Mo03
was transferred to a silica tube containing a plug of silica wool
and through which a slow stream of oxygen was passed. Heating the
oxide at 400-500°C preferentially sublimed the Tc through the plug
and down the tube into a water filled trap. The Mo03
was then itself
sublimed through the plug by strong heating at around 800°C, leaving
behind any non-volatile impurities such as niobium. The section of
tube containing the sublimed Mo03
was cut out and dropped into a
small beaker. A little dilute NH4
OH was added and the beaker warmed
so that the oxide went into solution as ammonium molybdate and excess
ammonia was driven off. A few drops of dilute HCl were added until
the solution was just acid. It was found experimentally that if the
solution were not acidified, the activity was not homogeneously
distributed in the solution.
The Mo 99 solution was then diluted with water until a
few drops contained about 104
d. p.m., determined approximately by an
end-window gas co\Ulter. The activity of the molybdate solution was
great enough for this dilution to produce effectively weightless 411"
sources. The 471 and liquid sources were prepared as for Ba 140
,
a little rhenium being added as a carrier for Tc in the liquid counter
solution.

114.
4. 8. 4. Bunney plots and liquid counter efficiencies
The Bunney and Freiling plot(132 ) is an effective method
of following the decay of a parent-daughter pair and deriving
counter efficiencies. Deviations from linearity in the plot indicate
incorrect half-lives assumed or impurities present.
Let the suffix 1 refer to the parent, and the suffix 2 refer
to ·the daughter; let ~:be the decay constant; N the number of
atoms and A the activity measured. Let the index zero refer to
the initial quantities at the time of chemical apparation, t before
measurement.
Then A1 = c 1 1\l N1
and A2
= C2
X.2
N2
where c1
and c2
are the respective counting efficiencies.
Hence total activity, AT is given by
AT = Cl 1\1 N1 + C2 AzN2
and from the well known parent-daughter expression
or, ATe kl t = Nlo [cl '1. + cz ~\} e<'l.- kzlt ~z >-zNzo- cz ~: ~~l ------(1)
This is the basic equation; if now ATe~ t as ordinate is plotted
against e(~- ~)t. then the following holds:
slope = C >..._[N °- X1 N °] (2) z·"Z 2 xz- >...1 1
intercept = '1_ N1 ° [ C 1 + c2 >-z ~ "J. J ------(3)

115.
Two plots were constructed, one for the 4TI counts and one for the
liquid counts. Let the indices 41\ and L refer to these quantities
' 1 d L/ 411 . f h re spectlve y, an let w w be the ratio o the source weig ts.
Then we can write
-----(4)
:' .. if 4 IT slope ·- /intercept
. t L/. 47T 1n ercept mtercept
For either the 4Tf of liquid counter equations, it will be seen 0 0
that there are four unknowns: N1
, N2
, c1
and c2
, with only two
independent equations. Because the initial separation of parent and 0
daughter was complete one can say N2
= 0. To solve, either the
parent or daughter efficiencies must be assumed to the unity
(for the 4 Tf counts).
Note also that
slope + intercept ::: C1 ~ N1° -------(7)
This may be produced by substitution oft = 0 in Equation (1 ), or 41T 4-rr'
r.e-arrangement o:f Equation (5 ). !<'"..nowing both c1
and c2
it is
possible to derive e1L and e
2L from Equations (4) and (6). In fact,
counting of the liquid counter when equilibrium has been re-established o L L ~2.
enables N1 to be det~rmined for the parent from C1 + e2 ( ~- ~l ),
[from Equation (6)]. e1L and e
2L are derived separately below,
however,

(a)
(b)
FIGURE 23.
. 99 99m Bunney plc.t of Mo and Tc
Dec~ of separated Mo 99
116.

0 0 "'
0
0 T 2 ~ Ill
0 0 ~
0 0
"'
z
(\.
~· !' .e
e.' f 'a
'
o.._ __ _
:
.....
~·
" .CI
0
., ,...·e
e.-· c;r"
-~ .0
. "e ., <:l
.AJ;:;--'o -< -~~
0 9 ..

117.
Shown in Fig. Z3(a) is the Bunney plot for Mo 99 and
T 99m c . The computer programme produced the following slopes and
intercepts on a 'least squares 1 basis:
41f Slope = -1518 ;
4'tr' Intercept = 11, 847 ;
Assume C 4Tr = 1
1
Then 0
}\1 N1 =
Now "'2
"'z-~
Hence c4Tr 2
and
10,329
From Equation (4), c2L
L Slope = -185
L Intercept = 10, 523
[from Equation (7)]
= 1.100
= 1518/10,329 X 1.10 = 0.1336,
= 0.005125,
and from Equation (6), c1L = 0.0315,
or 0. 051 o/a}
or 3.15o/o
or 13. 36o/o.
Two points worth noticing here are: firstly, that Tc 99m contributes
very little to the liquid counter rate, and secondly, that it has a low
4TI efficiency also, due to the extremely low energy of the
conversion electrons (1. 8 kev). This latter point is demonstrated in
Fig. Z3(b) which shows the growth in the separated Mo 99 in the
41T counter.
A second molybdenum trioxide sample was irradiated
and the counter calibration repeated. The value of c1L obtained
was 3.141o, in e~cellent agreement with the first (3.15o/o).
plots were:-
. 140 140 The correapondmg values from the Ba and La
c1L = 1. 061o
c2L =. 5. 201o

118.
In connection with the .sensitivity of the Bunney plot to impurities, in
an initial calibration, a deviation from linearity was tracked down to
the presence of about 1 o/o Sr89
in the commercially supplied Ba140
solution.
4. 8. 5. Determination of the paralysis time of the liquid counter
Th . . . B F '1' 1 f B 140 /La140 e 1n1t1a1 unney and re1 mg p ot or a
was not linear as mentioned above. Among the possible causes of
non-linearity was numbered an incorrect paralysis or dead-time for
the counter. The electronic quench on the probe unit was set at
500 iJ.Sec., but it was thought worthwhile investigating this value;
an example shows how quite large errors may arise. At a count rate 4
of 10 c.p.m., assumption of a 500 iJ.Sec. dead time instead of the
experimentally determined value of 420 iJ.Sec. leads to an error of
1. So/o in the count rate.
The method, due to Martin (SS >, relies on an accurate
knowledge of the decay constant of an active source.
If I be the correct count rate,
and A be the observed count rate,
and T the actual dead time, then
I(l - AT) ::: A
also I Ioe -M :::
A/(1 AT) - X.t so = Ioe
or AeM = Io- !oAT (8)
If Ae X.t be plotted against A, the slope will be -loT and the intercept
Io, from which T may be calculated.
FIGURE 24.
Plot f<:>r t~e determination of the paralysis
time of the liquid counter arrangement
119.
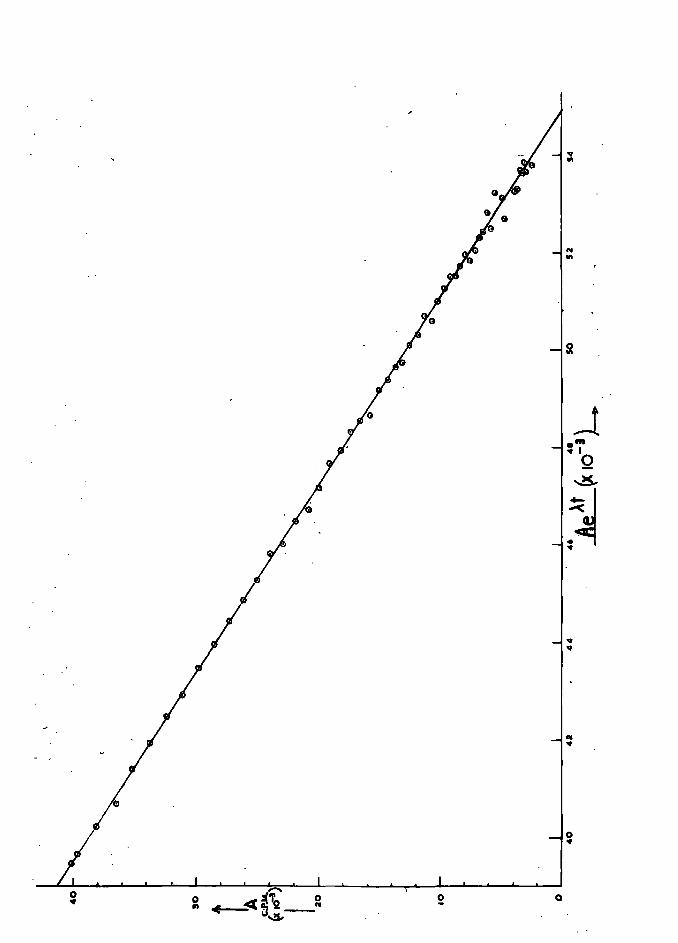
0 • 0 Q
• ..
N ..
.... •I
0 ~
~ •
• •
N •
0 •

120.
Pure iron granules were irradiated with 14 Mev neutrons
from the H3
(d, n) reaction, using a Cockcroft- Walton accelerator.
The iron was dissolved and transferred to the liquid Geiger counter,
the initial activity being about 4 x 1 0 4
c. p.m. The plot of the equation
above is shown in Fig. 24. From the slope and intercept, the dead.
time was calculated to be 420 ..,.sec. The linearity of the plot is in
agreement with the assumed value of 2. 576 hours for the half life of
Mn56.
All liquid counting was done with the same equipment
and settings.
4. 9. Chemical yields in the fis sian product separations
(a) Molybdenum
Molybdenum can be conveniently determined gravi
metrically as the 8-hydroxyquinolinate, often called oxinate, of
formula Mo02(c
9H
6 ON)
2. Trial precipitations on the carrier solution
of ammonium molybdate gave results in excellent agreement with the
amount pre sent by weight. The separated molybdenum solution after
counting was returned to the 12 cc volumetric flask and duplicate
analysis performed o~ two 5 cc aliquots.
The following procedure was adopted from Wilson and
Wilson (S6 ).
(1) The solution was neutralized with dilute NH4
OH, 15 cc
of 5'?o E. D. T. A. solution were added and buffered with 5 cc
of acetic acid-ammonium acetate buffer to pH 5 - 6.
{2) It was diluted to 80 cc, boiled and excess 3'?o alcoholic
oxine reagent was added. After several minutes hot digestion,
the precipitate was filtered hot and washed with hot water

until the washings were colourless. {A grade 4 sintered
glass filter was used).
(3) The precipitate was dried at 80°C for 30 mins.
cooled in a dessicator, and weighed to constant weight.
The precipitate contains 23.07% Mo.
The chemical yields found for the three runs were:
B3 s::
B4 = BS =
34.141 10.40 o/o
15.57
121.
These yields were surprisingly low and indicated an incomplete
precipitation somewhere in the procedure. However, the oxinate
precipitation had the advantage of a large ratio of precipitate to
molybdenum, so that satisfactorily heavy precipitates were obtained
from the 50 mg. of Mo carrier originally added.
(b) Barium
The method of obtaining the chemical yield of barium
originally devized entailed the use of tracer Ba 133
, but it was found
difficult to count the low energy 'V spectrum of Ba133
unambiguously . 140 140
from that of Ba and La .
Having decided on a chemical method, some attention
was given to the volumetric method for barium devized by
Pribil {S?). This relied on a back titration of E. D. T. A. with
magnesium using metalphalEdn indicator screened with methyl red
and diazine green dye. This method was found to be excellent for
mg. quantities of barium, but unfortunately fails in the presence of
lanthanum. (The lanthanum was presen~ in the liquid counter solution
. f La.l40) as carr1er or •

122.
The method adopted for two of the three runs was a
volumetric determination of homogeneously precipitated BaSO 4 .
Baso4
has a weight of only 1. 7 times its barium content in contrast
to the molybdenum oxinate precipitate where the ratio is 4. 3. The
precipitate would have been difficult to weigh accurately and BaSO 4
is prone to co-precipitate impurities from solution. The procedure
chosen for the two runs B4 and BS was based on that of Belcher
et a1~58 ). The bariu._m was precipitated homogeneously with sulphamic
acid according to Wagner(S9) {based on Willard's work(60)), filtered
off, washed free of La3 + and dissolved in excess ammoniacal
E. D. T. A, The excess was determined with a magnesium back
titration using eriochrome black indicator (61
). The BaSO 4
precipit<3:te
was washed with a saturated BaS04
solution to avoid loss of
precipitate. Run B3 was known to have a lower chemical yield of
barium from the count rate of the solution: unfortunately, spillage had
occurred during the separation. Rather unnecessarily perhaps, a
separate method was used to obtain the chemical yield. Rather than
separate the barium from the lanthanum by precipitation, a differential
complexometric titration method was adopted. Lanthanum was
titrated at pH 7. 0 with E. D. T. A. using eriochrome black according to
the method of Lyle and Rahman {6Z). The pH was then raised to 10. 5
by an ammonia-ammonium chloride buffer and the barium titrated.
This w-as done by addition of excess E. D. 'I'. A. and back titration with
magnesium solution as before.
The yields obtained were:
B3
B4
BS
= = ::::
15. 71 41.8 { 1o 53.0 }

123.
The yield of B3 was low since spillage had occurred; the yields of
B4 and BS are rather low because the barium procedure was probably
unnecessarily lengthy and complex.
4.10. Estimation of uranium and boron
The mixed uranium-boron solution irradiated was made
up by weight. Separate uranium and boron solutions were also made
up and analysed to see if they conformed to the stoichimetric
formulae and purities quoted. This was especially relevant in the case
of U02
{N03
)2
.6H2
0 where loss of water of crystallization might
have occurred.
(i) Determination of uranium
This was precipitated as the exine according to the
method of Wilson and Vvilson(63
). The conditions were essentially
the same as those used in the gravimetric determination of
molybdenum. The gravimetric result was 99. So/o of the stoichimetric
weight. Within experimental error, it was therefore assumed that
the uranium content was in accordance with the stoichimetry.
(ii) Determination of boron
The boron was present with the uranium as boric acid.
It was estimated, in a separate solution, by titration with alkali
in the presence of Mannitol according to the method of Kolthoff and
Sandell(64 >. The result confirmed the stoichimetry.
4.11. Calculation of fission yields
4.11. 1. Values of _.E_arameters assumed
(a) Boron
Boron has an isotopic ratio, B10
/B11
, which is known to
vary slightly according to the origin of the sample. Until fairly

recently, the American value on Brookhaven- Argonne boron was
755 barns for the thermal (n, a) cross section. This is the figure
quoted in Sher and Moore(6S) and AUen(66 ). The latter gives the
124.
value for Harwell boron as 765 b. The work of the former authors(65
)
indicated, however, a value of 762 '!: 3 for American boron corre
sponding to a B10
abundance of 19.8'7o. Prosdoeimi and Deruyth~r(123 ) recently re-determined the cross section as 760.5 ~ Z b. The value
assumed in this work is 760 barns.
(b) Uranium
The isotopic abundance of u235 in natural uranium was
taken as 0. 7204'7o from Bigham's paper at the 2nd Geneva
Conference(67 >. The thermal fission cross section for u235
was
taken as 585 b. This is the 'world average 1 value from the 1st Geneva
Conference. Hughes(68
) quoted a value of 582 ~ 10 more recently.
The results for the fission yields are dependent on the
ratioo-[~ 35 (n, f)] /cr[B10
(n, a)] which was here assumed to be
585/760 or 0.770. (This is in close agreement with the value of
0. 773 used by Yaffe et a1~42 >).
4.11. Z. Concentration of uranium and boron in the
irradiated solution
The concentrations of boron and uranium required were
roughly calculated on the basis of a thermal neutron flux of 9 -Z -1 -6
10 ncm sec , and the requirement that about 10 cc of helium
should be produced together with 1 o3 d. p. a. of the fission products.
The boron was actually about one third molar boric acid and the
uranium about one quarter molar uranyl nitrate hexahydrate.

125.
4.11. 3. Calculatio!L'2._f fission yields
Ignoring any finite life time of the precursors of Mo 99
and Ba140
, let p be the flux density (n/cm2
/sec), and Tbe the
time of irradiation.
Then NB, a-B; NU' a-ui and NHe have the
obvious significance; let the subscripts 1 and Z refer to parent and
daughter respectively, and let Y be the fission yield and & the
chemical yield. Let 11° = "-I N
1° be the parent activity of the fission
nuclide at the end of the irradiation.
= NBo-B ~ T ------(9)
and = },.N~ = NU&-U ~ (1- e-"-1 T)Y ----,-{10)
The parent was separated after t1
from the end of the irradiation
and allowed to grow into equilibrium and counted after an interval t 2 •
The parent activity after separation, I1 s , will be
I s T( -"-T .0-"-t 1 = Nuo-u ~ 1 - e 1 ) Yo e 1 1 ----1(11)
After equilibrium has been established, the observed count rate A
will be c "-
A = 1 s - ~~ tz + 1 s z z ( - "-I tz . - - ~z tz) + I s - "-z tz lcle 1 (~-"-l)e e zcze
from the treatment given previously, where I2
8 represents any
daughter not: completely removed by the separation.
Then at transient equilibrium one can say
c "-A • Is ( + z 2 ) - "-1 tz
1 c1 (~-"-I) e ------tlZ)
since e- >..ztz is negligible. Then from Equation (11)

126.
Substituting from (9), one obtains
The last term of the denominator may be written e- ~1 t where
t = (t1
+ t2
) is the total time from the end of irradiation to counting;
thus the time of separation is immaterial if counting is done at
equilibrium.
4.11.4. Results
From Equation (1-'3) the following values were derived:
Run I 99 Y for Mo (o/o) 140
Y for Ba (o/o)
B3 5.87 5.75
B4 6.01 5.88
B5 5.93 5.98
Average I 5.94 5.87
It is instructive to compare these results with the absolute values
obtained by other workers.
(a) Mo 99 - 5. 94o/o
This result is in excellent agreement with previous
measurements. In Katcoff 1s(46
) 1960 compilation of fission yields
for thermal neutron fission of u235, the value given is 6. 06o/o. This

127.
is an average of the radiochemical results of Terrell~· (70) of
6.14 "!:' O.lSo/o and the radiochemical results of Reed and Turkevitch(69
)
of 5.98o/u. The latter workers derived an absolute value of 5.9lo/o for
Mo 99 but then normalized this in the light of relative values to an
absolute Sr89
yield, which they considered to have a higher accuracy.
The discrepancy between this mean value of 6. 06o/o and the result
here reported is only a percentage difference of 2. 0 which is well
within experimental errors.
Errors
The errors involved in the re suit are:
(a) liquid counter rate 1.0%
(b) helium analysis 1. 0 o/o
(c) 4 if calibration 1. 0 o/o
(d) chemical yield 1. 2 o/o
(error of mean in duplicate analysis)
Further errors associated with the result are:
(e) the value of the ratio o-ulcrB
(f) decay corrections based on slightly incorrect
half lives
(g) systematic errors in the 47T calibration.
The errors (e), (f) and (g) are systematic errors
difficult to estimate and are ignored. (c) is an estimate based on
statistics and pas sible loss of counting efficiency.
Treating errors (a) to (d) as standard errors, the total
error becomes 2.lo/o, with possible additional systematic errors.
Hence the final yield value of Mo 99 is (5. 94 ~ 0. 13 )o/o.

128.
(b) Ba 140
- 5 __ • 87'?'o
This result is rather lower than previous values which
average around 6. 3'?'o:
Reed and Turkevitch (69 ), 1953 6. 35 '?'o
Yaffe et al. (42
), 1954 6. 32 t 0. 24'?'o
Petruska et al. (43 ), 1955 6.33 ~ 0.3l'?'u
Santry and Ya~fe(7 l)' 1960 6.36! 0.12'?'o
Ferrar and Tomlinson (72
), 1962 6. 25'?'o.
Petruska's value was for Ce 140
, but the yield will be virtually
identical to that of Ba 140
since the independent yields of nuclides
near the end of the 13- chain are negligible. For example, Grummit
and .Milton(122
) found the independent yield of 1.a140
to be 4.5xlo-3
'?'o.
The errors involved are similar to those discussed for
Mo 99, except that each chemical yield consisted of one determination
only and also the accuracy of the method was lower. Assessing .the
error of the yield determination at 3 '?'o (including the determination of
the inactive carrier by the same method) and proceeding as before,
the final value for Ba 140
is (5. 87 ~ 0. 21 )o/o.
Although this is lower than the results quoted above,
taking into account the standard errors and possible systematic errors,
the discrepancy is not larfle. m view of the Mo99 result, it would
seem most likely that some systematic error due to (g) was pre sent.
Loss of efficiency in the 4Tr counter would make the liquid counter
efficiency too large and so lower the final yield value for Ba140
.

1 Z9.
Comment
The accuracy of the results is at least comparable to
that of mass spectrometric values. The triplicate determinations
have a standard error of the mean of 1. Z 1o for Mo 99 and 1. 91o for
B 140
a , showing that the standard errors quoted are realistic.
These results, particularly for Mo99 , and where previous values
were somewhat scanty, may be fairly said to add to our knowledge
of absolute yield values.

130.
SECTION 5.
ABSOLUTE STANDARDIZATION OF PHOTONEUTRON SOURCES
5. 1 . Introduction
5.1.1. General
The problems of absolute neutron source standardization
have been reviewed by Wattenberg(8?); since then the status of
absolute comparisons has been described by Hughes(BB) (1954),
Richmond and Gardner(89 ) and Larsson90 in 1958, and Axton(9 l) in
1961. The latter noted the great strides that have been made towards
uniformity in the last decade; ten sources from various national
laboratories now have a spread of 3. 81o, or about Z1o variation
about a 'world average 1 value, compared with a previous spread of
101o. Many workers now claim an accuracy of 1 or 11/z 1o in their
absolute calibrations but additional systematic errors must be present.
The photoneutron sources under consideration in the
present work were set up as a standard in 1954, following the Oxford
Conference on Neutron Standardization. One method of measurement
was proposed by a helium technique by Martin and :Martin (9Z). At
that time absolutely calibrated sources had a spread of about 1 01o (88).
It was proposed that after various standardizations and intercalibrations
by other methods had been performed, some of the sources would be
destructively analysed for their helium content. This associated
particle technique should give a standardization accurate to about 11o.
The present account describes the authors 1 attempt at these
measurements.
Before discussing the photoneutron sources further, a
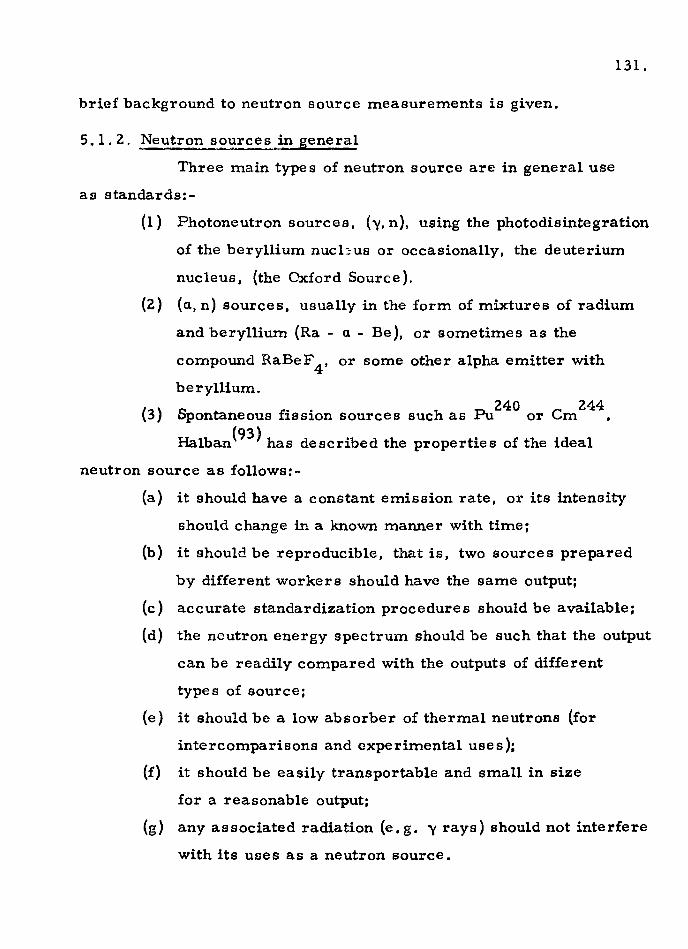
brief background to neutron source measurements is given.
5.1. 2. Neu!!on sources in general
Three rr1ain types of neutron source are in general use
as standards:-
131.
(1) Photoneutron sources, (y, n), using the photodisintegration
of the beryllium nucbus or occasionally, the deuterium
nucleus, (the Oxford Source).
(2) (a, n) sources, usually in the form of mixtures of radium
and beryllium (Ra - a - Be), or sometimes as the
compound RaBeF 4
, or some other alpha emitter with
beryllium.
(3) S f . . h p 240 c 244 pontaneous 1Ss1on sources sue as u or m •
Halban(93 ) has described the properties of the ideal
neutron source as follows:-
(a) it should have a constant emission rate, or its intensity
should change in a known manner with time;
(b) it should be reproducible, that is, two sources prepared
by different workers should have the same output;
(c) accurate standardization procedures should be available;
{d) the neutron energy spectrum should be such that the output
can be readily compared with the outputs of different
types of source;
{e) it should be a low absorber of thermal neutrons (for
intercomparisons and experimental uses);
(f) it should be easily transportable and small in size
for a reasonable output:
(g) any associated radiation (e.g. y rays) should not interfere
with its uses as a neutron source.

132.
Of course, these are counsels of perfection; in practice, each type
has its disadvantages. Consideration (c) is frequently in conflict
with some of the more practicable aspects.
Type {1) sources have .the advantage of being slightly
easier to calibrate abnolutely by thermalization techniques than
sources of type (2) since at lower neutron energies fast neutron
absorption and fast neutron escape is minimized; on the other hand
the sources are bulkier and aelf-absorption is more important.
Also, their bulk, low output and high 'V background are serious
disadvantages.
Type (2) sources have a high output for a small size,
are fairly reproducible, and have a more useful energy spectrum.
On the other hand their outputs are not constant due to the growth of
a.-emitting polonium in the radium, though other a.-emitters like
A 241 1n are now coming more into use.
Type (3) sources have the advantage of a useful energy
spectrum, since for many experiments a fission spectrum is
required. They suffer from a low output and are difficult to
calibrate absolutely. Their uses and calibration have been described
by Richmond and Gardner (sq).
5. 1 . 3. Neutron source calibration
In order to give the proposed helium method in its
context, a sho·.rt summary of common standardization techniques
is here included. Three general methods are possible:
(1) direct determination of the fast neutron output;
{2) measurement of the thermalized neutrons;
(3) the associated particle teclmique.

133,
Method {1} has never been reported according to La.rsson(9o), and
there is little hope of success, especially in view of the very mixed
s.pectra of most sources. Method (2) has been the most popular,
and thcre are several variations in the method of measuring the
thermal neutron density set up by the source in an extended moderator.
The main difficulty of this method is that the results are dependent
on cross section values. Two main sub-groups may be distinguishedi
{a) those using 'mechanical 1 integration of the
neutron density, and
(b) those using 'physical 1 integration.
There are some other variations of method (2) which we
class as group {c).
(a) 'Mechanical 1 integration simply consists in suspending
the source in the middle of a large moderator, (often of oil, water
or H3Bo
3 solution) and measuring the radial neutron density with the
aid of gold foils or small BF 3
counters or some such detector. The
source strength is obtained from absolute counting of foils, or t.loe
number of B1 ~n. a)Li
7 reactions or some combination of these methods.
(b) 'Physical' integration is performed automatically by
the moderator solution, which usually consists of :Mn.S04
solution.
After irradiation to saturation, the solution is stirred and its activity
measured, often with a dip counter. A separate sample of active
M11. 56
solution is counted absolutely {by 41\13 or coincidence cou&·l.ting)
and added to the tank to calibrate the dip counter,
Both methods (a) and (b) have numerous corrections;
for example, for leakage of fast neutrons, self absorption by the source,
fast neutron absorption in the moderator, deviations from the 1/v law
of the detector, resonance absorption in the foils and foil depression
effects [for method (a)].

134.
Typical of method (a) are the publications of DeJuren
et a1.(94
), 1955; or .Larsson(95 ), 1954. Method (b) is exemplified
by DeJuren and Chin(96 >, 1955; Richmond and Gardner(B9 ) in 1957;
Bezotosnij and Zamyatnin(9?) in 1958; Axton and Cross(9B) in 1961
and Noyce et a1~99 ) in 1963.
These authors(9B) measured the outputs of the photo
neutron sources under consideration by method (2)(b) and quote a
standard error of ~ 11o, with the possibility of an additional
systematic error of up to 11o associated with 47113 counting.
An improvement on the method of Axton and Cross was
adopted by Noyce ~~90 >. They calibrated the N. B.S. -I(y, n) source
by comparing its output with that of a Sb -Be(y, n) source in a MnS04
tank; the Sb- Be source was then determined absolutely in a heavy
water (deuterium) solution of MnS04
, which largely removes the effect
of the large hydrogen absorption cross section on the absolute measure
ment. The dip counter used to measure the 1Jin56
activity was
calibrated with an active 1\.1n 56
solution standardized by 4rr 13- y
coincidence counting, again an improvement on Axton ·and Cross 1
41T 13 counting. The reason why a Sb -Be(y, n) source must be used
with the deuterium bath is that the y rays from the Ra -Be source are
above the threshold for the photo- disintegration of the deuterium
nucleus. The overall uncertainty was 1.11o.
(c) A :further variation of the thermalization tech..'lique
is the use of a large graphite stack or thermal column attached to
a reactor. (Erzolimsky and Spivak(100) and Spivak et al.quoted in
Larsson(90)). -

135.
Method OJ, the associated particle technique is a very
attractive one in principle though it has received far less attention
than method (Z). The basis of the method is to detect the other
product of the neutron producing reaction, not to measure the
neutrons themselves.
This may take the form of counting charged hydrogen or
helium nucleii associated with reactions such as T(d, n)He 4
, T(p, n}He 3,
D{d, n}He 3
or D( -y, n}H. Florov and Poretskii (l 01 ) in 1951 and
La.rsson(lOZ) in 1955 have described standardizations based on the
T(d, n)He 4
reaction, while the Oxford Rd- Th(-y, n)H source was
standardized by absolute counting of photoprotons associated with the
D(-y, n)H reaction by Marin et al. (l03} in 1954. The F 19 (a., n)Na
22
reaction has also received~ attention. Geiger(l04
) in 1959 was
able to calibrate a Po Zl 0
- a.- F19
source by coincidence counting of
the anihilation quanta following positron emission from the Na ZZ.
The .difficulty is to discriminate against y rays from the a.-emitter,
and this is why the short lived Po210
had to be adopted.
Propoaals using this reaction, but based on the 22 22
measurement of the Ne formed from the Na decay were made by
:Martin (lOS} in 1954 ).
This brings us to the actual method proposed for the
measurement of the photoneutron sources. This is an associated
particle technique in which He 4
is measured gas volumetrically by
the apparatus described earlier in this work.
S.Z. Photoneutron sources and the helium method
. The method of determining neutron source strengths by . (1 06)
a hehum measurement was proposed by Glueckauf and Paneth
as long ago as 1937. They investigated the photodisintegration of

136.
the beryllium nucleus:
Be 9 + y -> Be 8 + n
t 2He
4
8 Prior to their researches, the Be nucleus was an unknown quantity;
they found that the helium produced in beryllium metal, together
with other evidence, showed that Be 8 ~cayed to 2He
4 with a half life
of less than a second. It is now known to have a half life of less than
4 x lo- 15 seconds(IO?).
The photoneutron standard (Durham) is shown in
Fig. 25, together with some other photoneutron sources previously
alluded to. As already mentioned in the introduction, these are
based on the proposals of Martin and Martin (92 ). They pointed ·out
that the exact correspondence of every two helium atoms mea·aur.e<d·
to each neutron emitted implies the following:
(i) that each neutron produced is accompanied by two
helium atoms, that is
(a) Be 8
has no stability,
(b) no other (y, a.) or (y, n) reactions are possible in the
beryllium or its impurities;
(ii) that all the helium produced is retained in the metal
until measurement.
(a) is clearly true (l 07
) and (b) can be seen to be true by consideration
of the energies of the y rays from the radium preparation. The
maximum y energy from Ra and its daughters is 2. 4 MeV, from Bi214
(RaG), and the only photoneutron reactions with thresholds below this 9 4 2 I
are Be (y, n)2He at 1. 57 MeV and H (y, n)H at 2. 23 MeV. There is

137.
FIGURE 25.
Types of (y, n) sources

Rd Th SOURCE.
OXFORD
SCAL.!:.. CMS.
Y"-~1---- BE: ~Y.I.I.IU~ CYI.INOE:A
~:".1---- QAOIUM sou~cc
DURHAM
e>E:RYL.L.IUM -......31or-5PH!:~E:
NATIONAL BUREAU
OF STANDARDS.

138.
no deuterium present in cast beryllium. As regards (v. n) reactions,
Be 9 (v, n)He5
-::> He 4 + n is merely an alternative route to
Be 9 (v. n)2He
4. All other likely impurities have thresholds much too
high, e. g. B10
(y a)Li6
at 4. 45 IV...eV.
As regards (ii) there are two points to consider. Firstly,
the range of the alphas produced can be shown to be insignificant
compared to the dimensions of the beryllium metal. Secondly, it
has long been asserted that metals are helium tight at room
temperature. Hemingway(ll) has recently shown that beryllium
and aluminium are indeed completely helium tight at room
temperature, losing less than 2o/o of their helium only on prolonged
heating just below their melting points.
There is one further possibility of error, namely, the
chance that neutrons produced in the beryllium will react with it or
with impurities. The effect of impurities can be dismissed immediately
since their concentration in cast beryllium is small (12
) and they
would need gigantic cross sections to affect the neutron output. As
regards reaction with the beryllium itself by (n, a) reaction, the
Be 9 (v, n) neutron spectrum is of low energy, lying mostly between
0 and 700 keV(124
), and from information in Ref. (125) the reaction
cross section will be of the order of a millibarn. This is completely
negligible in the dimensions of the capsule
The beryllium used in the construction of the cylinders
was cast beryllium which had been shown to be free from ·:helium,
according to Hall (12
), quoting Reasbeck.

139.
5. 3. Description of. the sources
One of the sources is shown in Fig. 25. The dimensions
are about 1. 5 em. diameter by 2.. 5 em. high with a wall, base and
lid thickness of 0.4 em. Their weight is around 6.5 g. The six
sources are designated 4A, 4N, 3B, 3M, 2C and 2L. N, M and L are
for helium measurement. The numbers refer to the radium source.
This is a radium bromide preparation of about 400 me. enclosed in a
platinum case. This prevents any (a, n) reactions in the beryllium.
However, there are some (a, n) reactions occurring in the source
itself and its welded sheath. It was not quite exact above to consider
only reactions in the cylinder as sources of, or losses of neutrons.
Richmond and Gardner{B9 ), following Eggler, have estimated this
effect to contribut~ 2. 5 o/o of the total neutron output from the
photoneutron source. This is also the figure that can be derived from
the work of Axton and Cross(98 ), although it is not quite clear whether
this was independently measured by them. The following table is
taken from their publication and summarises the properties of the
sources.
<}> (Direct} p(Indirect) t Total nlsec. x
~a ~e ..
10 . .., 4 : Source ( -4 -4 incl. (g.) (g. t X 10 ), (x 10 ),
a neutrons ~ax~e n/sec. n/sec.
2C 6.6572 :
I 6.52 0.3737 i 1. 621 1.664
3B 0. 3769 6.3031 l. 572 1. 615 6.62
4A 0.3769 6.7456 1. 671 1. 714 6.57
2L 0.3737 6.8186 1.685 1.729 6.61
3M 0.3769 6.8179 1.699 1.743 6.61
4N 0.3769 6.8230 1. 701 1.744 6.61
140.
T <p(Direct) refers to the directly measured neutron emission from the
beryllium; cp(Indirect) is derived from comparative measurements
previously made on the sources with BF 3
counters. ~(Total} include
the contribution of (a., n) produced neutrons in the radium source.
The neutron emission rate derived from measurement.'of the heliwn
ip. the beryllium will not of course include the {a., n) contribution from
the radium source.
It is interesting to note that the last column, the output
divided by the product of the mass of radium and mass of berylliwn
is constant except for source 2C. This would seem to indicate that
a neutron source of this type could be made that would have a
reasonably accurately lmown output without standardization, simply
from its known dimensions.
5. 4. Method of measurement
The main difficulty is the disproportion between the
helium content {about 5 x 10 -? cc) and the size of the sample (about
three quarters of a mole of beryllium).
Two main methods seem open.
(a) Vacuwn fusion
This has the advantage of not requiring any oxygen
flushing system as the evolved gas may be transferred by Toepler
pump into the circulating system. On the other hand, it would be
difficult to build a furnace system which, when held at above 1400°C
for several hours, would not evolve or leak appreciable quantities of
helium compared with the helium to be measured. Molten beryllium
is also extremely corrosive to crucibles and a potential health
hazard in a soft glass vacuum system, However, in the light of

141.
experience of other methods, this system is worthy of reconsideration
(see comments at end),
(b) Dissolut~.on and removal of hydrogen
Stoichimetric reaction of the beryllium with acid will
produce about 16 litres of hydrogen. A solvent is required which will
dissolve the beryllium reasonably rapidly and with the minimum of
hydrogen evolution. Some work by McNeil has been done on this
problem (lOB), and she found that solutions of HgC12
in various alcohols
and glycols would reduce the hydrogen evolution to about 15 - 40o/o of
the possible. Unfortunately, reaction was slow and tended to tail-off
or stop before completion. Saturated K2
CuC14
solution evolves
about 40o/o of the possible hydrogen and dissolves beryllium reasonably
rapidly. The metal becomes covered with copper and dissolution is
irregular, though experience showed this was not too serious a
drawback.
The problem remains of disposing of about 6 to 7 litres
of hydrogen, Previous workers have burnt the hydrogen in a
combustion vessel with pure oxygen, though the amounts of gas
involved were much smaller. Hall (lZ) who studied the problem under
consideration, devized a combustion procedure on a large scale. This
required the use of large quantities of pure oxygen, for doing blanks,
for flushing and ior combustion. He constructed a special oxygen still,
in which large quantities of oxygen were prepared immediately before
use and which could not be stored.
He obtained an almost satisfactory helium blank on a piece
of beryllium of 6. 5 g., but found large quantities of neon came off
after the helium (presumably from the oxygen), which introduced

142.
some uncertainty into the helium fraction. Unfortunately, time did not
permit him to pursue this point further.
The present author used a pilot- scale combustion plant
for burning hydrogen and found the flame difficult to control and the
process long and tedious •
In principle, the most simple and attractive method of
hydrogen removal is to use a palladium diffuser or 'leak 1• The main
effort was concentrated in this direction. Numerous descriptions
. . h 1' f f 1 D · (1 09 ) ex1st 1n t e 1terature o such apparatuses, or examp e av1s , (110) (111)
Katz et al. and Lowell et al. . The problem is to have a
large enough surface area of the membrane to obtain an adequate
diffusion rate at the fairly low pressure differences involved {up to
one atmosphere).
A pilot scale apparatus was built with a 1J4 11 diameter
palladium- silver alloy tube heated at around 300°C. This was found
capable of diffusion rates of up to one litre per hour of hydrogen at a
pressure differential of about 50 - 60 em. of mercury. The time
factor is important since slow diffusion and leakage of helium is
occurring in the apparatus continually, especially in sections where
some heating of the glass walls occurs. The preliminary experiments
indicated that the hydrogen associated with the dissolution of the
beryllium could be remoTred by a 1/2 11 diameter 'leak 1 in around three
hours or less •
The question then arose of the permeability of silver
palladium alloy to helium. Paneth and Peters(ll 2 ), in 1928, showed
that palladium itself was impermeable to helium even at red heat, WlC~'Jr
large pressures of helium and helium-hydrogen mixtures. This
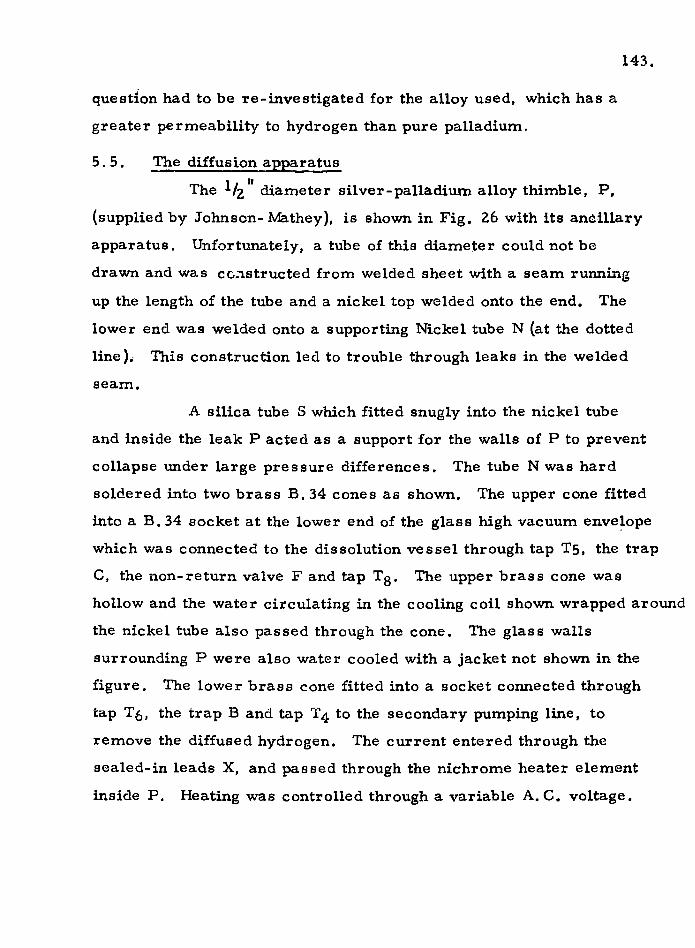
quesdon had to be re-investigated for the alloy used, which has a
greater permeability to hydrogen than pure palladium.
5. 5. The diffusion <:J2E_aratus
1 II The /z diameter silver-palladium alloy thimble, P,
143.
(supplied by J ohnson-l'v1a.they ), is shown in Fig. 26 with its ancillary
apparatus. Unfortunately, a tube of this diameter could not be
drawn and was cc;1structed from welded sheet with a seam running
up the length of the tube and a nickel top welded onto the end. The
lower end was welded onto a supporting Nickel tube N (at the dotted
line).. This construction led to trouble through leaks in the welded
seam.
A silica tube S which fitted snugly into the nickel tube
and inside the leak P acted as a support for the walls of P to prevent
collapse under large pressure differences. The tube N was hard
soldered into two brass B. 34 cones as shown. The upper cone fitted
into a B. 34 socket at the lower end of the glass high vacuum enve~ope
which was connected to the dissolution vessel through tap Ts, the trap
C, the non-return valve F and tap T8 . The upper brass cone was
hollow and the water circulating in the cooling coil shown wrapped around
the nickel tube also passed through the cone. The glass walls
surrounding P were also water cooled with a jacket not shown in the
figure. The lower brass cone fitted into a socket connected through
tap T6, the trap B and tap T4 to the secondary pumping line, to
remove the diffused hydrogen. The current entered through the
sealed-in leads X, and passed through the nichrome heater element
inside P. Heating was controlled through a variable A. C. voltage.

FIGURE 26.
Apparatus for the removal of hydrogen through
a palladium membrane
144.


145.
The temperature of the thimble was mearJUred by a thermocouple
between S and P (not shown in the figure) connected to the leads Y.
Traps A, B and C were built into the line around P as a precaution
against the poisoning of the membrane by mercury vapour. The traps
were always filled with liquid nitrogen before opening taps T 3 , T5
and T6. Tap T2 was an inter-connecting tap between the high pressure
or hydrogen side and secondary side of the palladium tube; through it
both sides could be evacuated or let down to air simultaneously. Two
manometers served to monitor the hydrogen pressure on the fore
and back sides of the thimble.
5. 6. The dissolution flask
The dissolution of beryllium in saturated K2
CuC14
reagent,
assuming the only reaction is the production of cuprous chloride,
will require two moles of reagent for every mole of beryllium. Thus,
ah adequate excess of reagent, for 3/4 of a mole of beryllium,
(taking into account the 40'1o reaction with water to form H2
) will be
provided by two moles of reagent. Its solubility is about 550 g. per
litre so the flask should be capable of holding just under a litre of
reagent solution.
The flask shown in Fig. 27 was of about 1114 litres
capacity and fitted with three necks, each mounting a B. 24 socket.
The thin shape was advantageous in obtaining a good flushing action by
the oxygen, which passed down the tube in the flask after passing the
bubbler B.
The taps T7
, T8 and the non-return valve F were identical
with those shown in Fig. 26. C was a cold trap of the finger type;
this was better here than the internal seal type as the large amounts of

FIGURE 27.
The dissolution vessel for the
beryllium source cylinders
146.


147.
water which condensed could be returned to the flask through tap T 3 after the finger had been allowed to warm up. P was a platinum gauze
cage holding the sample for dissolution, and could be raised or lowered
magnetically by movement of the slug S; when S was at its end
position at the bottom of the tube, P was drawn up above the cone out of
danger of splashing by the solvent during outgassing. The dissolution
and flushing procedures were very similar to those previously
described in the section on iron in Section 3. The large reagent and
flask volume rendered more preliminary flushings necessar·y to
achieve a satisfactory oxygen blank.
5. 7. Operation of the diffusion and dissolution apparatus
Mter the reagent in the flask had been flushed out and a
satisfactory oxygen blank obtained, a sample in the cage P was
lowered into the reagent. When a hydrogen pressure of about 50 em.
was registered, the sample was withdrawn again. The flask was
surrounded by a tank of water to prevent the walls from becoming warm.
The hydrogen was th~n allowed to pass through taps T 3 and T8 and the
non-return valve F, into the previously evacuated palladium section.
Taps T3 and T7 were kept shut and the traps were cooled in liquid
nitrogen before the hydrogen was allowed to come into contact with
the palladium thimble. The heater current was switched on and
increased until the thermocouple registered about 300°C. The
manometer connected to the •outside 1 section of the palladium would
begin to rise at this point indicating diffusion had begun. It was
found that by allowing a small back pressure of hydrogen to accumulate
(about 1 - 2 em. ) by not fully opening T 4
to the secondary pump, the
rate of diffusion was materially increased. This was probably due to

148.
m~ch improved heat transfer between the filament and the thimble
walls. The pressure of hydrogen inside the envelope surrounding the
thimble was maintained at 50 - 60 em. by re-immersing the s~mple
and allowing the gas to pass through T8
, T3
and F.
By adjustment of the fore and back pressures and the
temperature, a diffusion rate of about Z to z1Jz litres per hour could
be achieved. The diffusion rate was found to be proportional to the
square root of the pressure difference, (Ficks first law). The
removal of the great bulk of the hydrogen from a 61/2 g. sample of
beryllium {or its equivalent in magnesium as a test run} could be
effected in around three hours, but the rate of hydrogen removal
became slower as the pressure dropped and very tedious at small
pressure differences. Also the limiting process tended to be the rate
of dissolution of the last fragments of copper coated beryllium. In
practice, therefore, diffusion was terminated when all the beryllium
had dissolved and the hydrogen pressure had been reduced to about
2 em.; this usually took about 4 to 4 1/z hours.
What gas remained was then allowed to bubble into the
circulating system through the ventil. The flask and palladium section
were then flushed out nine times in the normal manner and the gas
collected in the circulating system for helium analysis.
5. 8. Experiments and results
(i) The apparatus was checked for helium tightness. A
blank on the flask and palladium section of the apparatus was not
greater than the normal irreducible minimum of 0. 15 x 10-8 cc. The
flask and trap were also allowed to stand for five hours unpumped and
the helium found to have accumulated was negligible, (less than -8
0. 05 x 10 cc).

149.
(ii) In order to test the efficiency of the whole extraction
process, a percentaee recovery of helium experiment was devized
as follows. A piece of magnesium of size sufficient to simulate the
hydrogen production of 6. 5 1.0· beryllium and of known or small helium
content was dissolved in dilute sulphuric acid in the flask.
Simultaneously, a small piece of beryllium disc of known helium
content was dissolved to supply a known amount of helium. The
hydrogen removal and helium flushing processes should lead to a
lOOo/o recovery of the helium added.
As regards the helium content of the magnesium used,
small samples were dissolved in the iron sample apparatus
(Section 3) to determine this. However, because of the hydrogen
production, sample weights had to be restricted to less than 50 mg.,
and the small amount of helium found, relative to the oxygen blank,
gave a large uncertainty in several grammes of magnesium. The -8
result was around 3 x 10 cc per gramme. In comparison with the
large amount of helium added this did not matter, and later results
showed this figure to be too high.
The first percentage recovery experiment gave a result
of 99 "/o ("!: 2 "/o ); the uncertainty was due to the fact that the Piranis
were not calibrated on the same day, but 2"/o is the maximum
variation of day to day sensitivity. This was extremely encouraging
and indicated the method \•.ras capable of performing its designed
functions.
The amount of helium used in the above experiment was -6
about 4 x 10 cc, so small blank errors, leaks, magnesium blanks, -8
etc. up to about 4 x 10 cc would hardly matter. However, since -7 the helium content of the sources was about 5 x 10 cc, it was
150.
advisable to check the apparatus more carefully at lower helium
concentrations, where uncertain blanks must be reduced below -9
5 x 10 cc •. Two experiments were devized as part of this programme,
Firstly, a large sample of cast magnesium of the same
type as that used in the percentage recovery experiments was
di,~solved alone and the helium found was 1. 7 x 10- 9 cc per gramme;
much lower than the result above. It was possible that air bubbles
were inhomogeneously distributed in the metal.
Secondly, a piece of beryllium metal, labelled
'helium-free 1 by a previous helium worker, was dissolved alone to
determine the limiting size of the helium blank on the whole processo.
The piece of Be weighed about 5. 5 g, and the total helium found on the -9 whole process was 2 x 10 cc.
Unfortunately, the value of these last two experiments
was thrown into serious doubt by subsequent experiments and
discoveries. The former were two more percentage experiments
using smaller amounts of helium as suggested above. These gave
the surprising results of 5. 9 and 4. 5 '?o recovery of the dis solved
helium. At first it was suspected that the palladium had developed
a small crack or hole. And indeed it was found that the palladium
tube would allow atmospheric gas to slowly leak from the high to the
low pressure side. By immersing the tube in water after demounting
it from the apparatus and measuring the pressure, the leak was
detected around the welded seal. The tube was dispatched for repair.
However, it was found on checking the working of the apparatus with
air samples that the column was functioning incorrectly. Mercury
was found to be 'tailing 1 in one of the units forming a bead which
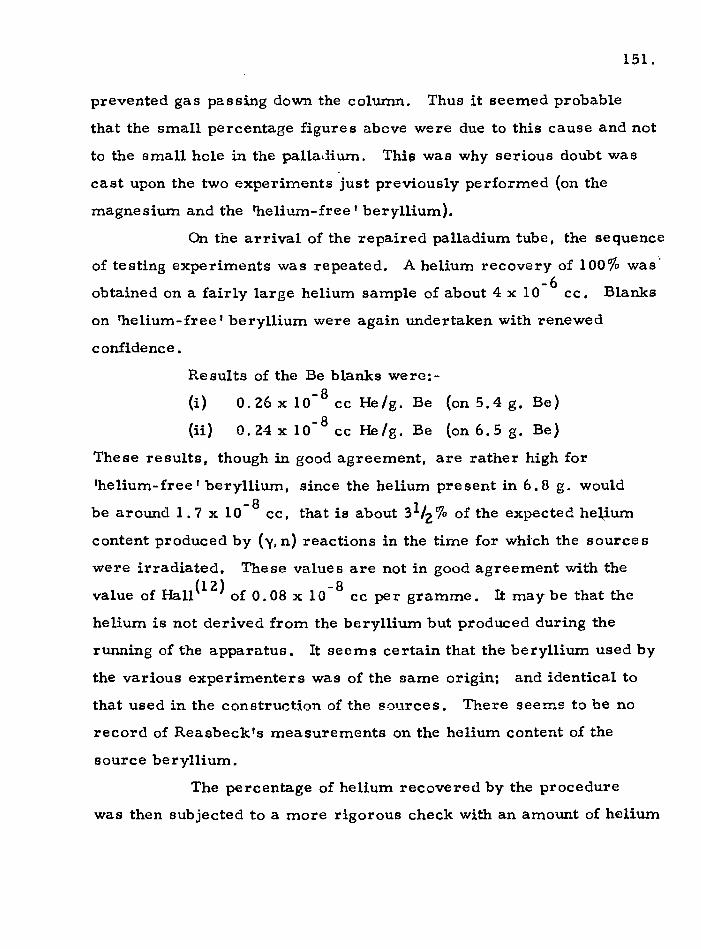
151.
prevented gas passing down the column. Thus it seemed probable
that the small percentage figures above were due to this cause and not
to the small hole in the palladium. Thi~ was why serious doubt was
cast upon the two experiments just previously performed (on the
magnesium and the 'helium-free 1 beryllium).
On the arrival of the repaired palladium tube, the sequence
of testing experiments was repeated. A helium recovery of 100'7o was·· -6
obtained on a fairly large helium sample of about 4 x 10 cc. Blanks
on 'helium-free 1 beryllium were again undertaken with renewed
confidence.
Results of the Be blanks were:-
(i) 0. 26 x 10-8
cc He/g. Be {on 5.4 g. Be)
(ii) 0. 24 x 10-8
cc He/g. Be (on 6. 5 g. Be)
These results, though in good agreement, are rather high for
'helium-free' beryllium, since the helium present in 6.8 g. would
be around 1. 7 x 10⁻⁸
cc, that is about 31/2 % of the expected he~ium content produced by (y, n) reactions in the time for which the sources
were irradiated. These values are not in good agreement with the (12) -8
value of Hall of 0.08 x 10 cc per gramme. It maybe that the
helium is not derived from the beryllium but produced during the
running of the apparatus. It seems certain that the beryllium used by
the various experimenters was of the same origin; and identical to
that used in the construction of the sources. There seems to be no
record of Reasbeck 1s measurements on the helium content of the
source beryllium.
The percentage of helium recovered by the procedure
was then subjected to a more rigorous check with an amount of helium
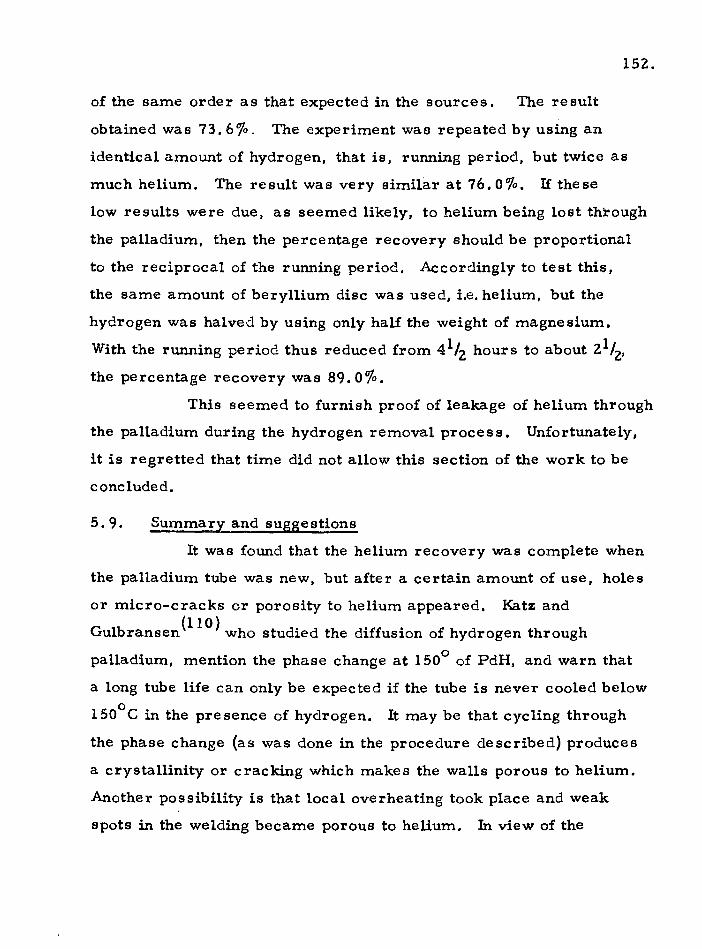
152.
of the same order as that expected in the sources. The result
obtained was 73. 6'1o. The experiment was repeated by using an
identical amount of hydrogen, that is, running period, but twice as
much helium. The result was very similar at 76. Oo/o. If these
low results were due, as seemed likely, to helium being lost through
the palladium, then the percentage recovery should be proportional
to the reciprocal of the running period, Accordingly to test this,
the same amount of beryllium disc was used, i.e. helium, but the
hydrogen was halved by using only half the weight of magnesium.
With the running period thus reduced from 41/2 hours to about 21/2,
the percentage recovery was 89. Oo/o.
This seemed to furnish proof of leakage of helium through
the palladium during the hydrogen removal process. Unfortunately,
it is regretted that time did not allow this section of the work to be
concluded.
5.9. SummarLand suggestions
It was found that the helium recovery was complete when
the palladium tube was new, but after a certain amount of use, holes
or micro-cracks or porosity to helium appeared. Katz and
Gulbransen (11 0
) who studied the diffusion of hydrogen through
palladium, mention the phase change at 150° of PdH, and warn that
a long tube life can only be expected if the tube is never cooled below
150°C in the presence of hydrogen. It may be that cycling through
the phase change (as was done in the procedure described) produces
a crystallinity or cracking which makes the walls porous to helium.
Another possibility is that local overheating took place and weak
spots in the welding became porous to helium. In view of the

153.
propensity of palladium- silver alloy to leakage, it would appear that
the procedure here de scribed is unsuitable.
Hall succeeded in burning the hydrogen with oxygen
but admits to great difficulties, and did not achieve an unambiguous
blank of satisfactory proportions.
The method which seems to hold out the greatest
promise is that of vacuum fusion. Induction furnaces for beryllium
have been described in the literature (126
• 127
) of gas analysis in
metals. It is true, however, that many such experiments were not
concerned with small and sensitive measurements, and the size of
the blank is very important. However, if the blank could be made
to be accurately reproducible this would serve as well as a minimal
blank.

154.
REFERENCES
(1) Paneth, F. A.; Endeavour, g, p. 3, (1953).
(2) Glueckauf, E.; Proc.Roy.Soc., A185, p.89, (1946).
(3) Glueckauf, E., and Kitt, G. P.;
Proc.Roy.Soc .. A234, p.557, (1956).
(4) Paneth, F. A., and Peters, K.;
Z. Phys. Chern., 34, p. 353, (1928).
(5) Glueckauf, E., and Paneth, F. A,;
Proc. Roy. Soc., A185, p. 98, (1946 ).
{6) Chackett, K. F., Reasbeck, P., and Wilson, E. J1;
Geochim. et Cosmochim.Acta, 1. p.261, (1953).
(7) Reasbeck, P.; Ph. D. Thesis, Durham University, (1953).
(B) Chackett, K. F., Paneth, F. A., and Wilson, E. J.;
Nature, 164, p.164, {1949).
(9) Authors (8) in J. Atmos. and Terr. Phys., .!.. p.49, (1950).
(10) Wardle, J.; Ph. D. Thesis, Durham University, {1957).
(11) Hemingway, J.D.; unpublishedwork, (1963}.
{12) Hall, D.; Ph. D .. Thesis, Durham University, (1958).
(13) Dushman, S.; 'Scientific Foundations of Vacuum Technique 1,
Willey me. , 2nd Edition, p, 280.
(14) Ellet, A., and Zabel, R. M.;
Phys. Rev., ll• p, 1102, (1931 ).
{15) Barnes, R.S., et. al.; Proc.Int.Conf. on P. U.A.E. at
Geneva (1958), ~· p. 543. (Paper P/81 ).
(16) Rochlin, R.S.; Nucleonics, !1.· (No.1), p.54, (1959).
(17) Mellish, C.E.; Nucleonics,~ (No.3), p.ll4, (1961).

155.
(18) Boldeman, J.W.; J.Nucl.En,, Parts A/B, ll· p.417, (1964}.
(19} Hughes, D. J.: 'Pile Neutron Research',
p. 98, (1953 }. Addison- Wesley Co., Mass.
(20) Wapstra, A. H.: •Atomic Masses of Nuclides 1 in
Encyclopaedia of Physics, Vol. 38/1,: (1958).
{21) Bethe, H.A.; Rev.Mod.Phys., J.., p.163, (1937).
(22) Hughes, ibid, (19), p. 94.
{23) Hughes, ibid. (19}, Chapter IV,
(24) Roy, J.C., and Hawton, J.J.; A.E.C.L.l181, (1960}.
(25} Mellish, C. E •. , Payne, J. A., Otlet, R. L.;
A. E. R. E. 1/R 2360; also in 'Radioisotopes in
Scientific Research', Vol. I., p. 35, (1958).
{26) Nash, L.K., andBaxter, G.P.;
J. Amer. Chern. Soc., 69, p. 2534, (1957).
(27) Brenen, A .. ; A. E. R. E. Harwell, Private Communication.
(28) Martin, G. R.: Personal Communication.
(29) Birss, J. R.; Private Communication, {1965).
(30) Brookshier and Freund; Anal. Chern., 23, p.ll10, {1951).
(31) Vogel; •Quantitative Analysis', Longmans.
{32) Heath, R, L.; 1 Scintil~ation Spectrometry Gamma-Ray
Spectrum Catalogue 1, Phillips Petroleum Co.,
Report ID0-16408, (1957).
(33) Freidlander, G., and Kennedy, J. Yr.: 1 Nuclear and Radiochemistry', Appendix C, Wiley Co. ,(1955).
{34) Mellish, C.E.; Report A.E.R.E.-R/3251, (1960).
(3"5) Hogg, C.H., and Weber, L.D.: Report I.D.0.-167.44, (1962),
and Private Communication quoted in (18).
(36) Vogel, •Quantitative Analysis 1, p. 897, 3rd Edition.
(37) Passell, T.O., and Heath, R,L,;
Nucl. Sci, Eng., 10, p. 308, (1961 ).
(38) Martin, E. B. M.; Personal Communication.
(39) K.:'ltcoff, S,; Nucleonics, ~. (No.4), p. 78, (1958).
(40) Clendenin, L. E. ~·, in 'Radiochemical Studies: The
Fission Products 1, Coryell and Sugarman Eds.,
National Nucl.En.Series, IV-9, p.489,
McGraw-Hill Co., (1951).
156.
{41) Wahl, A.C.; J.Inorg.and Nucl.Chem., ~. p.263, (1958).
(42) Yaffe, L. et al., Canad. J. Chern., g, p.1018, (1954).
{43) Petruska, J. A. et al., Canad. J. Phys., 33, p. 693, (1955).
(44) Farrar, H. and Tomlinson, R. H.
Nucl,Phys., 34, p.367, (1962)
{45) Fulmer, C.B., and Cohen, B.L.;
Phys,Rev., 108, p.370, (1957).
{46) Ka.tcoff, S.; Nucleonics, _!!, (No.ll ), p~ 201, (1960 ).
{47) Ballou, N. E.; as ref. (40), p.1538, (Paper 257).
(48) Pate, B.D., and Yaffe, L.; Canad,J.Chern,, 33, p.l5, (1955).
$ee also p. 610, ibid.
(49) Perkins, R. W.; Anal. Chern., 29, p.l52, (1957).
(50) Farabee, L.B.; Report ORNL-1932, (1955).
(51) Fisher, S, A,, and Meloche, V, W.:
Anal. Chern., 24, p. 1100, (1952).
(52) Boyd, G. E., and larson, Q. V.; J. Phys. Chern., 60,
p. 1100, (1952).
(53) Hall, N.F., and Johns, D.H.;
J. Amer. Chern. Soc., 75, p. 5787, (1963 ).

157.
(54) Perrier, C., and Segre, E., J. Chern. Pbys., ~. p. 715, {1937).
(55) Martin, G.R.; .J:Nucl.Instr. and Methods,
!l· p. 263, (1961 ).
{56) Wilson and Vifilson. 'Comprehensive Anal. Chemistry 1,
Vol. I. C., p. 592.
(57) Pribil, R.; 'Analytical Uses of E. D. T~ A.'·
Ed. by -Welcher, p.147.
(58) Belcher~·, Chern. and Industry, p.127, (1954).
{59) Wagner et al., Anal. Chern., 24, p. 1031, (1952).
(60) Willard, H.H.; Anal.Chem., 2a, p.137Z, (1950).
(61) Welcher, ~ (57), p.l46.
{62) Lyle, S. J., and Rahman, M.; Talanta, 10, p, 1177, {1963).
(63) ibid (56), p.614.
(64) Kolthoff, I. M., and Sandell, E. B.;
1A Textbook of Quant. Analysis 1 , p. 560, (1947).
(65) Sher, R., and Moore, S.; BNL-607, T.178, Newsletter
No.1, Neutron Cross Section Evaluation Group, (June, 1960).
{66) Allen, Vv.D.; 'Neutron Detection', p.180, Newnes, (1960).
{67) Bigham et al., Vol.l6, p.44. Proc. of 2nd Int.Conf. on
P.U.A.E. atGeneva, (1958), p.203.
(68) Hughes, D.J.; •Neutron Cross Sections', p.165, (1957).
(69) Reed, G. V!., and Turkevitch, A.;
Phys. Rev., 92, p. 14?3, (1953 ).
(70) Terrell, J. et al., Phys. Rev., 92, p.1091, (1953).
(71) Santry, D.C., and Yaffe, L.; Canad.J.Chem.,
38, p.464, (1960).
(72) Farrar, H., and Tomlinson, R. H., Canad. J. Phys.,
40, p. 943, and p. 1017, (1962).

158.
(73) Thode~-; Phys. Rev., 78, p.129, (1950).
(74) Halpern, I.; Ann. Rev. Nucl. Sci,, p. 287, (1959 ).
(75) Glendenin, L.E.; Mass.Inst.Technol.~
Tech.Report No.35, (1949).
(76) Glendenin, L. E. ~·, Phys. Rev., 84, p. 860, (1951 ).
(77) Glendenin, L.E.; Proc. oflstConf. onP.U,A.E.,
Geneva, (1955). Vol. 7, p.614.
(78) Wilesetal., Canad.J.Phys., l!_, p.419, (1953).
(79) Pappas; lvfass.Inst. Technol., Tec.Report No.63, (1953).
(80) Wanless and Thode; Canad. J. Phys., 33, p. 541, (1955).
(81) Perlow, G.J., and Stehney, A.~.;
Phys.Rev., 113, p.1269, (1959).
(82) Terrell, J.; Phys.Rev., 127, p.880, (1962).
{83) Fraser, J.S., and Milton, J.C.D.;
Phys.Rev., 93, p.818, (1954).
(84} Whetstone, S.; Phys.Re·v., 114, p.581, (1959).
{85) Apalin et al., Sov. J. At. Energy, (trans.), ~. p. 10, (1961 ).
{86) Aten, A. H. W.; Physica, 28, p. 262, (1962).
{87) Wattenberg, A.; Ann.Rev.Nucl.Sci., ~ .. p.l19, (1953).
(88) Hughes, D. J.; Nucleonics, g, (No.12), p. 26, (1954).
{89) Richmond, R., andGardner, B.J.; A.E.R.E. R/R2097, (1957).
(90) Larsson, K. E.; J. Nucl. En., 6, p. 322, {1958).
(91) Axton, E.J.; Nucleonics, .!1· (No.3), p.60, (1961).
(92) Martin, G. R., and Martin, E. B. M.; in A. E. R. E. NP/R 1577,
(1954): Report of Proc. of Int.Conf. on Neutron Sources,
Oxford, 1954, (July), edited by Littler, D. J.
(93) Halban, H.; ibid (92).
{94} Dejuren, J.A. ~·· J,Res.N.B.S., 40, p.63, (1955).

159.
(95) Larsson, K.E.; Arkiv.Fysik., 1· p.323, (1954).
(96) Dejuren, J.A., and Chin, J.;
J. Res. N. B.S., 40, p. 311, {1955).
{97) Bezotsnii, V. M., and Zamyatnin, Y. S.;
J. Nucl. En., §._, p. 237, (1958).
(98)
(99)
(100)
Axton, E. J., and Cross, P.; J. Nucl. En., !2_, p. 22, (1961 ).
Noyce, R.H. etal., J.Nucl.En., 17, p.313, (1"963). - -Erzolimsky, B. G., and Spivak, P. E.;
J. Nucl. En., §._, p. 243, (1958).
(101) Florov, G. N.., and Poretsky, L. B.;
Dokl. Akad. Navk. S, S. S. R. , (1951 ).
(102) Larsson, K.E.; Arkiv.Fysik., 2_, p.293, (1955).
(103) Marin, P. ~·, in NP/R 1577, (92).
{1 04) Geiger, K. W.; Canad. J. Phys., 37, p. 550, (1959).
(105) :Martin, G.R.; in (92).
(106) Glueckauf, E., and Paneth, F. A.,
Proc.Roy.Soc., A.165, p.229, (1938).
(107) Ajzenberg, F., and Lauritsen, T.;
Rev. Mod. Phys., 27, p. 77, {1955).
(108) McNeil, J., Unpublished Work.
(109) Davis, W,D.; KAPL-1227, (1954).
(110) Katz, 0. M., and Gulbransen, E. A,;
Rev.Sci.Instr., .!!_, p.615, (19.60).
(111) Lowell et al., Rev.Sci.Instr., 1!.• p. 789, (1960).
(112) Paneth, F. A., and Peters; Z. Phys. Chem., ·'!~.bt. B.,
Band 1, Heft 3/4, p. 253, (1928)
(113) Walker and Westenburg; Rev.Sci.Instr., 28, p.789, (1957).
{114) Hoffman, J.H., and Nier, A.O.; Phys.Rev., 112, p.2112, (1958)
160.
(115) Reynolds, J. H.; Rev. Sci. mstr., 27, No.11, p. 928, (1956).
(116) Bullock, R.E., and Moore, R.G.;
Phys.Rev., 119, p.721, (1960).
(117) Blatt, J. M., and Weisskopf, V. F., 'Theoretical Nuclear
Physics', ·wiley Co., New York, (1952).
(ll8) Hanni, H., and Ressel, J.; Helv. Phys. Acta., ll• p. 513, (1950).
(119) Lonchamp, J.P.; J.Phys,Rad., g, p.333, (1952).
(120) Faraggi, H.; J. Phys. Rad., 14, p.160, (1953) •.
(121) Way, K. ~·, 'Nuclear Data Sheets 1, Nuclear Data Group,
National Academy of Sciences, National Research
Council, Vvashington.
(122) Grummitt, 1_;\r, E., and Milton, G. M.;
J. In. Nucl. Chern., ~. p. 93, (1957)
(123) Prosdocimi, H., and Deruytter, A. J.;
J. Nucl. En., !l. p. 86, (1963).
(124) Eggler, C., and Hughes, D. J.;
U.S. A. E. C. Report ANL 4476, (1950}.
(125) Circular BNL 325, Supplement 1, p.4.
(126) Gregory, J. N., and Mapper; Analyst, so .• p. 225, (1955).
and ibid p. 414, 78, (1953 ).
(127) Booth and Parker; Analyst, 84, p.546, (1959); and
ibid 83, p.241, (1958);
82, p. 57, (1957).
(128) Barrer and Sutherland; Proc.Roy.Soc., A.237, p.~39, (1956);
and ibid A. 258, p. 431, (1960 ).
(129) Barrer and Gibbons; Trans. Farad. Soc., 59, p .. 2569 and
p. 2875, (1963 ); and~ 57,. p. 1140 and p.l153, (1961 ).
(130) Rees, L. V. C., and Williams, C. J.;
Trans. Farad. Soc., 60, p. 1973, (1964).
(131) Garden et al.; Proc. Roy. Soc., A234, p. 35, {1956 ).
(132) Bunney, L.R., and Freiling, E.C .. ;
Nucleonics, g, (No.9), p.ll2, {1956).
(133) Lipschutz et al.; J.Geophysical Research,
70, No.6, p.1473, (1965),
{134) Salisbury, S.R., and Chalmers, B.A.;
Phys.Rev., 140, No.2B, p.305, {1965).
(135) Hinves, R., and Parker, K.;
A. W.R.E. Report No. 0-2/60, (1960).
(136) Granberg, G.~.; Phys.Rev., 103, p.662, (1956).
(137) Alter, H., and Weber, C. E.;
J. Nucl. Materials, ..!..£., (No.1), p. 68-73, {1965 ).
{138) Carroll, E.E., a.ndSmith, G.G.;
Nucl.Sci.Eng., 22, p.411, {1965).
(139) VanLoef, J.J.; Nucl.Phys., 24, p.340, (1961).
(140) Malmsrog, S., and Lauber, A.; Unpublished Work.
(141) March, P.V., and Morton, W.T.;
Phil.Ma.g., _l, p.l43, (1958).
{142) Allan, D. L.; Nucl. Phys., !.Q., p. 31~8. {1959).
(1"-B) Pollehn, Von. H., and Neuert, H.;
Z. Naturforsch, 16a, p. 2:27, (1961 ).
(144) Buttner, H. ~·; Nucl. Phys., 63, p. 615, (1965),
and Private Communication.
(145) Cross, W. G., and Clarke, R. L.; A. E. C. L. Report
No. PR-P-53, (1962), Unpublished.
161. .

(146)
(147)
(148)
(149)
(150}
(151)
(152)
162.
Chittenden, D. M. et al.; Phys.Rev., 122, p.860, (1961). . - -
Allen, iN. D.; ibid (66 ), p. 202.
Adamson,; TRG Memo. 2452(D} and Physics Working
Party Paper, FRSC/RPWP/P. 76, {May, 1964), Dounreay.
Birss, I.R.; Personal Communication, (1966).
Wright, S. B.; A. E. R. E. R/4080, (1962).
Clare, D. M. et al.; Nucl.Sci.Eng., !.§_, p.448, {Apr.1964).
Martin, Vv. H .. and Clare, D. M.;
Nucl. Sci. Eng., .!!_, p.465, (Aug.1964).


![Durham E-Theses Mechanistic studies of the decomposition ... · azabicyclo-[3.3.1.]nonane (DPT) was found to occur by two consecutive first order reactions. The variation with pH](https://static.fdocuments.in/doc/165x107/5e32c1b63bb6ea5b403918ac/durham-e-theses-mechanistic-studies-of-the-decomposition-azabicyclo-331nonane.jpg)