Durable Business Drives Cash Flow and Dividend...
37
Durable Business Drives Cash Flow and Dividend Growth February 2018
Transcript of Durable Business Drives Cash Flow and Dividend...

Durable
Business Drives
Cash Flow and
Dividend Growth
February 2018
Safe Harbor Language and Reconciliation of Non-GAAP Measures
2
This presentation contains certain forward-looking statements within the meaning of the Private Securities Litigation Reform Act of 1995 and other securities laws and is subject to the safe-harbor created by such Act. Forward-looking statements include, but are not limited to, our financial performance outlook and statements concerning our operations, economic performance, financial condition, goals, beliefs, future growth strategies, investment objectives, plans and current expectations such as 2018 guidance, and statements about our investment and other goals. These forward-looking statements are subject to various known and unknown risks, uncertainties and other factors. When we use words such as "believes," "expects," "anticipates," "estimates" or similar expressions, we are making forward-looking statements. Although we believe that our forward-looking statements are based on reasonable assumptions, our expected results may not be achieved, and actual results may differ materially from our expectations. In addition, important factors that could cause actual results to differ from expectations include, among others: (i) our ability to remain qualified for taxation as a real estate investment trust for U.S. federal income tax purposes ("REIT"); (ii) the adoption of alternative technologies and shifts by our customers to storage of data through non-paper based technologies; (iii) changes in customer preferences, and demand for our storage and information management services; (iv) the cost to comply with current and future laws, regulations and customer demands relating to data security and privacy issues, as well as fire and safety standards; (v) the impact of litigation or disputes that may arise in connection with incidents in which we fail to protect our customers' information; (vi) changes in the price for our storage and information management services relative to the cost of providing such storage and information management services; (vii) changes in the political and economic environments in the countries in which our international subsidiaries operate and changes in the global political climate; (viii) our ability or inability to manage growth, expand internationally, complete acquisitions on satisfactory terms, to close pending acquisitions and to integrate acquired companies efficiently; (ix) changes in the amount of our growth and maintenance capital expenditures and our ability to invest according to plan; (x) our ability to comply with our existing debt obligations and restrictions in our debt instruments or to obtain additional financing to meet our working capital needs; (xi) the impact of service interruptions or equipment damage and the cost of power on our data center operations; (xii) changes in the cost of our debt; (xiii) the impact of alternative, more attractive investments on dividends; (xiv) the cost or potential liabilities associated with real estate necessary for our business; (xv) the performance of business partners upon whom we depend for technical assistance or management expertise outside the United States; (xvi) other trends in competitive or economic conditions affecting our financial condition or results of operations not presently contemplated; and (xvii) other risks described more fully in our filings with the Securities and Exchange Commission, including under the caption “Risk Factors” in our periodic reports, or incorporated therein. You should not rely upon forward-looking statements except as statements of our present intentions and of our present expectations, which may or may not occur. Except as required by law, we undertake no obligation to release publicly the result of any revision to these forward-looking statements that may be made to reflect events or circumstances after the date hereof or to reflect the occurrence of unanticipated events.
Reconciliation of Non-GAAP Measures:
Throughout this presentation, Iron Mountain will discuss (1) Adjusted EBITDA, (2) Adjusted Earnings per Share (“Adjusted EPS”), (3) Funds from Operations (“FFO Nareit”), (4) FFO (Normalized) and (5) Adjusted Funds from Operations (“AFFO”). These measures do not conform to accounting principles generally accepted in the United States (“GAAP”). These non-GAAP measures are supplemental metrics designed to enhance our disclosure and to provide additional information that we believe to be important for investors to consider in addition to, but not as a substitute for, other measures of financial performance reported in accordance with GAAP, such as operating income, income (loss) from continuing operations, net income (loss) or cash flows from operating activities from continuing operations (as determined in accordance with GAAP). The reconciliation of these measures to the appropriate GAAP measure, as required by Regulation G under the Securities Exchange Act of 1934, as amended, and the definitions are included in Supplemental Financial Information. Iron Mountain does not provide a reconciliation of non-GAAP measures that it discusses as part of its annual guidance or long term outlook because certain significant information required for such reconciliation is not available without unreasonable efforts or at all, including, most notably, the impact of exchange rates on Iron Mountain’s transactions, loss or gain related to the disposition property, plant and equipment (including of real estate) and other income or expense. Without this information, Iron Mountain does not believe that a reconciliation would be meaningful.
Note: All financial projections and forward looking statements included herein are current as of reporting the company’s fourth quarter results on February 16, 2018. Selected metrics are defined in the appendix of our Q4 2017 Supplemental Financial Information.

Introduction and
Strategic Plan
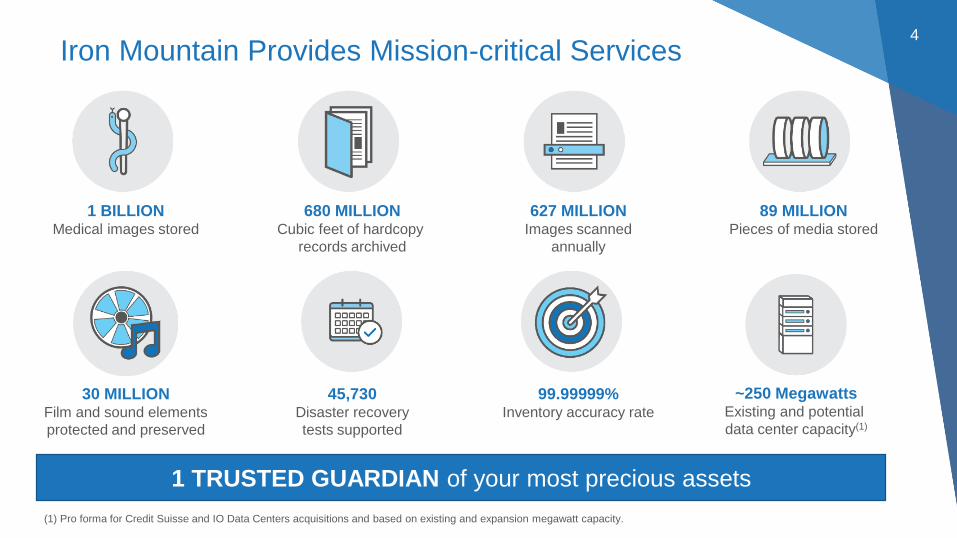
Iron Mountain Provides Mission-critical Services4
1 BILLIONMedical images stored
680 MILLIONCubic feet of hardcopy
records archived
627 MILLIONImages scanned
annually
89 MILLIONPieces of media stored
45,730Disaster recovery
tests supported
30 MILLIONFilm and sound elements
protected and preserved
99.99999%Inventory accuracy rate
1 TRUSTED GUARDIAN of your most precious assets
~250 MegawattsExisting and potential
data center capacity(1)
(1) Pro forma for Credit Suisse and IO Data Centers acquisitions and based on existing and expansion megawatt capacity.
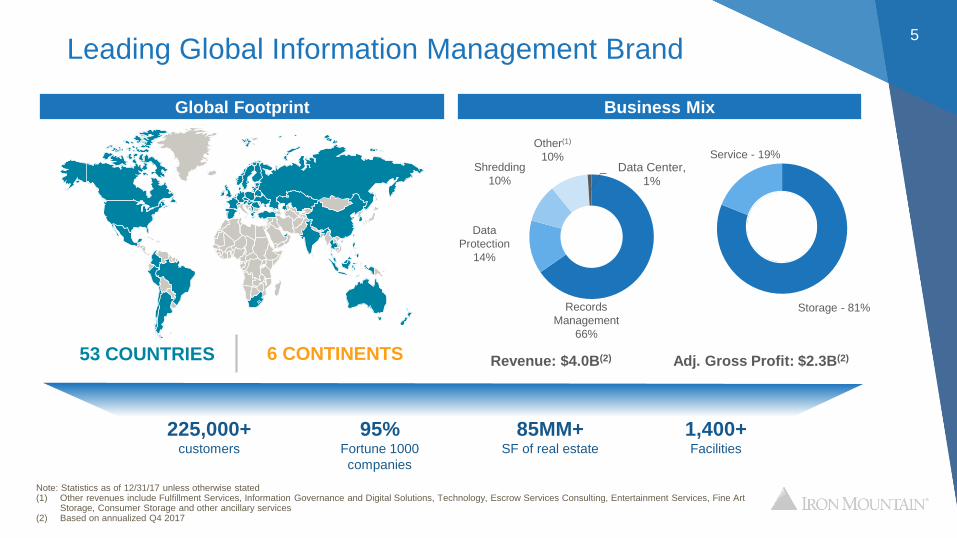
Leading Global Information Management Brand5
Note: Statistics as of 12/31/17 unless otherwise stated(1) Other revenues include Fulfillment Services, Information Governance and Digital Solutions, Technology, Escrow Services Consulting, Entertainment Services, Fine Art
Storage, Consumer Storage and other ancillary services(2) Based on annualized Q4 2017
Global Footprint Business Mix
6 CONTINENTS53 COUNTRIES
225,000+customers
95%Fortune 1000
companies
85MM+SF of real estate
Data Center, 1%
Records
Management
66%
Shredding
10%
Data
Protection
14%
Other(1)
10%
Storage - 81%
Service - 19%
1,400+Facilities
Adj. Gross Profit: $2.3B(2)Revenue: $4.0B(2)
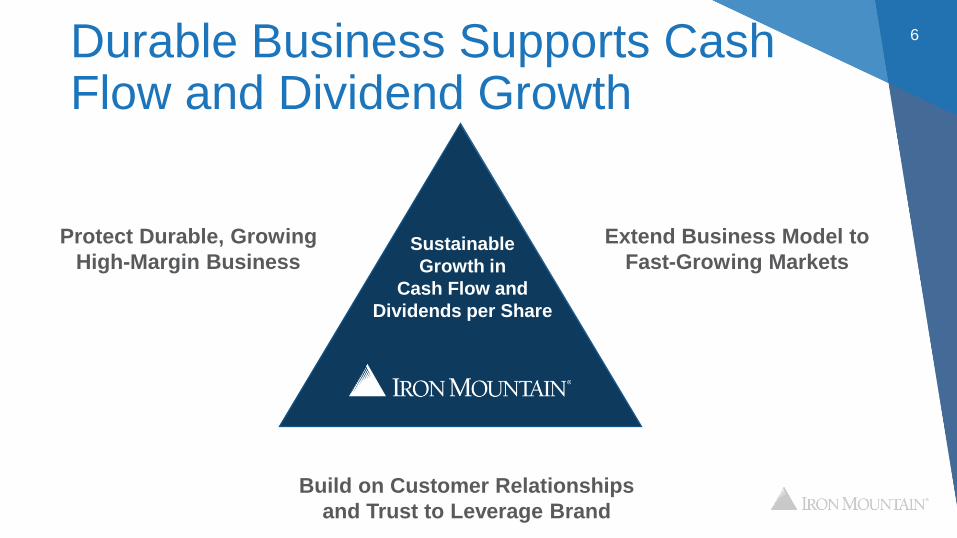
Durable Business Supports Cash Flow and Dividend Growth
6
Extend Business Model to
Fast-Growing Markets
Build on Customer Relationships
and Trust to Leverage Brand
Sustainable Growth in
Cash Flow and
Dividends per Share
Protect Durable, Growing
High-Margin Business Sustainable
Growth in
Cash Flow and
Dividends per Share
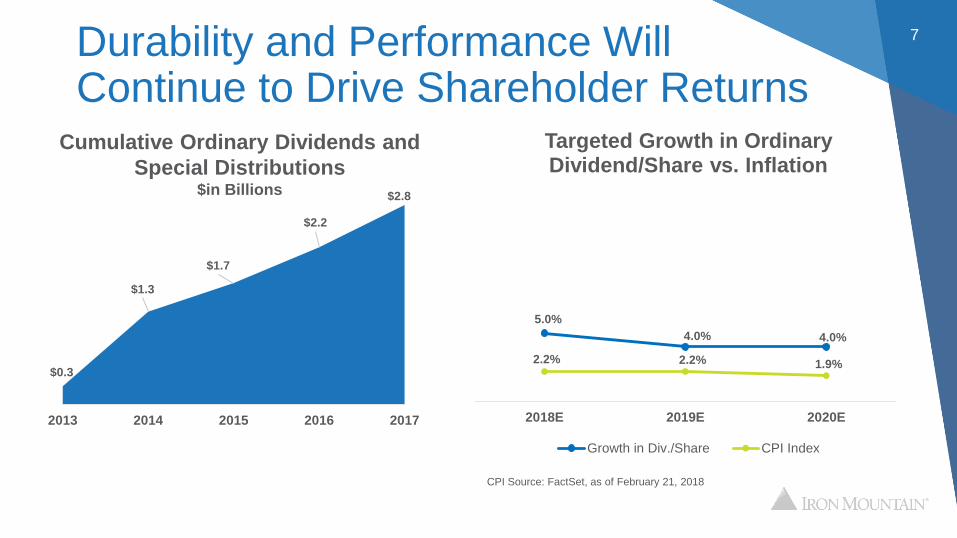
7Durability and Performance Will Continue to Drive Shareholder Returns
$0.3
$1.3
$1.7
$2.2
$2.8
2013 2014 2015 2016 2017
Cumulative Ordinary Dividends and
Special Distributions $in Billions
5.0%
4.0% 4.0%
2.2% 2.2% 1.9%
2018E 2019E 2020E
Targeted Growth in Ordinary Dividend/Share vs. Inflation
Growth in Div./Share CPI Index
CPI Source: FactSet, as of February 21, 2018
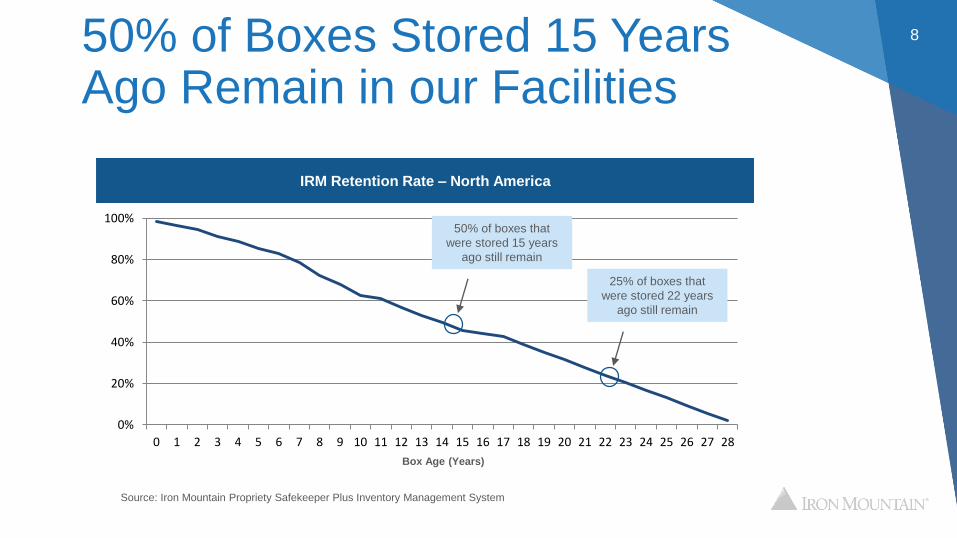
50% of Boxes Stored 15 Years Ago Remain in our Facilities
8
0%
20%
40%
60%
80%
100%
0 1 2 3 4 5 6 7 8 9 10 11 12 13 14 15 16 17 18 19 20 21 22 23 24 25 26 27 28
IRM Retention Rate – North America
25% of boxes that
were stored 22 years
ago still remain
Box Age (Years)
Source: Iron Mountain Propriety Safekeeper Plus Inventory Management System
50% of boxes that
were stored 15 years
ago still remain
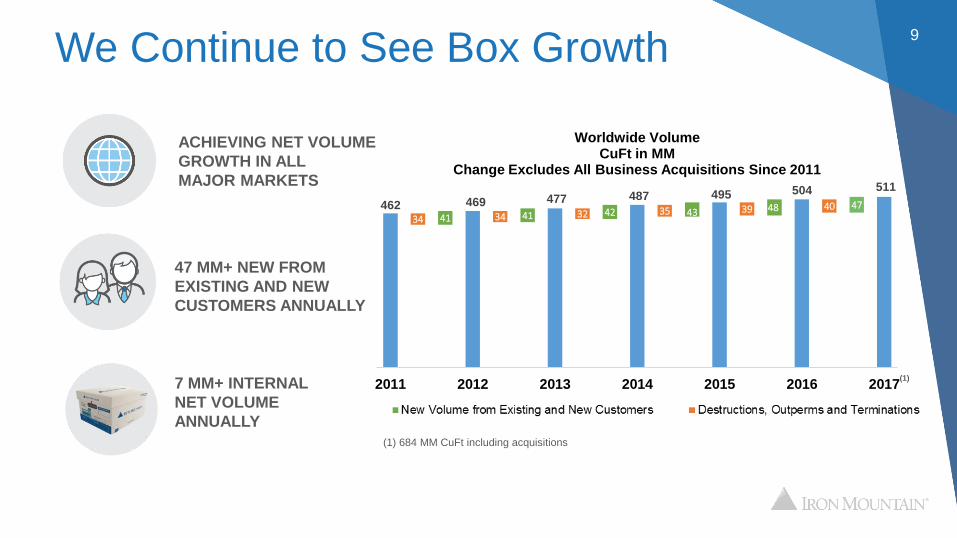
We Continue to See Box Growth9
47 MM+ NEW FROM
EXISTING AND NEW
CUSTOMERS ANNUALLY
7 MM+ INTERNAL
NET VOLUME
ANNUALLY
ACHIEVING NET VOLUME
GROWTH IN ALL
MAJOR MARKETS
462 469 477 487 495 504 511
34 41 34 41 32 42 35 43 39 48 40 47
2011 2012 2013 2014 2015 2016 2017
Worldwide Volume CuFt in MM
Change Excludes All Business Acquisitions Since 2011
(1) 684 MM CuFt including acquisitions
(1)
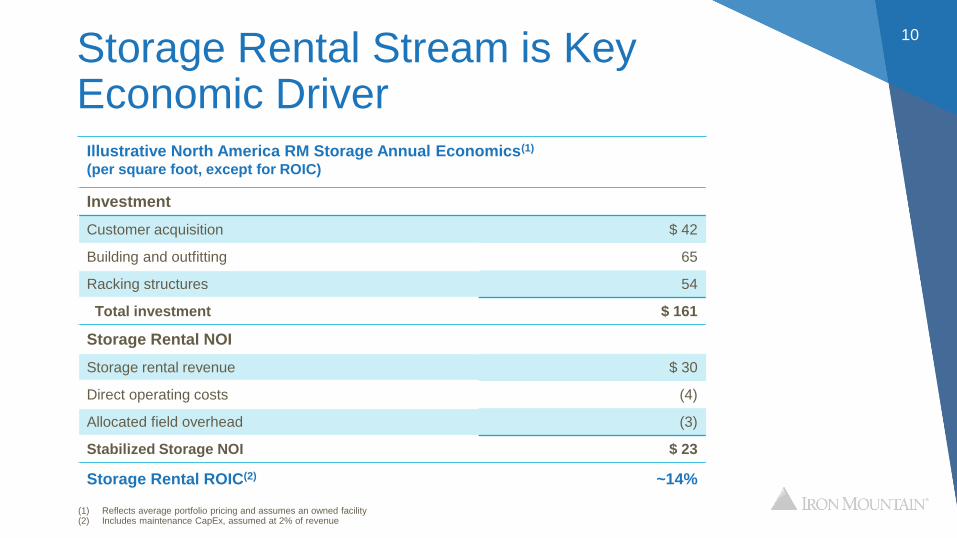
Storage Rental Stream is Key Economic Driver
10
Illustrative North America RM Storage Annual Economics(1)
(per square foot, except for ROIC)
Investment
Customer acquisition $ 42
Building and outfitting 65
Racking structures 54
Total investment $ 161
Storage Rental NOI
Storage rental revenue $ 30
Direct operating costs (4)
Allocated field overhead (3)
Stabilized Storage NOI $ 23
Storage Rental ROIC(2) ~14%
(1) Reflects average portfolio pricing and assumes an owned facility(2) Includes maintenance CapEx, assumed at 2% of revenue
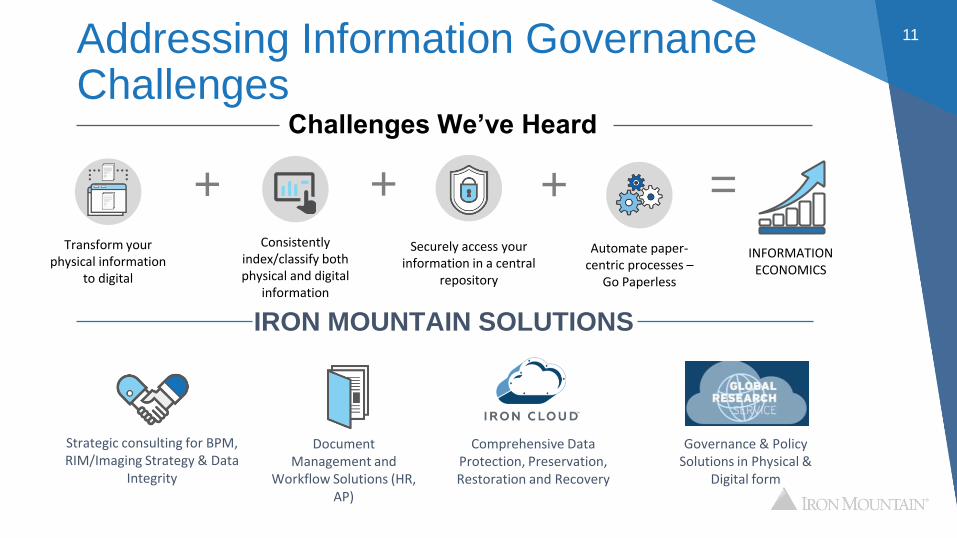
Addressing Information Governance Challenges
11
IRON MOUNTAIN SOLUTIONS
+ =+ +Automate paper-
centric processes –Go Paperless
Securely access your information in a central
repository
Transform your physical information
to digital
Consistently index/classify both physical and digital
information
INFORMATION ECONOMICS
Document Management and
Workflow Solutions (HR, AP)
Strategic consulting for BPM, RIM/Imaging Strategy & Data
Integrity
Comprehensive Data Protection, Preservation, Restoration and Recovery
Challenges We’ve Heard
Governance & Policy Solutions in Physical &
Digital form
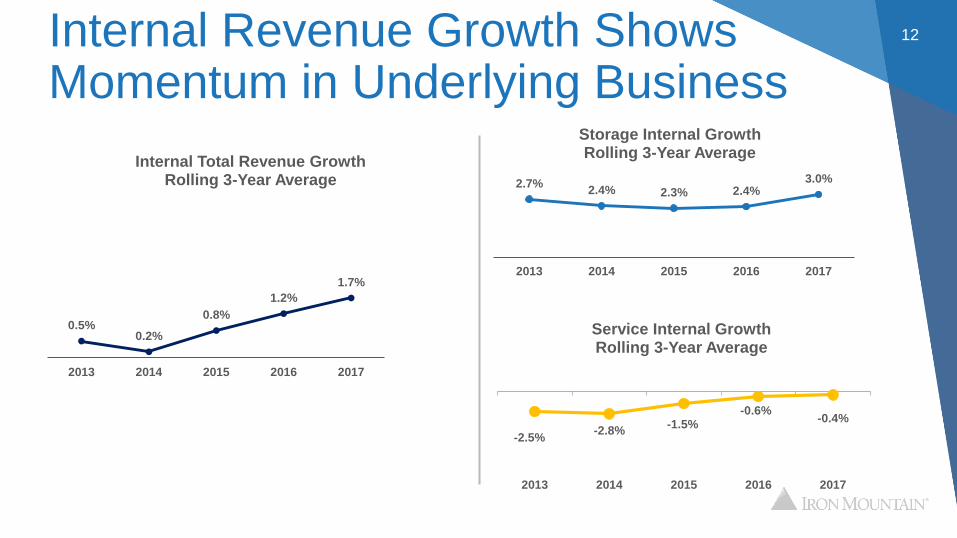
Internal Revenue Growth Shows Momentum in Underlying Business
12
0.5%0.2%
0.8%
1.2%
1.7%
2013 2014 2015 2016 2017
Internal Total Revenue GrowthRolling 3-Year Average 2.7%
2.4% 2.3% 2.4%3.0%
2013 2014 2015 2016 2017
Storage Internal GrowthRolling 3-Year Average
-2.5%-2.8%
-1.5%-0.6%
-0.4%
2013 2014 2015 2016 2017
Service Internal GrowthRolling 3-Year Average
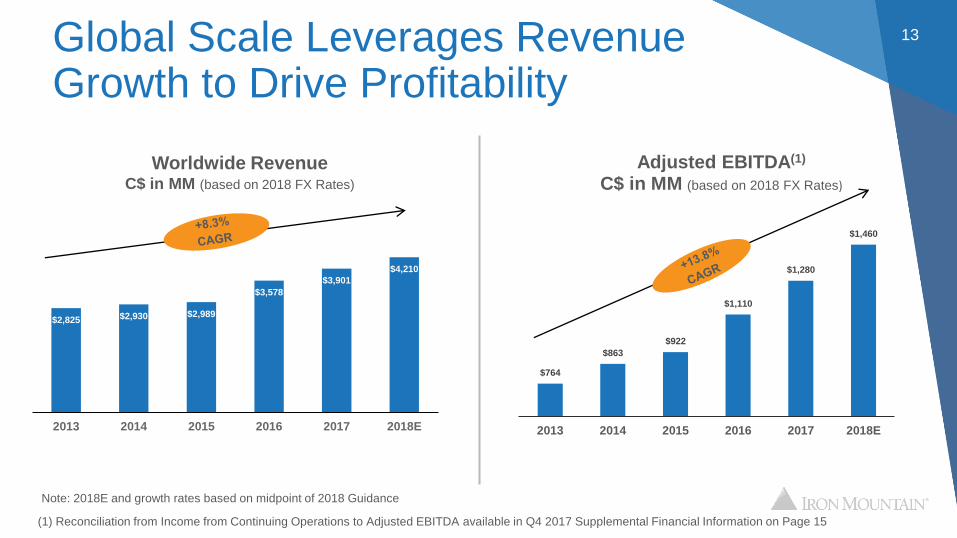
13Global Scale Leverages Revenue Growth to Drive Profitability
$764
$863
$922
$1,110
$1,280
$1,460
2013 2014 2015 2016 2017 2018E
Adjusted EBITDA(1)
C$ in MM (based on 2018 FX Rates)
Worldwide Revenue C$ in MM (based on 2018 FX Rates)
$2,825 $2,930 $2,989
$3,578
$3,901
$4,210
2013 2014 2015 2016 2017 2018E
Note: 2018E and growth rates based on midpoint of 2018 Guidance
(1) Reconciliation from Income from Continuing Operations to Adjusted EBITDA available in Q4 2017 Supplemental Financial Information on Page 15
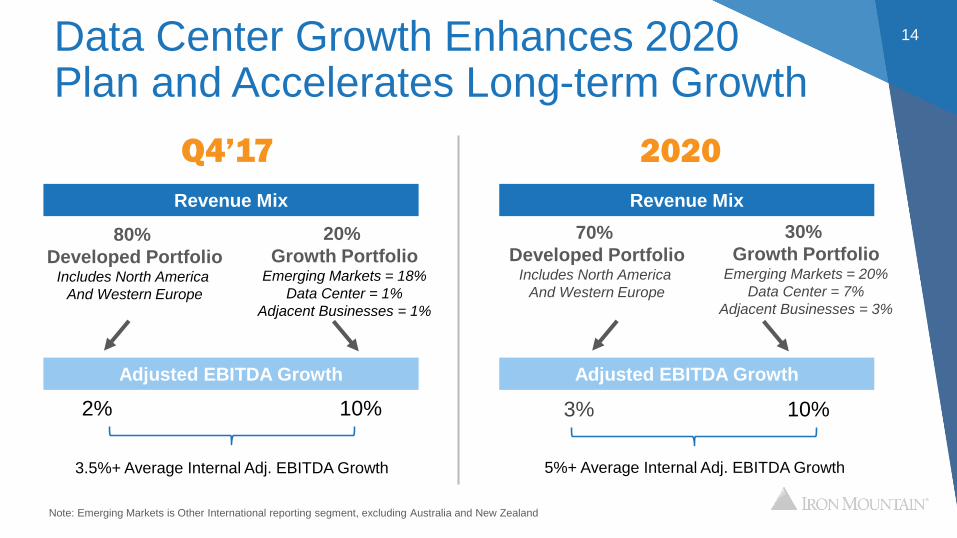
Data Center Growth Enhances 2020 Plan and Accelerates Long-term Growth
14
80%
Developed PortfolioIncludes North America
And Western Europe
20%
Growth PortfolioEmerging Markets = 18%
Data Center = 1%
Adjacent Businesses = 1%
2% 10%
3.5%+ Average Internal Adj. EBITDA Growth
Q4’17 2020
Revenue Mix
Adjusted EBITDA Growth
70%
Developed PortfolioIncludes North America
And Western Europe
30%
Growth PortfolioEmerging Markets = 20%
Data Center = 7%
Adjacent Businesses = 3%
3% 10%
5%+ Average Internal Adj. EBITDA Growth
Revenue Mix
Adjusted EBITDA Growth
Note: Emerging Markets is Other International reporting segment, excluding Australia and New Zealand
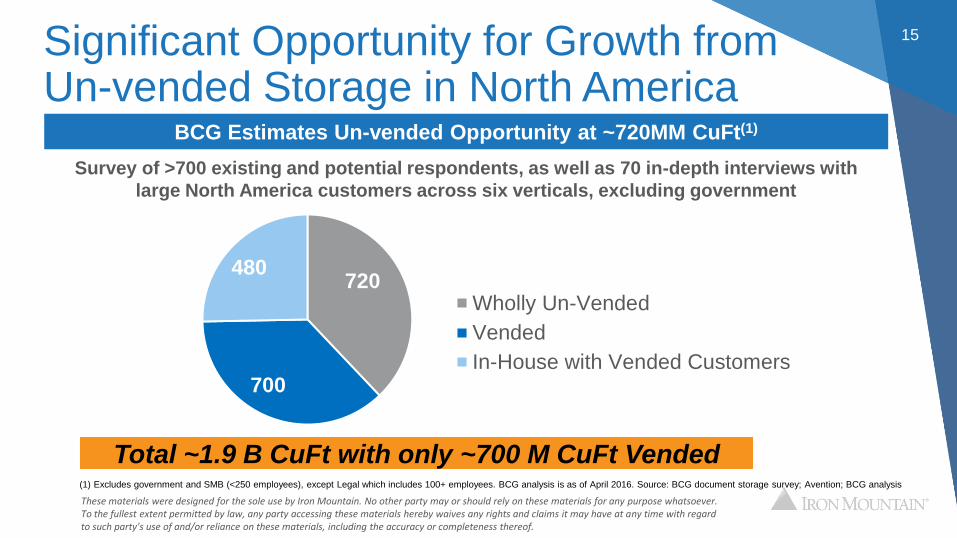
15
720
700
480
Wholly Un-Vended
Vended
In-House with Vended Customers
Significant Opportunity for Growth from Un-vended Storage in North America
Total ~1.9 B CuFt with only ~700 M CuFt Vended(1) Excludes government and SMB (<250 employees), except Legal which includes 100+ employees. BCG analysis is as of April 2016. Source: BCG document storage survey; Avention; BCG analysis
These materials were designed for the sole use by Iron Mountain. No other party may or should rely on these materials for any purpose whatsoever. To the fullest extent permitted by law, any party accessing these materials hereby waives any rights and claims it may have at any time with regard to such party's use of and/or reliance on these materials, including the accuracy or completeness thereof.
BCG Estimates Un-vended Opportunity at ~720MM CuFt(1)
Survey of >700 existing and potential respondents, as well as 70 in-depth interviews with
large North America customers across six verticals, excluding government
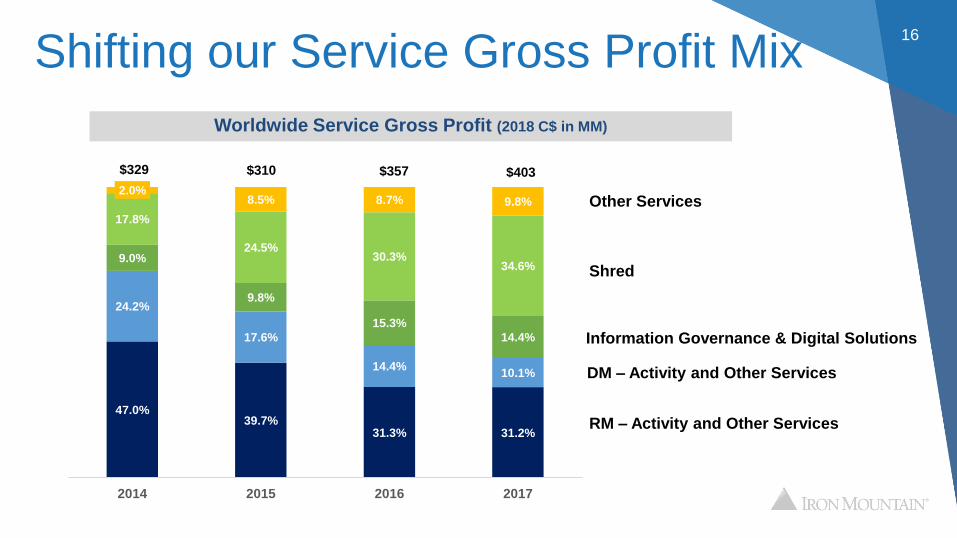
Shifting our Service Gross Profit Mix 16
Worldwide Service Gross Profit (2018 C$ in MM)
RM – Activity and Other Services
Shred
DM – Activity and Other Services
Information Governance & Digital Solutions
Other Services
47.0% 39.7%
31.3% 31.2%
24.2%
17.6%
14.4% 10.1%
9.0%
9.8%
15.3%
14.4%
17.8%
24.5% 30.3%
34.6%
2.0% 8.5% 8.7% 9.8%
2014 2015 2016 2017
$329 $310 $357 $403
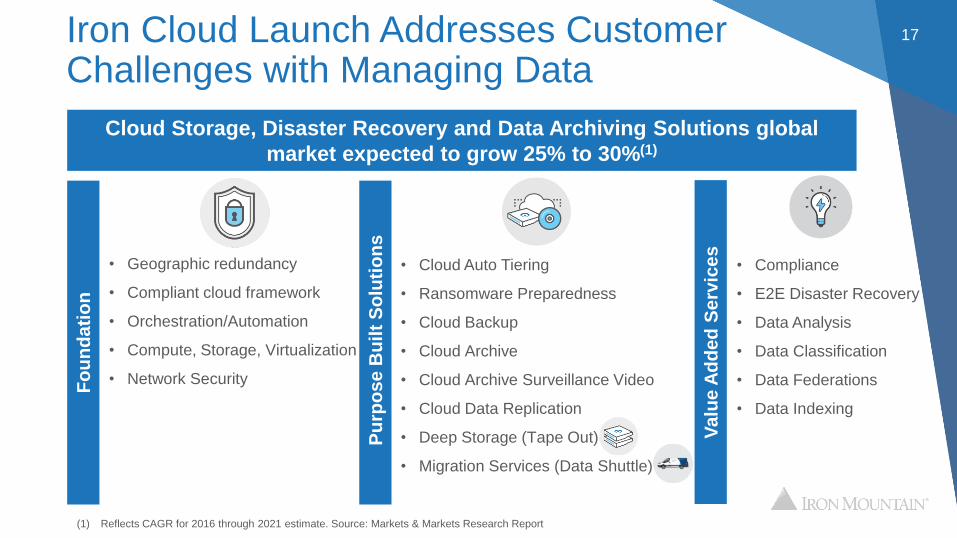
Iron Cloud Launch Addresses Customer Challenges with Managing Data
17
Cloud Storage, Disaster Recovery and Data Archiving Solutions global
market expected to grow 25% to 30%(1)
(1) Reflects CAGR for 2016 through 2021 estimate. Source: Markets & Markets Research Report
Fo
un
da
tio
n
Pu
rpo
se
Bu
ilt
So
luti
on
s
Va
lue
Ad
de
d S
erv
ice
s
• Geographic redundancy
• Compliant cloud framework
• Orchestration/Automation
• Compute, Storage, Virtualization
• Network Security
• Compliance
• E2E Disaster Recovery
• Data Analysis
• Data Classification
• Data Federations
• Data Indexing
• Cloud Auto Tiering
• Ransomware Preparedness
• Cloud Backup
• Cloud Archive
• Cloud Archive Surveillance Video
• Cloud Data Replication
• Deep Storage (Tape Out)
• Migration Services (Data Shuttle)
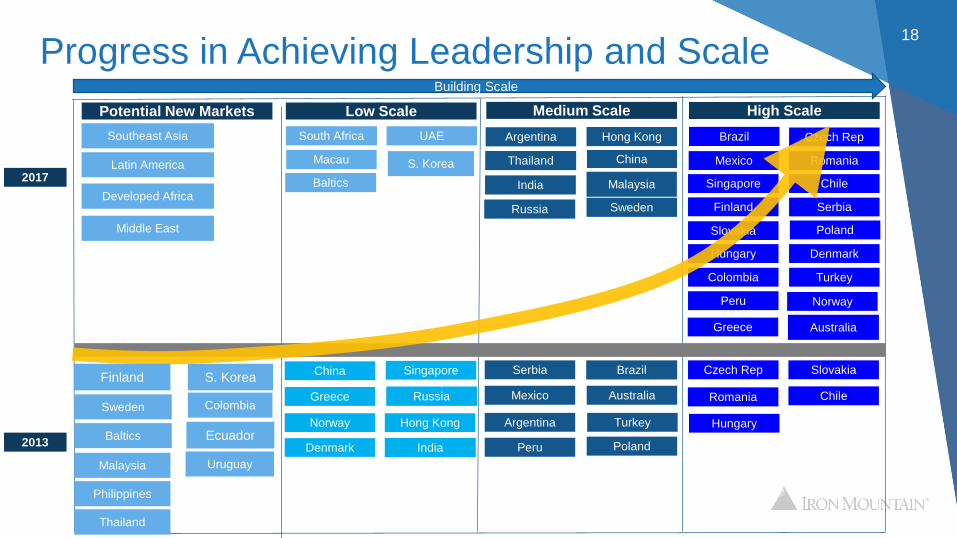
Progress in Achieving Leadership and Scale18
Potential New Markets
2013
2017
Romania
Slovakia
Hungary
Czech Rep
Chile
Poland
Mexico Australia
Peru
Turkey
China Singapore
ArgentinaHong Kong
BrazilSerbia
RussiaGreece
China
Finland
Hong Kong
Singapore
Argentina
Serbia
Colombia
Peru
Turkey
Romania
Slovakia
Hungary
Czech Rep
Chile
Brazil
MexicoMacau S. Korea
Building Scale
Baltics
UAE
Norway
Malaysia
Thailand
Sweden
Denmark
India
Denmark
Norway
Greece
South Africa
Australia
Russia
India
Low Scale Medium Scale High Scale
Poland
Developed Africa
Middle East
Southeast Asia
Sweden Colombia
Malaysia
Philippines
S. Korea
Uruguay
Thailand
EcuadorBaltics
Finland
Latin America
Compelling Data
Center Opportunity
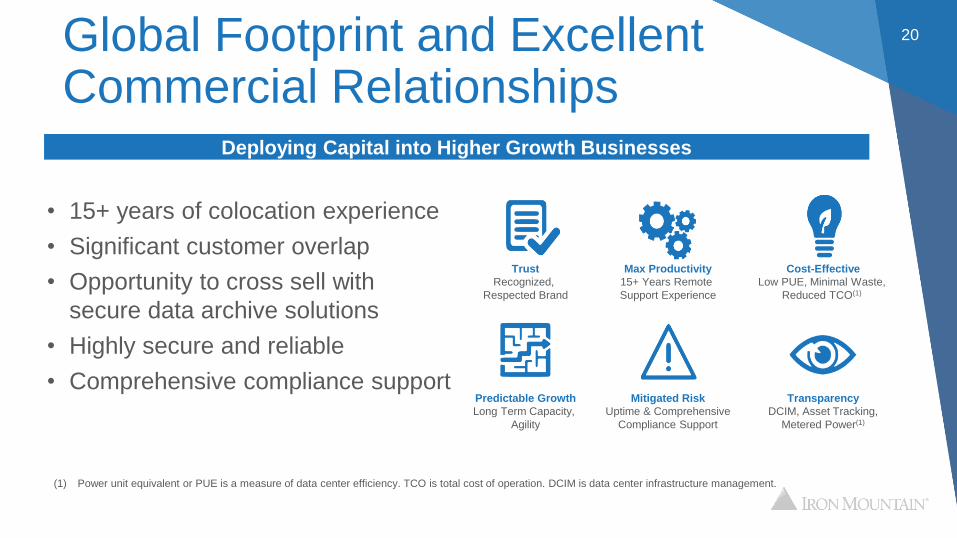
Global Footprint and Excellent Commercial Relationships
20
• 15+ years of colocation experience
• Significant customer overlap
• Opportunity to cross sell with
secure data archive solutions
• Highly secure and reliable
• Comprehensive compliance support
Trust
Recognized,
Respected Brand
Max Productivity
15+ Years Remote
Support Experience
Cost-Effective
Low PUE, Minimal Waste,
Reduced TCO(1)
Predictable Growth
Long Term Capacity,
Agility
Mitigated Risk
Uptime & Comprehensive
Compliance Support
Transparency
DCIM, Asset Tracking,
Metered Power(1)
Deploying Capital into Higher Growth Businesses
(1) Power unit equivalent or PUE is a measure of data center efficiency. TCO is total cost of operation. DCIM is data center infrastructure management.
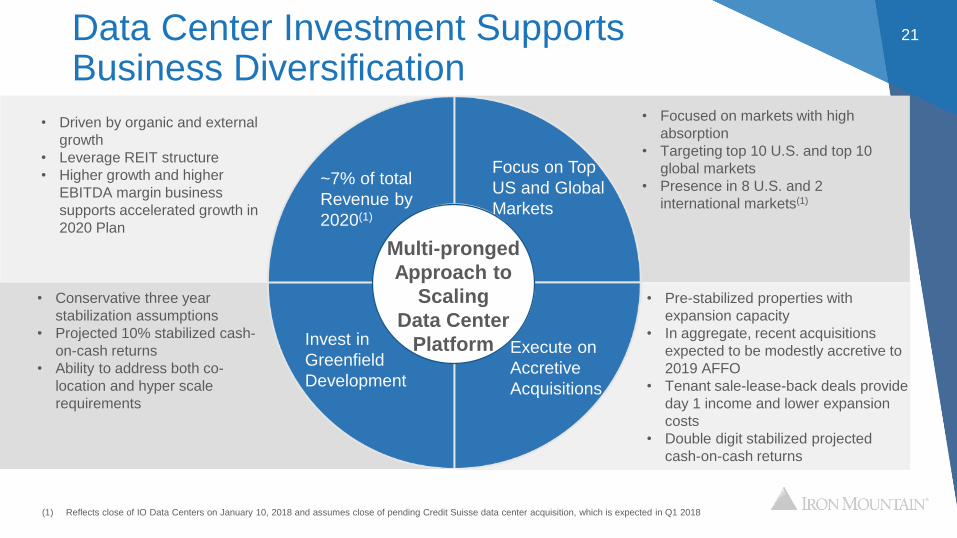
Data Center Investment Supports Business Diversification
21
(1) Reflects close of IO Data Centers on January 10, 2018 and assumes close of pending Credit Suisse data center acquisition, which is expected in Q1 2018
~7% of total
Revenue by
2020(1)
Focus on Top
US and Global
Markets
Invest in
Greenfield
Development
Execute on
Accretive
Acquisitions
• Driven by organic and external
growth
• Leverage REIT structure
• Higher growth and higher
EBITDA margin business
supports accelerated growth in
2020 Plan
• Conservative three year
stabilization assumptions
• Projected 10% stabilized cash-
on-cash returns
• Ability to address both co-
location and hyper scale
requirements
• Focused on markets with high
absorption
• Targeting top 10 U.S. and top 10
global markets
• Presence in 8 U.S. and 2
international markets(1)
• Pre-stabilized properties with
expansion capacity
• In aggregate, recent acquisitions
expected to be modestly accretive to
2019 AFFO
• Tenant sale-lease-back deals provide
day 1 income and lower expansion
costs
• Double digit stabilized projected
cash-on-cash returns
Multi-pronged
Approach to
Scaling
Data Center
Platform
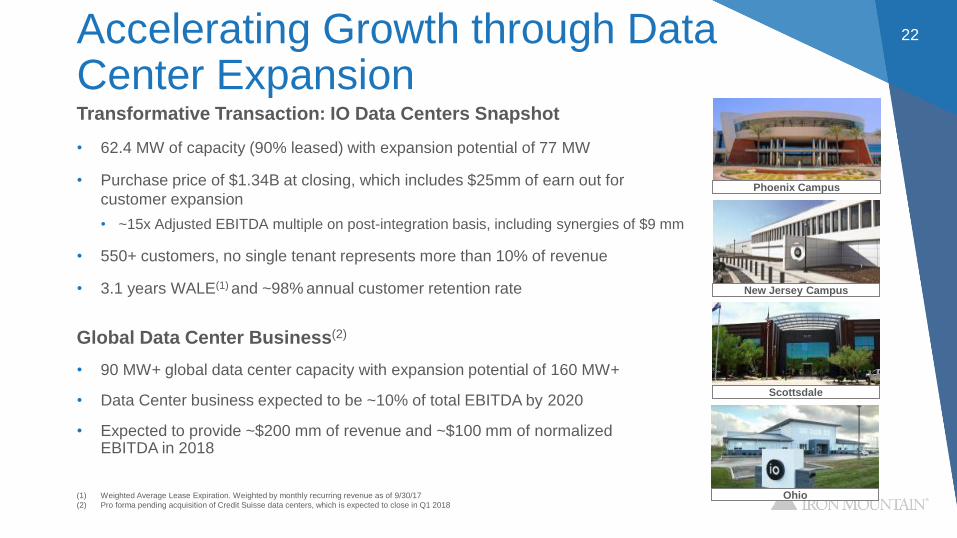
Accelerating Growth through Data Center Expansion
22
Transformative Transaction: IO Data Centers Snapshot
• 62.4 MW of capacity (90% leased) with expansion potential of 77 MW
• Purchase price of $1.34B at closing, which includes $25mm of earn out for
customer expansion
• ~15x Adjusted EBITDA multiple on post-integration basis, including synergies of $9 mm
• 550+ customers, no single tenant represents more than 10% of revenue
• 3.1 years WALE(1) and ~98% annual customer retention rate
(1) Weighted Average Lease Expiration. Weighted by monthly recurring revenue as of 9/30/17
(2) Pro forma pending acquisition of Credit Suisse data centers, which is expected to close in Q1 2018
Global Data Center Business(2)
• 90 MW+ global data center capacity with expansion potential of 160 MW+
• Data Center business expected to be ~10% of total EBITDA by 2020
• Expected to provide ~$200 mm of revenue and ~$100 mm of normalized EBITDA in 2018
Ohio
New Jersey Campus
Scottsdale
Phoenix Campus
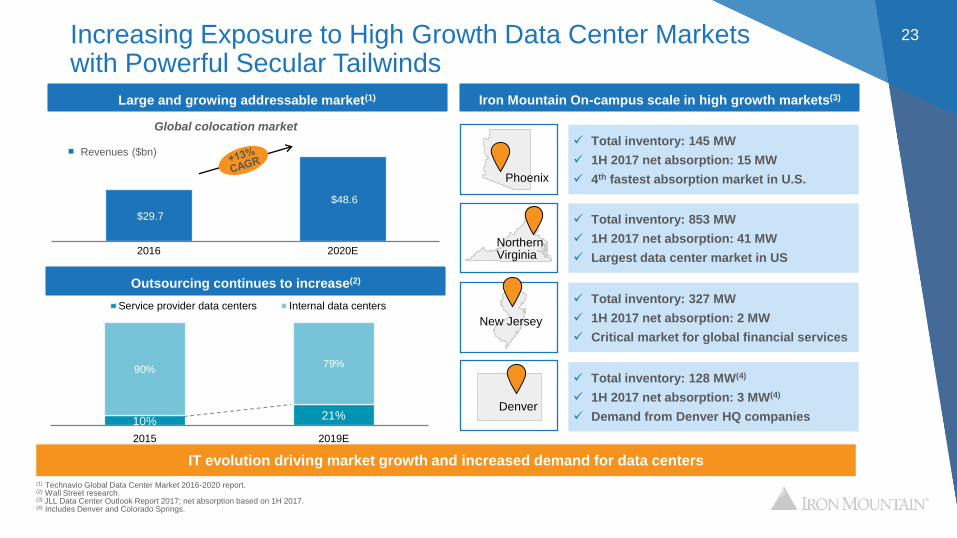
23Increasing Exposure to High Growth Data Center Markets with Powerful Secular Tailwinds
$29.7
$48.6
2016 2020E
Outsourcing continues to increase(2)
IT evolution driving market growth and increased demand for data centers
10%21%
90%79%
2015 2019E
Service provider data centers Internal data centers
Large and growing addressable market(1)
Revenues ($bn)
(1) Technavio Global Data Center Market 2016-2020 report.(2) Wall Street research.(3) JLL Data Center Outlook Report 2017; net absorption based on 1H 2017.(4) Includes Denver and Colorado Springs.
Iron Mountain On-campus scale in high growth markets(3)
Total inventory: 145 MW
1H 2017 net absorption: 15 MW
4th fastest absorption market in U.S.
Total inventory: 128 MW(4)
1H 2017 net absorption: 3 MW(4)
Demand from Denver HQ companies
Total inventory: 853 MW
1H 2017 net absorption: 41 MW
Largest data center market in US
Total inventory: 327 MW
1H 2017 net absorption: 2 MW
Critical market for global financial services
Phoenix
Denver
NorthernVirginia
New Jersey
Global colocation market

Disciplined Capital
Allocation and Long-
term Outlook
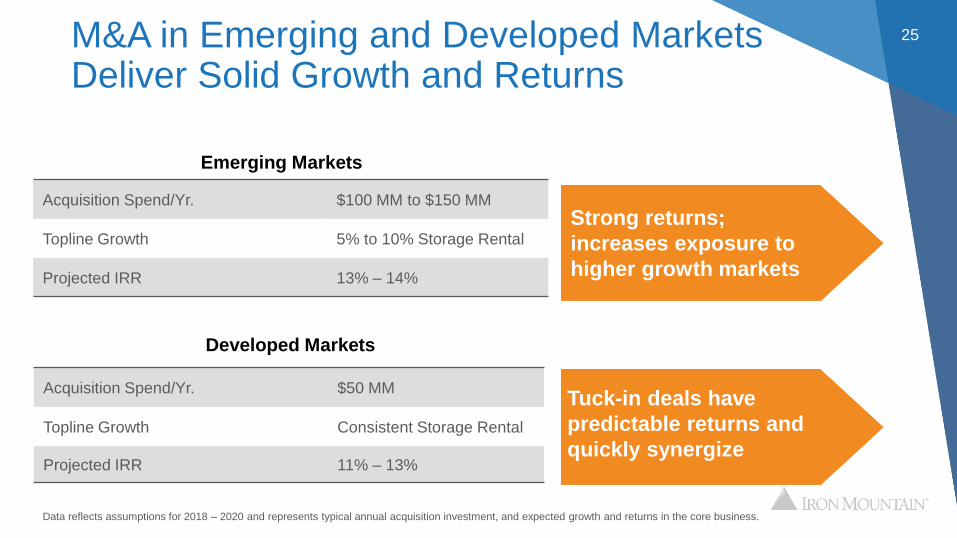
M&A in Emerging and Developed Markets Deliver Solid Growth and Returns
25
Acquisition Spend/Yr. $100 MM to $150 MM
Topline Growth 5% to 10% Storage Rental
Projected IRR 13% – 14%
Emerging Markets
Acquisition Spend/Yr. $50 MM
Topline Growth Consistent Storage Rental
Projected IRR 11% – 13%
Developed Markets
Tuck-in deals have
predictable returns and
quickly synergize
Data reflects assumptions for 2018 – 2020 and represents typical annual acquisition investment, and expected growth and returns in the core business.
Strong returns;
increases exposure to
higher growth markets
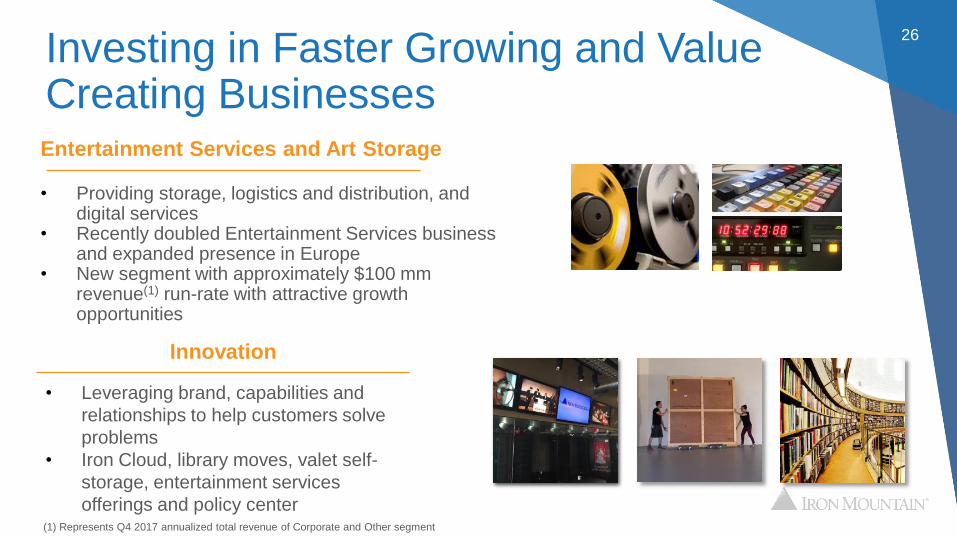
Investing in Faster Growing and Value Creating Businesses
26
Innovation
• Leveraging brand, capabilities and
relationships to help customers solve
problems
• Iron Cloud, library moves, valet self-
storage, entertainment services
offerings and policy center
Entertainment Services and Art Storage
• Providing storage, logistics and distribution, and digital services
• Recently doubled Entertainment Services business and expanded presence in Europe
• New segment with approximately $100 mm revenue(1) run-rate with attractive growth opportunities
(1) Represents Q4 2017 annualized total revenue of Corporate and Other segment
Sizable Real Estate Portfolio27
Storage
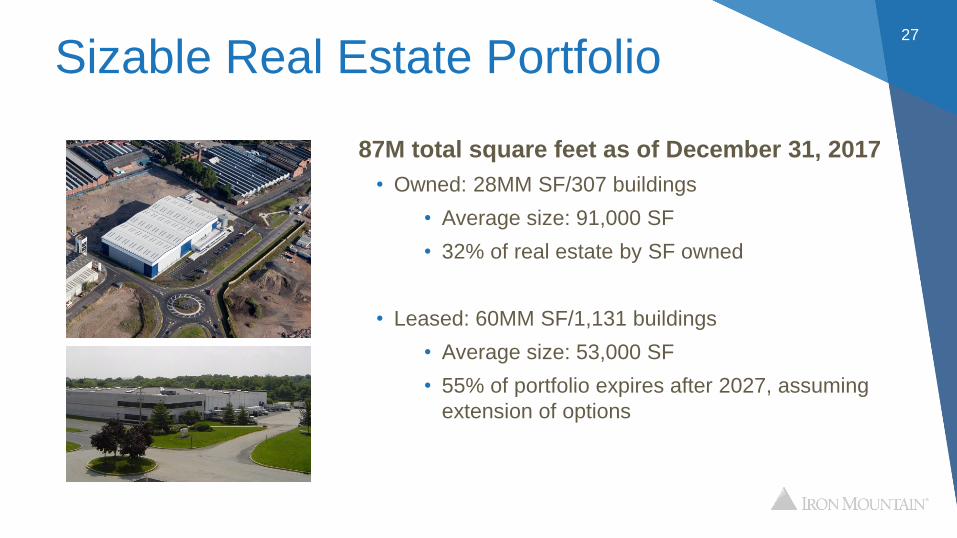
87M total square feet as of December 31, 2017
• Owned: 28MM SF/307 buildings
• Average size: 91,000 SF
• 32% of real estate by SF owned
• Leased: 60MM SF/1,131 buildings
• Average size: 53,000 SF
• 55% of portfolio expires after 2027, assuming
extension of options
Real Estate Value Creation Opportunities
28
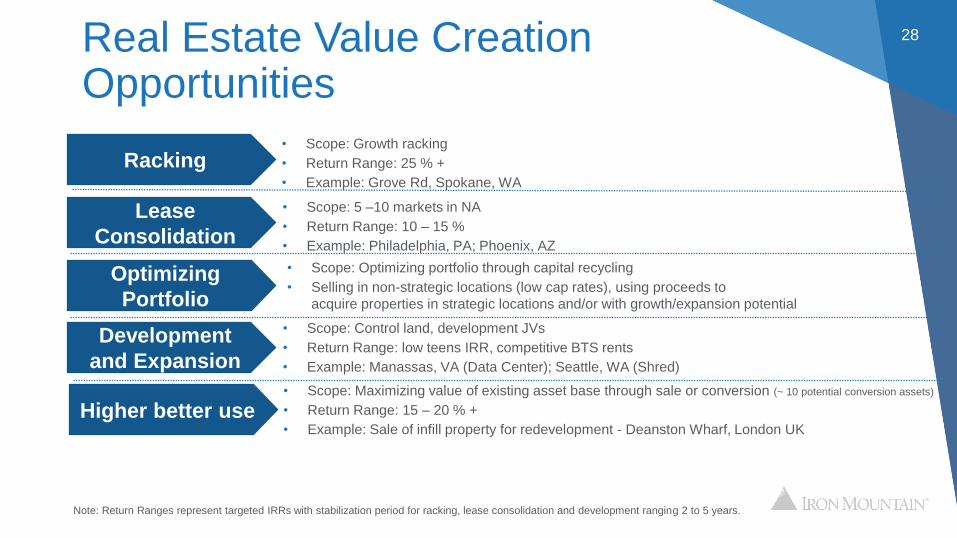
Lease
Consolidation
• Scope: 5 –10 markets in NA
• Return Range: 10 – 15 %
• Example: Philadelphia, PA; Phoenix, AZ
Development
and Expansion
• Scope: Control land, development JVs
• Return Range: low teens IRR, competitive BTS rents
• Example: Manassas, VA (Data Center); Seattle, WA (Shred)
Optimizing
Portfolio
• Scope: Optimizing portfolio through capital recycling
• Selling in non-strategic locations (low cap rates), using proceeds to
acquire properties in strategic locations and/or with growth/expansion potential
Higher better use• Scope: Maximizing value of existing asset base through sale or conversion (~ 10 potential conversion assets)
• Return Range: 15 – 20 % +
• Example: Sale of infill property for redevelopment - Deanston Wharf, London UK
Racking• Scope: Growth racking
• Return Range: 25 % +
• Example: Grove Rd, Spokane, WA
Note: Return Ranges represent targeted IRRs with stabilization period for racking, lease consolidation and development ranging 2 to 5 years.
Real Estate Quality Underpins Balance Sheet
29
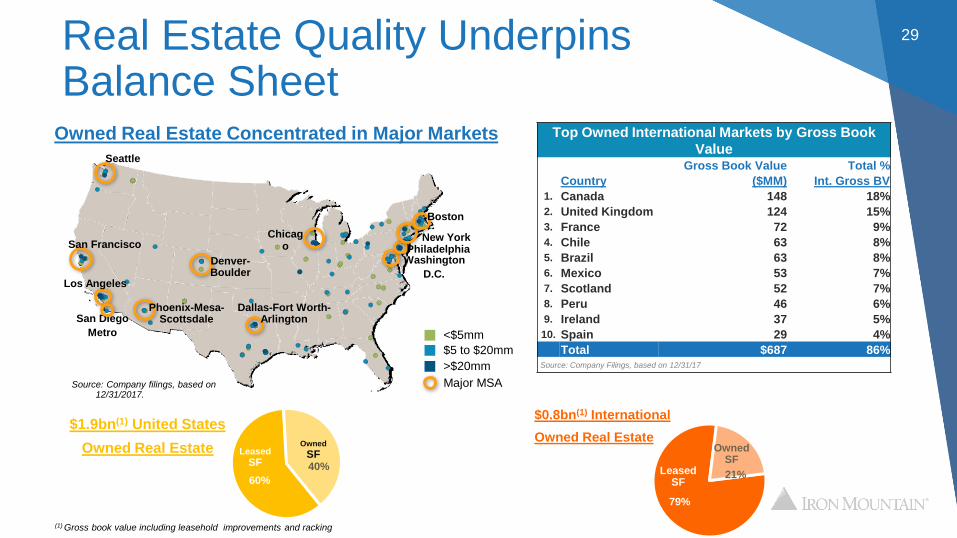
Owned Real Estate Concentrated in Major Markets
NY0086JT / 645841_1.wor
Denver-Boulder
San Francisco
Los Angeles
Phoenix-Mesa-Scottsdale
Dallas-Fort Worth-Arlington
Chicago
Washington
D.C.
Philadelphia
Boston
New York
Seattle
San Diego
Metro
Source: Company filings, based on 12/31/2017.
(1) Gross book value including leasehold improvements and racking
$5 to $20mm
>$20mm
<$5mm
Major MSA
60%
40%
Owned
SFLeased
SF
$1.9bn(1) United States
Owned Real Estate
Top Owned International Markets by Gross Book
ValueGross Book Value Total %
Country ($MM) Int. Gross BV
1. Canada 148 18%
2. United Kingdom 124 15%
3. France 72 9%
4. Chile 63 8%
5. Brazil 63 8%
6. Mexico 53 7%
7. Scotland 52 7%
8. Peru 46 6%
9. Ireland 37 5%
10. Spain 29 4%
Total $687 86%Source: Company Filings, based on 12/31/17
79%
21%
Owned SF
Leased SF
$0.8bn(1) International
Owned Real Estate
2018 Guidance Demonstrates Drives Strong Cash Flow and Dividend Coverage
30
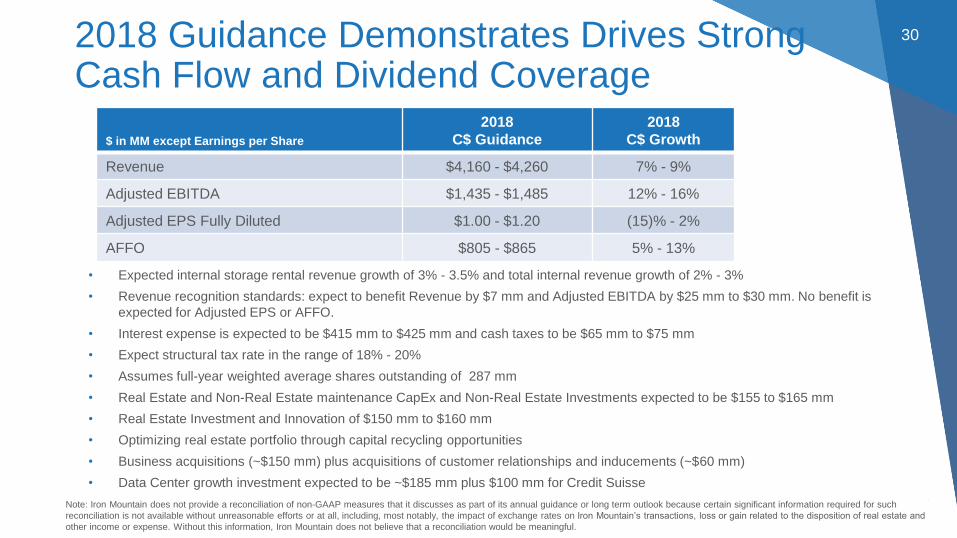
• Expected internal storage rental revenue growth of 3% - 3.5% and total internal revenue growth of 2% - 3%
• Revenue recognition standards: expect to benefit Revenue by $7 mm and Adjusted EBITDA by $25 mm to $30 mm. No benefit is
expected for Adjusted EPS or AFFO.
• Interest expense is expected to be $415 mm to $425 mm and cash taxes to be $65 mm to $75 mm
• Expect structural tax rate in the range of 18% - 20%
• Assumes full-year weighted average shares outstanding of 287 mm
• Real Estate and Non-Real Estate maintenance CapEx and Non-Real Estate Investments expected to be $155 to $165 mm
• Real Estate Investment and Innovation of $150 mm to $160 mm
• Optimizing real estate portfolio through capital recycling opportunities
• Business acquisitions (~$150 mm) plus acquisitions of customer relationships and inducements (~$60 mm)
• Data Center growth investment expected to be ~$185 mm plus $100 mm for Credit Suisse
$ in MM except Earnings per Share
2018
C$ Guidance
2018
C$ Growth
Revenue $4,160 - $4,260 7% - 9%
Adjusted EBITDA $1,435 - $1,485 12% - 16%
Adjusted EPS Fully Diluted $1.00 - $1.20 (15)% - 2%
AFFO $805 - $865 5% - 13%
Note: Iron Mountain does not provide a reconciliation of non-GAAP measures that it discusses as part of its annual guidance or long term outlook because certain significant information required for such
reconciliation is not available without unreasonable efforts or at all, including, most notably, the impact of exchange rates on Iron Mountain’s transactions, loss or gain related to the disposition of real estate and
other income or expense. Without this information, Iron Mountain does not believe that a reconciliation would be meaningful.
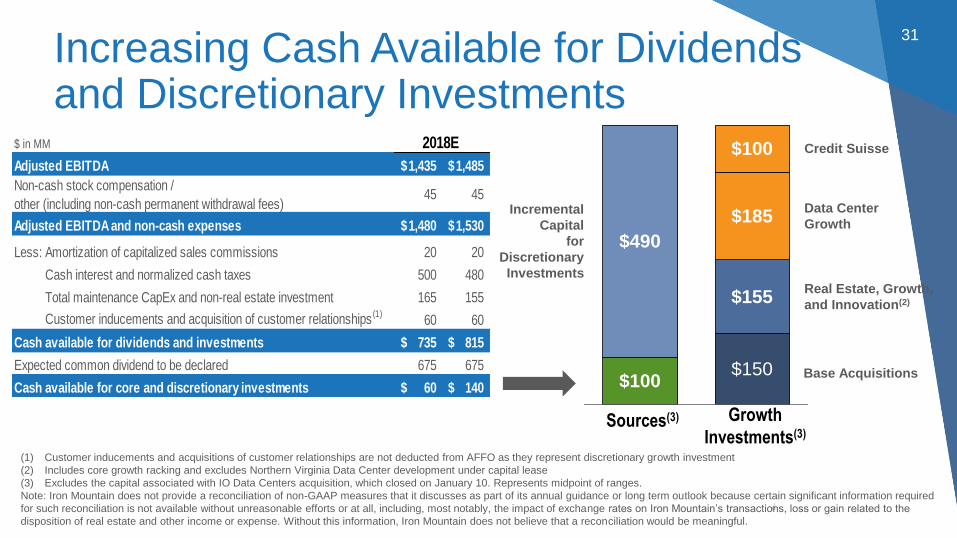
Increasing Cash Available for Dividends and Discretionary Investments
31
$155
$185
$100
$100
$490
$150
Real Estate, Growth,
and Innovation(2)
Data Center
Growth
Credit Suisse
Incremental
Capital
for
Discretionary
Investments
Growth
Investments(3)Sources(3)
(1) Customer inducements and acquisitions of customer relationships are not deducted from AFFO as they represent discretionary growth investment
(2) Includes core growth racking and excludes Northern Virginia Data Center development under capital lease
(3) Excludes the capital associated with IO Data Centers acquisition, which closed on January 10. Represents midpoint of ranges.
Note: Iron Mountain does not provide a reconciliation of non-GAAP measures that it discusses as part of its annual guidance or long term outlook because certain significant information required
for such reconciliation is not available without unreasonable efforts or at all, including, most notably, the impact of exchange rates on Iron Mountain’s transactions, loss or gain related to the
disposition of real estate and other income or expense. Without this information, Iron Mountain does not believe that a reconciliation would be meaningful.
Base Acquisitions
$ in MM
Adjusted EBITDA 1,435$ 1,485$
Non-cash stock compensation /
other (including non-cash permanent withdrawal fees) 45 45
Adjusted EBITDA and non-cash expenses 1,480$ 1,530$
Less: Amortization of capitalized sales commissions 20 20
Cash interest and normalized cash taxes 500 480
Total maintenance CapEx and non-real estate investment 165 155
Customer inducements and acquisition of customer relationships (1)60 60
Cash available for dividends and investments 735$ 815$
Expected common dividend to be declared 675 675
Cash available for core and discretionary investments 60$ 140$
2018E
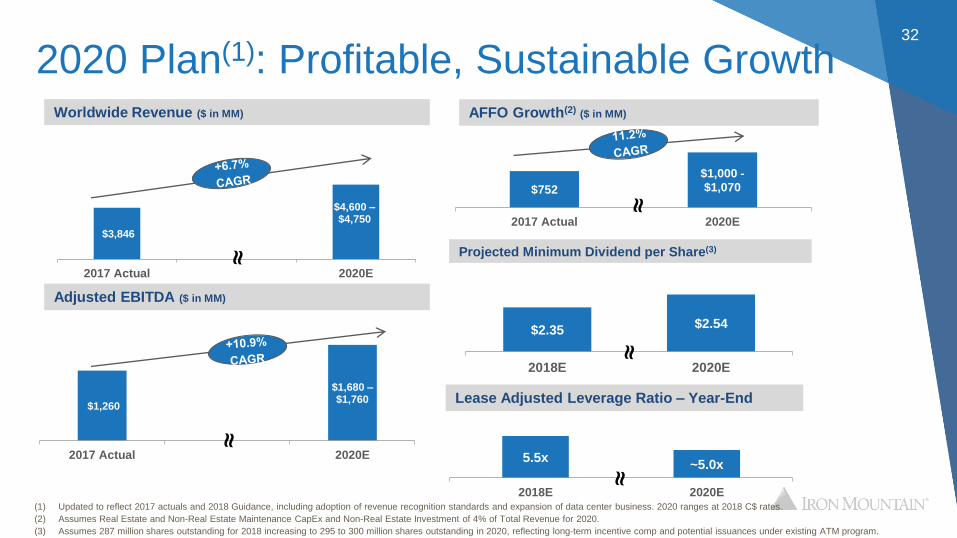
2020 Plan(1): Profitable, Sustainable Growth32
(1) Updated to reflect 2017 actuals and 2018 Guidance, including adoption of revenue recognition standards and expansion of data center business. 2020 ranges at 2018 C$ rates.
(2) Assumes Real Estate and Non-Real Estate Maintenance CapEx and Non-Real Estate Investment of 4% of Total Revenue for 2020.
(3) Assumes 287 million shares outstanding for 2018 increasing to 295 to 300 million shares outstanding in 2020, reflecting long-term incentive comp and potential issuances under existing ATM program.
Lease Adjusted Leverage Ratio – Year-End
5.5x~5.0x
2018E 2020E
$1,260
$1,680 –$1,760
2017 Actual 2020E
$3,846
$4,600 –$4,750
2017 Actual 2020E
Worldwide Revenue ($ in MM)
Adjusted EBITDA ($ in MM)
$2.35$2.54
2018E 2020E
Projected Minimum Dividend per Share(3)
$752
$1,000 -$1,070
2017 Actual 2020E
AFFO Growth(2) ($ in MM)
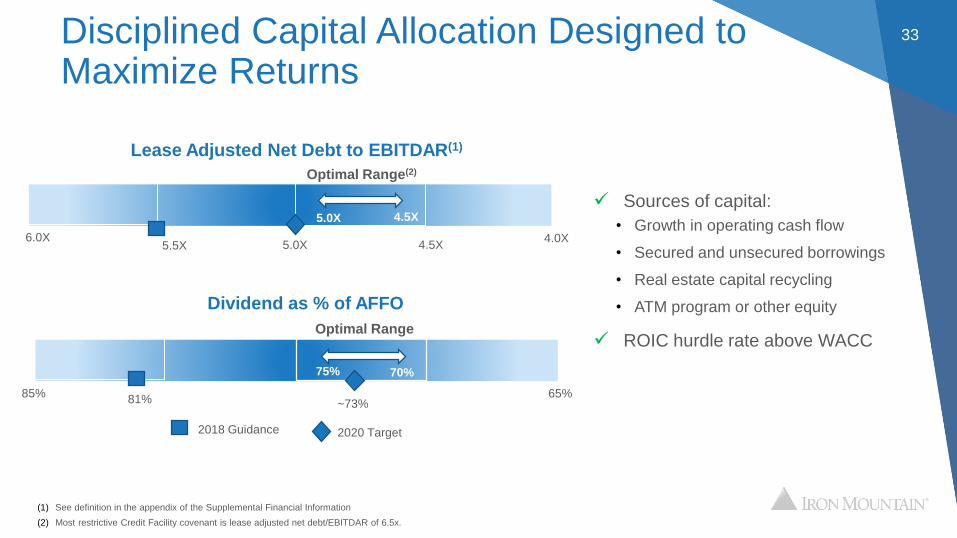
Disciplined Capital Allocation Designed to Maximize Returns
Lease Adjusted Net Debt to EBITDAR(1)
33
Dividend as % of AFFO
6.0X 4.0X
4.5X
5.0X
85% 65%
70%75%
Optimal Range(2)
Sources of capital:
• Growth in operating cash flow
• Secured and unsecured borrowings
• Real estate capital recycling
• ATM program or other equity
ROIC hurdle rate above WACC
5.0X
Optimal Range
4.5X
(1) See definition in the appendix of the Supplemental Financial Information
(2) Most restrictive Credit Facility covenant is lease adjusted net debt/EBITDAR of 6.5x.
2020 Target
~73%
5.5X
81%
2018 Guidance
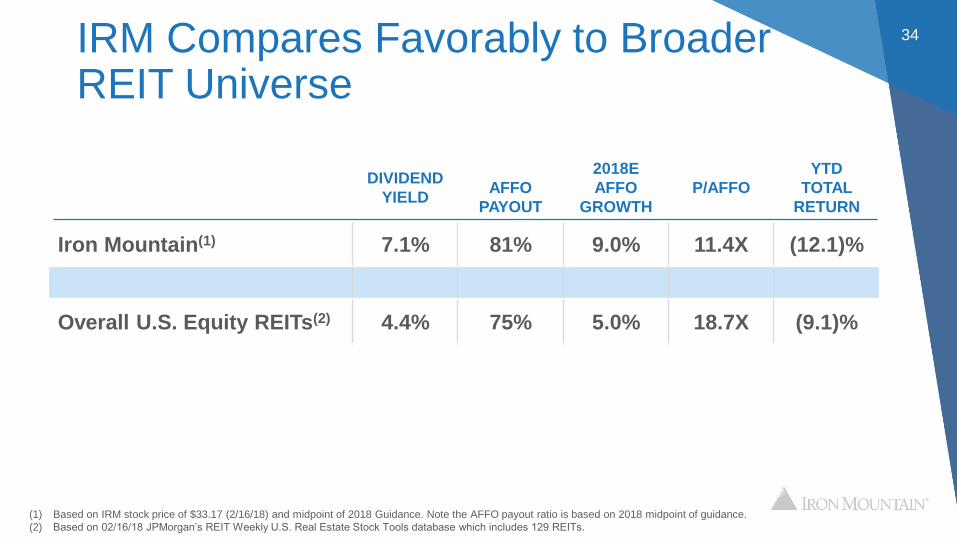
IRM Compares Favorably to Broader REIT Universe
34
DIVIDEND
YIELDAFFO
PAYOUT
2018E
AFFO
GROWTH
P/AFFO
YTD
TOTAL
RETURN
Iron Mountain(1) 7.1% 81% 9.0% 11.4X (12.1)%
Overall U.S. Equity REITs(2) 4.4% 75% 5.0% 18.7X (9.1)%
(1) Based on IRM stock price of $33.17 (2/16/18) and midpoint of 2018 Guidance. Note the AFFO payout ratio is based on 2018 midpoint of guidance.
(2) Based on 02/16/18 JPMorgan’s REIT Weekly U.S. Real Estate Stock Tools database which includes 129 REITs.
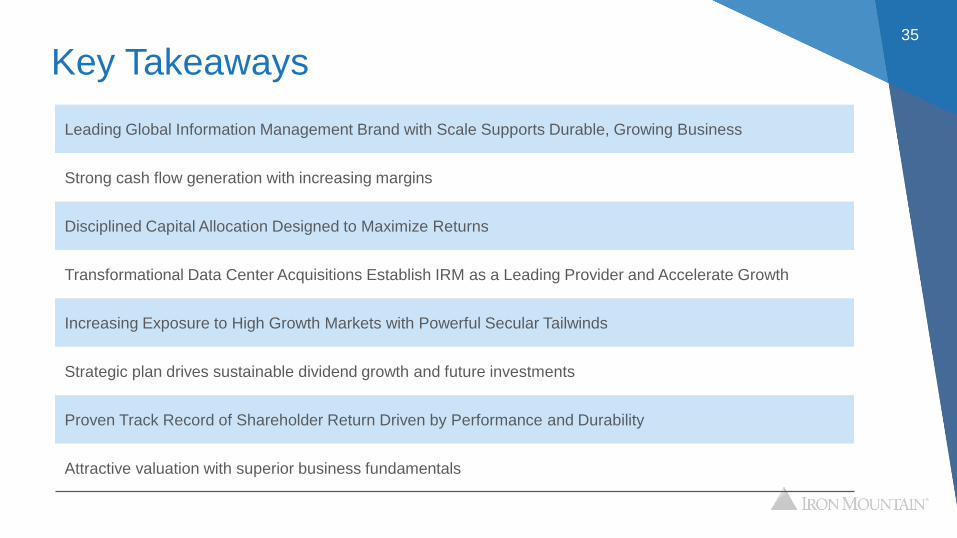
Key Takeaways 35
Leading Global Information Management Brand with Scale Supports Durable, Growing Business
Strong cash flow generation with increasing margins
Disciplined Capital Allocation Designed to Maximize Returns
Transformational Data Center Acquisitions Establish IRM as a Leading Provider and Accelerate Growth
Increasing Exposure to High Growth Markets with Powerful Secular Tailwinds
Strategic plan drives sustainable dividend growth and future investments
Proven Track Record of Shareholder Return Driven by Performance and Durability
Attractive valuation with superior business fundamentals
Appendix
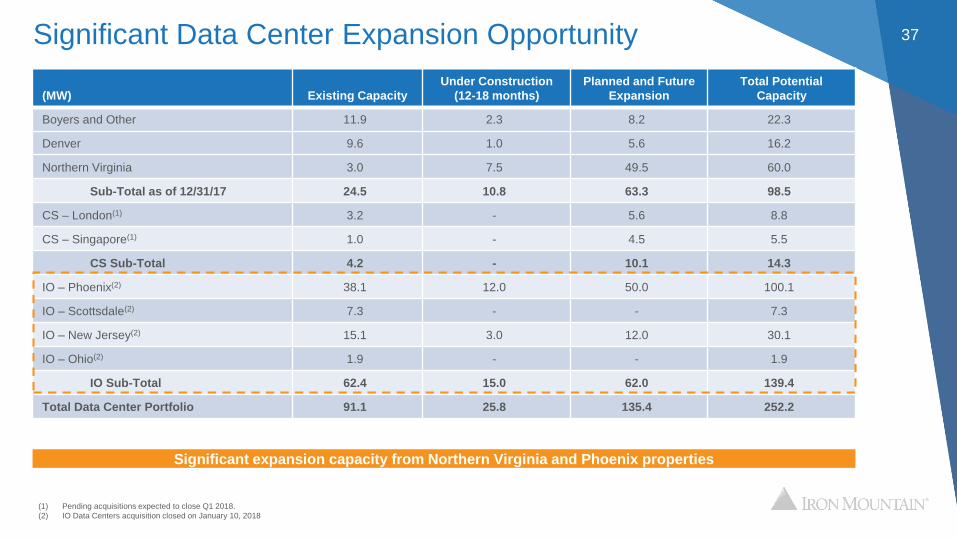
37Significant Data Center Expansion Opportunity
(MW) Existing Capacity
Under Construction
(12-18 months)
Planned and Future
Expansion
Total Potential
Capacity
Boyers and Other 11.9 2.3 8.2 22.3
Denver 9.6 1.0 5.6 16.2
Northern Virginia 3.0 7.5 49.5 60.0
Sub-Total as of 12/31/17 24.5 10.8 63.3 98.5
CS – London(1) 3.2 - 5.6 8.8
CS – Singapore(1) 1.0 - 4.5 5.5
CS Sub-Total 4.2 - 10.1 14.3
IO – Phoenix(2) 38.1 12.0 50.0 100.1
IO – Scottsdale(2) 7.3 - - 7.3
IO – New Jersey(2) 15.1 3.0 12.0 30.1
IO – Ohio(2) 1.9 - - 1.9
IO Sub-Total 62.4 15.0 62.0 139.4
Total Data Center Portfolio 91.1 25.8 135.4 252.2
(1) Pending acquisitions expected to close Q1 2018.
(2) IO Data Centers acquisition closed on January 10, 2018
Significant expansion capacity from Northern Virginia and Phoenix properties