
Durability Testing of LCB and CTB Materials Supplied by ... · PDF fileDurability Testing of...
52
DRAFT Durability Testing of LCB and CTB Materials Supplied by Caltrans Technical Memorandum prepared for the California Department of Transportation By: DFC Ventura CSIR Transportek Pretoria, South Africa Technical Memorandum No. TM-UC-PRC-2003-2 Pavement Research Center Institute of Transportation Studies University of California May 2003
Transcript of Durability Testing of LCB and CTB Materials Supplied by ... · PDF fileDurability Testing of...

DRAFT
Durability Testing of LCB and CTB Materials Supplied by Caltrans
Technical Memorandum prepared for the California Department of Transportation
By: DFC VenturaCSIR Transportek
Pretoria, South Africa
Technical Memorandum No. TM-UC-PRC-2003-2
Pavement Research CenterInstitute of Transportation Studies
University of California
May 2003

ii

iii
ABSTRACT
Carbonation of cement-stabilized layers under concrete pavements in California was
investigated as a potential reason for faulting of these pavements. In discussions with personnel
from the Pavement Research Center, it was mentioned that a layer of loose material is often
observed between the concrete slab and the supporting cement stabilized layer. Samples of
materials commonly used under concrete slabs were sent to South Africa for durability testing
using South African test methods. These test methods were primarily developed at the CSIR,
Transportek, for the purpose of durability assessment of stabilized materials.
The materials supplied by Caltrans consisted of samples of two aggregates used to make
cement treated base (CTB) and lean concrete base (LCB). The aggregate sources for these
materials were, named Mission Valley and Lake Herman. Details of gradings, water content, and
cement content were provided with the samples. These materials were tested for durability using
the Initial Consumption of Cement test (ICC), the mechanical and hand wet/dry brushing test, the
erosion test, and the uncarbonated and carbonated unconfined compressive strength test (UCS).
The test results were evaluated according to South African experience using these techniques and
South African standards. Two compaction energy levels were also used to determine whether
the density to which the materials were compacted had an effect on durability.
Most of the specimens passed the test criteria at both compaction energy levels,
suggesting that the amounts of cement used are excessive and may be reduced, thus creating the
potential for cost saving in terms of cement costs. However, the erosion test indicated that at the
lower compaction energy, the CTB materials are probably erodible under concrete slabs. This
tendency toward erosion may be overcome by compacting the materials to higher densities.
iv
It is recommended that the in-service materials be compacted to higher densities and that
further testing be done to determine the appropriate cement contents. The cement contents used
here were those specified by Caltrans.
A further recommendation is that site investigations be undertaken to enhance the
knowledge gained from laboratory testing as the effects of other factors affecting layer
performance such as drainage, poor compaction, material deficiencies, etc., can only be observed
in-situ.
The possibility of mechanical crushing of the cement-stabilized layer should also be
investigated.

v
TABLE OF CONTENTS
Abstract .......................................................................................................................................... iii
Table of Contents............................................................................................................................ v
List of Tables ................................................................................................................................ vii
List of Figures ............................................................................................................................... vii
1.0 Introduction ....................................................................................................................... 9
1.1 Problem Statement........................................................................................................... 10
1.2 Durability of Stabilized Layers........................................................................................ 10
2.0 Background to the South African Experience Regarding Durability Problems with
Stabilized Materials ...................................................................................................................... 10
2.1 Carbonation Process ........................................................................................................ 11
2.2 Erosion............................................................................................................................. 12
2.2.1 Erosion Failure in Flexible Pavements ..................................................................... 13
2.2.2 Erosion Failure in Rigid Pavements ......................................................................... 14
2.3 Modification and Cementation ........................................................................................ 15
2.4 Development of Test Methods ........................................................................................ 19
2.4.1 The Mechanical Brush Test ...................................................................................... 20
2.4.2 The Erosion Test ....................................................................................................... 23
2.4.3 The Residual Unconfined Compressive Strength (RUCS) Test ............................... 26
2.4.4 Initial Consumption of Lime or Cement Test ........................................................... 29
3.0 Materials Tested .............................................................................................................. 30
4.0 Laboratory Testing .......................................................................................................... 31
4.1 Compaction...................................................................................................................... 31
4.2 Initial Consumption of Cement (ICC) Test Results ........................................................ 33

vi
4.3 Brush Test Results ........................................................................................................... 34
4.3.1 Mission Valley specimens ........................................................................................ 34
4.3.2 Lake Herman / Madison Sand Specimens ................................................................ 37
4.4 Erosion Test Results ........................................................................................................ 38
4.4.1 Mission Valley specimens ........................................................................................ 38
4.4.2 Lake Herman / Madison Sand................................................................................... 39
4.4.3 General ...................................................................................................................... 39
4.5 UCS and Residual UCS Test Results .............................................................................. 40
5.0 Summary of Test Results, Conclusions, and Recommendations .................................... 44
5.1 Initial Consumption of Cement (ICC) ............................................................................. 44
5.2 Hand and Mechanical Brushing ...................................................................................... 44
5.3 Erosion Testing................................................................................................................ 46
5.4 Unconfined Compressive Strength (UCS) Testing ......................................................... 46
6.0 Recommendations ........................................................................................................... 47
7.0 References ....................................................................................................................... 49
Appendix A: Test Methods........................................................................................................... 52

vii
LIST OF TABLES
Table 1 Failure Criteria for C3/C4 materials in Flexible Pavements ........................................ 27
Table 2 Classification of Traffic for Structural Design Purposes ............................................. 27
Table 3 Recommended UCS Strengths for Stabilized Materials .............................................. 28
Table 4 Composition of Lake Herman/Madison sand CTB and LCB ...................................... 31
Table 5 Mechanical and Hand Brush Test Results.................................................................... 34
Table 6 Erosion Test Results..................................................................................................... 38
Table 7 Unconfined Compressive Strength (UCS) Values for Uncarbonated and Carbonated
Specimens ............................................................................................................................. 40
LIST OF FIGURES
Figure 1. The mechanism of base migration an faulting under a concrete slab........................... 16
Figure 2. The mechanism of pumping, void formation, and faulting under a concrete slab. ...... 17
Figure 3. The mechanical brushing apparatus. ............................................................................ 22
Figure 4. Schematic diagram of the erosion testing device. ........................................................ 25
Figure 5. Grading Curves for the Mission Valley samples.......................................................... 32
Figure 6. Grading Curves for the Lake Herman samples. ........................................................... 32
Figure 7. Comparison between hand and mechanical brushing. ................................................. 35
Figure 8. Machine brushed specimens of Mission Valley CTB (left) and LCB (right) materials
compacted at Modified AASHTO effort. ............................................................................. 35
Figure 9. Hand brushed Lake Herman LCB (left) and CTB (right) specimens compacted at
Modified AASHTO effort..................................................................................................... 38
Figure 10. Mission Valley and Lake Herman CTB specimens after erosion testing................... 41

viii

9
1.0 INTRODUCTION
Transportek prepared a synthesis report on stabilization technology in South Africa for
the University of California Pavement Research Center during the period January to June 2001.
This report covered aspects such as material tests and specifications, the mechanical properties of
the stabilized material, and the behavior and performance of the stabilized material under
laboratory and full-scale testing conditions. A presentation was given to the staff of the
Pavement Research Center and Caltrans in June 2001 based on the contents of the report.
During the presentation, one of the aspects of cement stabilization that immediately drew
reaction was carbonation. In discussions during the meeting it was speculated that carbonation
might be a contributing factor to step-faulting on concrete pavements. Following the
presentation, a project needs list was developed by the Pavement Research Center and Dynatest.
One of the items on the list was a comparison between the durability of cement treated bases
(CTB) and lean concrete bases (LCB) using the test methods currently used in South Africa for
testing the durability of cement-treated road building materials.
Subsequently two materials were supplied to Transportek by Caltrans for durability
testing according to South African standards.
This report outlines an investigation into the durability aspects of the two materials when
stabilized according to Caltrans specifications and then tested using South African durability test
methods. These test methods were developed in South Africa (predominantly at Transportek) to
evaluate stabilized materials used in southern Africa. It was anticipated that they would be
suitable for testing California materials.

10
1.1 Problem Statement
Some of the more common problems that were evident in the California concrete roads
included:
• Pumping of fines from the supporting layers under the concrete pavements;
• Transverse, corner, and longitudinal cracking of the concrete slabs;
• Diminished riding quality as a result of faulting.
1.2 Durability of Stabilized Layers
In the case of concrete, durability is defined as the ability of concrete to retain its
strength, impermeability, dimensional stability and appearance over a prolonged period of
service under the conditions for which it was designed.(1) For cemented bases, durability also
includes resistance to moisture absorption, strength reduction, and wetting and drying.(2) It is
suggested that the durability of stabilized materials for roads can be similarly defined with the
omission of “appearance” (this ignores the problem of cracking).
In South Africa, road layers stabilized with pozzolanic stabilizers such as cement, lime,
slagment, etc., have sometimes failed due to durability problems. These durability problems
were mostly caused by the ingress of water and/or air into the layer.
2.0 BACKGROUND TO THE SOUTH AFRICAN EXPERIENCE REGARDINGDURABILITY PROBLEMS WITH STABILIZED MATERIALS
Flexible pavements with stabilized layers are a popular construction method in many
areas of South Africa. For example, more than 80 percent of the pavements in Gauteng and
surrounding provinces are constructed using this type of construction. This method of
construction has also proved to be cost effective: materials that would otherwise be unsuitable

11
have provided good performance when stabilized. The value of stabilized subbases is also
recognized in that it provides firm support to the upper pavement layers facilitating their proper
compaction and overall structural contribution. Most pavements incorporating layers stabilized
with lime, cement, slagment, or combinations of these have performed satisfactorily over the
years. However, a number of failures associated with pozzolanic stabilized road construction
materials have occurred in the past.
The distress or failures of pavements containing cement-treated layers in southern Africa
have in many instances been attributed to unsatisfactory durability of the stabilized layers. This
led to various investigations and research projects by Transportek into the testing of stabilized
materials with the aim of minimizing stabilization failures. It was found that the cause of failure
was in many cases carbonation of the stabilizer, which led to weakening or loss of the bond
between aggregate particles thereby reducing the layer structural capacity and often resulting in
shear failures. Carbonation of lime, cement, or other pozzolanic stabilizers occurs when these
materials come into contact with the carbon dioxide. Small quantities of this gas are found in the
atmosphere and in soils where it is produced by decaying organic matter (e.g., tree trunks, grass,
insects, etc.).
2.1 Carbonation Process (3)
Lime, and to a lesser extent Portland cement, are unstable under normal environmental
conditions and carbonate readily under the right conditions. For example, lime (Ca(OH)2) is
only stable at a partial pressure of CO2 ( 2COP ) of less than 3 × 10⁻⁴ atmospheres. Under normal
conditions such as atmospheric air (2COP of 3 × 10⁻⁴ atmospheres, or 0.03 percent by volume),
CaCO3 is the stable phase. The same would apply to cement, although some of the compounds

12
are stable at somewhat lower pH and therefore higher PCO2 of up to about 10-9 atmospheres. It is
well accepted in concrete technology that complete carbonation of Portland cement is chemically
possible even at a low concentration of carbon dioxide in the atmosphere. Very broadly, the
reactions involve a reversal of those that took place during their manufacture. For example, lime
simply reverts to the limestone from which it was made:
Ca(OH)2 + CO2 = CaCO3 + H2O
Slaked lime Carbon dioxide = Limestone Water
Cement similarly reverts to the original components from which it was made or similar
combinations:
CaOSiO2H + CaOAl2O3H2O + CO2 = CaCO3 + SiO2 + Al2O3 + H2O
Hydrated lime or Limestone Silica Alumina WaterCement reaction products
2.2 Erosion
Another cause of failure was identified as the erosion of materials in stabilized pavement
layers. This was particularly evident during Heavy Vehicle Simulator (HVS) testing of asphalt
base pavements where certain stabilized subbases were found to erode and fine materials
pumped to the surface through cracks.(4)
The erosion of pavement layers may be defined as the wearing down of the material from
the interface of the layers due to hydraulic and/or mechanical action under traffic loading and is
always associated with excessive pore water pressure within pavement layers or between layer
interfaces and with erodible materials.(5)
Erosion involves two processes: production of loose material and movement of this
material. Depending on the pavement characteristics, these processes occur in different ways

13
and lead to different results. These differences need to be identified so they may be reflected in
the failure criteria developed for the erosion test (ET).
2.2.1 Erosion Failure in Flexible Pavements
In thin flexible pavements consisting of a surfacing and supporting layers, such as those
built in South Africa, the traffic load is carried by the supporting layers and not the surfacing
layer. The surfacing has a relatively low permeability and acts as a seal to prevent the ingress of
water into the supporting layers. The base may be constructed from a stabilized granular or
asphalt material. The subbase is normally constructed from stabilized materials or natural
gravels.
The local deflection of a flexible pavement surface caused by traffic loading sets up high
local contact stresses between the asperities of aggregates of different layers. These high contact
stresses can potentially disturb particle cementation and lead to crushing or compressive failure
of the aggregates producing “free fines” on weakly stabilized layers. Water infiltrates the
pavement either through the pavement shoulders, surface cracks, or ground water. With traffic
loading, high pore water pressures build up in the pavement layers, shifting the loose particles,
potentially reducing densities, and thus creating voids. These voids are subsequently filled by
the surrounding material. This redistribution of material may lead to surface deformation if the
void occurs in supporting layers, or potholes and cracking if it occurs near the road surface.
Once the cracks form, the ingress of water and air into the pavement layers increases and
accelerates the erosion process. The erosion is further accelerated as carbon dioxide also
infiltrates the layer causing carbonation of the stabilizer, which further weakens bonding
between particles.

14
Stabilized subbase layers are prone to cracking under traffic due to excessive stabilizer,
which causes shrinkage cracking. This post-cracked phase can be designed for (6) and can even
add substantially to the life of the pavement. Should this cracking be severe, however, or if
fatigue cracks are open to the surface, water and air containing carbon dioxide may enter the
pavement facilitating the erosion process. The water removes any loose material around the
cracked blocks and weakens the layer, whereas the carbon dioxide carbonates the stabilizer. The
blocks then begin to rock back and forth under traffic loading, crushing aggregates and
producing fines, which are removed from the pavement under pumping. This process has been
defined as follows:
“Pavement pumping is the rapid release of a pressurised soil and watercomposition from a relatively high to a relatively low pressure potential, wherebysubsurface material may be redistributed multi-directionally. Normally, thepressure is released vertically through pavement joints, cracks and edges.”(7)
Once water has entered the pavement, the erodibility of the materials used will determine
the ability of the road to withstand deterioration. Erosion tests assist in identifying erodible
materials so that they may be avoided or correctly modified.
2.2.2 Erosion Failure in Rigid Pavements
It was also found that the failures occurring in concrete pavements were mainly a result
of failures in the supporting stabilized layer.(5) This was mostly caused by vehicle loads
deflecting and rocking the concrete slabs and causing the movement of water in the layer below.
This water entered the layer through cracks or joints in the concrete slab. The fine material in
the layer is displaced with the water movement to other areas under the slab and through joints
and cracks, which leads to pumping of the fines and erosion of the layer, resulting in the
development of voids under the concrete slab with a consequent reduction in uniform support

15
provided by the subbase. This often led to failure of the concrete as cracking or movement of the
joints resulted. Stabilized materials that are prone to carbonation will exacerbate erosion when
used under concrete pavements as the bonds formed by the stabilizer are weakened, allowing the
fines particles to be easily loosened by water movement.
In concrete pavements, most of the traffic loading is carried by the concrete slab and little
stress is transferred to the subgrade. Unlike a flexible pavement, a rigid pavement is not subject
to local deflections due to loading. Instead, slab sections deflect. Water infiltrates the pavement
through joints or edges where it accumulates under the slab. As traffic loading deflects the
approach slab, the accumulated water is pushed at high velocity towards the departure slab. The
departure slab is then deflected very rapidly by the wheel load and the water is pushed back
under the approach slab. The high water velocities induce high shear stresses on the support
surface layers redistributing material. This causes movement of material from under the
departure slab to under the approach slab (Figure 1), as well as potential formation of voids and a
loss of slab support leading to corner cracking of the slabs (Figure 2).
2.3 Modification and Cementation (8)
Modification and cementation are terms used to describe the degree of treatment given to
a stabilized material.
Modification is considered to have taken place when the addition of stabilizer is only
required to change the plasticity of a material without a significant increase in tensile or
compressive strength. In this case, addition of stabilizer results in agglomeration of the clay
particles but does not form a cemented matrix. Typically 2 to 3 percent stabilizer (normally
lime) is added to a clayey material to achieve this.

16
migration of base material
accumulated base material
uneven (faulted) joint
a)
b)
c)
Figure 1. The mechanism of base migration an faulting under a concrete slab.

17
pumping of base material
loss of support due to void left by pumped-out base material
uneven (faulted) joint,base material pumped to surface
a)
b)
c)
infiltrated water
Figure 2. The mechanism of pumping, void formation, and faulting under a concrete slab.

18
Cementation occurs when the conditions are favorable for the development of cementing
products (usually calcium silicate hydrates) to significantly increase the compressive and tensile
strength of the material. Normally a quantity of 3 to 4 percent stabilizer (usually cement) is
added to materials to bring about cementation.
Thus, in the case of modification for which only a small quantity of stabilizer is added,
the material is particularly susceptible to carbonation and deterioration through repeated wetting
and drying. In many cases, the initial consumption of lime or cement (ICL or ICC) has not been
satisfied and whilst the properties of the soil may have improved at the time of testing, exposure
to carbonation and/or wetting and drying will result in the agglomeration of the clay and
reversion to the original soil characteristics. The subsequent impact and breakdown under traffic
releases the clay minerals causing an increase in plasticity in the material, a reduction in bearing
capacity, and eventual premature failure of the pavement.
Experience has shown that the plasticity is permanently reduced only if sufficient
stabilizer is added to maintain the pH above 12.0 so that cementation occurs and is maintained.
Sufficient stabilizer must be added to satisfy the initial consumption of lime or cement and
maintain the pH at suitably high level for the design life of the structure to ensure that long-term
cementation occurs.
There was therefore a need to test stabilized materials for carbonation potential and
susceptibility to erosion in the laboratory so that failures caused by carbonation and erosion
could be avoided when road layers were stabilized. In the past, requirements and specifications
for materials treated with pozzolanic stabilizers in South Africa were based almost entirely on
strength requirements after 7-day curing, with little attention being paid to the long-term
durability of the material. Research has shown little correlation between durability and strength

19
and has identified the ability of a stabilized material to lose strength under certain environmental
conditions, namely wetting/drying and carbonation.(8) It is important that this strength
reduction, in terms of the residual unconfined compressive strength, is not such that the structural
capacity of the layer becomes inadequate for the applied loads.
It was found that the methods used to test and evaluate stabilized materials were
somewhat problematic and not suitable to test the durability of stabilized layers in terms of
carbonation and erosion potential.(8) These test methods would have to be modified or
improved. Research was undertaken to improve the existing test methods such as the wet/dry
brush test, which was known to give an indication of the durability of materials treated with
pozzolanic stabilizers, and to develop test methods to determine the erodibility and carbonation
potentials of stabilized materials. This effort resulted in the development of the mechanical
brush test, the erosion test, and the carbonated Unconfined Compressive Strength test (RUCS)
and subsequent test specification limits.
2.4 Development of Test Methods
The following aspects were identified as those for which certain criteria needed to be
satisfied to ensure adequate long-term performance of stabilized layers (8):
• Appropriate stabilizer content to maintain the required pH, so that the cementation
reaction can proceed normally;
• Suitable durability test that would identify the potential of a stabilized material to
degrade in the presence of adverse conditions such as cyclical wetting and drying
and/or carbonation;

20
• Minimum residual UCS value, which will ensure adequate structural capacity under
the most severe environmental conditions likely to be encountered in service; and
• Method for determining the susceptibility of a stabilized to erode and pump under
trafficking.
2.4.1 The Mechanical Brush Test
The commonly used test method for determining durability of stabilized materials was
the wet/dry brush test (hand brush) developed by the Portland Cement Association and specified
by AASHTO (9) and ASTM (10) and is incorporated in the South African testing manual,
Technical Methods for Highways, number 1 (TMH 1) (11). The South African experience
showed that several problems existed with the method (12):
• The precision limits (repeatability and reproducibility) of the test were poor, mainly
due to the susceptibility of the brushing technique to operator variability. Also, there
were various brushing techniques used by different laboratories, further adding to the
poor reproducibility.
• The test specifies that the samples be compacted to Proctor density in 102-mm
diameter molds and it was felt that compaction to Modified AASHTO density in the
larger 152-mm molds would be more appropriate as it would be easier to compact
materials with a coarser grading, especially base course. Also, the loss of a single
large piece of coarse aggregate would not affect the total percentage loss as much as
it did in the case of the smaller diameter specimen, as its mass would be a smaller
percentage of the total mass.

21
• The compaction of road layers in South Africa is normally controlled from the results
of a Modified AASHTO laboratory compaction test [TMH 1, method A7 (11)], in
terms of maximum dry density (MDD) and optimum moisture content (OMC), which
gives a higher MDD and lower OMC than the proctor compaction specified for the
test. Thus, the higher compactive effort, in practice, was likely to give a stronger and
more durable material than that obtained using the prescribed method.
It was evident that some form of wetting and drying test was required to assess a likely
performance of a material in these conditions. The options considered were to modify the
existing test method or to develop a new method. As the basis of a wet/dry brushing test was
available and it had been successfully used in some regions to predict the performance of certain
materials, it was deemed feasible to improve the existing test rather than to develop a completely
new method from scratch. It was therefore decided to modify the existing method in such a way
that the concerns listed above would be addressed.
After experimenting with several mechanical brushing techniques, in order to eliminate
operator susceptibility, a mechanical brushing apparatus was devised that would brush the
specimens using a consistent effort.(12) The larger Modified AASHTO specimens (152 mm
diameter) were used in the test, but it was also possible to test the smaller Proctor specimens, if
required. Apart from the brushing method and compaction in larger molds at a higher density
the rest of the test method remained essentially unchanged. The brushing apparatus is shown in
Figure 3. The full test method is included in Appendix A.
Performance-related results available for the mechanical brushing test at the time and
correlations to convert the limits based on hand brushing and Proctor compaction enabled
tentative limits to be developed for the mechanized test (8):

22
Figure 3. The mechanical brushing apparatus.

23
Stabilized materials under concrete pavements < 5% loss
Stabilized base < 8% loss
Stabilized subbase < 13% loss
These are different from the original limits given for the hand brush test and Proctor
compaction by the Portland Cement Institute,(13) which were:
For AASHTO soil groups A-1, A-2-4, A-2-5 and A3(granular and sandy, low plasticity material 14%
For AASHTO soil groups A-2-6, A-2-7, A-4 and A-5(granular and sandy, higher plasticiy material) 10%
For AASHTO soil groups A-6 and A-7(silts and clays) 7%
Note that the limits derived for the new mechanical brush test are more appropriately
based on the use of the materials rather than the material type.
2.4.2 The Erosion Test
Traditionally, erosion tests were developed to evaluate the erosion resistance of materials
for canals, earth dams, and soil slopes. These tests were also used to evaluate pavement
materials used in rigid pavements. Many of these tests were found to be unsuitable for the
identification of erosion susceptibility of stabilized materials for use in pavement layers.(7)
In view of the limitations and disadvantages of the existing test methods relative to the
observations and findings during HVS testing of flexible pavements, a new method was required
that would achieve the following:

24
• Provide an objective erodibility test that simulates flexible pavement behavior in the
wet state as observed during HVS testing;
• Incorporate the aggregate-to-aggregate contact stresses, which may contribute to
surface crushing (compression stress) to produce erodible fines;
• Provide a relatively quick assessment of the potential erodibility of materials to be
used in stabilized layers;
• Have a simple and easy method of measuring erosion. Weight loss measurements are
fraught with inconsistencies, particularly if specimens are tested wet. Therefore, a
linear measurement of the depth of erosion was preferred.
An erosion test was developed during the late 1980’s to satisfy the above criteria. The
test simulates the grinding action of pavement layers in the presence of water pressure and gives
a good indication of the tendency of particles to erode (become loose) and pump. A schematic
diagram of the erosion test is shown in Figure 4. The full test method included in Appendix A.
Specimens for the erosion test are compacted in beam molds (75 × 75 × 450 mm) in three
layers. Each layer is compacted with 56 blows of a standard Modified AASHTO hammer, after
which the protruding material is pressed flush with the mold surface using a compression
apparatus to attain the density previously calculated. Different compaction efforts may be used
to attain desired densities. The specimens are cured for a period of 28 days at room temperature
in sealed chambers, after which they are submersed in water for 24 hours and then tested using
the Erosion machine to determine their Erosion Index (L). The Erosion Index is the
measurement of the average depth of erosion in millimeters averaged from 15 measurements on
each erosion specimen after 5000 load repetitions in the test device.

25
Figure 4. Schematic diagram of the erosion testing device.

26
The specimens are tested submerged and covered with a membrane on which a wheel
loaded with 17.775 kg travels backwards and forwards (see Figure 4) simulating traffic action.
The underside of the membrane, which rests on the specimens, is coated with an abrasive powder
to promote abrasion.
The laboratory test results were correlated with extensive full-scale field testing with the
HVS on different asphalt base pavement structures and failure criteria for the test method
developed.
The failure criteria for the erosion test for materials used in flexible pavements specified
in Gass, Ventura, and de Beer (5) is given in Table 1. The traffic classification, on which the
criteria is based, is given in TRH4 (1985) (14) (figures available when the test was developed).
Revised figures given in the later version of TRH4 (1996), (15) are also shown. The
classification of the traffic class given in Table 1 is shown in Table 2. Note that no criteria were
developed for cemented bases under rigid pavements.
2.4.3 The Residual Unconfined Compressive Strength (RUCS) Test
Stabilized materials that satisfy the 7-day cured unconfined compressive strength (UCS)
requirements may not always satisfy the requirements if they are subjected to wetting and drying
and/or carbonation in the field. Therefore, rather than base the strength criteria on the 7-day
UCS, it is recommended that a residual UCS (RUCS) be considered to ensure that even if the
material is subjected to wetting and drying or carbonation in service, it will retain sufficient
structural integrity to satisfy the original design requirements in terms of UCS.(8)

27
Table 1 Failure Criteria for C3/C4 materials in Flexible Pavements (5)
Layer Traffic ClassTRH4 (1985)
Traffic ClassTRH4 (1996)
Erosion Index (L)(mm)
Bases E0 – E4 ES0.1 – ES30 ≤ 1Sub-bases E0 – E2 ES0.1 – ES3 ≤ 5Sub-bases E3 – E4 ES10 – ES30 ≤ 3
Table 2 Classification of Traffic for Structural Design Purposes
Specification TrafficClass
Pavement DesignBearing Capacity(million 80-kN axles/lane)
Volume and Type of Traffic
ES0.1 0.003 – 0.01 Very lightly trafficked roads; very fewheavy vehicles.
ES3 1 – 3 Medium volume of traffic; few heavyvehicles.
ES10 3 – 10 High volumes of traffic and/or manyheavy vehicles.
TRH 4(1996)
ES 30 10 – 30Very high volume of traffic and/or ahigh proportion of fully laden heavyvehicles.
E0 < 0.2 Very lightly trafficked roads; very fewheavy vehicles.
E2 0.8 – 3 Medium volume of traffic; few heavyvehicles.
E3 3 – 12 High volumes of traffic and/or manyheavy vehicles.
TRH 4(1985)
E4 12 – 50Very high volume of traffic and/or ahigh proportion of fully laden heavyvehicles.
28
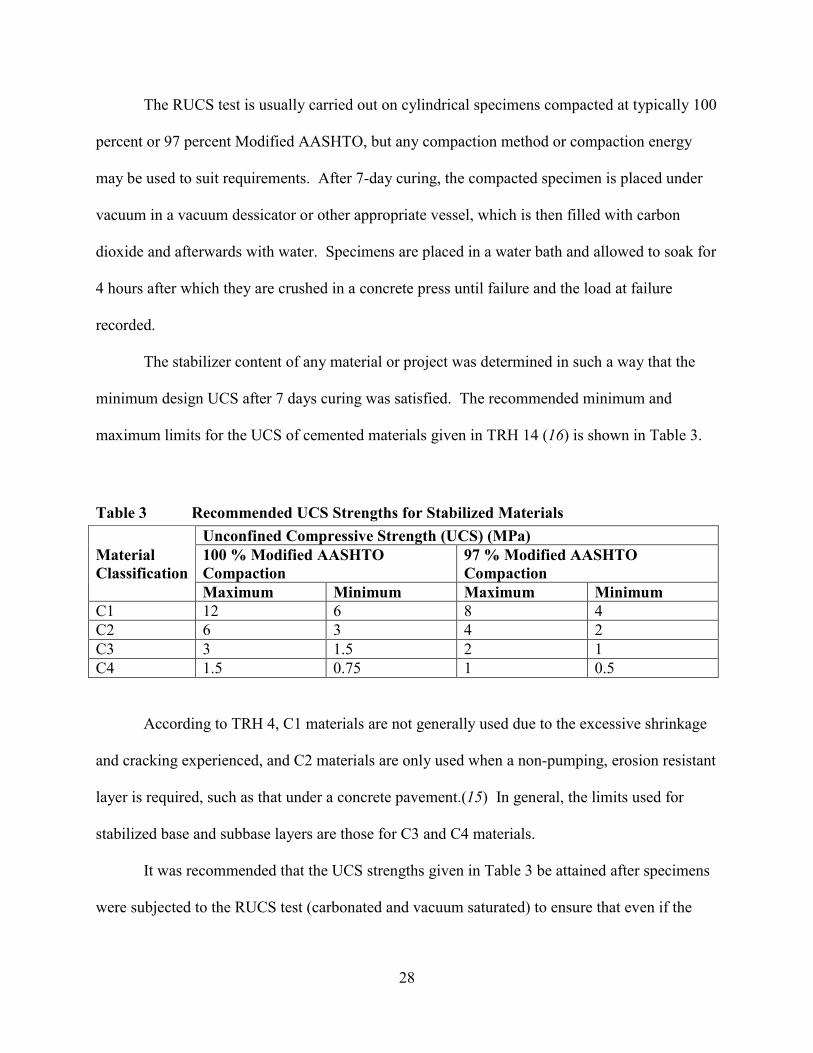
The RUCS test is usually carried out on cylindrical specimens compacted at typically 100
percent or 97 percent Modified AASHTO, but any compaction method or compaction energy
may be used to suit requirements. After 7-day curing, the compacted specimen is placed under
vacuum in a vacuum dessicator or other appropriate vessel, which is then filled with carbon
dioxide and afterwards with water. Specimens are placed in a water bath and allowed to soak for
4 hours after which they are crushed in a concrete press until failure and the load at failure
recorded.
The stabilizer content of any material or project was determined in such a way that the
minimum design UCS after 7 days curing was satisfied. The recommended minimum and
maximum limits for the UCS of cemented materials given in TRH 14 (16) is shown in Table 3.
Table 3 Recommended UCS Strengths for Stabilized MaterialsUnconfined Compressive Strength (UCS) (MPa)100 % Modified AASHTOCompaction
97 % Modified AASHTOCompaction
MaterialClassification
Maximum Minimum Maximum MinimumC1 12 6 8 4C2 6 3 4 2C3 3 1.5 2 1C4 1.5 0.75 1 0.5
According to TRH 4, C1 materials are not generally used due to the excessive shrinkage
and cracking experienced, and C2 materials are only used when a non-pumping, erosion resistant
layer is required, such as that under a concrete pavement.(15) In general, the limits used for
stabilized base and subbase layers are those for C3 and C4 materials.
It was recommended that the UCS strengths given in Table 3 be attained after specimens
were subjected to the RUCS test (carbonated and vacuum saturated) to ensure that even if the

29
material is subjected to wetting and drying or carbonation in service it will retain sufficient
structural integrity to satisfy the original requirement in terms of UCS strength.(8)
2.4.4 Initial Consumption of Lime or Cement Test
The use of lime or cement treated materials in the construction of road layers was and is
common practice in southern Africa, as is discussed previously. Some of these roads failed in
spite of the fact that the materials used fulfilled all the material requirements at that time. It was
found that one of the reasons for this was that the lime demand of the material had not been
satisfied, as determined by the test method developed by Eades and Grimm.(17) It was also
established that all natural materials have, to a greater or lesser extent, a demand for lime (3) and
it is important that this demand be quantified when stabilization of a material is being
considered. Weathered, clayey materials tend to have a greater lime demand than fresh
materials.
Consider the case where 3 percent cement stabilizer is added to a soil with an initial
consumption of lime (ICL) of 5 percent. The lime demand of the soil is the primary reaction and
is responsible for the consumption of a portion of lime [Ca(OH)2] released during the setting and
hardening process of cement. In such a scenario, the ICL could seriously interfere with the gain
in strength since only the lime that is left after the lime demand of the soil has been satisfied is
available for the binding and hardening process. The determination of the lime demand of
stabilized road construction materials is thus considered of extreme importance, especially where
carbonation is likely to occur.
The method developed by Eades and Grimm is essentially the measurement of the pH of
a soil stabilized with various percentages of lime. The quantity of lime necessary to maintain a
pH of 12.4 in a lime-soil-water mix after 1 hour is considered to be the ICL of the material. The

30
word “lime” may be substituted by cement, or any other pozzolanic stabilizer, as they all behave
in a similar manner. This test was initially performed on the –0.425mm (–#40) fraction of the
material, but was later modified by Klauss (18) to test construction material as a whole (crushed
to pass a 19-mm sieve) as it was assumed that this would be a better indication of the lime
demand of the material as a whole. As was stated earlier, for adequate stabilization using
pozzolanic stabilizers, sufficient stabilizer should be added to ensure an excess after the reactions
are complete, i.e., the initial consumption of lime or initial consumption of cement (ICL or ICC)
of the soil should be satisfied and an excess provided.
A stabilizer content of ICL or ICC plus an additional 1 percent is recommended.(3)
3.0 MATERIALS TESTED
Two aggregate materials were supplied by Caltrans for durability testing using South
African standards. Information on the grading composition of the aggregate materials and the
percentage of cement and water to be added was also supplied. The sources for the aggregate
materials were named Mission Valley and Lake Herman-Madison sand. Testing of a cement-
treated base (CTB) containing 5 percent cement and a lean concrete base (LCB) containing 8
percent cement was required for both materials. The cement for treating the materials was also
supplied by Caltrans (Type 2 cement modified ASTM C-150).
Mission Valley CTB (MV CTB) and LCB (MV LCB) samples were supplied mixed in
the correct proportions, whereas for the Lake Herman-Madison sand samples, various fractions
of the materials were supplied in separate buckets and the LCB (LH LCB) and CTB (LH CTB)
mixes had to be constituted according to the information supplied, as shown in Table 4. The
gradings of all the materials tested are depicted graphically in Figures 5 and 6.

31
Table 4 Composition of Lake Herman/Madison sand CTB and LCBLayer type Aggregate type/water Percentage of mix (%)
Lake Herman aggregate 84Madison concrete sand 16Cement treated baseWater 5.6Lake Herman Aggregate 49Madison concrete sand 51Lean concrete baseWater 8.2
4.0 LABORATORY TESTING
The materials were tested for durability according to the methods specified in Section 2.2
of this report. In addition to durability testing, standard classification testing such as grading
analysis, Atterberg Limits, linear shrinkage, etc., were also performed.
4.1 Compaction
Compaction of soils may be defined as the process whereby soil particles are packed
more closely together by the expulsion of air surrounding these particles. Compaction is usually
performed by mechanical means.
The materials were tested at both Standard Proctor and Modified AASHTO compaction
efforts to illustrate the increase in durability of the material when compacted at higher density.
Modified AASHTO compaction is done in 152.4-mm (6-in.) diameter molds into which
material is compacted in five layers with each layer receiving 55 evenly distributed blows of a
4.536 kg (10-lb.) tamper, dropping 457.2 mm (18-in.). The density of the specimens so obtained
is designated as 100 percent Modified AASHTO density. Standard Proctor compaction in a
152.4-mm (6-in.) diameter mold is achieved by compacting the specimens in three layers using a
smaller hammer weighing 2.495 kg (5.5 lb.), the number of blows is 55 and the drop is 304.8
mm (12 in.). The density obtained using this compaction is normally 92 to 95 percent of that

32
0
20
40
60
80
100
0.01 0.1 1 10 100
Particle Size (mm)
% P
assi
ng
Mission Valley LCB
Mission Valley CTB
Figure 5. Grading Curves for the Mission Valley samples.
0
20
40
60
80
100
0.01 0.1 1 10 100
Particle Size (mm)
% P
assi
ng
LCB Lake Herman / Madison Sand LCB
CTB Lake Herman / Madison Sand CTB
Figure 6. Grading Curves for the Lake Herman samples.

33
obtained using Modified AASHTO compaction. The total energy imparted to the sample is
approximately 5.6 kJ for Modified AASHTO compaction, whereas for Standard Proctor the
energy is of the order of 1.2 kJ.
For comparisons to be made between the original hand brushed test method and the
mechanical brushing method, some samples were compacted in the 101.2-mm (4-in.) diameter
molds at standard Proctor effort. Standard Proctor compaction in this smaller mold is attained by
compacting the material into the mold in 3 layers, each layer receiving 22 blows of the smaller
hammer described above.
For erosion and durability problems to occur in pavement layers, the ingress of water and
air is necessary. Therefore, the more permeable the layer, the more susceptible it will be to both
erosion and durability. Materials compacted to higher densities have fewer voids and are
therefore less susceptible to the ingress of water and air. In addition, higher density compaction
provides better particle interlock, which leads to materials with better shear strength. However,
higher compactive efforts may lead to breakdown of coarse aggregates if they are soft or perhaps
weathered, which may result in fines being generated. Excessive fines may be detrimental to the
compaction process resulting in lower densities and, in some instances, higher plasticity in
situations in which the fines generated by compaction are from weathered materials containing
clays.
4.2 Initial Consumption of Cement (ICC) Test Results
The initial consumption of cement (ICC) for the Mission Valley CTB and LCB
specimens satisfied the specification that the percentage of cement added should be equal to the
ICC plus 1 percent. According to the test specifications, the cement added to the CTB and LCB

34
materials should at least be 2.0 and 2.5 percent respectively, whereas the actual quantities added
were 5 and 8 percent.
Similarly the Lake Herman / Madison sand materials required the addition of 3 percent
cement to satisfy the test requirements, which was below the actual amounts added.
4.3 Brush Test Results
The test results for mechanical and hand brushed specimens of the two materials are
shown in Table 5 and graphically depicted in Figure 7. Because of the limited amounts of
material available, testing had to be limited to two and in some cases one specimen per
combination of variables.
4.3.1 Mission Valley specimens
For the Modified AASHTO compaction effort, the material losses for the machined
brushed were very low for both 5 and 8 percent cement contents. There was also no significant
difference between the results at the two cement contents. The percentage loss for the CTB
specimens was 0.5 percent; that of the LCB 0.6 was percent. The hand brushed specimens lost
twice as much material (1 and 1.2 percent for the CTB and LCB specimens, respectively), but
this is still considered a small amount. Figure 8 shows hand brushed specimens for both CTB
and LCB Mission Valley materials.
Table 5 Mechanical and Hand Brush Test ResultsMass Loss (%)
Compaction Mold Size Brush Type MissionValley CTB(5% cement)
MissionValley LCB(8% cement)
LakeHermanCTB(5% cement)
LakeHermanLCB(8% cement)
Mechanical 0.5 0.6 1.2 0.8ModifiedAASHTO
ModifiedAASHTO Hand 1.0 1.2 3.6 1.6
Mechanical 0.7 0.8 4.5 1.2StandardProctor
StandardProctor Hand 2.8 2.0 41.0 2.9

35
0
0.5
1
1.5
2
0 0.5 1 1.5 2 2.5 3 3.5 4
Hand Brush Loss (%)
Mec
hani
cal B
rush
Los
s (%
)
Figure 7. Comparison between hand and mechanical brushing.
Figure 8. Machine brushed specimens of Mission Valley CTB (left) and LCB (right)materials compacted at Modified AASHTO effort.

36
The losses for the hand brushed specimens, although double that of the machine brushed
specimens, were still very small and again there was no significant difference between the
materials at the two cement concentrations.
The specimens for mechanical and hand brushing compacted at Standard Proctor effort in
the smaller molds (101.2-mm diameter) lost more material on brushing than did the Modified
AASHTO specimens, as was expected. At the lower density, the specimens are less resistant to
the brushing action and also, the contact stresses caused by the brush on the smaller diameter
specimens are higher. Another reason for the increased loss of material in the smaller specimens
is that the loss of large aggregate particles represents a higher percentage loss of the total
specimen mass. The mass of the Standard Proctor specimens was typically 2 kg, whereas that of
the Modified AASHTO specimens was in the order of 5 kg. However, the Proctor mechanical
brushing losses were only slightly higher than the losses experienced by the mechanically
brushed specimen compacted at Modified AASHTO effort in the larger diameter molds, whereas
the material loss for Proctor hand brushed specimens were markedly higher than for the
Modified AASHTO specimens.
It was expected that the Mission Valley CTB material would lose significantly more
material than the Mission Valley LCB (as was the case with the Lake Herman specimens).
However, three of the four results reported in Table 5 for the Mission Valley material show the
opposite of this expected trend. The LCB material has a coarser grading and would therefore
have been more susceptible to brushing as the brush tends to pluck the large aggregate from the
soil matrix and also, the loss of a few pieces of large aggregate will make a larger percentage
difference to the overall loss than the loss of fine materials. Yet another probable cause was that
the large aggregate in the LCB material was rounded river gravel, whereas in the CTB material

37
the large aggregate was partly crushed river gravel. It is assumed that the rounded particles
(smooth surfaces) do not bind as well with the rest of the mix when cemented and therefore more
material would be lost with the brushing action.
At both Modified AASHTO and Standard Proctor compaction efforts, the specimens
tested were acceptable in terms of the test specifications, where the most stringent requirement
for mechanical brushed specimens compacted at Modified AASHTO effort is a loss of less than
5 percent for a stabilized base layer under a concrete pavement and a loss of less than 7 percent
for A-6/A-7 materials when hand brushed and compacted at Standard Proctor effort in the
smaller molds.
4.3.2 Lake Herman / Madison Sand Specimens
The LCB treated with the higher percentage of cement proved to be more resistant to
both the mechanical and hand brushing than the CTB with the lower cement content, as was be
expected. The machine brushed specimens again lost less material than the hand brushed
specimens. The loss for the CTB and LCB mechanically brushed specimens compacted at
Modified AASHTO effort was 1.2 and 0.8 percent respectively, whereas these figures for the
hand brushed specimens were 3.6 and 1.6 percent (Figure 9). The percentage loss figures for the
specimens compacted at standard Proctor effort and mechanically brushed were 4.5 and 1.2 for
the CTB and LCB specimens. The corresponding losses for the hand brushed specimens were 41
and 2.9 percent (the figure of 41 percent seems extremely high when compared to the other test
results and therefore this test should be repeated). However, lack of sufficient quantities of
material did not permit replication of that specimen.
The specimens once again had acceptable durability in terms of the test specification
limits, with exception of the hand brushed specimen compacted at Standard Proctor effort.

38
Figure 9. Hand brushed Lake Herman LCB (left) and CTB (right) specimens compactedat Modified AASHTO effort.
4.4 Erosion Test Results
The erosion test results are shown in Table 6.
Table 6 Erosion Test ResultsModified AASHTO Compaction Standard Proctor Compaction
Sample EL (mm)Density(kg/m3) EL (mm)
Density(kg/m3)
Mission Valley CTB 0.49 2293 1.47 2201Mission Valley LCB 0.29 2283 0.35 2123Lake Herman CTB 0.53 2248 1.90 2091Lake Herman LCB 0.22 2267 0.45 2108EL = Erosion Index
4.4.1 Mission Valley specimens
The CTB materials with the lower cement content proved more erodible than the LCB
materials, for specimens compacted at both Modified AASHTO and Standard Proctor efforts, as
was to be expected. The brushing is considered to be a plucking action (tensile force) whereas
the erosion wheels exert a downward force on the specimens, which is probably why aggregate

39
shape (rounded particles) in the LCB mix had no significant effect on the test results, compared
to the brush test.
For specimens compacted at Modified AASHTO effort, the Erosion Index (L) for the
CTB was 0.49 mm and that of the LCB 0.29 mm, which is less than the limit of 1 mm prescribed
for the most demanding traffic loading for the base layer of roads with a very high volume of
traffic and/or a high proportion of fully laden heavy vehicles. The specimens compacted at the
lower Standard Proctor energy had higher erosion values, as was expected. The CTB material
gave an Erosion Index value of L = 1.47 mm and therefore was no longer considered suitable for
base layers (see Table 1), but may still be used as a subbase material for the most highly
trafficked roads. The value of compacting materials to higher densities and thus creating a more
durable mix is again highlighted by these results.
4.4.2 Lake Herman / Madison Sand
The erosion indices for the Lake Herman / Madison sand specimens were similar to those
of the Mission Valley specimens. The erosion Index for the CTB material was 0.53 mm and that
of the LCB 0.22 mm for specimens compacted at Modified AASHTO effort. At Standard
Proctor compaction, these values were 1.9 mm and 0.45 mm, respectively.
At the higher compaction effort, these materials would be suitable for use in any base or
subbase layer, whereas when compacted at the lower energy, the CTB material is not
recommended for bases but only subbases.
4.4.3 General
The Erosion test results therefore indicate that both cement content and compaction
energy affect the durability of the materials in terms of erodibility. The higher the cement

40
content, the less erodible the specimens. Likewise, the higher the compaction energy, the less
erodible the specimens. It is interesting to note that both Mission Valley and Lake Herman CTB
specimens with the lower cement contents increased in erodibility by approximately 3 times
when compacted at the lower Standard Proctor effort, whereas this increase was not as
pronounced at the higher cement contents. This suggests that at the lower contents the level of
compaction is very important for erosion resistance characteristics.
Figure 10 shows specimens of the Mission Valley and Lake Herman CTB materials
compacted at Modified AASHTO and Standard Proctor compaction efforts, after erosion testing.
These were the materials with highest erosion index values when compacted at Standard Proctor
effort. Note the loss of fines between the coarse aggregates of the materials compacted at
Standard Proctor compaction.
4.5 UCS and Residual UCS Test Results
The Unconfined Compressive Strength (UCS) test results for both materials after
standard and carbonated conditioning are shown in Table 7.
Table 7 Unconfined Compressive Strength (UCS) Values for Uncarbonated andCarbonated Specimens
Mission Valley Lake HermanUCS Values (kPa) UCS Values (kPa)Compaction
Effort Condition Density values(kg/m3) CTB LCB
Density values(kg/m3) CTB LCB
Uncarbonated 2292 8512 2238 11707Carbonated 2294 9594 2248 11075Uncarbonated 2288 18503 2254 12336
ModifiedAASHTO
Carbonated 2313 19189 2261 14254Uncarbonated 2231 11513 2210 12481Carbonated 2223 10143 2205 10750Uncarbonated 2192 16862 2249 14419
StandardProctor
Carbonated 2204 14803 2218 12500

41
Mission Valley CTBStandard Proctor
Compaction
Lake Herman CTBStandard Proctor
Compaction
Mission Valley CTBModified AASHTO
Compaction
Lake Herman CTBModified AASHTO
Compaction
Figure 10. Mission Valley and Lake Herman CTB specimens after erosion testing.
It was assumed that the uncarbonated specimens would have higher strengths than the
carbonated specimens. Whereas this was the case for all the tests done at the Standard Proctor
compaction, the strength remained the same or increased slightly after carbonation of the
Modified AASHTO compacted samples. The only exception was the Lake Herman CTB
specimen compacted at Modified AASHTO effort, which had a carbonated strength of 11075
kPa compared to an uncarbonated strength of 11787 kPa. The strength differences between
uncarbonated and carbonated specimens were very small. The largest difference was observed
with Lake Herman LCB specimens at both Standard Proctor and Modified AASHTO compaction

42
efforts. The Lake Herman LCB specimens had differences of 15.4 and 15.5 percent for
uncarbonated and carbonated specimens, respectively.
There was no trend observed in UCS values of the specimens between the compaction
efforts, whereas one would have expected higher UCS values for Modified AASHTO specimens
because of their higher densities. In some instances, the specimens compacted using the
Standard Proctor method were stronger than those compacted using the Modified AASHTO
method (i.e., Mission Valley CTB uncarbonated, Lake Herman CTB uncarbonated, Lake
Herman LCB uncarbonated) whereas in some cases, Modified AASHTO compacted specimens
were stronger than those compacted at Standard Proctor (Mission Valley LCB uncarbonated,
Mission Valley LCB carbonated, Lake Herman CTB carbonated, Lake Hermand LCB
carbonated).
The densities achieved for specimens compacted at Standard Proctor were not much
lower than those of the specimens compacted at the higher Modified AASHTO effort.
Generally, the densities obtained using the lower compaction effort are in the vicinity of 92 to 95
percent of the densities obtained using the higher compaction energy. However, this finding is
dependent on the material characteristics and type. In this study, the lowest density obtained
compacting with Standard Proctor effort was that of the Mission Valley LCB specimen, which
was 96 percent of the density of the specimen compacted at the Modified AASHTO density.
The Standard Proctor densities were 97, 98, and 99 percent of the Modified AASHTO densities
for the Mission Valley CTB, Lake Herman CTB and Lake Herman LCB, respectively.
In terms of strength of the carbonated materials, the Proctor specimens behaved in the
expected manner. The uncarbonated specimens gave higher UCS values than did the carbonated

43
specimens. This observation suggests that at lower densities, the infiltration of the CO2 into the
compacted materials is higher, resulting in higher carbonation levels and reduced strength.
The CTB specimens were in all cases weaker than the LCB specimens for both Standard
Proctor and Modified AASHTO compaction efforts, as was expected because of the higher
cement contents of the LCB specimens.
Due to the quantities of materials supplied it was not possible to do repeat testing on the
materials.
According to South African standards, the UCS values obtained for both carbonated and
uncarbonated specimens and at the both compaction levels exceed the minimum requirement for
a C1 material, which is 6,000 kPa (see Table 3). C1 materials are the strongest in terms of UCS
strength recommended by the specifications.(15) Therefore, these materials can be used in any
base or subbase layers, including a subbase under a concrete pavement. However, some of the
specimens had UCS values that exceeded the maximum suggested value of 12,000 kPa at 100
percent Modified AASHTO density, and therefore excessive shrinkage and cracking may result.
Even under a concrete slab, this shrinkage and cracking may be a cause for failures as movement
or rocking may occur, and water and air containing CO2 may infiltrate into the cracks causing
weaknesses in the layer.
According to the South African experience, it may be beneficial to reduce the cement
contents resulting in lower material strengths, thereby reducing shrinkage cracking and layer
costs. However, for most Caltrans rigid pavements, the use of thick concrete layers and bond
breaker between the cemented base and Portland cement concrete should minimize the impact of
shrinkage cracking in the LCB on the pavement performance. On the other hand, Caltrans

44
flexible pavements with CTB underneath the asphalt concrete have exhibited reflection cracking
of shrinkage cracks, such as on I-15 near Baker.(19)
5.0 SUMMARY OF TEST RESULTS, CONCLUSIONS, ANDRECOMMENDATIONS
5.1 Initial Consumption of Cement (ICC)
The initial consumption of cement (ICC) for the Mission Valley CTB and LCB
specimens satisfied the South African specification that the percentage of cement added should
be equal to the ICC plus 1 percent. According to the test specifications, the cement added to the
CTB and LCB materials should at least be 2.0 and 2.5 percent respectively, whereas the actual
quantities added were 5 and 8 percent.
Similarly the Lake Herman / Madison sand materials required the addition of 3 percent
cement to satisfy the test requirements, which was below the actual amounts added.
In terms of the ICC test requirements, it would thus be possible to reduce the quantities of
cement added, which would reduce the construction costs. This result is primarily applicable to
CTB and LCB for flexible pavements, and is not recommended for rigid pavements.
5.2 Hand and Mechanical Brushing
Specimens of the two materials were compacted at both Modified AASHTO and
Standard Proctor compaction efforts and tested by hand brushing and by mechanical means.
As expected, the hand brushed specimens lost more material than the mechanically
brushed specimens. The mass losses of the Mission Valley specimens were similar for both the
CTB and LCB materials, where it was expected that at the higher cement content LCB

45
specimens would be more resistant to brushing. The large aggregates in the LCB material,
however, were rounded river gravel, which probably did not bond well with the rest of the mix
because of the round smooth surfaces. At both the Modified AASHTO and Standard Proctor
compaction efforts, the specimens tested were acceptable in terms of the test specifications,
where the most stringent requirement for mechanical brushed specimens is a loss of less than 5
percent for a stabilized base layer under a concrete pavement and a loss of less than 7 percent for
A-6/A-7 materials when hand brushed.
The Lake Herman / Madison sand LCB treated with the higher percentage of cement
proved to be more resistant to both the mechanical and hand brushing than the CTB with the
lower cement content, as was expected. The machine brushed specimens lost less material than
the hand brushed specimens.
These specimens had acceptable durability in terms of the test specification limits, with
the exception of the hand brushed specimens compacted at Standard Proctor effort, which had a
mass loss of 41 percent. This loss is considered excessive and is probably a testing anomaly
rather than a true reflection of performance.
The most stringent requirement according to South African specifications for mass loss
for mechanically brushed specimens compacted at Modified AASHTO effort is a loss of less
than 5 percent for a stabilized base layer under a concrete pavement and a loss of less than 7
percent for A-6/A-7 materials when compacted at Standard Proctor effort and hand brushed.
With exception of the Lake Herman CTB hand brushed specimens, all specimens of both
materials compacted at both Standard Proctor and Modified AASHTO efforts, at both cement
contents, hand or mechanically brushed, were acceptable in terms of the South African and
California specifications. This suggests that the cement content may be reduced, especially

46
where 8 percent is used, without adversely affecting the durability of the materials in terms of
brushing resistance. This also suggests that LCB is only somewhat better than CTB in terms of
durability. This result should be checked by coring field pavements with LCB that have been in
place 10 to 20 years.
5.3 Erosion Testing
The CTB materials with the lower cement content proved more erodible than the LCB
materials for specimens compacted at both Modified AASHTO and Standard Proctor efforts, as
was to be expected. Both the Mission Valley and Lake Herman / Madison sand specimens
compacted at Modified AASHTO effort exceeded the test requirements for the most demanding
traffic loading, for which an erosion index (L) of ≤ 1 mm is specified. At Standard Proctor
compaction, the CTB materials were no longer considered suitable for base layers, including the
subbase layer under concrete slabs. LCB materials with the higher cement content were still
considered acceptable for use as base layers. It is probable that erosion failures will occur should
the materials with the lower cement contents be used as a supporting layer under concrete slabs.
5.4 Unconfined Compressive Strength (UCS) Testing
According to South African standards, the UCS values obtained for both carbonated and
uncarbonated specimens and at the both compaction levels exceed the minimum requirement for
a C1 material, which is 6,000 kPa (see Table 3). C1 materials are the strongest in terms of UCS
strength recommended by the specifications.(15) These materials can therefore be used in any
base or subbase layers, including a subbase under a concrete pavement. However, UCS values
of some of the specimens exceed the maximum suggested value of 12,000 kPa at 100 percent
Modified AASHTO density and therefore excessive shrinkage and cracking may result. Even

47
under a concrete slab, this may be a cause for failures as movement or rocking may occur and
water and air containing CO2 may infiltrate into the cracks, causing weaknesses in the layer. The
UCS results also suggest that some reduction in cement content could be made without
sacrificing the required strength in terms of the South African specifications, although not as low
as the cement contents or specification of CTB.
Some of the observed failures of cement-stabilized layers in California rigid pavements
may also be related to the mechanical crushing of the layer. It is recommended that a stress
analysis be performed to apply the crushing criteria developed by de Beer. No additional testing
will be required to apply these criteria.
6.0 RECOMMENDATIONS
The following recommendations are made based on the results and conclusions of this
report:
Flexible Pavements
Field survey. It is recommended that a field survey of flexible pavements be
performed with Lean Concrete Base (LCB) and Cement Treated Base (CTB) base
layers. It is recommended that this field survey determine:
a. Typical distresses, in particular the extent to which shrinkage cracking has
reflected up from the LCB or CTB layer through the asphalt concrete.
b. The durability of these materials under the various mix designs and compaction
levels, and under the various climates and traffic levels. Durability should be
determined through observation of pumping, and some coring on each project.
The results of the recently completed test section evaluation by a recent Caltrans
research contract (20) or should be reviewed for any LCB/CTB sections as a start.

48
Required compaction. It is recommended that the required compaction for CTB be
increased from 95 percent to either 98 or 100 percent, relative to California Test
Method 312 for Class A CTB (inactive test) if this material is still being used. This
will increase durability without increasing the risk of shrinkage.
Flexible Pavement Design. If the recommended field survey shows that the
reflection of shrinkage cracks from the cemented base up through the asphalt concrete
is a likely and difficult to rehabilitate distress, it is recommended that the use of Lean
Concrete Base (LCB) be eliminated for use directly beneath the asphalt concrete
surface in flexible pavements.
Test standards.
a. It is recommended that use of the initial cement/lime consumption (ICC/ICL) test
for determining the cement content of cemented base materials be considered.
b. It is also recommended that use of the Residual Unconfined Compressive
Strength (RUCS) test for durability of cemented base materials be considered.
c. If use of LCB and Class A CTB is continued, it is recommended that the risk of
shrinkage cracking be reduced by consideration of a maximum unconfined
copmressive strength (UCS) specification as used in South African specifications,
or by use of a shrinkage test.
Rigid Pavements.
Field survey. It is recommended that a field survey be performed of rigid pavements
with Lean Concrete Base (LCB) base layers. It is recommended that this field study
evaluated the durability of these bases under the various mix designs and under
various climates and traffic levels. Durability should primarily be evaluated through

49
coring to evaluate disintegration and condition survey to evaluate faulting for
comparison with pavements with Class A CTB. The results of the recent Caltrans
research contract work (20) should be reviewed for any LCB sections as a start. The
test sections used by Caltrans to make the decision to change from CTB to LCB in the
early 1990’s (21) should be reviewed in light of the recent extensive use of dowels in
rigid pavements which, reduces deflections at corners and joints.
Durability under Rigid Pavements. If durability of LCB under rigid pavement is
found to be an issue in the recommended field survey, it is recommended that use of
the Residual Unconfined Compressive Strength (RUCS) test be considered.
Shrinkage Cracking. If durability problems associated with shrinkage cracking are
found for LCB, it is recommended that consideration be given to a maximum UCS
test strength or a shrinkage test.
Abrasion. If mechanical abrasion durability is an issue, it is recommended that
adoption of a mechanical abrasion test be considered, although the risk of abrasion
durability problems should be greatly reduced by the use of dowels.
7.0 REFERENCES
1. Addis, B. J. (Ed.). Fulton’s Concrete Technology. Portland Cement Institute, Midrand, 1986.
2. Ballantine, R. W. and A. J. Rossouw. Lime Stabilization of Soils. Northen Lime Co.,Johannesburg, 1972.7
3. Paige-Green, P., F. Netterberg, and L. R. Sampson. The Carbonation of ChemicallyStabilized Road Construction Materials: Guide to its Avoidance. Transportek, CSIR, ProjectReport PR 89/146, 1990.
4. De Beer, M. Behaviour of Cementitious Subbase Layers in Bitumen Base Road Structures.M. Eng. thesis, University of Pretoria, Pretoria, 1985.

50
5. Gass, B.,D. F. C. VENTURA, M. De Beer. Erodibility of Cemented Materials. Transportek,CSIR, Research Report RR 91/167/1, 1992.
6. Committee of Land Transport Officials (COLTO). Structural Design of Flexible Pavementsfor Interurban and Rural Roads. Pretoria, (Technical Recommendations for Highways(TRH4), 1985.
7. De Beer, M. Aspects of Erodibility of Lightly Cementitious Materials. Transportek, CSIR,Research Report DPVT 39, 1989.
8. Sampson, L. R. and P. Paige-Green. Recommendation for Suitable Durability Limits forLime and Cement Stabilized Materials. Transportek, CSIR, Research Report DPVT 130,1990.
9. American Association of State Highway and Transportation Officials (AASHTO).Materials: Part 2: Tests. 13th Edition. AASHTO, Washington, DC, 1982.
10. American Society for Testing and Materials. Annual Book of ASTM Standards. ASTM,Philadelphia, 1982.
11. South Africa Department of Transport. Standard Methods of Testing Road ConstructionMaterials. Pretoria, (Technical Methods for Highways (TMH 1), No1), 1986.
12. Sampson, L. R. Development of the Mechanical Wet/Dry Brushing Test for the DurabilityTesting of Stabilized Materials. Transportek, CSIR, Technical Report DPVT/31, Pretoria,1988.
13. Portland Cement Association (PCA). Soil-Cement Construction Handbook. Skokie, 42pp.
14. Committee of Land Transport Officials (COLTO). Structural Design of Flexible Pavementsfor Interurban and Rural Roads. (Technical Recommendations for Highways (TRH4),Pretoria, 1985.
15. Committee of Land Transport Officials (COLTO). Structural Design of Flexible Pavementsfor Interurban and Rural Roads. (Technical Recommendations for Highways (TRH4),Pretoria, 1996.
16. Committee of State Road Authorities. Guidelines for Road Construction Materials. CSRATechnical Recommendations for Highways, No 14, Pretoria, 1985.
17. Eades, J. L,, F. P. Nichols, R. E. Grimm. Formation of New Minerals with LimeStabilization as Proven by Field Experiments in Virginia. Highway Research Bulletin, 335,pp 31–39. 1962.
18. Klauss, K. A. Determination of the Initial Consumption of Lime in Soil (Gravel ICL TestProcedure), Test Method No. CA 34-83 (1984). Transportek, CSIR, Pretoria, 1984.
19. J. Harvey. Personal observation. Pavement Research Center field work.

51
20. Stantec Consulting, Inc. Pavement Performance Evaluation Services, Final Report toCalifornia Department of Transportation. 15 November 2002.
21. Wells, G. K. and W. A. Nokes. Synthesize PCCP Design Parameter Researched by Caltransand Others. California Department of Transportation, Division of New Technology,Materials and Research, Office of Pavement. 1991.

52
APPENDIX A: TEST METHODS
NOTE: The appendix has been left out of this version of this report in order to minimize
the file size.


![Package ‘broom’ - The Comprehensive R Archive Network · Michelle Evans [ctb], Jason Cory Brunson [ctb], Simon Jackson [ctb], Ben Whalley [ctb], Michael Kuehn [ctb], Jorge Cimentada](https://static.fdocuments.in/doc/165x107/5f03a8507e708231d40a21aa/package-abrooma-the-comprehensive-r-archive-network-michelle-evans-ctb.jpg)


![Package ‘arm’ - The Comprehensive R Archive Network · Package ‘arm ’ April 13, 2018 ... Maria Grazia Pittau [ctb], Jouni Kerman [ctb], Tian Zheng [ctb], Vincent Dorie [ctb]](https://static.fdocuments.in/doc/165x107/5af7d0be7f8b9a7444913dbb/package-arm-the-comprehensive-r-archive-network-arm-april-13-2018.jpg)