DuPont™ Vespel® TP-8000 Series Design Handbook
28
SUITABLE FOR MECHANICAL COMPONENTS REQUIRING THERMAL RESISTANCE, WEAR AND FRICTION PERFORMANCE, AND HIGH ELECTRICAL PERFORMANCE DuPont ™ Vespel ® TP-8000 Series Design Handbook A number of recent innovations in both product development and fabrication technology have led to a family of thermoplastic polyimide products that offer the design engineer practical, cost- competitive solutions to difficult problems in high temperature applications. Vespel ® TP-8000 Series parts are particularly adapted to applications where thermal stability, electrical properties, wear and friction behavior are required in mechanical components. Today’s competitive markets place a premium on the role of the design engineer, both in designing new products and redesigning existing ones. Vespel ® parts, like all plastic parts, are governed by the same rules for good design and by the same physical laws as other materials. Therefore, the intent of this manual is to help designers apply these principles to the selection, testing and specification of Vespel ® TP-8000 Series parts. This design manual contains comprehensive physical property and performance data on the TP-8000 Series resins from which corresponding Vespel ® parts are made. All of the data in the sections that follow are the result of physical property testing conducted by DuPont or its partners. The selection of data for this manual has been made in consultation with design engineers responsible for DuPont ™ Vespel ® 8000 Series applications. End-use testing is always recommended.
Transcript of DuPont™ Vespel® TP-8000 Series Design Handbook
SUITABLE FOR MECHANICAL COMPONENTS REQUIRING THERMAL RESISTANCE, WEAR AND FRICTION PERFORMANCE, AND HIGH ELECTRICAL PERFORMANCE
DuPont™ Vespel® TP-8000 Series Design Handbook
A number of recent innovations in both product development and fabrication technology have led to a family of thermoplastic polyimide products that offer the design engineer practical, cost-competitive solutions to difficult problems in high temperature applications. Vespel® TP-8000 Series parts are particularly adapted to applications where thermal stability, electrical properties, wear and friction behavior are required in mechanical components.
Today’s competitive markets place a premium on the role of the design engineer, both in designing new products and redesigning existing ones. Vespel® parts, like all plastic parts, are governed by the same rules for good design and by the same physical laws as other materials. Therefore, the intent of this manual is to help designers apply these principles to the selection, testing and specification of Vespel® TP-8000 Series parts.
This design manual contains comprehensive physical property and performance data on the TP-8000 Series resins from which corresponding Vespel® parts are made. All of the data in the sections that follow are the result of physical property testing conducted by DuPont or its partners. The selection of data for this manual has been made in consultation with design engineers responsible for DuPont™ Vespel® 8000 Series applications. End-use testing is always recommended.

Page
List of Tables i
List of Figures i
Introduction 1 Chemistry 1 Product Overview 1 Fabrication Methods 1 Defining the End-Use Requirements 1 Prototyping the Design 2 Testing the Design 2 Writing Meaningful Specifications 3
Performance Properties 3 Mechanical Properties 3 Thermal Properties 6 Dynamic Mechanical Analysis 6 Thermal Aging 6 Flexural Creep 7 Flexural Fatigue 7 Tribological Properties 7 Electrical Properties 8 Environmental Properties 8 Chemical Exposure 8 Radiation Exposure 9 Outgassing Performance 10
Injection Molding 11 The Process and Equipment 11 The Molding Machine 11 The Mold 11
Table of Contents
Page
Molding Considerations 11 Uniform Walls 11 Configurations 12 Draft and Ejector Pins 13 Fillets and Radii 13 Bosses 13 Ribbing 13 Holes and Coring 14 Threads 15 External Threads 15 Internal Threads 16 Stripped Threads 16 Thread Profile 16 Threads — Effect of Creep 16 Undercuts 17 Molded-In Inserts 17 Part Design for Insert Molding 18
Appendix 19 A — Design Check List 19 B — Stress/Strain Curves as a Function of Temperature in Tension and Compression 19 C — Flexural Creep 22 D — Chemical Resistance Data 23

List of Tables Page
1. Typical Properties (English Units) 4
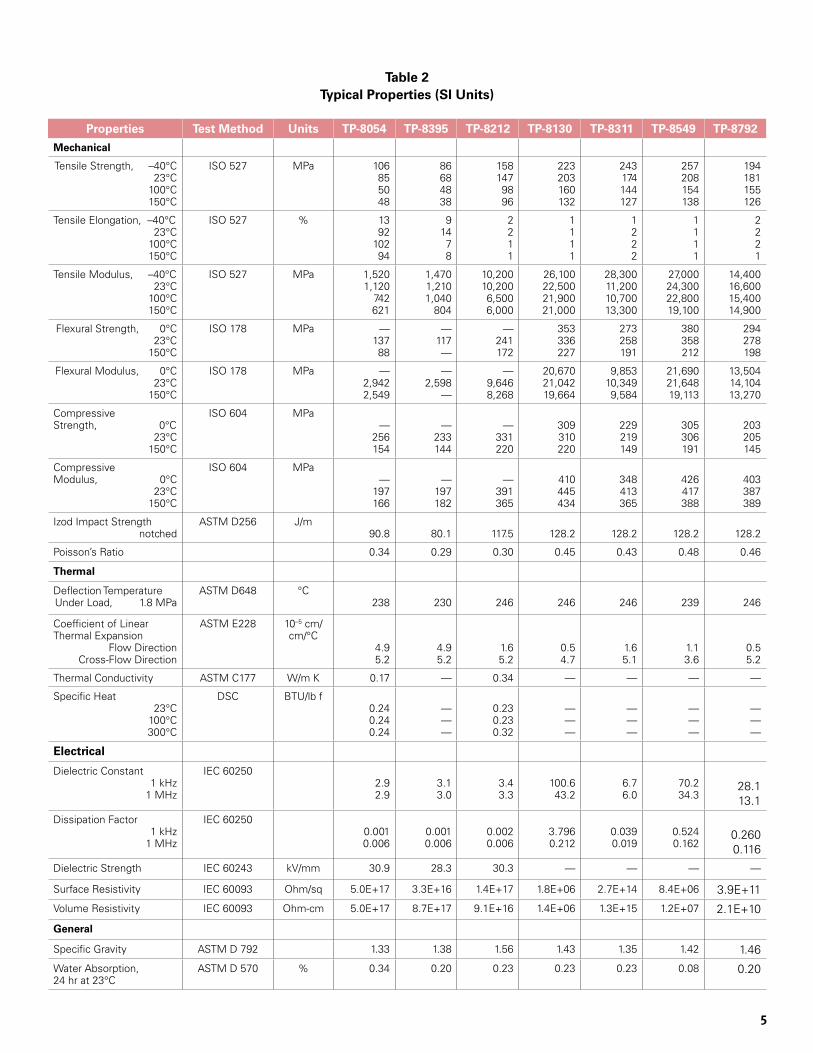
2. Typical Properties (SI Units) 5
3. Suzuki Thrust Wear Test Results — Dry 8
4. Suzuki Thrust Wear Test Results — Lubricated 8
5. Dielectric Constant/Dissipation Factor and Dielectric Strength 8
6. Surface and Volume Resistivity 8
7. Chemical Resistance — 10 Day Immersion at 23°C 9
8. Chemical Resistance — 30 Day Immersion 9
9. Property Retention after Oil Exposure at Elevated Temperature 9
10. Property Retention of TP-8054 Film after Oil Exposure 9
11. Draft Angle Allowances 13
TP 8054 Film Exposure 23
Acid Exposure 23
Refrigerant Exposure 23
List of Figures
Page
1. Tensile Strength as a Function of Temperature 3
2. Flexural Strength as a Function of Temperature 3
3. Compression Strength as a Function of Temperature 3
4. DMA Curve for TP-8054 6
5. DMA Curve for TP-8130 6
6. Tensile Strength Retention of TP-8054 after aging at 200°C 6
7. Elongation Retention of TP-8054 after aging at 200°C 6
8. Flexural Creep at 23°C 7
9. Flexural Fatigue 7
10. Suzuki Thrust Wear Schematic 7
11. Tensile Strength Retention after Electron Bean Exposure 10
12. Elongation Retention after Electron Bean Exposure 10
13. Tensile Elongation Retention after Gamma Irradiation Exposure (Cobalt 60) 10
14. Tensile Property Retention after Neutron Irradiation Exposure 10
15. Outgassing Performance Data 10
16. Injection Molding Machine 11
17. Plastifying Cylinder 11
18. Effects of Non-Uniform Wall Thickness on Molded Parts 12
19. External Radius Illustration, Uniform Wall 12
20. Design Considerations for Maintaining Uniform Walls of Ribs and Bosses 12
21. Additional Uniform Wall Considerations 12
22. Wall Thickness Transition 12
i

List of Figures (continued)
Page
23. Stress Concentration Factors for a Cantilevered Structure 13
24. Use of External or Internal Radii 13
25. Boss Design 14
26. Additional Boss Design Details 14
27. Cored Holes 14
28. Counterboring Holes 14
29. Additional Cored Hole Details 15
30. Drilled Holes 15
31. Hole Design 15
32. Blind Holes 15
33. Molding External Threads without Side Core 16
34. Stripping of Roll-Type Threads 16
35. Mold Ejection of Rounded Thread-Form Undercuts — Male 16
36. Mold Ejection of Rounded Thread-Form Undercuts — Female 16
37. Correct Termination of Threads 17
38. Suggested End Clearance on Threads 17
39. Suggestions for Designing Threaded Assemblies of Metal to Plastic 17
40. Undercuts 17
41. Boss Design Details for Insert Molding 18
42. Insert Design Details 18
A-1 Design Check List 19
B-1 TP-8054 Stress/Strain in Tension 19
B-2 TP-8395 Stress/Strain in Tension 19
B-3 TP-8212 Stress/Strain in Tension 19
B-4 TP-8130 Stress/Strain in Tension 20
B-5 TP-8311 Stress/Strain in Tension 20
B-6 TP-8549 Stress/Strain in Tension 20
B-7 TP-8792 Stress/Strain in Tension 20
B-8 TP-8054 Stress/Strain in Compression 20
B-9 TP-8395 Stress/Strain in Compression 20
B-10 TP-8212 Stress/Strain in Compression 21
B-11 TP-8130 Stress/Strain in Compression 21
B-12 TP-8311 Stress/Strain in Compression 21
B-13 TP-8549 Stress/Strain in Compression 21
B-14 TP-8792 Stress/Strain in Compression 21
C-1 TP-8054 Flexural Creep 22
C-2 TP-8395 Flexural Creep 22
C-3 TP-8212 Flexural Creep 22
C-4 TP-8130 Flexural Creep 22
C-5 TP-8311 Flexural Creep 22
C-6 TP-8549 Flexural Creep 22
C-7 TP-8792 Flexural Creep 22
ii

�
INTRODUCTIONChemistryDuPont™ Vespel® TP-8000 Series is a group of products based on semi-crystalline polyimide having a Tg of 250°C and a Tm of 388°C. However, the molded products are amorphous because the crystallization speed is slower than that of typical semi-crystalline polymers. TP-8000 can be used up to 240°C in the as-molded amorphous state, whereas it can be used above 240°C up to 320°C when crystallized after molding. However, since maximum use temperature is dependent on a number of factors, contact your local Vespel® Technical resource for guidance.
Product Overview The TP-8000 series includes several different products that cover a wide array of high temperature and high wear applications. The table below gives a brief overview of the product offering. While this design manual covers these standard TP-8000 grades, several specialty grades are available. Please contact your local Vespel® Technical resource to discuss your specific application in more detail so that a suitable TP-8000 Series product can be identified.
Fabrication Methods Since TP-8000 series products are thermoplastic, they can be fabricated into articles using melt processing techniques such as injection molding, extrusion, and thermoforming. This geometric
Vespel® TP Grade Nominal Composition Performance Overview Typical Applications
TP-8054 Unfilled General purpose unfilled grade used in insulating applications
Electrical bushings, thermal and electrical Insulator rings and pads, connectors, switches
TP-8395 PTFE, Graphite Blend Used for wear applications where the countersurface is highly polished or a soft metal
Wear rings, washers, seal rings
TP-8212 30% Glass Filled High modulus grade used in insulating applications that do not require wear resistance (Glass is aggressive towards countersurface).
Brackets, thermal and electrical insulators
TP-8130 30% Carbon Fiber Filled Internally lubricated, high modulus grade used in both dry and lubricated wear environments.
Thrust washers, bushings bearings, wear pads and strips
TP-8311 10% Carbon Fiber Filled Medium modulus grade used in both dry and lubricated wear environments
Fairings, wear strips and pads,
TP-8549 30% Carbon Fiber Filled High modulus grade similar to TP-8130 but offers improved wear performance and chemical resistance.
Thrust washers, bushings bearings, wear pads and strips
TP-8792 15% Carbon Fiber, 15% PTFE Filled
Similar in strength to TP-8311 with better wear resistance at high speeds in lubricated environments
Seal rings, piston rings, vanes
flexibility gives design engineers unprecedented freedom to creatively solve most design problems without the added cost of a secondary machining operation. Furthermore, given the geometric flexibility that comes with these products, multiple components may be incorporated into a single part, reducing tooling, inventory and part handling costs. When metal or ceramic mating components are required, insert-molding Vespel® TP is always an option-adding more design flexibility and overall part functionality.
Defining the End-Use RequirementsThe most important first step in designing a plastic part is to define properly and completely the environment in which the part will operate. Properties of plastic materials are substantially altered by temperature, chemical exposure, and applied stress. These environmental effects must be defined on the basis of both short and long term exposure conditions. Time under stress and environment is important in determining the extent to which properties, and thus the performance of the part will be affected. If a part is to be subject to temperature changes in the end-use, it is not enough to define the maximum temperature to which the part will be exposed. The total time the part will be at that temperature during the design life of the device must also be calculated. The same applies to stress resulting from an applied load. If the stress is applied intermittently, the time it is applied and the frequency of occurrence is very important. Plastic materials are subject to creep under applied stress and the creep rate is accelerated with increasing temperature. If loading is intermittent, the plastic part will recover to some extent, depending upon the stress level, the duration of time the stress is applied, the length of time the stress is removed or

�
reduced, and the temperature during each time period. The effect of chemicals, lubricants, etc., is likewise time and stress dependent. Some materials may not be affected in the unstressed state, but will stress crack when stressed and exposed to the same reagent over a period of time. A design checklist is included in Appendix A to serve as a guide when defining the end-use requirements.
Prototyping the DesignIn order to move a part from the design stage to commercial reality, it is often necessary to produce prototype parts for testing and modification. The preferred method for making prototypes is to simulate as closely as practical the same process by which the parts will be made in commercial production. Most engineering plastic parts are made in commercial production via the injection molding process, thus, the prototypes should be made using a single cavity prototype mold or a test cavity mounted in the production mold base. The reasons for this are sound, and it is important that they be clearly understood. The discussion that follows will describe the various methods used for making prototypes, together with their advantages and disadvantages.
Machining from Rod or Plaque StockThis method is commonly used where the design is very tentative and a small number of prototypes are required, and where relatively simple part geometry is involved. Machining of complex shapes, particularly where more than one prototype is required, can be expensive. Machined parts can be used to assist in developing a more firm design, or even for limited testing, but are not recommended for final evaluation prior to commercialization. The reasons are as follows:
• Properties such as strength, toughness and elongation will likely be lower than that of the molded part because of machine tool marks on the sample part.
• If fiber reinforced resin is required, the effects of fiber orientation can be misleading. It is common for machined parts from fiber filled product to have less than half the strength than that in molded form. Furthermore, if machined parts will be used for wear testing, the exposed fiber ends for fiber filled resins might lead to misleading test results versus actual performance from a molded article.
• Surface characteristics such as knockout pin marks, gate marks and mold parting line found in molded parts will not be represented in the machined part.
• The effect of knit lines in molded parts cannot be studied.
• Dimensional stability may be misleading due to gross differences in internal stresses and fiber orientation, if fiber reinforced products are used.
• Voids commonly found in the center of rod and plaque stock can reduce part strength. By the same token, the effect of voids sometimes present in heavy sections of a molded part cannot be evaluated.
• There may be a limited selection of resins available in rod or plaque stock.
Prototype ToolA better alternative to machined prototypes is to mold the part in a prototype tool. This approach better simulates a production molded part. Basic information will then be available for mold shrinkage, fiber orientation and gate position. This type of tool will provide parts which are more suitable for end-use testing, and it can potentially be modified to accommodate changes in geometry and dimensions.
Preproduction ToolThe best approach for design developments of precision parts is the construction of a preproduction tool. This can be a single cavity mold, or a single cavity in a multi-cavity mold base. The cavity will have been machine finished but not hardened, and therefore some alterations can still be made. It will have the same cooling as the production tool so that any problems related to warpage and shrinkage can be studied. With the proper knockout pins, the mold can be cycled as though on a production line so that cycle times can be established. And most importantly, these parts can be evaluated for dimensions and geometry, strength, impact, wear, and other physical properties in the actual or simulated end-use environment.
Testing the DesignEvery design should be thoroughly tested while still in the prototype stage. Early detection of design flaws or faulty assumptions will save time, labor, and material. The following are general options for validating the final design:
• Actual end-use testing is the best test of the prototype part. All performance requirements are encountered here, and a complete evaluation of the design can be made.
• Simulated service tests can be conducted. The value of such tests depends on how closely end-use conditions are duplicated. For example, an under hood automotive part might be given temperature, vibration and hydrocarbon resistance tests; a bracket might be subjected to abrasion and impact tests; and an electronic component might undergo tests for electrical and thermal insulation.
• Field testing is highly recommended. However, long-term field or end-use testing to evaluate the important effects of time under load and temperature is sometimes impractical or uneconomical. Accelerated test programs permit long-term

�
performance predictions based upon short term “severe” tests; but discretion is necessary. The relationship between long vs. short term accelerated testing is not always known. Your DuPont representative should be consulted when accelerated testing is contemplated.
Writing Meaningful SpecificationsA specification is intended to satisfy functional, aesthetic and economic requirements by controlling variations in the final product. The part must meet the complete set of requirements as prescribed in the specifications. The designers’ specifications should include:
• Specific TP-8000 Series grade
• Surface finish
• Parting line location desired
• Flash limitations
• Permissible gating and knit line areas (away from critical stress points)
• Permissible knockout pin locations
• Locations where voids are intolerable
• Allowable warpage
• Tolerances
PERFORMANCE PROPERTIESDuPont™ Vespel® TP-8000 Series products are near the top of the engineering polymers performance pyramid. The following sections will illustrate the capability of these products across a broad temperature range and demonstrate their potential use in a wide variety of demanding applications. Typical properties are summarized in Tables 1 and 2.
Mechanical PropertiesVespel® TP-8000 series products offer excellent mechanical performance in demanding environments, particularly at high temperature. These products are candidates for fabrication of components used in elevated temperature environments.
Figures 1–3 show mechanical performance across a broad temperature range. TP-8000 retains significant strength even at temperatures as high as 150°C, beyond the capabilities of many other thermoplastic materials. Whether your application is subjected to tensile, flexural, or compressive stresses at elevated temperatures, TP-8000 is a logical candidate for initial evaluations.
Since most designers are interested in the stress-strain behavior, stress-strain curves for each grade in tension and compression are provided in Appendix B.
Figure 1. Tensile Strength as a Function of Temperature (ISO 527)
Figure 2. Flexural Strength as a Function of Temperature (ISO 178)
Figure 3. Compression Strength as a Function of Temperature (ISO 604)
—
50
100
150
200
250
300
–50 0 50 100 150 200
Tens
ile S
treng
th, M
Pa
Temperature, °C
TP-8054 TP-8395 TP-8212 TP-8130 TP-8311 TP-8792TP-8549
0
50
100
150
200
250
300
350
400
0 20 40 60 80 100 120 140 160
Flex
ural
Str
engt
h, M
Pa
Temperature, °C
TP-8054 TP-8395 TP-8212 TP-8130 TP-8311 TP-8792TP-8549
50
100
150
200
250
300
350
0 20 40 60 80 100 120 140 160—
Com
pres
sion
Str
engt
h, M
Pa
Temperature, °C
TP-8054 TP-8395 TP-8212 TP-8130 TP-8311 TP-8792TP-8549

�
Properties Test Method Units TP-8054 TP-8395 TP-8212 TP-8130 TP-8311 TP-8549 TP-8792
Mechanical
Tensile Strength, –40°F73°F
212°F302°F
ISO 527 kpsi 15.412.3
7.37.0
12.59.97.05.5
23.021.314.214.0
32.429.523.219.2
35.225.320.918.4
37.330.222.320.1
28.226.222.518.3
Tensile Elongation, –40°F73°F
212°F302°F
ISO 527 % 1392
10294
91478
2211
1111
1222
1111
2221
Tensile Modulus, –40°F73°F
212°F302°F
ISO 527 kpsi 22016310890
213 175151117
1,4901,490
943865
3,7803,2603,1703,050
4,1001,6201,5601,930
3,9203,5303,3002,770
2,1002,4102,2302,160
Flexural Strength, 32°F73°F
302°F
ISO 178 kpsi —19.912.8
—17.0
—
—35.025.0
51.348.732.9
39.637.527.7
55.251.930.8
42.640.328.7
Flexural Modulus, 32°F 73°F
302°F
ISO 178 kpsi —427370
377——
—1,4001,200
3,0003,0542,854
1,4301,5021,391
3,1483,1422,774
1,9602,0471,926
Compressive Strength, 32°F
73°F302°F
ISO 604 kpsi—
37.122.3
—33.820.9
—48.032.0
44.845.032.0
33.231.821.6
44.244.427.7
29.429.721.0
Compressive Modulus, 32°F
73°F302°F
ISO 604 kpsi—
197166
—197182
—391365
410445434
348413365
426417388
403387389
Izod Impact Strengthnotched
ASTM D256 ft-lbs/in1.7 1.5 2.2 2.4 2.4 2.4 2.4
Poisson’s Ratio 0.34 0.29 0.30 0.45 0.43 0.48 0.46
Thermal
Deflection TemperatureUnder Load, 264 psi
ASTM D648 °F460 446 475 475 475 462 475
Coefficient of Linear Thermal Expansion
Flow DirectionCross-Flow Direction
ASTM E228 10–5 in/in/°F
2.72.9
2.72.9
0.92.9
0.32.6
0.92.8
0.62.0
0.32.9
Thermal Conductivity ASTM C177 W/m K 0.17 — 0.34 — — — —
Specific Heat73°F
212°F572°F
DSC BTU/lb°F0.240.240.34
———
0.230.230.32
———
———
———
———
Electrical
Dielectric Constant1 kHz
1 MHz
IEC 602502.92.9
3.13.0
3.43.3
100.643.2
6.76.0
70.234.3
28.113.1
Dissipation Factor1 kHz
1 MHz
IEC 602500.0010.006
0.0010.006
0.0020.006
3.7960.212
0.0390.019
0.5240.162
0.2600.116
Dielectric Strength IEC 60243 kV/mm 30.9 28.3 30.3 — — — —
Surface Resistivity IEC 60093 Ohm/Sq 5.0E+17 3.3E+16 1.4E+17 1.8E+06 2.7E+14 8.4E+06 3.9E+11
Volume Resistivity IEC 60093 Ohm-cm 5.0E+17 8.7E+17 9.1E+16 1.4E+06 1.3E+15 1.2E+07 2.1E+10
General
Specific Gravity ASTM D 792 1.33 1.38 1.56 1.43 1.35 1.42 1.46
Water Absorption, 24 hr at 73°F
ASTM D 570 % 0.34 0.20 0.23 0.23 0.23 0.08 0.20
Table 1 Typical Properties (English Units)
�
Table 2 Typical Properties (SI Units)
Properties Test Method Units TP-8054 TP-8395 TP-8212 TP-8130 TP-8311 TP-8549 TP-8792
Mechanical
Tensile Strength, –40°C23°C
100°C150°C
ISO 527 MPa 106855048
86684838
1581479896
223203160132
243174144127
257208154138
194181155126
Tensile Elongation, –40°C23°C
100°C150°C
ISO 527 % 1392
10294
91478
2211
1111
1222
1111
2221
Tensile Modulus, –40°C23°C
100°C150°C
ISO 527 MPa 1,5201,120
742621
1,470 1,2101,040
804
10,20010,2006,5006,000
26,10022,50021,90021,000
28,30011,20010,70013,300
27,00024,30022,80019,100
14,40016,60015,40014,900
Flexural Strength, 0°C23°C
150°C
ISO 178 MPa —13788
—117—
—241172
353336227
273258191
380358212
294278198
Flexural Modulus, 0°C23°C
150°C
ISO 178 MPa —2,9422,549
—2,598
—
—9,6468,268
20,67021,04219,664
9,85310,3499,584
21,69021,64819,113
13,50414,10413,270
Compressive Strength, 0°C
23°C150°C
ISO 604 MPa—
256154
—233144
—331220
309310220
229219149
305306191
203205145
Compressive Modulus, 0°C
23°C150°C
ISO 604 MPa—
197166
—197182
—391365
410445434
348413365
426417388
403387389
Izod Impact Strengthnotched
ASTM D256 J/m90.8 80.1 117.5 128.2 128.2 128.2 128.2
Poisson’s Ratio 0.34 0.29 0.30 0.45 0.43 0.48 0.46
Thermal
Deflection TemperatureUnder Load, 1.8 MPa
ASTM D648 °C238 230 246 246 246 239 246
Coefficient of Linear Thermal Expansion
Flow DirectionCross-Flow Direction
ASTM E228 10–5 cm/cm/°C
4.95.2
4.95.2
1.65.2
0.54.7
1.65.1
1.13.6
0.55.2
Thermal Conductivity ASTM C177 W/m K 0.17 — 0.34 — — — —
Specific Heat23°C
100°C300°C
DSC BTU/lb f0.240.240.24
———
0.230.230.32
———
———
———
———
Electrical
Dielectric Constant1 kHz
1 MHz
IEC 602502.92.9
3.13.0
3.43.3
100.643.2
6.76.0
70.234.3
28.113.1
Dissipation Factor1 kHz
1 MHz
IEC 602500.0010.006
0.0010.006
0.0020.006
3.7960.212
0.0390.019
0.5240.162
0.2600.116
Dielectric Strength IEC 60243 kV/mm 30.9 28.3 30.3 — — — —
Surface Resistivity IEC 60093 Ohm/sq 5.0E+17 3.3E+16 1.4E+17 1.8E+06 2.7E+14 8.4E+06 3.9E+11
Volume Resistivity IEC 60093 Ohm-cm 5.0E+17 8.7E+17 9.1E+16 1.4E+06 1.3E+15 1.2E+07 2.1E+10
General
Specific Gravity ASTM D 792 1.33 1.38 1.56 1.43 1.35 1.42 1.46
Water Absorption, 24 hr at 23°C
ASTM D 570 % 0.34 0.20 0.23 0.23 0.23 0.08 0.20

�
Thermal PropertiesDynamic Mechanical Analysis (DMA)While most designers are comfortable with HDT as an indicator of how a material will perform at elevated temperatures, DMA offers more insight into how a material might respond in a given environment.
DMA provides valuable data for characterizing the thermal performance of polymers. DMA measures the amplitude and phase of a sample’s displacement in response to an applied oscillating force. The stiffness of the sample is calculated from this data and converted to a modulus to enable inter-sample comparison. Tan δ, the loss tangent or damping factor, is also calculated. A temperature scan at constant frequency can generate a fingerprint of the material’s relaxational processes and its glass transition temperature (Tg). This technique provides the most sensitive method for measuring Tg.
Figures 4 and 5 show the DMA results for TP-8054 and TP-8130 respectively. These curves are helpful to designers seeking to identify the Tg and understand the stiffness of a component at a certain temperature. The designer may also better understand the dimensional stability of precision parts at temperature since thermal expansion coefficients can increase dramatically above the Tg.
Thermal AgingTP-8000 Series resins offer long-term thermal stability at elevated temperatures. To help illustrate this performance, test specimens were aged at 200°C for 5000 hours while monitoring their tensile strength and elongation retention. Figure 6 shows complete retention of tensile strength even after 5000 hr at 200°C. Figure 7 shows a significant retention of elongation after the same period.
Figure 4. DMA Curve for TP-8054
Figure 5. DMA Curve for TP-8130
Figure 6. Tensile Strength Retention of TP-8054 after Aging at 200°C (ISO 527)
0.0
20.0
40.0
60.0
80.0
100.0
120.0
0 1000 2000 3000 4000 5000 6000
Tens
ile S
tren
gth
Rete
ntio
n, %
Hours
Figure 7. Elongation Retention of TP-8054 after Aging at 200°C (ISO 527)
0.0
20.0
40.0
60.0
80.0
100.0
120.0
0 1000 2000 3000 4000 5000 6000
Elon
gatio
n Re
tent
ion,
%
Hours
0
500
1000
1500
2000
2500
3000
0 50 100 150 200 250 300
Stor
age
Mod
ulus
, MPa
350
400
300
200
100
0
Loss
Mod
ulus
, MPa
Tan
Del
ta
1.5
1.0
0.5
0.0
Temperature, %
2500°C2510 MPa1. Hz
235.43°C323.1 MPa1. Hz
250.13°C1.4601. Hz
250.50°C0.006135 MPa1. Hz
0
500
1000
1500
2000
2500
3000
0 100 200 300
Stor
age
Mod
ulus
, MPa
300
2000
1500
1000
500 Loss
Mod
ulus
, MPa
Tan
Del
ta
0.8
0.6
0.1
0.0
Temperature, °C
25.00°C55.53 MPa1 Hz
238.26°C18.15 MPa1. Hz
211.11°C0.26861 Hz
216.50°C0.81081 Hz
400
0
0.2

�
Flexural CreepPlastics tend to deform over time when exposed to a sustained load. This is known as creep. The designer should account for creep in applications that will expose the component to a long-term load. Like other performance attributes, creep will be influenced by the magnitude of the applied load as well as the temperature at which the load is applied. The flexural creep performance for TP-8000 products at 23°C and 48 MPa (7,000 psi) is shown in Figure 8. Typically, unfilled or lightly filled products will exhibit higher creep, as seen here. Appendix C contains flexural creep data for each grade at elevated temperature.
Figure 9. Flexural Fatigue, at 75 kHz (ASTM D 671)
Figure 8. Flexural Creep at 23°C/48 MPa (7,000 psi) (ASTM D 2990)
0
0.5
1
1.5
2
2.5
3
0.01 0.1 1 10 100 1000 10000
Stra
in, %
Hours
TP-8054
TP-8395
TP-8212TP-8130
TP-8311
TP-8792TP-8549
Flexural FatigueSome applications stress components by cyclical loading or vibration. Flexural, compressive, shear (twist) or tensile loading may result. Repeated cyclic loading causes a deterioration of mechanical performance and potentially leads to complete failure. Fatigue resistance data is important to designers for any part that will be used in an application that involves cyclic loading such as gears, rollers or components in vibrating equipment. Figure 9 shows the flexural fatigue performance of select TP-8000 grades.
Tribological PropertiesOne of the main performance attributes of DuPont™ Vespel® TP-8000 Series products is their wear and friction behavior. Wear and friction performance is not a material attribute, but the resulting performance of the interaction of two materials.
Factors such as load, velocity, dry or lubricated environment, countersurface composition and surface finish and temperature all contribute to wear and friction performance.
To give an indication of wear performance, certain TP-8000 grades were tested under thrust wear conditions. Results are shown in Tables 3 and 4. The test is based upon the Suzuki thrust wear method (JIS-K7218A). The washers did not contain grooves. Dry wear testing was conducted over a 7 hr period while lubricated testing was conducted over a 4 hr period. The countersurface was SUS 304 stainless steel. This countersurface material corresponds to ANSI 304 and ISO 683/13 11.
Generally, the highly loaded carbon fiber grades tend to perform well under high load, low speed while grades containing PTFE or PTFE and carbon fiber combination tend to perform well under high speed, low load. Since grade selection will depend on many factors, please consult with a Vespel® Technical Service Representative for assistance in selecting the appropriate grade for your application.
0
10
20
30
40
50
60
10,000 100,000 1,000,000 10,000,000
Max
imum
Str
engt
h, M
Pa
Cycles to FailureTP-8054 TP-8395 TP-8130
Slide Surface
Weight (Constant)
Test Piece (Fixed Cylinder)
Friction Material (Rotary Plate)
Heating of Total Enviroment
Figure 10. Suzuki Thrust Wear Test Schematic (JIS-K7218A)

�
Electrical PropertiesThe unfilled and glass filled TP-8000 grades are excellent electrical insulators. The dielectric constant, dissipation factor and dielectric strength for each grade are listed in Table 5. The carbon fiber filled grades are not electrical insulating by nature. Therefore, no dielectric strength values are reported. Table 6 lists the surface and volume resistivity for each grade.
Grade
PV
psi·ft/min
PV
MPa·m/s
friction,
µ
wear factor, K
10-10 cm3/kgfm
resin wear,
mg
metal wear,
mg
TP-8130 71,000 2.5 0.05 66 10 <1
TP-8130 95,000 3.3 0.04 77 16 <1
TP-8549 71,000 2.5 0.05 49 9 <1
TP-8549 95,000 3.3 0.05 63 14 <1
TP-8311 14,000 0.5 0.10 670 23 <1
TP-8311 28,000 1.0 0.10 490 34 <1
Table 3 Suzuki Thrust Wear Test Results — Dry
Grade
PV
psi·ft/min
PV
MPa·m/s
friction,
µ
wear factor,
K
resin wear,
mg
metal wear,
mg
TP-8130 298,000 10.4 0.03 4 2 <1
TP-8130 357,000 12.5 0.03 3 1 <1
TP-8549 298,000 10.4 0.02 3 1 <1
TP-8549 357,000 12.5 0.02 4 2 <1
TP-8311 298,000 10.4 0.02 3 1 <1
TP-8311 357,000 12.5 0.02 2 1 <1
TP-8549 298,000 10.4 0.03 3 2 <1
Table 4 Suzuki Thrust Wear Test Results — Lubricated
Environmental Properties
Chemical ExposureDuPont™ Vespel® TP-8000 Series is a chemically resistant advanced engineering thermoplastic. It offers resistance against most acids, bases, and organic solvents.
SolventsOrganic solvents in general have little effect on the mechanical and dimensional stability of polyimide parts. Chlorinated and fluorinated solvents such as perchloroethylene and trichloroethylene are recommended for surface cleaning of Vespel® parts. Hydrocarbon solvents such as toluene and kerosene have virtually no effect on polyimide materials. At high temperatures, some solvents containing functional groups such as m-cresol and nitrobenzene can cause swelling of polyimides without substantially reducing its mechanical strength.
AcidsConcentrated mineral acids cause severe embrittlement of polyimide parts in a relatively short time and should be avoided. Generally, dilute acid solutions and aqueous solutions of inorganic salts having acidic pH’s have about the same effect on polyimide as water.
BasesGenerally, polyimide resins are susceptible to alkaline attack. Aqueous bases attack polyimides leading to rapid deterioration of properties. All basic solutions with a pH of 10 or greater, including salt solutions, should be avoided. Cleaning agents of a caustic nature are not recommended.
Certain grades of TP-8000 can be annealed to induce crystallization and reduce sensitivity to chemicals such as nitric acid and dichloromethane. Tables 7 and 8 show the chemical resistance of TP-8054 test specimens when immersed in a wide variety of chemical substances.
Additional chemical resistance data for test specimens and films of TP-8054 can be found in Appendix D.
1 kHz
1 MHz
1 kHz
1 MHz
TP-8054 2.9 2.8 0.001 0.006 30.9
TP-8395 3.1 3.0 0.001 0.006 28.3
TP-8212 3.4 3.3 0.002 0.006 30.3
TP-8130 100.6 43.2 3.796 0.212 N/A
TP-8311 6.7 6.0 0.039 0.019 N/A
TP-8549 70.2 34.2 0.524 0.162 N/A
TP-8792 28.1 13.1 0.260 0.116 N/A
Dielectric Contant (IEC 60250)
Dissipation Factor (IEC 60250)
Dielectric Strength (IEC 60243)
kV/mm
Table 5 Dielectric Constant/Dissipation Factor
and Dielectric Strength (23°C, 2.0 mm Thickness)
Surface Resistivity(IEC 60093)
Ohm/sq
Volume Resistivity(IEC 60093)
Ohm-cm
TP-8054 5.0E+17 5.0E+17
TP-8395 3.3E+16 8.7E+17
TP-8212 1.4E+17 9.1E+16
TP-8130 1.8E+06 1.4E+06
TP-8311 2.7E+14 1.3E+15
TP-8549 8.4E+06 1.2E+07
TP-8792 3.9E+11 2.1E+10
Table 6 Surface and Volume Resistivity
�
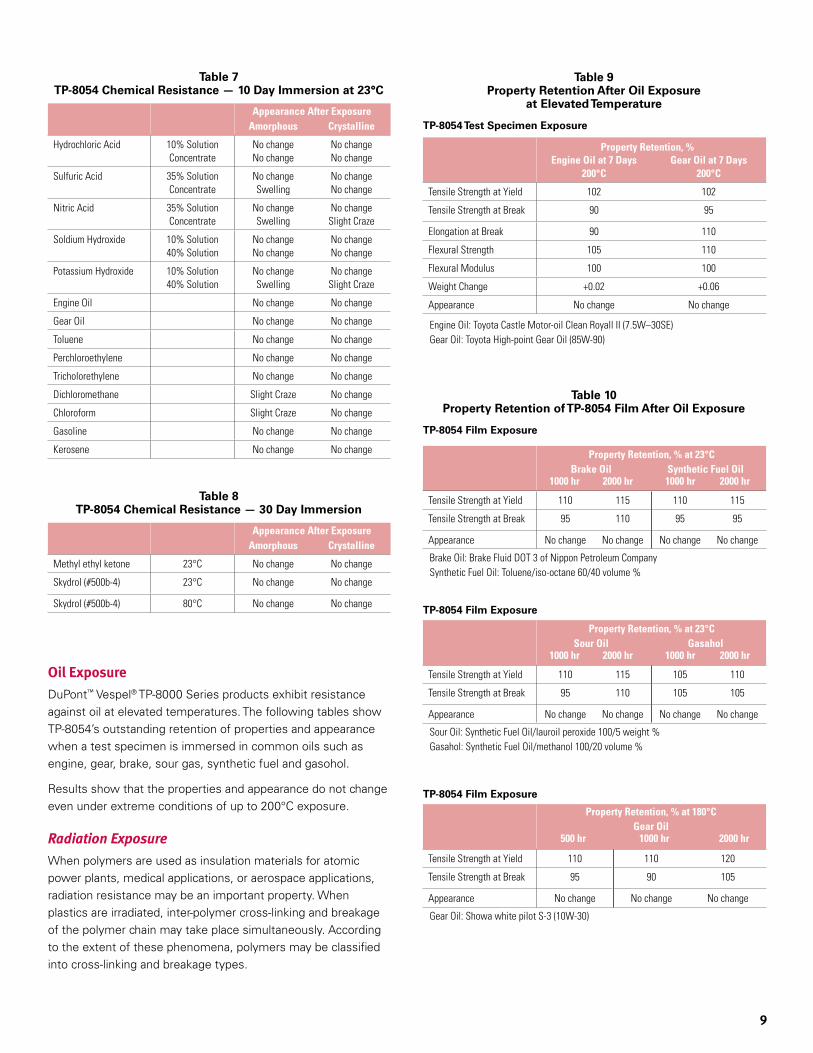
Oil ExposureDuPont™ Vespel® TP-8000 Series products exhibit resistance against oil at elevated temperatures. The following tables show TP-8054’s outstanding retention of properties and appearance when a test specimen is immersed in common oils such as engine, gear, brake, sour gas, synthetic fuel and gasohol.
Results show that the properties and appearance do not change even under extreme conditions of up to 200°C exposure.
Radiation ExposureWhen polymers are used as insulation materials for atomic power plants, medical applications, or aerospace applications, radiation resistance may be an important property. When plastics are irradiated, inter-polymer cross-linking and breakage of the polymer chain may take place simultaneously. According to the extent of these phenomena, polymers may be classified into cross-linking and breakage types.
Amorphous Crystalline
Hydrochloric Acid 10% Solution Concentrate
No change No change
No change No change
Sulfuric Acid 35% Solution Concentrate
No change Swelling
No change No change
Nitric Acid 35% Solution Concentrate
No change Swelling
No change Slight Craze
Soldium Hydroxide 10% Solution 40% Solution
No change No change
No change No change
Potassium Hydroxide 10% Solution 40% Solution
No change Swelling
No change Slight Craze
Engine Oil No change No change
Gear Oil No change No change
Toluene No change No change
Perchloroethylene No change No change
Tricholorethylene No change No change
Dichloromethane Slight Craze No change
Chloroform Slight Craze No change
Gasoline No change No change
Kerosene No change No change
Table 7 TP-8054 Chemical Resistance — 10 Day Immersion at 23°C
Appearance After Exposure
Amorphous Crystalline
Methyl ethyl ketone 23°C No change No change
Skydrol (#500b-4) 23°C No change No change
Skydrol (#500b-4) 80°C No change No change
Table 8 TP-8054 Chemical Resistance — 30 Day Immersion
Appearance After Exposure
Engine Oil at 7 Days 200°C
Gear Oil at 7 Days200°C
Tensile Strength at Yield 102 102
Tensile Strength at Break 90 95
Elongation at Break 90 110
Flexural Strength 105 110
Flexural Modulus 100 100
Weight Change +0.02 +0.06
Appearance No change No change
Table 9 Property Retention After Oil Exposure
at Elevated Temperature
TP-8054 Test Specimen Exposure
Property Retention, %
Engine Oil: Toyota Castle Motor-oil Clean Royall II (7.5W–30SE)Gear Oil: Toyota High-point Gear Oil (85W-90)
Tensile Strength at Yield 110 115 110 115
Tensile Strength at Break 95 110 95 95
Appearance No change No change No change No change
Table 10 Property Retention of TP-8054 Film After Oil Exposure
TP-8054 Film Exposure
Property Retention, % at 23°C Brake Oil Synthetic Fuel Oil 1000 hr 2000 hr 1000 hr 2000 hr
Brake Oil: Brake Fluid DOT 3 of Nippon Petroleum CompanySynthetic Fuel Oil: Toluene/iso-octane 60/40 volume %
Tensile Strength at Yield 110 115 105 110
Tensile Strength at Break 95 110 105 105
Appearance No change No change No change No change
TP-8054 Film Exposure
Property Retention, % at 23°C Sour Oil Gasahol 1000 hr 2000 hr 1000 hr 2000 hr
Sour Oil: Synthetic Fuel Oil/lauroil peroxide 100/5 weight %Gasahol: Synthetic Fuel Oil/methanol 100/20 volume %
Tensile Strength at Yield 110 110 120
Tensile Strength at Break 95 90 105
Appearance No change No change No change
TP-8054 Film Exposure
Property Retention, % at 180°CGear Oil
500 hr 1000 hr 2000 hr
Gear Oil: Showa white pilot S-3 (10W-30)

�0
For example, polymers whose molecular structures tend to have high cross-linking ratios such as polyethylene are called cross-linking type polymers because their heat resistance, weatherability, and stress crack resistance are remarkably improved by radiation. However, more often the generation of a double bond, rearrangement of cis-transformation, or breakage of the main molecular chain by oxidation takes place and various properties decline.
DuPont™ Vespel® TP-8000 Series are cross-linking type polymers which have substantially superior radiation resistance than currently available thermoset or pseudo-thermoplastic polyimides or polyketones.
Figures 11–14 illustrate the radiation resistance of Vespel® TP-8054 to b-ray (Electron Beam) radiation, gamma ray (60Co) radiation, and Neutron irradiation from atomic reactor. All data was measured by the Takasaki Radiation Chemistry Research Establishment of Japan’s Atomic Research Institute.
Figure 11. Tensile Strength Retention after Electron Beam Exposure
Outgassing PerformanceCertain TP-8000 grades offer low outgassing in vacuum environments, making them suitable candidates for clean applications such as semiconductor fabrication and support components. Figure 15 shows outgassing results per the ASTM E-595 test protocol.
0
20
40
60
80
100
120
0 2000 4000 6000 8000 10000 12000 14000
TP-8054 PI - 1 PI - 2 PEI
Tens
ile S
tren
gth
Rete
ntio
n, %
Mrads
Figure 12. Elongation Retention after Electron Beam Exposure
0
20
40
60
80
100
120
0 2000 4000 6000 8000 10000 12000 14000
Tens
ile E
long
atio
n Re
tent
ion,
%
TP-8054 PI - 1 PI - 2 PEI
Mrads
Figure 13. Tensile Elongation Retention after Gamma Irradiation Exposure (Cobalt 60)
0
20
40
60
80
100
120
0 2000 4000 6000 8000 10000 12000
PEEK
Rete
ntio
n, %
TP-8054 PI - 1 PI - 2 PEI
Mrads
Figure 14. Tensile Property Retention after Neutron Irradiation Exposure
0
20
40
60
80
100
120
0 5 10 15 20 25 30
Tensile StrengthTensile Elongation
Rete
ntio
n, %
Mrads
Figure 15. Outgassing Performance Data (ASTM E-595)
Grade TML, % CVCM, % WVR, %
TP-8054 0.587 0.004 0.309 TP-8212 0.410 0.008 0.217
TML : Total Mass Loss CVCM: Collected Volatile Condensable Materials
WVR: Water Vapor Regained
Conditions: Vacuum: 5 x 10⁻⁵ torr Heating Element Temperature: 125±1°C Cooling Element Temperature: 125±1°C Duration: 24 hr

��
INJECTION MOLDINGThe Process and EquipmentBecause most TP-8000 Series components are suitable for fabrication by injection molding, it is important for the designer to understand the molding process, its capabilities and its limitations.
The basic process is very simple. The resin is dried then melted by shear heating and some conduction in the injection molding press. The melt is then injected into a mold under pressure and allowed to cool. Once adequate cooling is achieved, the mold is opened and the parts removed then the mold is closed and the cycle is repeated. Figure 16 is a schematic of the injection molding machine. Figure 17 is a schematic cross section of the plastifying cylinder and mold.
The Molding Machine Melting the plastic and injecting it into the mold are the functions of the plastifying and injection system. The rate of injection and the pressure achieved in the mold are controlled by the machine hydraulic system. Injection pressures range from 35-241 MPa (5,000-35,000 psi). TP-8000 Series melt temperatures vary from a low of about 385°C (725°F) to a high of about 425°C (800°F). Operating at these temperatures can be potentially dangerous if proper safety precautions are not followed. DuPont has taken care to produce parts on appropriately equipped molding machines operated by experienced, dedicated professionals.
The MoldMold design is critical to the quality and economics of the injection molded part. Part appearance, strength, toughness, size, shape, and cost are all dependent on the quality of the mold. Key considerations are:
• Proper design for strength to withstand the high pressure involved.
• Correct materials of construction, especially when reinforced resins are used.
• Properly designed flow paths to convey the resin to the correct location in the part without excessive hold-up or temperature variation
• Proper venting of air ahead of the resin entering the mold.• Carefully designed heat transfer to control the cooling and
solidification of the moldings.• Easy and uniform ejection of the molded parts.
When designing the part, consideration should be given to the effect of gate location and thickness variations upon flow, shrinkage, warpage, cooling, venting, etc. as discussed in subsequent sections. The overall molding cycle can be as short as two seconds or as long as several minutes. The cycle time can be limited by the heat transfer capabilities of the mold, except when machine dry cycle or plastifying capabilities are limiting.
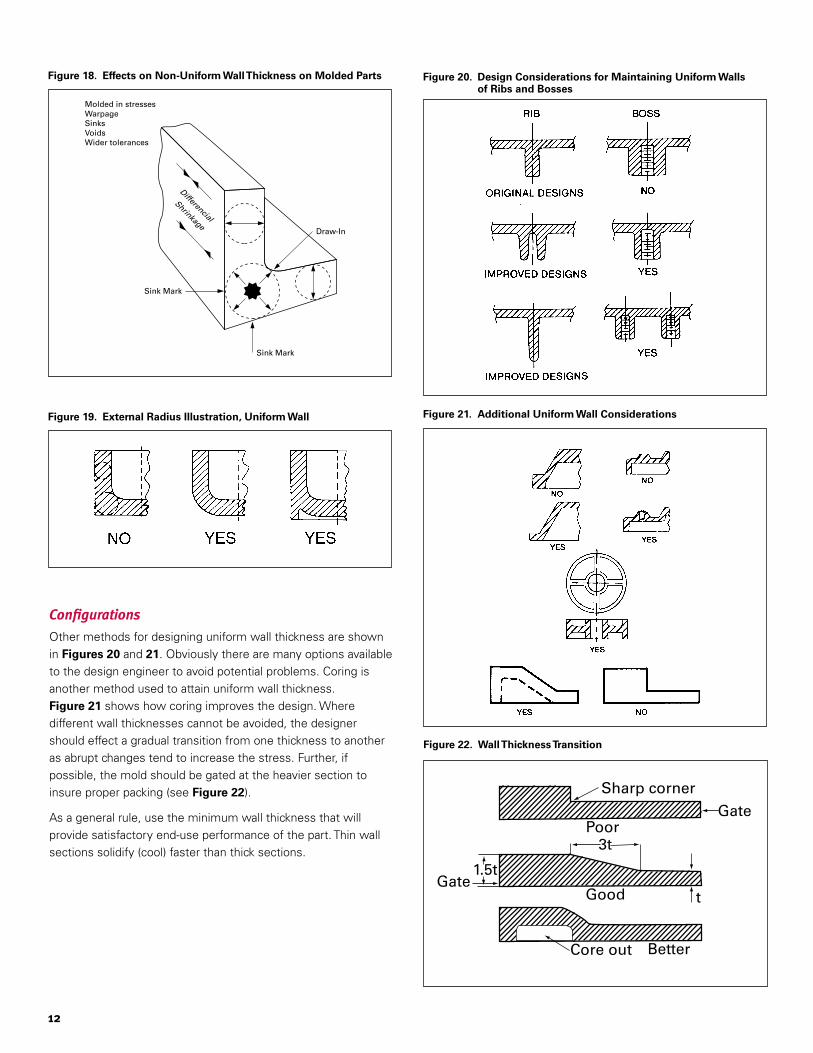
MOLDING CONSIDERATIONSUniform WallsUniform wall thickness in plastic part design is critical. Non-uniform wall thickness can cause warpage and dimensional control problems. If greater strength or stiffness is required, it is more economical to use ribs than increase wall thickness. In parts requiring good surface appearance, ribs should be avoided as sink marks on the opposite surface will surely appear. If ribbing is necessary on such a part, the sink mark is often hidden by some design detail on the surface of the part where the sink mark appears, such as an opposing rib, textured surface, etc. Even when uniform wall thickness is intended, attention to detail must be exercised to avoid inadvertent heavy sections, which can not only cause sink marks, but also voids and non-uniform shrinkage. For example, a simple structural angle (Figure 18) with a sharp outside corner and a properly filleted inside corner could present problems due to the increased wall thickness at the corner. To achieve uniform wall thickness use an external radius as shown in Figure 19.
Figure 16. Injection Molding Machine
Feed Hopper
Mold MeltingCylinder
Figure 17. Plastifying Cylinder
MachinePlaten
MachinePlaten
PlastifyingCylinder
Mold
FeedHopper
��
ConfigurationsOther methods for designing uniform wall thickness are shown in Figures 20 and 21. Obviously there are many options available to the design engineer to avoid potential problems. Coring is another method used to attain uniform wall thickness. Figure 21 shows how coring improves the design. Where different wall thicknesses cannot be avoided, the designer should effect a gradual transition from one thickness to another as abrupt changes tend to increase the stress. Further, if possible, the mold should be gated at the heavier section to insure proper packing (see Figure 22).
As a general rule, use the minimum wall thickness that will provide satisfactory end-use performance of the part. Thin wall sections solidify (cool) faster than thick sections.
Figure 18. Effects on Non-Uniform Wall Thickness on Molded Parts
Sink Mark
Differencial
Shrinkage
Sink Mark
Draw-In
Molded in stressesWarpageSinksVoidsWider tolerances
Figure 19. External Radius Illustration, Uniform Wall
Figure 20. Design Considerations for Maintaining Uniform Walls of Ribs and Bosses
Figure 21. Additional Uniform Wall Considerations
Figure 22. Wall Thickness Transition
1.5t
Poor
Good
Core out Better
Sharp cornerGate
Gate
3t
t

��
Draft and Ejector PinsDraft is essential to the ejection of the parts from the mold. Where minimum draft is desired, good draw polishing will aid ejection of the parts from the mold. Use the following table as a general guide.
Shallow Draw(less than 1” deep)
Deep Draw(greater than 1” deep)
Unfilled 0–0.25° 0.25–0.50°
Filled 0.25–0.50° 0.50–1.00°
Table 11 Min. Draft Angle Allowances
It is important for the designer to be aware of this need inherent to injection molded parts since the draft angle allowance can impact the tolerance capability of certain dimensional features. Your DuPont™ Vespel® Technical Service Representative will assist you in understanding the particular draft needs for a given part.
When knockout pins are used in removing parts from the mold, pin placement is important to prevent part distortion during ejection. Also an adequate pin surface area is needed to prevent puncturing, distorting or marking the parts. In some cases stripper plates or rings are necessary to supplement or replace pins.
Fillets and RadiiSharp internal corners and notches are perhaps the leading cause of failure of plastic parts. This is due to the abrupt rise in stress at sharp corners and is a function of the specific geometry of the part and the sharpness of the corner or notch. The majority of plastics are notch sensitive and the increased stress at the notch, called the “Notch Effect,” results in crack initiation. To assure that a specific part design is within safe stress limits, stress concentration factors can be computed for all corner areas. Formulas for specific shapes can be found in reference books on stress analysis. An example illustrating the stress concentration factor at the corner of a cantilevered beam is shown in Figure 23.
It is from this plot that the general rule for fillet size is obtained: i.e., fillet radius should equal one-half the wall thickness of the part. As can be seen in the plot, very little further reduction in stress concentration is obtained by using a larger radius. From a molding standpoint, smooth radii, rather than sharp corners, provide streamlined mold flow paths and result in easier ejection of parts. The radii also give added life to the mold by reducing erosion of the metal. The minimum recommended radius for corners is .5 mm (0.02 in) and is usually permissible even where a sharp edge is required (see Figure 24).
Figure 23. Stress Concentration Factors for a Cantilevered Structure
R/T
Str
ess-
Co
nce
ntr
atio
n F
acto
r
0.2 0.4 0.6 0.8 1.0 1.2 1.40
1.5
2.0
2.5
3.0
1.0
Usual
T
P
P = Applied LoadR = Fillet RadiusT = Thickness
R
BossesBosses are used for mounting purposes or to serve as reinforcement around holes. Good and poor designs are shown in Figure 25. As a rule, the outside diameter of a boss should be 2 to 2.5 times the hole diameter to ensure adequate strength. The same principles used in designing ribs pertain to designing bosses, that is, heavy sections should be avoided to prevent the formation of voids or sink marks, excessive warpage, and cycle time penalty. Boss design recommendations are shown in Figure 26.
RibbingReinforcing ribs are an efficient and effective way to improve the rigidity and strength of molded parts. Proper use can save material and weight, shorten molding cycles and eliminate heavy cross section areas which could cause molding problems. Where sink marks opposite ribs are objectionable, they can be hidden by use of a textured surface or some other suitable interruption in the area of the sink. Ribs should be used only when the designer believes the added structure is essential to the structural performance of the part. The word “essential”
Figure 24. Use of External or Internal Radii
Radii on Exteriorof Corner
Radii on Interiorof Corner

��
Good
Poor
Good
GoodPoor
Poor
Good
Poor
must be emphasized, as too often ribs are added as an extra factor of safety, only to find that they produce warpage and stress concentration. It is better to leave any questionable ribs off the drawing. They can easily be added if prototype tests so indicate.
Holes and CoringHoles are easily produced in molded parts by core pins which protrude into the mold cavity. Through holes are easier to mold than blind holes, because the core pin can be supported at both ends. Blind holes formed by cantilevered pins can be shifted
Figure 25. Boss Design
Figure 26. Additional Boss Design Details
off-center due to deflection of the pin by the flow of molten plastic into the cavity. The depth of a blind hole is generally limited to twice the diameter of the core pin. Design recommendations for cored holes are shown in Figure 27. To obtain greater hole depth, a stepped core pin may be used or a side wall may be counterbored to reduce the length of an unsupported core pin (see Figure 28).
Holes with an axis which runs perpendicular to the mold-opening direction require retractable core pins or split tools. In some designs this can be avoided by placing holes in walls perpendicular to the parting line, using steps or extreme taper in the wall (see Figure 29). Core pins should be polished and draft added to improve ejection. Where knit lines caused by flow of melt around core pins is objectionable from strength or appearance standpoint, holes may be spotted or partially cored to facilitate subsequent drilling as shown in Figure 30.
Figure 27. Cored Holes
Figure 28. Counterboring Holes

��
Figure 29. Additional Cored Hole Details
Figure 30. Drilled Holes
The guide below, referring to Figure 31, will aid in eliminating part cracking or tear out of the plastic parts. The minimum distance between holes, from a hole and a bend in the wall, and from the edge of the part should be equivalent to the diameter of the hole.
Figure 31. Hole Design
For a blind hold, thickness of the bottom should be no less than 1⁄6 the hole diameter in order to eliminate bulging (see Figure 32 A). Figure 32 B shows a better design in which the wall thickness is uniform throughout and there are no sharp corners where stress concentrations could develop.
Figure 32. Blind Holes
ThreadsWhen required, external and internal threads can be automatically molded into the part, eliminating the need for mechanical thread-forming operations.
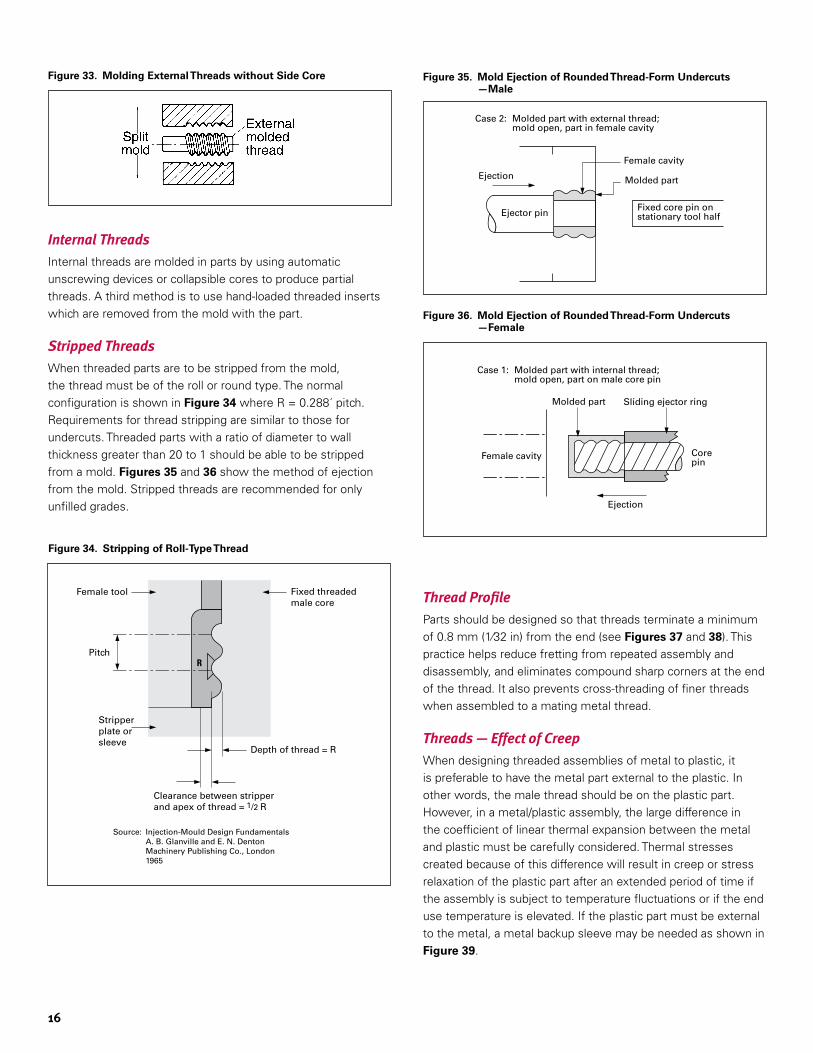
External ThreadsParts with external threads can be molded in two ways. The least expensive way is to locate the parting line on the centerline of the thread, Figure 33. If this is not acceptable, or the axis of the thread is in the direction of mold-opening, the alternative is to equip the mold with an external, thread-unscrewing device.
��
Figure 33. Molding External Threads without Side Core
Internal ThreadsInternal threads are molded in parts by using automatic unscrewing devices or collapsible cores to produce partial threads. A third method is to use hand-loaded threaded inserts which are removed from the mold with the part.
Stripped ThreadsWhen threaded parts are to be stripped from the mold, the thread must be of the roll or round type. The normal configuration is shown in Figure 34 where R = 0.288´ pitch. Requirements for thread stripping are similar to those for undercuts. Threaded parts with a ratio of diameter to wall thickness greater than 20 to 1 should be able to be stripped from a mold. Figures 35 and 36 show the method of ejection from the mold. Stripped threads are recommended for only unfilled grades.
Figure 34. Stripping of Roll-Type Thread
Stripperplate or sleeve
Female tool
PitchR
Fixed threadedmale core
Depth of thread = R
Clearance between stripperand apex of thread = 1/2 R
Source: Injection-Mould Design Fundamentals A. B. Glanville and E. N. Denton Machinery Publishing Co., London 1965
Figure 35. Mold Ejection of Rounded Thread-Form Undercuts —Male
Ejector pin
Ejection
Female cavity
Molded part
Fixed core pin onstationary tool half
Case 2: Molded part with external thread; mold open, part in female cavity
Figure 36. Mold Ejection of Rounded Thread-Form Undercuts —Female
Sliding ejector ring
Ejection
Female cavity
Molded part
Corepin
Case 1: Molded part with internal thread; mold open, part on male core pin
Thread ProfileParts should be designed so that threads terminate a minimum of 0.8 mm (1⁄32 in) from the end (see Figures 37 and 38). This practice helps reduce fretting from repeated assembly and disassembly, and eliminates compound sharp corners at the end of the thread. It also prevents cross-threading of finer threads when assembled to a mating metal thread.
Threads — Effect of CreepWhen designing threaded assemblies of metal to plastic, it is preferable to have the metal part external to the plastic. In other words, the male thread should be on the plastic part. However, in a metal/plastic assembly, the large difference in the coefficient of linear thermal expansion between the metal and plastic must be carefully considered. Thermal stresses created because of this difference will result in creep or stress relaxation of the plastic part after an extended period of time if the assembly is subject to temperature fluctuations or if the end use temperature is elevated. If the plastic part must be external to the metal, a metal backup sleeve may be needed as shown in Figure 39.

��
UndercutsUndercuts are formed by using split cavity molds or collapsible cores. Internal undercuts can be molded by using two separate core pins, as shown in Figure 40 B. This is a very practical method, but flash must be controlled where the two core pins meet. Figure 40 A shows another method using access to the undercut through an adjoining wall. Offset pins may be used for internal side wall undercuts or holes (see Figure 40 C). The above methods eliminate the need for stripping and the concomitant limitation on the depth of the undercut.
Figure 37. Correct Termination of Threads
GOOD POOR0.8 mm (1/32”)
Figure 38. Suggested End Clearance on Threads
0.8 mm (1/32”)
0.8 mm (1/32”)
0.8 mm (1/32”)
0.8 mm (1/32”)
Molded-in InsertsAdding ribs, bosses or molded-in inserts to various part designs can solve some problems but may create others. Ribs may provide the desired stiffness, but they can produce warpage. Bosses may serve as a suitable fastening device for a self-tapping screw, but they can cause sink marks on the surface opposite the boss. Molded-in inserts may enable the part to be assembled and disassembled many times without loss of threads. Considering these possible problems, the appropriate question is, when should molded-in inserts be used? The answer is the same for ribs and bosses as well. Inserts should be used when there is a functional need for them and when the additional cost is justified by improved product performance. There are four principal reasons for using metal inserts:
• To provide threads that will be serviceable under continuous stress or to permit frequent part disassembly (generally, more than 5 times).
• To meet close tolerances on female threads.
• To afford a permanent means of attaching two highly loaded bearing parts, such as a gear to a shaft.
• To provide electrical conductance.
Figure 39. Suggestions for Designing Threaded Assemblies of Metal to Plastic
Figure 40. Undercuts
Molded partejected
Ejector pinmovement
Core pinsseparatehere
Undercut
Cavity
Molded part
Offset ejector pin
Knockout plate
Cavity
Ejectorwedge
Plasticpart
Plasticpart
Punch
A
B
C
��
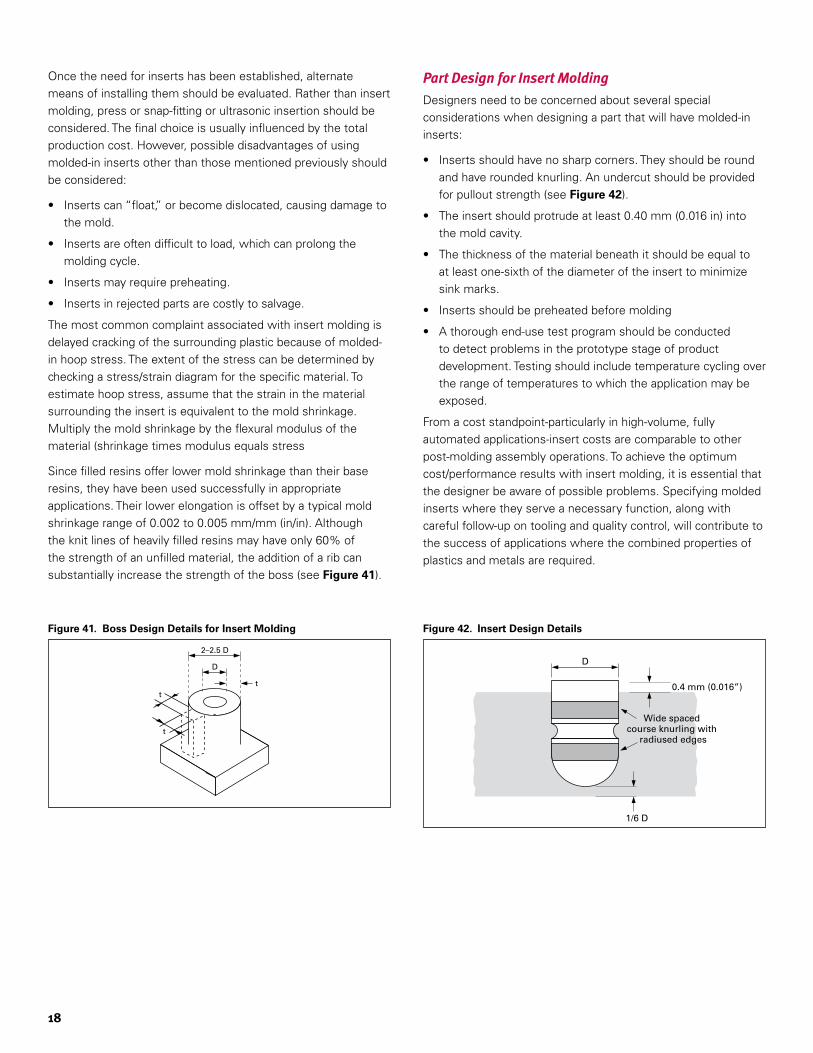
Once the need for inserts has been established, alternate means of installing them should be evaluated. Rather than insert molding, press or snap-fitting or ultrasonic insertion should be considered. The final choice is usually influenced by the total production cost. However, possible disadvantages of using molded-in inserts other than those mentioned previously should be considered:
• Inserts can “float,” or become dislocated, causing damage to the mold.
• Inserts are often difficult to load, which can prolong the molding cycle.
• Inserts may require preheating.
• Inserts in rejected parts are costly to salvage.
The most common complaint associated with insert molding is delayed cracking of the surrounding plastic because of molded-in hoop stress. The extent of the stress can be determined by checking a stress/strain diagram for the specific material. To estimate hoop stress, assume that the strain in the material surrounding the insert is equivalent to the mold shrinkage. Multiply the mold shrinkage by the flexural modulus of the material (shrinkage times modulus equals stress
Since filled resins offer lower mold shrinkage than their base resins, they have been used successfully in appropriate applications. Their lower elongation is offset by a typical mold shrinkage range of 0.002 to 0.005 mm/mm (in/in). Although the knit lines of heavily filled resins may have only 60% of the strength of an unfilled material, the addition of a rib can substantially increase the strength of the boss (see Figure 41).
Part Design for Insert MoldingDesigners need to be concerned about several special considerations when designing a part that will have molded-in inserts:
• Inserts should have no sharp corners. They should be round and have rounded knurling. An undercut should be provided for pullout strength (see Figure 42).
• The insert should protrude at least 0.40 mm (0.016 in) into the mold cavity.
• The thickness of the material beneath it should be equal to at least one-sixth of the diameter of the insert to minimize sink marks.
• Inserts should be preheated before molding
• A thorough end-use test program should be conducted to detect problems in the prototype stage of product development. Testing should include temperature cycling over the range of temperatures to which the application may be exposed.
From a cost standpoint-particularly in high-volume, fully automated applications-insert costs are comparable to other post-molding assembly operations. To achieve the optimum cost/performance results with insert molding, it is essential that the designer be aware of possible problems. Specifying molded inserts where they serve a necessary function, along with careful follow-up on tooling and quality control, will contribute to the success of applications where the combined properties of plastics and metals are required.
Figure 41. Boss Design Details for Insert Molding
2–2.5 D
D
tt
t
Figure 42. Insert Design Details
D
1/6 D
0.4 mm (0.016”) min
Wide spaced course knurling with
radiused edges

��
AppendixAppendix A Appendix B —Stress/Strain Curves as a
Function of Temperature in Tension and Compressions
Figure B-1 TP-8054 Stress/Strain in Tension (ISO 527)
Figure B-2 TP-8395 Stress/Strain in Tension (ISO 527)
Figure B-3 TP-8212 Stress/Strain in Tension (ISO 527)
120
100
80
60
40
20
00 5 10 15 20
Str
ess,
MPa
TP-8054
–40°C23°C
100°C150°C
(–40°F)(73°F)(212°F)(305°F)
Strain, %
180160
806040200
0 2 4 5
Str
ess,
MPa
TP-8212
–40°C23°C
100°C150°C
(–40°F)(73°F)(212°F)(305°F)140
120100
Strain, %1 3
120
100
80
60
40
20
00 5 10 15 20
Str
ess,
MPa
TP-8395
–40°C23°C
100°C150°C
(–40°F)(73°F)(212°F)(305°F)
Strain, %
Design Check List
Part Name ____________________________________________________
Company _____________________________________________________
Print No. ______________________________________________________
Job No. _______________________________________________________
A. PART FUNCTION ____________________________________________
B. OPERATING FUNCTIONS Normal Max. Min.
Operating temperature _________ _________ _________
Service life (hrs) _________ _________ _________
Applied load (lb torque, etc. describe fully on reverse side) Time on _________ _________ _________
Duration of load Time off _________ _________ _________
Other (Impact, Shock, Stall, etc.) _______________________________
____________________________________________________________
____________________________________________________________
C. ENVIRONMENT Chemical __________ Moisture ______________
Ambient temperature while device not operating ____ Sunlight direct ______Indirect _____
D. DESIGN REQUIREMENTS
Factor of safety ________________Max. Deflection/Sag ___________
E. WEAR CONSIDERATIONS
Mating Material ______________ Surface Finish _________________
Pressure ___________________________________________________
Velocity ____________________________________________________
Rotation or Oscillation ________________________________________
Limiting Wear Rate or Wear Volume ____________________________

�0
Figure B-4 TP-8130 Stress/Strain in Tension (ISO 527)
Figure B-5 TP-8311 Stress/Strain in Tension (ISO 527)
Figure B-6 TP-8549 Stress/Strain in Tension (ISO 527)
Figure B-7 TP-8792 Stress/Strain in Tension (ISO 527)
Figure B-8 TP-8054 Stress/Strain in Compression (ISO 604)
Figure B-9 TP-8395 Stress/Strain in Compression (ISO 604)
300
250
200
150
100
50
0
0 0.5 1.0 1.5
Str
ess,
MPa
TP-8130
–40°C23°C
100°C150°C
(–40°F)(73°F)(212°F)(305°F)
Strain, %
0 0.5 1.0 1.5
TP-8311
–40°C23°C
100°C150°C
(–40°F)(73°F)(212°F)(305°F)
Strain, %
300
250
200
150
100
50
0
Str
ess,
MPa
2.0 2.5
300
250
200
150
100
50
0
0 0.5 1.0 1.5
Str
ess,
MPa
TP-8549
–40°C23°C
100°C150°C
(–40°F)(73°F)(212°F)(305°F)
Strain, %
300
250
200
150
100
50
0
0 0.5 1.0 1.5
Str
ess,
MPa
TP-8792
–40°C23°C
100°C150°C
(–40°F)(73°F)(212°F)(305°F)
Strain, %
30025020015010050
00 10 30 40
Str
ess,
MPa
TP-8054
23°C150°C
(73°F)(305°F)
Strain, %
350
20 50 60
30025020015010050
00 10 30 40
Str
ess,
MPa
TP-8395
23°C150°C
(73°F)(305°F)
Strain, %
350
20 50 60
��
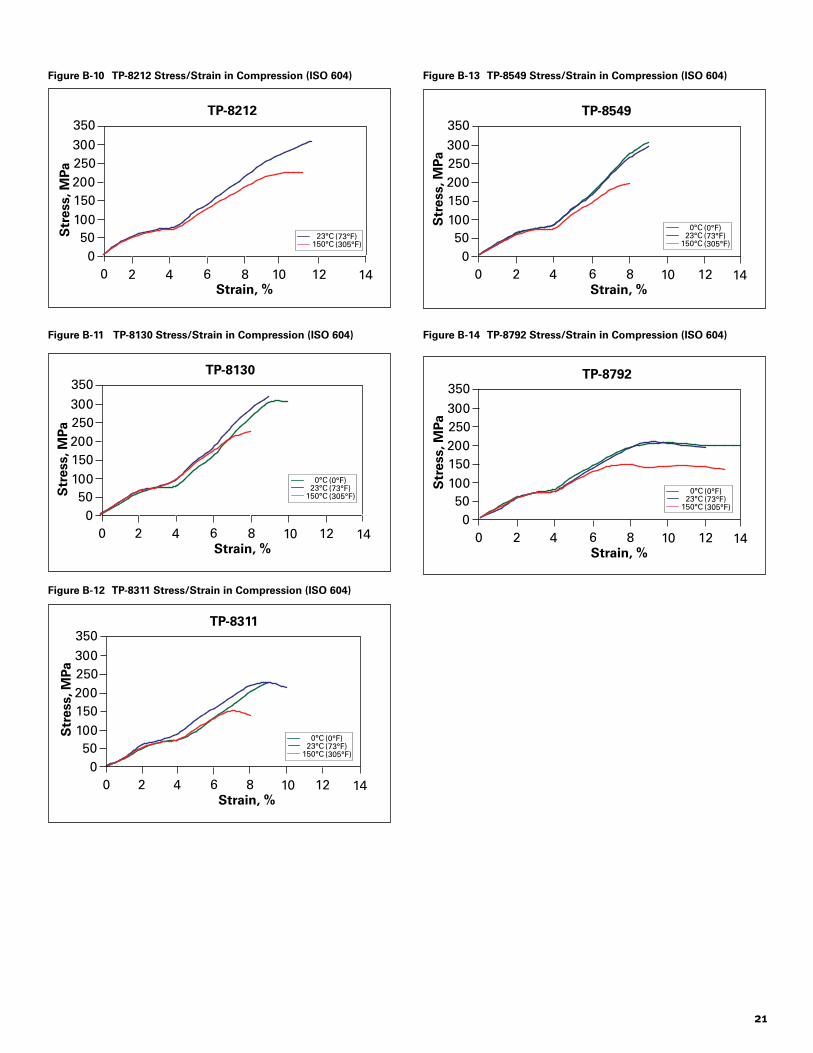
Figure B-10 TP-8212 Stress/Strain in Compression (ISO 604)
Figure B-11 TP-8130 Stress/Strain in Compression (ISO 604)
Figure B-12 TP-8311 Stress/Strain in Compression (ISO 604)
Figure B-13 TP-8549 Stress/Strain in Compression (ISO 604)
Figure B-14 TP-8792 Stress/Strain in Compression (ISO 604)
30025020015010050
00 10
Str
ess,
MPa
TP-8212
23°C150°C
(73°F)(305°F)
Strain, %
350
142 4 6 8 12
30025020015010050
00 2 4 6 8 10 12
Str
ess,
MPa
TP-8130
Strain, %
350
14
0°C23°C
150°C
(0°F)(73°F)(305°F)
30025020015010050
00 2 4 6 8 10 12
Str
ess,
MPa
TP-8311
Strain, %
350
14
0°C23°C
150°C
(0°F)(73°F)(305°F)
30025020015010050
00 2 4 6 8 10 12
Str
ess,
MPa
TP-8549
Strain, %
350
14
0°C23°C
150°C
(0°F)(73°F)(305°F)
30025020015010050
00 2 4 6 8 10 12
Str
ess,
MPa
TP-8792
Strain, %
350
14
0°C23°C
150°C
(0°F)(73°F)(305°F)

��
Appendix C — Flexural Creep
Figure C-1 TP-8054 Flexural Creep (ASTM D2990)
Figure C-2 TP-8395 Flexural Creep (ASTM D2990)
Figure C-3 TP-8212 Flexural Creep (ASTM D2990)
Figure C-4 TP-8130 Flexural Creep (ASTM D2990)
Figure C-5 TP-8311 Flexural Creep (ASTM D2990)
Figure C-6 TP-8549 Flexural Creep (ASTM D2990)
Figure C-7 TP-8792 Flexural Creep (ASTM D2990)
2.5
2.0
1.5
1.0
0.5
0
0.01 0.1 1 10 100 1000 10000
Str
ain
, %
Time, hr
3.023°C/48 MPa60°C/48 MPa60°C/34 MPa
2.5
2.0
1.5
1.0
0.5
0
0.01 0.1 1 10 100 1000 10000
Str
ain
, %
Time, hr
3.023°C/48 MPa60°C/48 MPa60°C/34 MPa
1.00.9
0.50.40.30.20.1
Str
ain
, %
0.80.70.6
23°C/48 MPa60°C/34 MPa60°C/48 MPa
0.01 0.1 1 10 100 1000 10000Time, hr
0
1.00.9
0.50.40.30.20.1
Str
ain
, %
0.80.70.6
23°C/48 MPa60°C/34 MPa
0.01 0.1 1 10 100 1000 10000Time, hr
0
1.00.9
0.50.40.30.20.1
Str
ain
, %
0.80.70.6
23°C/48 MPa
0.01 0.1 1 10 100 1000 10000Time, hr
0
1.00.9
0.50.40.30.20.1
Str
ain
, %
0.80.70.6
23°C/48 MPa
0.01 0.1 1 10 100 1000 10000Time, hr
0
1.00.9
0.50.40.30.20.1
Str
ain
, %
0.80.70.6
23°C/48 MPa60°C/34 MPa
0.01 0.1 1 10 100 1000 10000Time, hr
0

��
Appendix D — Chemical Resistance Data
Tensile Strength at Yield 115 120 110 115
Tensile Strength at Break 110 105 100 105
Appearance No change No change No change No change
TP-8054 Film Exposure
Property Retention, % at 80°C in H2SO4 Solution pH = 2 pH = 3 1000 hr 2000 hr 1000 hr 2000 hr
Tensile Strength at Yield 115 115 115 120
Tensile Strength at Break 100 95 95 100
Appearance No change No change No change No change
TP-8054 Film Exposure
Property Retention, % at 80°C in HNO3/H2SO4 Solution pH = 2 pH = 3 1000 hr 2000 hr 1000 hr 2000 hr
Tensile Strength at Yield 115 115 115 120
Tensile Strength at Break 100 95 95 100
Appearance No change No change No change No change
TP-8054 Film Exposure
Property Retention, % at 80°C in HNO3/H2SO4 Solution pH = 2 pH = 3 1000 hr 2000 hr 1000 hr 2000 hr
Tensile Strength at Yield 110 115 100 —
Tensile Strength at Break 100 105 90 60
Appearance No change No change No change No change
TP-8054 Film Exposure
Property Retention, % at 23°C 5% NaCl 5% NaOH 1000 hr 2000 hr 1000 hr 2000 hr
Tensile Strength at Yield 110 110 110 110
Tensile Strength at Break 110 110 105 110
Tensile Modulus 100 105 105 110
Elongation at Break 105 100 110 105
Appearance No change No change No change No change
TP-8054 Film Exposure
Property Retention, % at 23°C Methanol Ethanol 1000 hr 2000 hr 1000 hr 2000 hr
Tensile Strength at Yield 100 105 — —
Tensile Strength at Break 105 100 100 100
Tensile Modulus 105 100 100 100
Elongation at Break 100 105 100 105
Appearance No change No change No change No change
TP-8054 Film Exposure
Property Retention, % at 40°C in 500 ppb Ozone Amorphous Crystalline 1000 hr 2000 hr 1000 hr 2000 hr
Tensile Strength at Yield 96 88
Tensile Strength at Break 100 103
Tensile Modulus 96 65
Elongation at Break +0.0 –1.0
Appearance No change No change
TP-8054 Test Specimen Exposure
Property Retention, % 19% Nitric Acid 98% Phosphoric Acid 3 weeks 23–60°C 3 weeks 23–214°C
Acid Exposure
Tensile Strength at Yield 110
Tensile Strength at Break 100
Tensile Modulus 100
Elongation at Break 60
Weight Change +0.2
Appearance No change
TP-8054 Test Specimen Exposure
Property Retention, % Oil/Refrigerant = 10/1 wgt
Oil: Kyoseki FLEOL F-32Refrigerant: R-134 A (CH2FCF3)
100 hr at 60°C
Refrigerant Exposure
Also considered to have excellent resistance to other refrigerants including 11, R-113 and R-22

Copyright © 2007 DuPont. The DuPont Oval Logo, DuPont™, The miracles of science™, Teflon®, and Vespel® are registered trademarks or trademarks of E. I. du Pont de Nemours and Company or its affiliates. All rights reserved.
K-16393 (1/07) Printed in the U.S.A.
The information set forth herein is furnished free of charge and is based on technical data that DuPont believes to be reliable. It is intended for use by persons having technical skill, at their own discretion and risk. This information corresponds to our current knowledge on the subject. It is offered solely to provide possible suggestions for your own experimentation. It is not intended, however, to substitute for any testing you may need to conduct to determine for yourself the suitability of our products for your particular purposes. The data listed herein falls within the normal range of product properties but they should not be used to establish specification limits or used alone as the basis of design. This information may be subject to revision as new knowledge and experience becomes available. Since we cannot anticipate all variations in actual end-use conditions, DuPont makes no warranties and assumes no liability in connection with any use of this information. Nothing in this publication is to be considered as a license to operate under or a recommendation to infringe any patent right.
Caution: Do not use in medical applications involving permanent implantation in the human body. For other medical applications, see “DuPont Medical Caution Statement,” H-50102.
Phone: �00-���-VESP (����)
Fax: �0�-���-����
E-mail: [email protected]
Web: vespel.dupont.com