Dummy variables
21
Applied Econometrics Applied Econometrics Second edition Dimitrios Asteriou and Stephen G. Hall
-
Upload
irfan-hussain -
Category
Education
-
view
46 -
download
2
Transcript of Dummy variables

Applied Econometrics
Applied EconometricsSecond edition
Dimitrios Asteriou and Stephen G. Hall
Applied Econometrics
DUMMY VARIABLES
1. The Nature of Qualitative Information2. The Use of Dummy Variables3. Special Cases of Dummy Variables4. Dummy Variables with Multiple Categories5. Tests for Structural Stability
Applied Econometrics
Learning Objectives1. Understand the various forms of possible misspecification in the
CLRM.
2. Appreciate the importance and learn the consequences of omitting influential variables in the CLRM.
3. Distinguish among the wide range of functional forms and understand the meaning and interpretation of their coefficients.
4. Understand the importance of measurement errors in the data.
5. Perform misspecification tests using econometric software.
6. Understand the meaning of nested and non-nested models.
7. Be familiar with the concept of data mining and choose an appropriate econometric model.
Applied Econometrics
The Nature of Qualitative InformationSometimes we can not obtain a set of numerical
values for all the variables we want to use in a model.
This is because some variables can not be quantified easily.
Examples:(a) Gender may play a role in determining salary levels
(b) Different ethnic groups may follow different consumption patterns
(c) Educational levels can affect earnings from employment
Applied Econometrics
It is easier to have dummies for cross-sectional variables, but sometimes we do have for time series as well.
Examples(a) Changes in a political regime may affect production
(b) A war can have an impact on economic activities
(c) Certain days in a week or certain months in a year can have different effects in the fluctuation of stock prices
(d) Seasonal effects are often observed in demand of various products
The Nature of Qualitative Information
Applied Econometrics
The Use of Dummy VariablesConsider the following cross-sectional model:
Yi=β1+β2X2i+ ui
The constant term in this equation measures the mean value of Yi when X2i is equal to zero.
This model assumes that the constant will be the same for all the observations in our data set.
But what if we have two different subgroups (male, female for example)?
Applied Econometrics
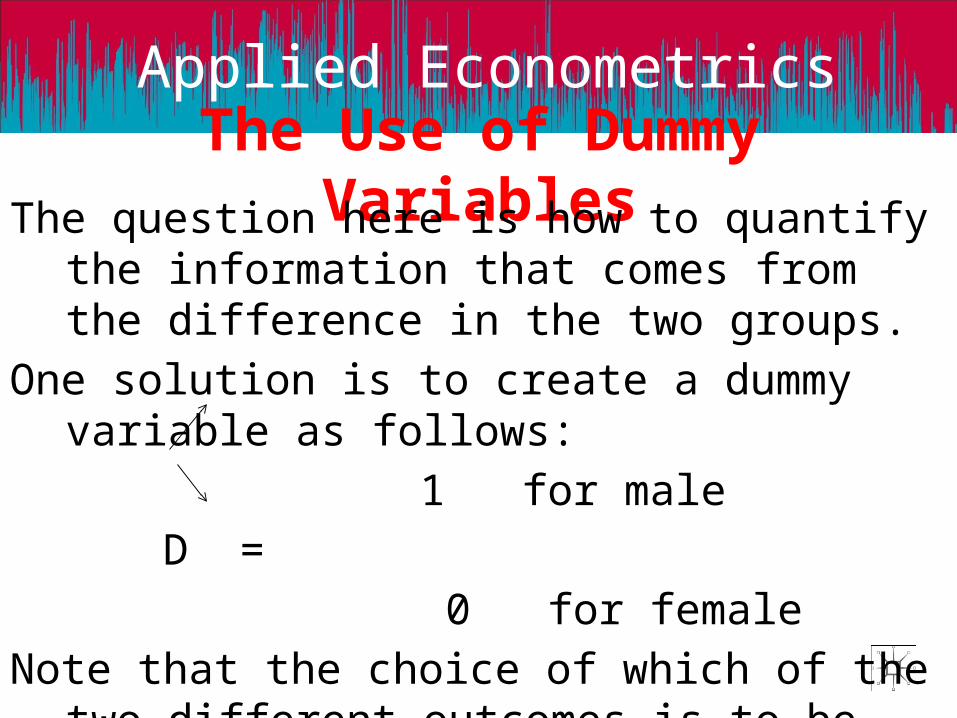
The Use of Dummy VariablesThe question here is how to quantify the information
that comes from the difference in the two groups.
One solution is to create a dummy variable as follows:
1 for male
D =
0 for female
Note that the choice of which of the two different outcomes is to be assigned the value of 1 does not alter the results.
Applied Econometrics
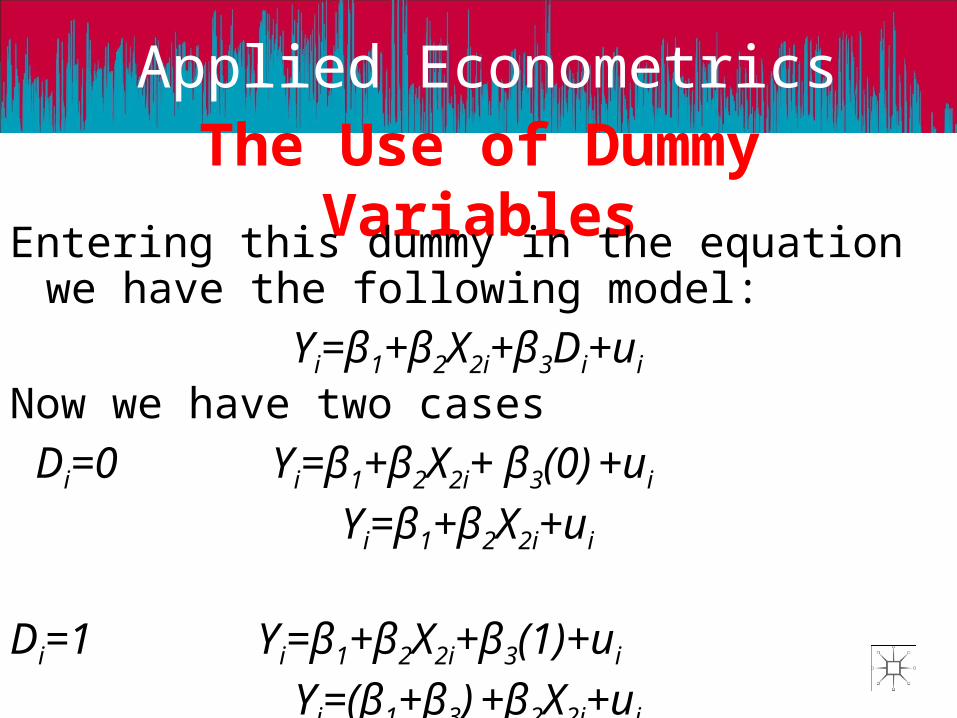
The Use of Dummy VariablesEntering this dummy in the equation we have the
following model:
Yi=β1+β2X2i+β3Di+ui
Now we have two cases
Di=0 Yi=β1+β2X2i+ β3(0) +ui
Yi=β1+β2X2i+ui
Di=1 Yi=β1+β2X2i+β3(1)+ui
Yi=(β1+β3) +β2X2i+ui

Applied Econometrics
Intercept Dummy Variable
Y
X2
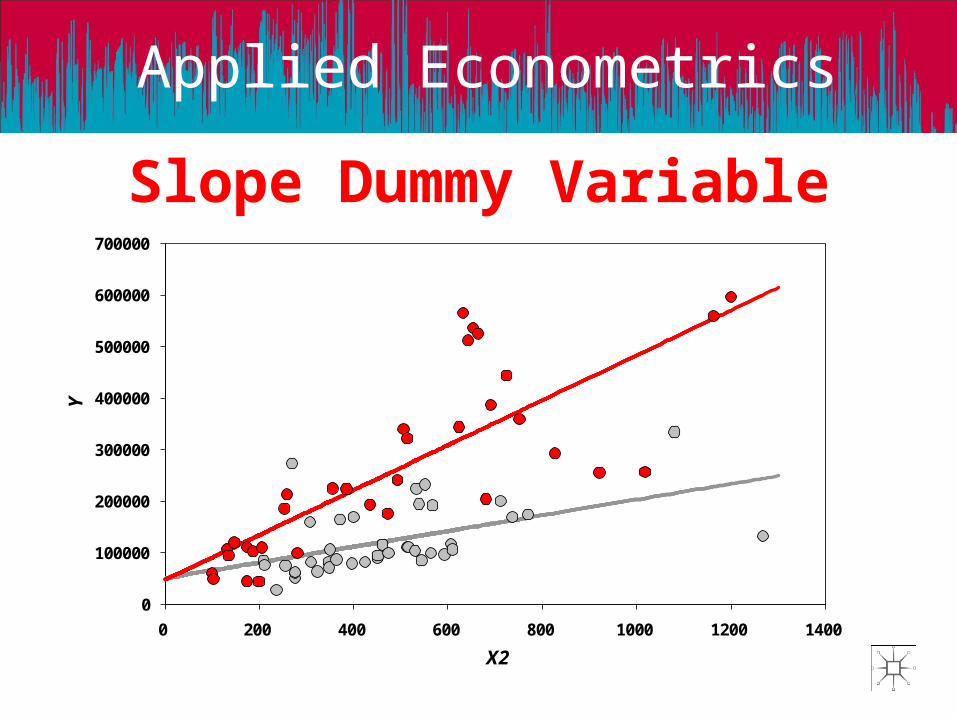
Red Points: Male
Grey Points: Female

Applied Econometrics
Intercept Dummy Variable
β1+β3
X2
Y
β1
Applied Econometrics
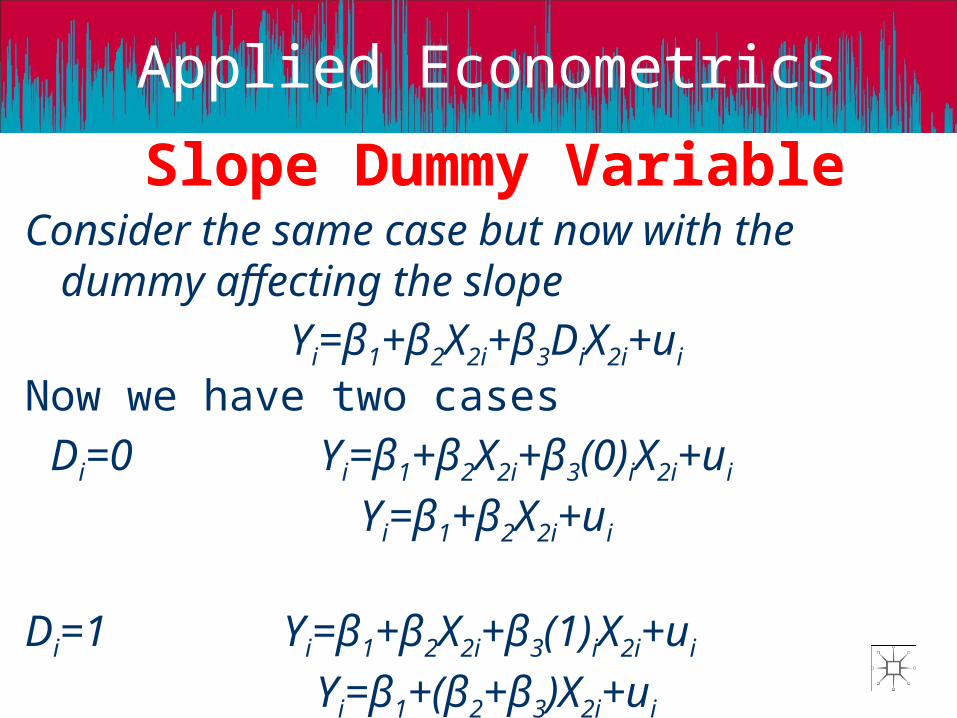
Slope Dummy VariableConsider the same case but now with the dummy
affecting the slopeYi=β1+β2X2i+β3DiX2i+ui
Now we have two cases
Di=0 Yi=β1+β2X2i+β3(0)iX2i+ui
Yi=β1+β2X2i+ui
Di=1 Yi=β1+β2X2i+β3(1)iX2i+ui
Yi=β1+(β2+β3)X2i+ui
Applied Econometrics
Slope Dummy Variable
0
100000
200000
300000
400000
500000
600000
700000
0 200 400 600 800 1000 1200 1400
Y
X2
Applied Econometrics
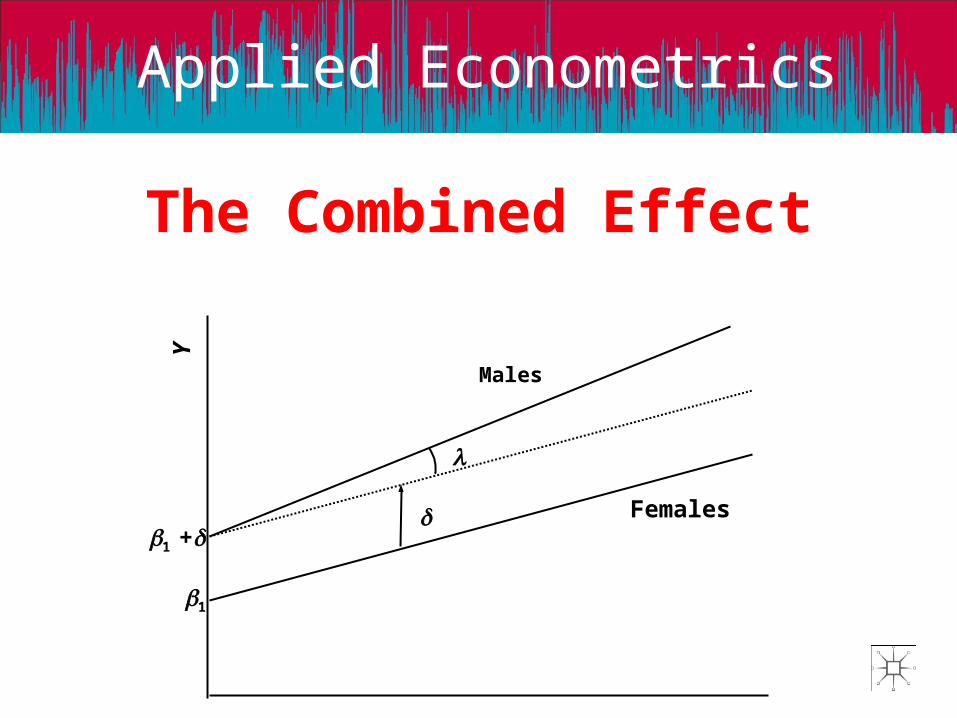
The Combined EffectY
b1 +d
b1
Males
Femalesd
l
Applied Econometrics
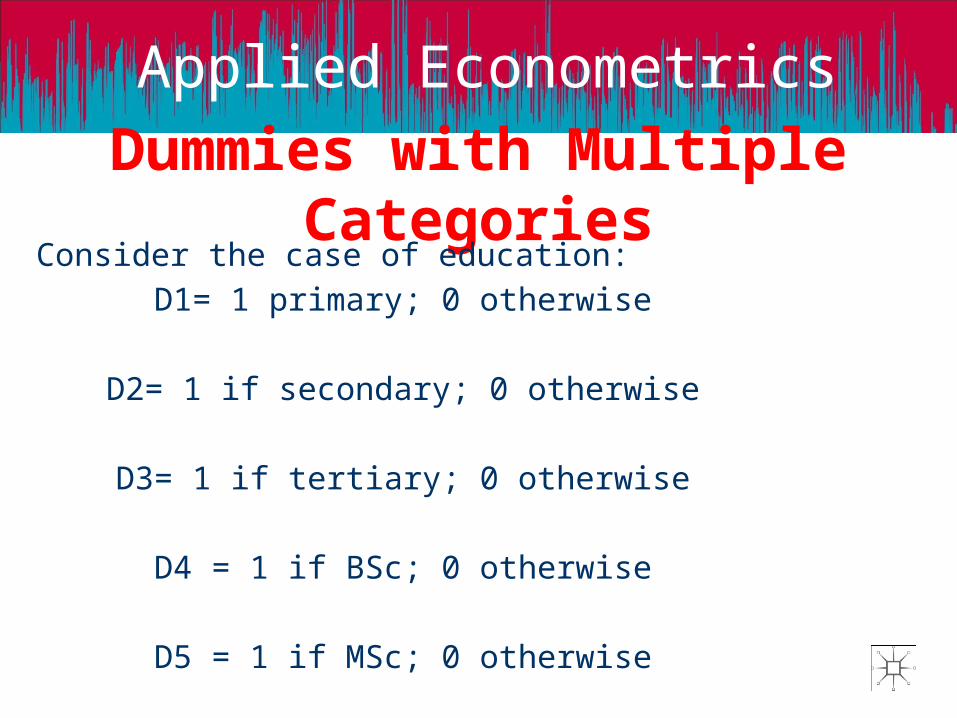
Dummies with Multiple CategoriesConsider the case of education:
D1= 1 primary; 0 otherwise
D2= 1 if secondary; 0 otherwise
D3= 1 if tertiary; 0 otherwise
D4 = 1 if BSc; 0 otherwise
D5 = 1 if MSc; 0 otherwise
Applied Econometrics
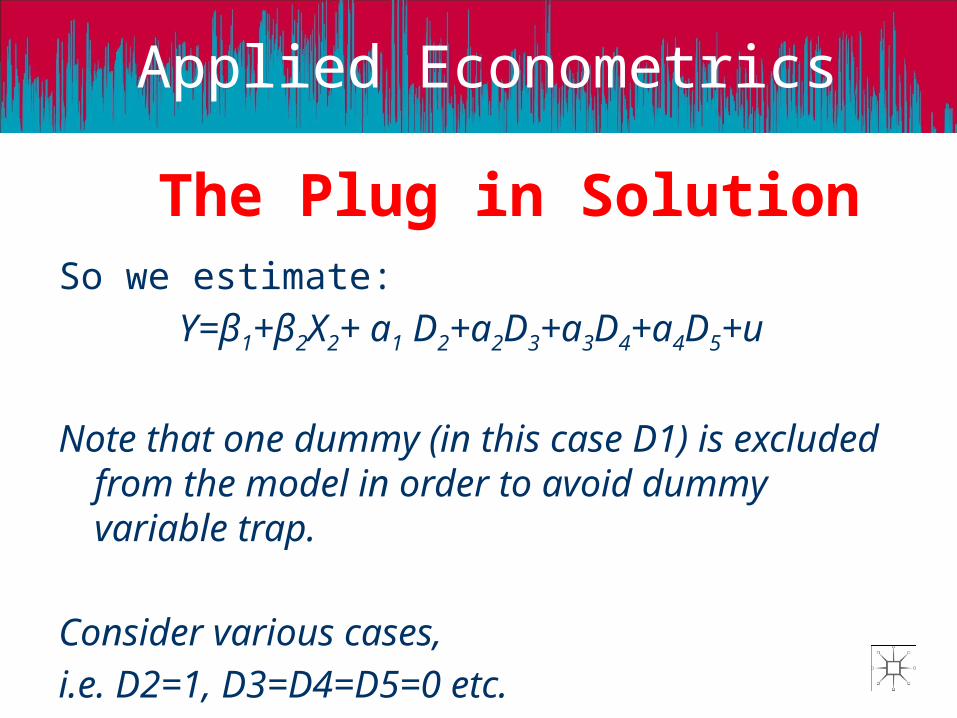
The Plug in SolutionSo we estimate:
Y=β1+β2X2+ a1 D2+a2D3+a3D4+a4D5+u
Note that one dummy (in this case D1) is excluded from the model in order to avoid dummy variable trap.
Consider various cases,
i.e. D2=1, D3=D4=D5=0 etc.
Applied Econometrics
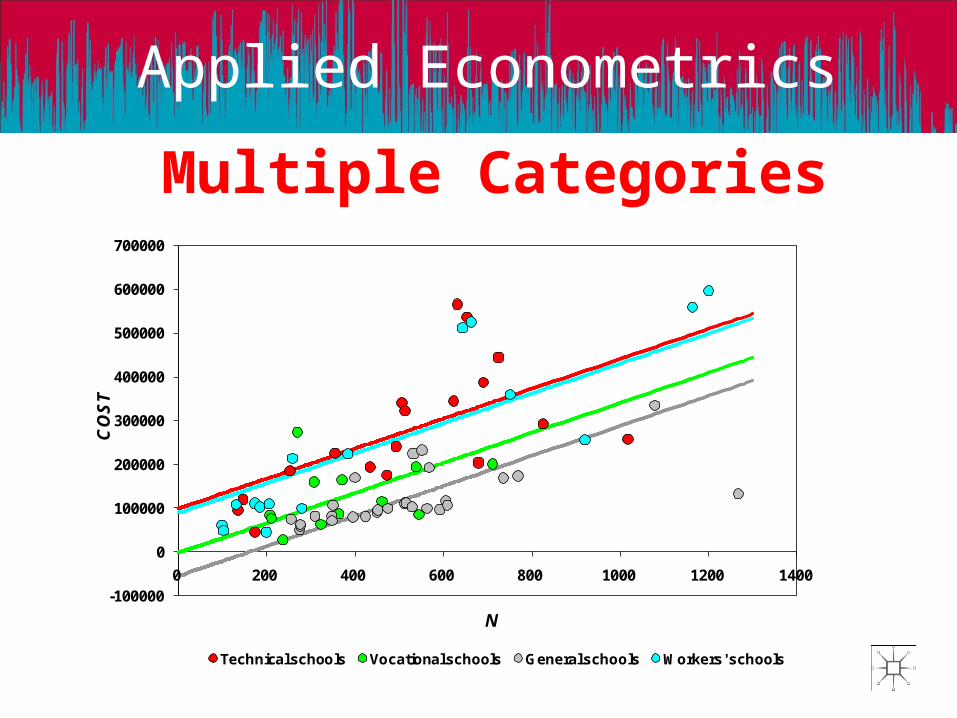
Multiple Categories
-100000
0
100000
200000
300000
400000
500000
600000
700000
0 200 400 600 800 1000 1200 1400
COST
N
Technical schools Vocational schools General schools Workers' schools
Applied Econometrics
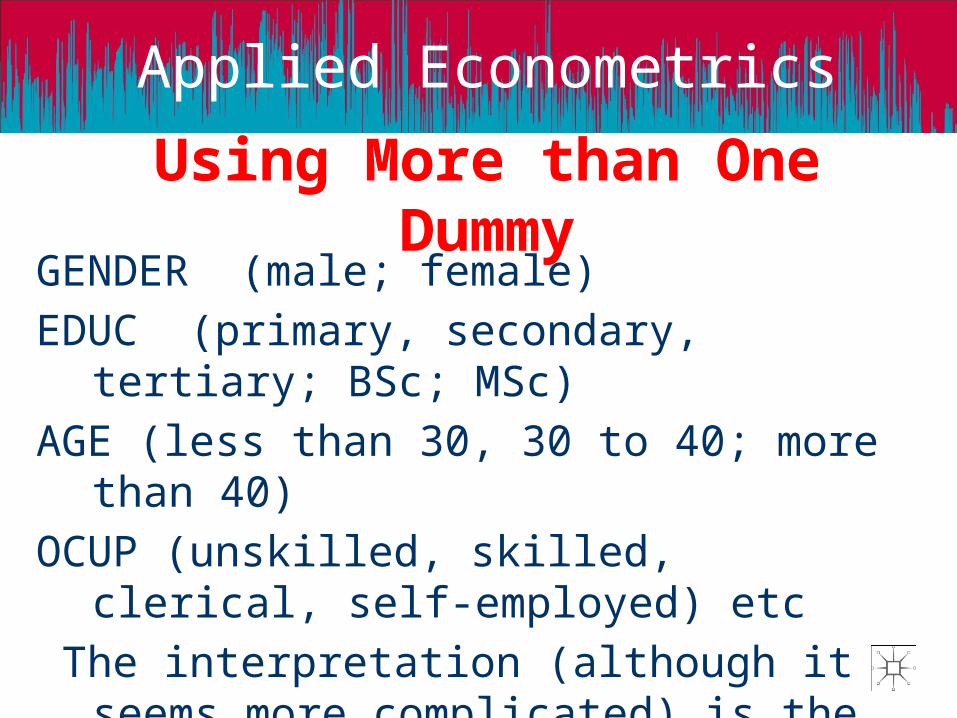
Using More than One DummyGENDER (male; female)
EDUC (primary, secondary, tertiary; BSc; MSc)
AGE (less than 30, 30 to 40; more than 40)
OCUP (unskilled, skilled, clerical, self-employed) etc
The interpretation (although it seems more complicated) is the same as before

Applied Econometrics
Seasonal Dummy Variables
Depends on the frequency of the data
Quarterly – 4 dummies – DQ1, DQ2, DQ3, DQ4
Monthly – 12 dummies – one for each month
Daily – 5 dummies – Dmon, Dtue, Dwed etc.
Again we either exclude one and include a constant (always better) or if we use all we never include a constant (dummy variable trap).
Applied Econometrics
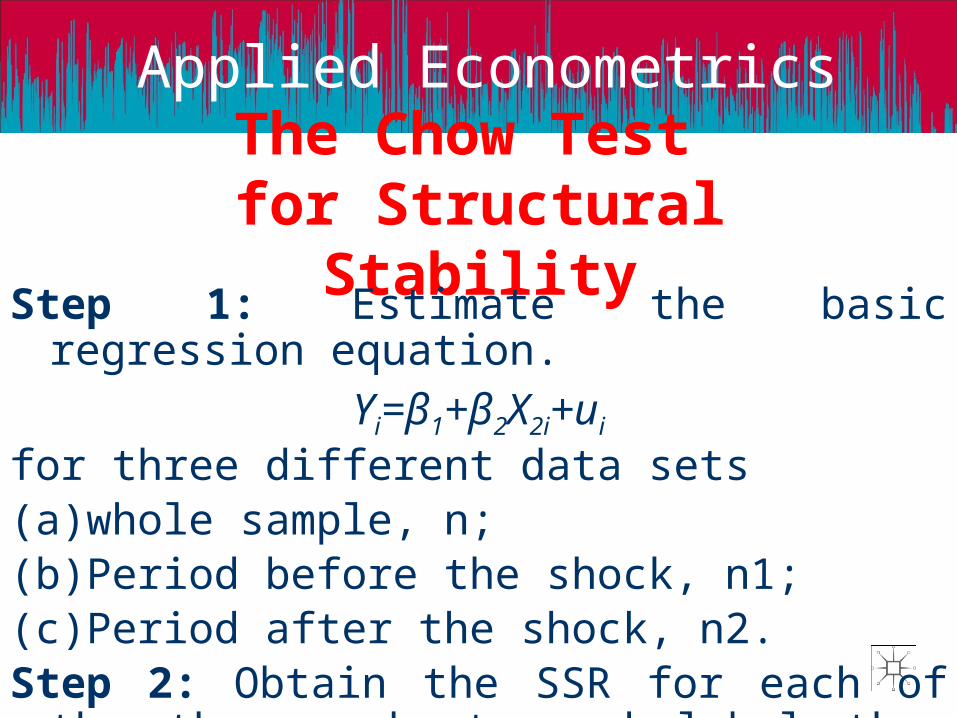
The Chow Test for Structural Stability
Step 1: Estimate the basic regression equation.
Yi=β1+β2X2i+ui
for three different data sets (a)whole sample, n; (b)Period before the shock, n1;(c)Period after the shock, n2. Step 2: Obtain the SSR for each of the three subsets
and label them SSRN, SSR1 and SSR2 respectively.
Applied Econometrics
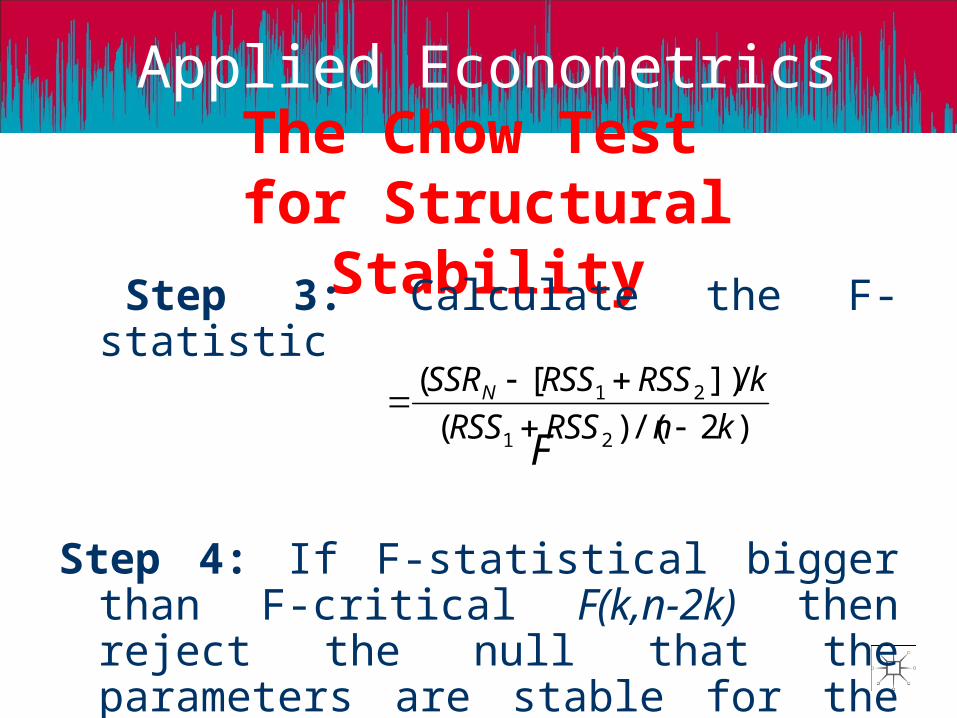
The Chow Test for Structural Stability
Step 3: Calculate the F-statistic F
Step 4: If F-statistical bigger than F-critical F(k,n-2k) then reject the null that the parameters are stable for the whole data set.
)2/()(
/])[(
21
21
knRSSRSS
kRSSRSSSSRN

Applied Econometrics
The Dummy Variable Test for Structural Stability
The Dummy Variable Test is much better because:• A single equation is used to provide a set of the
estimated coefficients for tow or more structures• Only one degree of freedom is lost for every
dummy used.• A larger sample is being used for the estimation• It provides us with information regarding the exact
nature of the parameter instability.