Duke University - Internet2 UNIVERSITY FACTS SCHOOLS AND COLLEGES Year Est. Trinity College of Arts...
33
Duke University Sanjay Rao Assistant Director Enterprise Internet Services Office of Informa<on Technology October 7th, 2009
Transcript of Duke University - Internet2 UNIVERSITY FACTS SCHOOLS AND COLLEGES Year Est. Trinity College of Arts...

DukeUniversity
SanjayRaoAssistantDirectorEnterpriseInternetServicesOfficeofInforma<onTechnology
October7th,2009
Agenda
> Duke at a Glance
> Duke Global Expansion
> Data Center
> Voice
> Campus in a Box
> Video
> Cloud Computing
> Q&A

DUKE UNIVERSITY CHAPEL – www.chapel.duke.edu
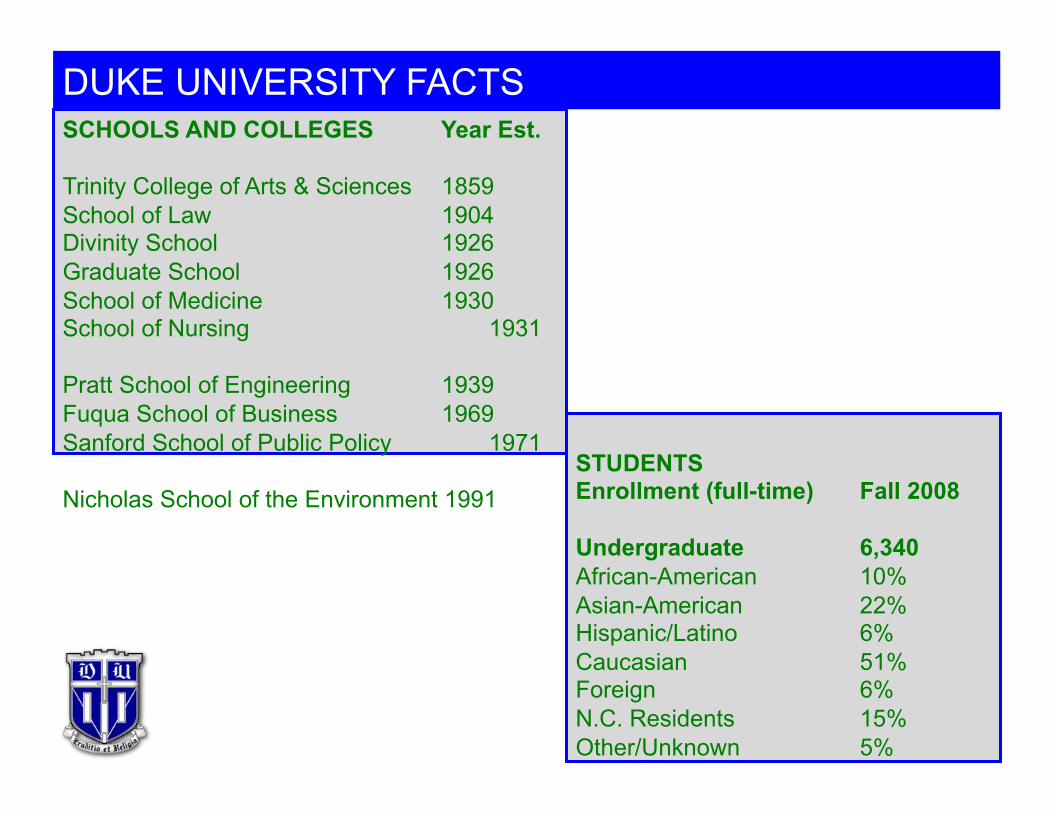
DUKE UNIVERSITY FACTS SCHOOLS AND COLLEGES Year Est.
Trinity College of Arts & Sciences 1859 School of Law 1904 Divinity School 1926 Graduate School 1926 School of Medicine 1930 School of Nursing 1931
Pratt School of Engineering 1939 Fuqua School of Business 1969 Sanford School of Public Policy 1971
Nicholas School of the Environment 1991
STUDENTS Enrollment (full-time) Fall 2008
Undergraduate 6,340 African-American 10% Asian-American 22% Hispanic/Latino 6% Caucasian 51% Foreign 6% N.C. Residents 15% Other/Unknown 5%

Global Expansion Background > Sept 15, 2008 – Duke Fuqua School of Business
announces global expansion plan
> Global network to connect Durham’s research and teaching activities to key economic and cultural centers of the world:
> London
> St. Petersburg, Russia
> Dubai, UAE
> Shanghai, China
> New Delhi, India
> Significant presence in each location envisioned

DataCenterDesign

Tier Classification TierType
PowerSource AnnualSite
Down4me
BackupPowerSource
SiteAvailability
I Singlepathforpowerandcoolingdistribu<onwithoutredundantcomponents
28.8hours NoGeneratororOp<onal
99.671%
II Singlepathforpowerandcoolingdistribu<onwithredundantcomponents
22.0hours Generator 99.741
III Mul<pleAc<vepowerandcoolingdistribu<onpaths(Only
1ac<ve)
1.6hours N+1GeneratorSystem
99.982%
IV Mul<pleAc<vepowerandcoolingdistribu<onpaths
0.4hours 2NGeneratorSystem
99.995%
Source: Uptime Institute

Data Center Components
> Architectural
> Site requirements
> Mechanical
> HVAC, Cooling etc
> Electrical
> PDUs, Delivery paths, UPS
> Security
> Physical access, monitoring
> Telecommunications
> Carrier diversity, Cabling, patching

Data Center Tiers
> Higher tiers correspond to higher availability but also have higher construction costs
> Data center can have different tier ratings for the different portions of its infrastructure
> Overall rating of the data center is equal to the lowest tier rating
> Capacity of systems may need to be upgraded to maintain tier rating as data center load increases
> Human error and operating procedures have a major impact on availability

Data Center Best Practices
> Power and Cooling
> Upto 40% of a data center’s energy is from IT equipment
> Airflow Management
> Hot Aisle/Cold Aisle
> Floor Layout
> Virtualization
> Infrastructure Right-Sizing Source: 42U and Green Grid
Voice

Factorsaffec<ngVoiceQuality• Latency
– Latency is the time it takes a packet to reach a destination
• Effects – Higher the latency,
the listener will hear the words and acknowledge the speaker later than a normal conversation
– Unnatural cadence of the conversation may occur
– Introduces echo
> Jitter • Variance in time
that packets arrive to be assembled into a word
> Effects • Words will be
broken and segmented
> Packet Loss • Can occur due to
variety of reasons such as link failure, buffer overflow in routers
> Effects • Severe
degradation in voice quality
ITU G.114 mouth to ear delay recommendations 0 to 150 ms Acceptable for most user applications
150 to 400 ms Acceptable provided that administrations are aware of the transmission time impact on the transmission quality of user applications
Above 400 ms Unacceptable for general network planning purposes; however, it is recognized that in some exceptional cases (i.e., satellite) this limit will be exceeded

Delay impacts on Voice Quality

Codec Selection > E Model
> R = Ro – Is – Id – Ie +A
> For an “ideal” G729A connection with no loss, jitter or delay, R = Ro- Ie = 94 – 11 = 83
> Note A=0 for wirebound connections
> G.711 provides the best quality
> G.729 and G.723 consume less b/w

CampusinaBox

Campus in a Box Requirements
> Plug and play solution
> Limited to small environments such as hotel venues for less than 100 participants
> Wireless Access Point
> VPN
> POE
> Analog phone ports
> Video
> Different WAN interfaces Picture provided by Cisco

Video

Telepresence
> Technology solution that provides a natural “across the table” experience
> Combines high quality audio and video (HD)
> Integration with Exchange and/or other mail system
> Room Readiness
> Components
> VoIP Infrastructure
> Videoconferencing
> Logistics
> Application
> Connecting communities among geographically separated groups
Source: TANDBERG

Quality Level for Applications Type Quality Applica4on
480p StandardBroadcastQuality
Basicvideocommunica<onandcontentsharing
720p Vividandnaturalmo<on
ProjectMee<ngs,Clientmee<ngs,execu<vebriefings,boardmee<ngs,highqualitycontent
sharing
1080pHD HighestQuality,sharpnaturalvideo
Surgeryandmedicaleduca<on,largeauditoriummee<ngs,broadcastapplicatons

Latency Metrics (One Way in ms)
Regional Averages Last 12 Months
Average Aug 09 July 09 Jun 09 May 09
US 35.48 35.23 35.19 35.09 35.11
Europe 14.74 13.51 14.38 14.08 14.82
APAC 67.97 79.11 74.03 64.53 63.95
CALA 155.21 160.84 139.41 146.18 152.18
Inter Region
New York to London 77.22 78.46 78.12 76.99
Singapore to LA 193.13 200.58 186.14 188.54
San Francisco to Tokyo 99.7 98.96 96.93 97.28
US (Intra-Region)
Dallas to Chicago 28.12 29.27 29.29 29.23 29.21
LA to New York 72.52 69.41 69.49 68.95 69.01
Orlando to New York 35.23 34.84 36.32 35.16 35.08
Philadelphia to Denver 42.52 39.57 39.39 39.7 39.13
Source: AT&T Web Site

QoS

Why QoS is Important?
> Each application has unique requirements
> Most of the traffic today is IP-based
> IP is connectionless protocol
> No specific path for IP packets
> Results in unpredictable QoS in a best effort network
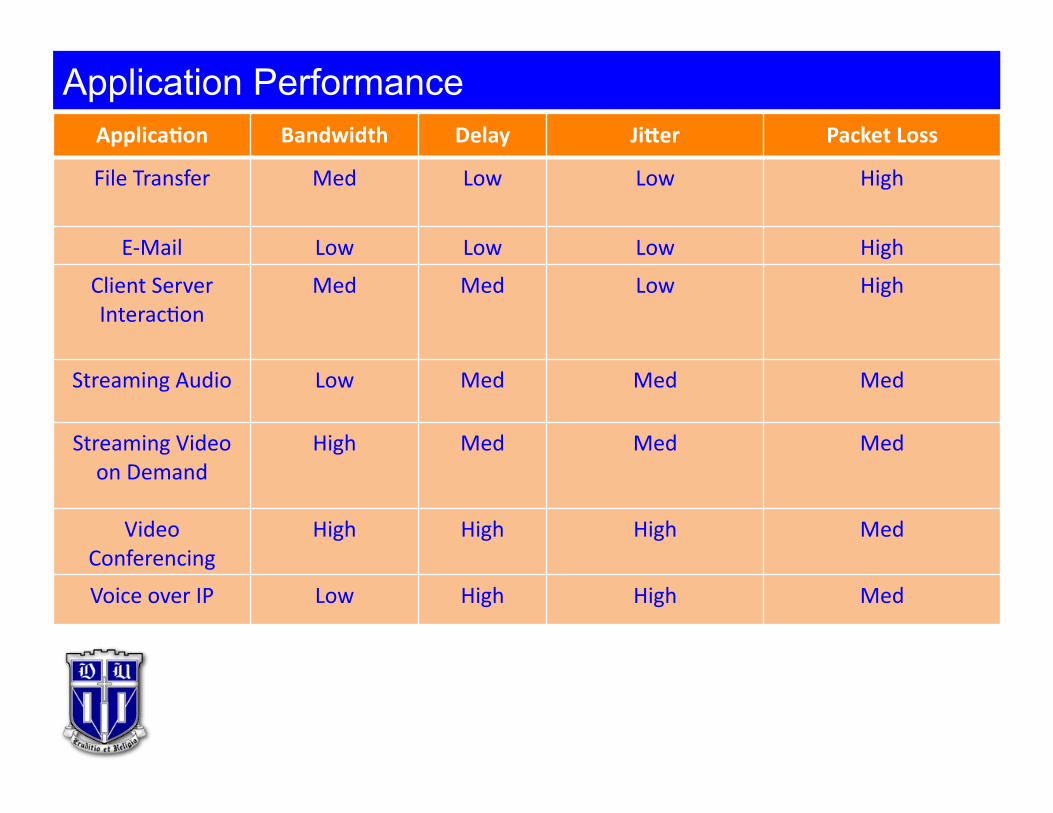
Application Performance Applica4on Bandwidth Delay Ji>er PacketLoss
FileTransfer Med Low Low High
E‐Mail Low Low Low High
ClientServerInterac<on
Med Med Low High
StreamingAudio Low Med Med Med
StreamingVideoonDemand
High Med Med Med
VideoConferencing
High High High Med
VoiceoverIP Low High High Med

CloudCompu<ng

Cloud Computing vs Localized Services
> Campus Data Center > Trusted
> Reliable
> Secure
> Pros
> All services
> Cons
> CapEx increases
> Reduction in capital Expenditure for new campus locations
> Not applicable to all services
> May increase network bandwidth costs
> Cloud Computing > Flexible – move one
application at a time > On-demand
> Pros
> Reduction in CapEx
> Platform agnostic
> Scalable
> Utility pay
> Cons
> Not applicable to all services
> May increase network bandwidth costs (OpEx)

Virtual Lab Computers?
> Web based reservation/provisioning system
> Authenticate
> Select the Virtual Lab Computer you need
> A Virtual machine instance is created and personalized
> Log in via Remote Desktop client for Windows or VNC/X-Windows for Linux

public network
private network for provisioning
Virtual Lab Computers Overview

> NCSU developed VCL for IBM bladecenters and claim yearly usage levels of 68% (~6000 hours)
> Duke OIT added support for VMware ESX, Shibboleth, Grouper
> Duke’s VCL pilot is run from DSCR - part of an IBM grant that provided hardware to the DSCR
> personalized cloud computing compliments high performance computing
VCL = Virtual Computing Lab

VCL HPC late night/summer
midday
assignments due
VCL HPC
VCL HPC
VCL Usage
> on-demand environments available 24x7 > access from anywhere > lab images are cloned - simplified
support > efficient use of compute resources > compute nodes can be reconfigured for
research cluster during slack periods
VCL Goals

> clean virtual machine created for each user > users store data on AFS (or their local PC) > cable/DSL connections are fast enough -
functional at 1 mbps > many computer environments can be stored &
run on-demand
VCL Details

VCL Reservation System

Q&A