Duke Realty Supp Q2 2021
30
Transcript of Duke Realty Supp Q2 2021

Table of Contents
Page PageCompany, Common Stock, and Earnings Call Information 1 Debt Information
Definitions 2 - 3 Debt Maturities 19
Financial Information Unsecured Public Debt Covenants 20
Balance Sheets 4 Joint Venture Information
Condensed Statements of Operations 5 Joint Ventures 21
Non-GAAP Reconciliations - FFO, Core FFO and AFFO 6-7 Joint Venture Debt Maturities 22
Balance Sheet Information 8 Real Estate Investment Information
Selected Financial Information 9 Development Projects Under Construction 23
Leverage Metrics 10 Development Project Deliveries 24
Property Information Dispositions and Acquisitions 25
Occupancy 11 Land Inventory 26
Property Net Operating Income 12-14 Components of Net Asset Value 27
Largest Customers 15 Other
Same Property Net Operating Income 16 Range of Estimates 28
Lease Expirations 17
Leasing Activity 18
When used in this supplemental information package and the conference call to be held in connection herewith, the word “believes,” “expects,” “estimates” and similar expressions are intended to identify forward-looking statements. Such statements are subject to certain risks and uncertainties which could cause actual results to differ materially. In particular, among the factors that could cause actual results to differ materially are the current pandemic caused by COVID19, continued qualification as a real estate investment trust, general business and economic conditions, competition, increases in real estate construction costs, interest rates, accessibility of debt and equity capital markets and other risks inherent in the real estate business including tenant defaults, potential liability relating to environmental matters and liquidity of real estate investments. Readers are advised to refer to Duke Realty's Form 10-K Report as filed with the Securities and Exchange Commission on February 19, 2021 and Form 10-Q for the quarter ended June 30, 2021, for additional information concerning these risks. Additional factors are discussed in reports filed with the Securities and Exchange Commission by us under the heading "Risk Factors."
Duke Realty Corporation
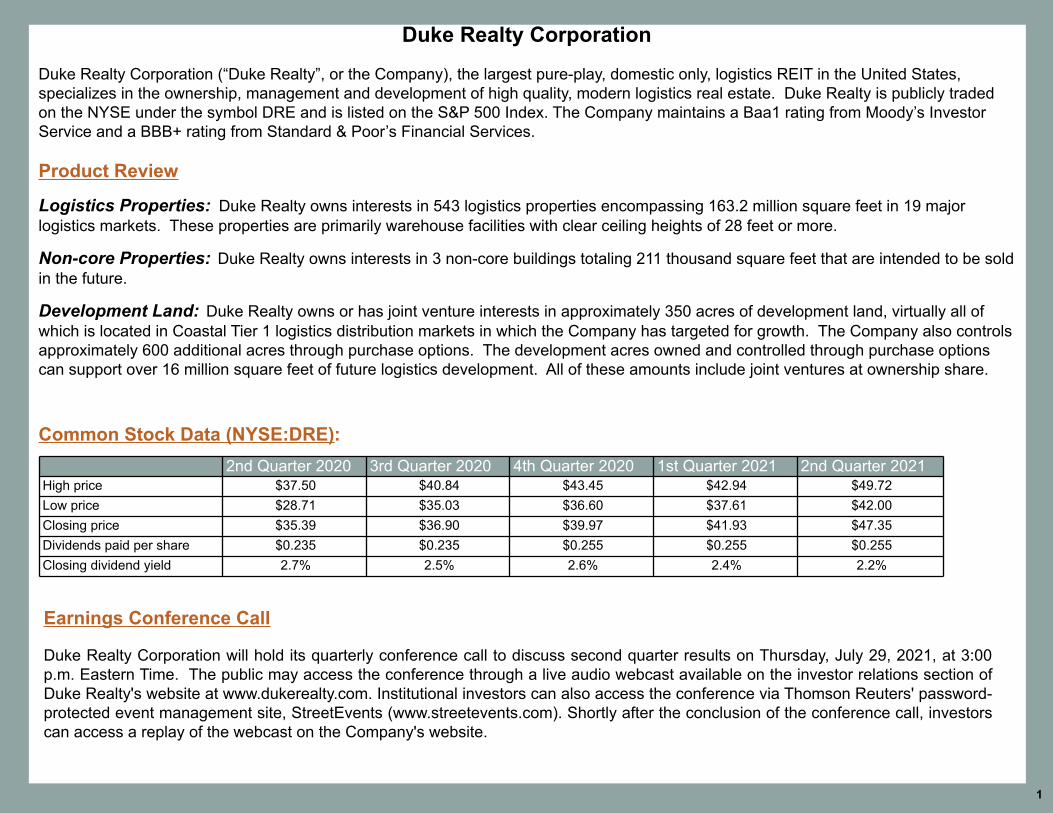
Duke Realty Corporation (“Duke Realty”, or the Company), the largest pure-play, domestic only, logistics REIT in the United States, specializes in the ownership, management and development of high quality, modern logistics real estate. Duke Realty is publicly traded on the NYSE under the symbol DRE and is listed on the S&P 500 Index. The Company maintains a Baa1 rating from Moody’s Investor Service and a BBB+ rating from Standard & Poor’s Financial Services.
Product Review Logistics Properties: Duke Realty owns interests in 543 logistics properties encompassing 163.2 million square feet in 19 major logistics markets. These properties are primarily warehouse facilities with clear ceiling heights of 28 feet or more. Non-core Properties: Duke Realty owns interests in 3 non-core buildings totaling 211 thousand square feet that are intended to be sold in the future. Development Land: Duke Realty owns or has joint venture interests in approximately 350 acres of development land, virtually all of which is located in Coastal Tier 1 logistics distribution markets in which the Company has targeted for growth. The Company also controls approximately 600 additional acres through purchase options. The development acres owned and controlled through purchase options can support over 16 million square feet of future logistics development. All of these amounts include joint ventures at ownership share.
1
2nd Quarter 2020 3rd Quarter 2020 4th Quarter 2020 1st Quarter 2021 2nd Quarter 2021High price $37.50 $40.84 $43.45 $42.94 $49.72Low price $28.71 $35.03 $36.60 $37.61 $42.00Closing price $35.39 $36.90 $39.97 $41.93 $47.35Dividends paid per share $0.235 $0.235 $0.255 $0.255 $0.255Closing dividend yield 2.7% 2.5% 2.6% 2.4% 2.2%
Earnings Conference Call
Duke Realty Corporation will hold its quarterly conference call to discuss second quarter results on Thursday, July 29, 2021, at 3:00 p.m. Eastern Time. The public may access the conference through a live audio webcast available on the investor relations section of Duke Realty's website at www.dukerealty.com. Institutional investors can also access the conference via Thomson Reuters' password-protected event management site, StreetEvents (www.streetevents.com). Shortly after the conclusion of the conference call, investors can access a replay of the webcast on the Company's website.
Common Stock Data (NYSE:DRE):
Definitions
Non-GAAP Supplemental Performance Measures Funds from Operations (“FFO”): FFO is a non-GAAP performance measure computed in accordance with standards established by the National Association of Real Estate Investment Trusts (“Nareit”). It is calculated as net income attributable to common shareholders computed in accordance with generally accepted accounting principles (“GAAP"), excluding depreciation and amortization related to real estate, gains or losses on sales of real estate assets (including real estate assets incidental to our business), gains or losses from change in control, impairment charges related to real estate assets (including real estate assets incidental to our business) and similar adjustments for unconsolidated joint ventures and partially owned consolidated entities, all net of related taxes. We believe FFO to be most directly comparable to net income attributable to common shareholders as defined by GAAP. FFO does not represent a measure of liquidity, nor is it indicative of funds available for our cash needs, including our ability to make cash distributions to shareholders. Core Funds from Operations (“Core FFO”): Core FFO is computed as FFO adjusted for certain items that can create significant earnings volatility and do not directly relate to our core business operations. The adjustments include gains or losses on debt transactions, gains or losses from involuntary conversion from weather events or natural disasters, promote income, severance and other charges related to major overhead restructuring activity, the expense impact of non-incremental costs attributable to successful leases and similar adjustments for unconsolidated joint ventures and partially owned consolidated entities. Although our calculation of Core FFO differs from Nareit’s definition of FFO and may not be comparable to that of other REITs and real estate companies, we believe it provides a meaningful supplemental measure of our operating performance. Non-Incremental Costs Attributable to Successful Leases: Non-incremental costs attributable to successful leases represent internal costs allocable to successful leasing activities and exclude estimated costs related to downtime and/or unsuccessful deals. These costs primarily consist of compensation and other benefits for internal leasing and legal personnel. These costs are not capitalizable "incremental costs" in the context of the applicable lease accounting rules, but we believe including them as an adjustment when computing Core FFO provides useful information for purposes of comparability with economically similar success-based costs incurred by other organizations that outsource their leasing functions, which are generally capitalizable. Adjusted Funds from Operations (“AFFO”): AFFO is defined by the Company as the Core FFO (as defined above), less recurring building improvements and total second generation capital expenditures (the leasing of vacant space that had previously been under lease by the Company is referred to as second generation lease activity) related to leases commencing during the reporting period, and adjusted for certain non-cash items including straight line rental income and expense, non-cash components of interest expense including interest rate hedge amortization, stock compensation expense and after similar adjustments for unconsolidated partnerships and joint ventures. EBITDA for Real Estate ("EBITDAre"): EBITDAre is a non-GAAP supplemental performance measure, which is defined by Nareit as net income (computed in accordance with GAAP), before interest, taxes, depreciation and amortization ("EBITDA") adjusted to exclude gains and losses on sales of real estate assets (including real estate assets incidental to our business), gains and losses from change of control, impairment charges related to real estate assets (including real estate assets incidental to our business) and to include share of EBITDAre of unconsolidated joint ventures. We believe EBITDAre to be most directly comparable to net income computed in accordance with GAAP and consider it to be a useful supplemental performance measure for investors to evaluate our operating performance and ability to meet interest payment obligations. Core EBITDA: Core EBITDA is defined by the Company as the EBITDAre, adjusted for the same reasons as Core FFO, to exclude gains or losses on debt transactions, gains or losses from involuntary conversion from weather events or natural disasters, the expense impact of costs attributable to successful leasing activities, promote income and severance charges related to major overhead restructuring activities. Property Level Net Operating Income - Cash Basis ("PNOI"): PNOI is a non-GAAP performance measure, which is comprised of rental revenues from continuing operations (computed in accordance with GAAP) less rental expenses and real estate taxes from continuing operations, along with adjustments to exclude the straight line rental income and expense, amortization of above and below market rents, amortization of lease concessions and lease termination fees as well as an adjustment to add back intercompany rent. PNOI, as we calculate it, may not be directly comparable to similarly titled, but differently calculated, measures for other REITs. We believe that PNOI to be most directly comparable to income from continuing operations defined by GAAP and that PNOI is another useful supplemental performance measure, as it is an input in many REIT valuation models and it provides a means by which to evaluate the performance of the properties within our Rental Operations segments. Same Property Net Operating Income ("SPNOI - Cash"): We evaluate the performance of our properties, including our share of properties we jointly control, on a "same property" basis, using PNOI with certain minor adjustments. The same property pool of properties is defined once a year at the beginning of the current calendar year, and includes buildings that were in the stabilized portfolio throughout both the current and prior calendar years in both periods. The same property pool is adjusted for dispositions subsequent to its initial establishment. SPNOI also excludes termination fees. SPNOI is a non-GAAP supplemental performance measure that we believe is useful because it improves comparability between periods by eliminating the effects of changes in the composition of our portfolio. Same Property Net Operating Income ("SPNOI - Net Effective"): Computed consistently, and with the same population of properties, as SPNOI-Cash except for the inclusion of the effects on properties of straight-line rental income, the amortization of above or below market rents and the amortization of lease concessions.
2

Other Terms Average Net Effective Rent Growth: Represents the percentage change in net effective rent between the original leases and the current leases. Net effective rent represents average annual base rental payments, on a straight-line basis for the term of each lease excluding operating expense reimbursements. The calculation excludes leases with an initial term of less than 12 months and is weighted by the square footage of leases executed. Cash Rent Growth: Represents the change in starting rental rates per the lease agreement on new and renewed leases signed during the period as compared with the previous ending rental rates in that same space. The calculation excludes leases with an initial term of less than 12 months and excludes any free rent periods. The calculation is weighted by the square footage of leases executed.
Funds Available for Reinvestment: Represents AFFO less regular dividends and distributions.
GAAP Yield (Developments): Stabilized GAAP yield measures the average annualized net operating income expected to be generated over the life of the leaseterm(s) divided by the average annual investment in the development project over the same period. In the instances where a project is not yet fully leased, the GAAP yield is equal to the five year average, using lease-up projections, and computed for years 2-6, allowing the development project a twelve month stabilization period. In-Place Yield (Acquisitions): In-place yields of acquisitions are calculated as annualized net operating income, from space leased to tenants at the date of purchase on a lease-up basis, including full rent from all executed leases, even if currently in a free rent period, divided by the acquisition cost. Annualized net operating income is comprised of base rental payments, excluding reimbursement of operating expenses, less current annualized operating expenses not recovered through tenant reimbursements. To the extent an acquired property is under short-term leaseback to the seller, the income from such leaseback, net of operating expenses, is also included in the in-place yield. In-Place Cap Rate (Dispositions): In-place cap rates of dispositions are calculated as annualized net operating income from space leased to tenants at the date of sale on a lease-up basis, including full rent from all executed leases, even if currently in a free rent period, divided by the sales proceeds. Annualized net operating income is comprised of base rental payments, excluding reimbursement of operating expenses, less current annualized operating expenses not recovered through tenant reimbursements. Percentage Leased: Percentage leased represents the percentage of total square feet under lease, without regard to whether the leases have commenced. Percentage Occupied: Percentage occupied represents the percentage of total square feet where the leases have commenced.
Stabilized Acquisition Cost: As presented for building acquisitions, includes the cash purchase price of the building, transaction costs associated with the acquisition, near term capital expenditures needed to stabilize the property and the effects of marking assumed debt and leases to market.
Stabilized Yield (Acquisitions): Stabilized yield measures an estimated twelve months of potential rental revenue (including cash rental payments, the amortization of above or below market leases and expense reimbursements), less estimated operating expenses, expected to be generated upon stabilization divided by the Stabilized Acquisition Cost of the project(s). Stabilized Cash Yield (Developments): Stabilized cash yield measures the net operating income expected to be generated upon stabilization divided by the total cost of the development project. The development cost includes estimated carry costs during the lease-up period. Stabilized Properties: Represents buildings that have reached 90% leased, or have been in-service for at least one year since development completion or acquisition date. Stabilized properties are subdivided into two additional categories for PNOI and NAV reporting (pages 13, 14 and 27) using the following criteria:
Stabilized Properties - Economic: Stabilized properties that have been 90% occupied, with all initial periods of free rent completed, for at least one full quarterly reporting period.
Stabilized Properties - Pre-Economic: Stabilized properties that have not yet been 90% occupied or with initial periods of free rent not completed for at least one full quarterly reporting period.
Unstabilized Properties: Represents buildings that have not yet reached 90% leased and have been in-service for less than one year since development completion or acquisition date. Value Creation: Estimated value creation is computed by applying a market cap rate to development projects initial net operating income expected to be generated upon stabilization to calculate an implied value. The value creation represents the amount by which the implied value exceeds the estimated stabilized costs of the project at the time of stabilization.
3

Balance Sheets(unaudited and in thousands)
June 30,2021
March 31,2021
December 31,2020
Assets:
Real estate assets $8,693,665 $8,855,987 $8,745,155 Accumulated depreciation (1,612,490) (1,705,011) (1,659,308) Construction in progress 913,241 856,496 695,219 Land held for development 333,135 286,348 284,895 Non-strategic land 2,087 8,507 6,719 Net real estate investments 8,329,638 8,302,327 8,072,680
Real estate investments and other assets held-for-sale 435,606 — 67,946
Cash and cash equivalents 8,252 9,009 6,309 Accounts receivable 12,103 16,925 15,204 Straight-line rent receivable 155,124 162,198 153,943 Receivables on construction contracts, including retentions 59,285 27,221 30,583 Investments in and advances to unconsolidated joint ventures 122,875 128,010 131,898 Deferred leasing and other costs, net 330,083 340,539 329,765 Restricted cash held in escrow for like-kind exchange 2,802 — 47,682 Other escrow deposits and other assets 388,392 309,218 255,384
Total assets $9,844,160 $9,295,447 $9,111,394
Liabilities and Equity:
Secured debt, net of deferred financing costs $61,926 $63,007 $64,074 Unsecured debt, net of deferred financing costs 3,387,226 3,469,884 3,025,977 Unsecured line of credit 265,000 — 295,000
3,714,152 3,532,891 3,385,051
Liabilities related to real estate investments held-for-sale 23,939 — 7,740 Construction payables and amounts due subcontractors, including retentions 128,406 88,811 62,332 Accrued real estate taxes 80,634 80,909 76,501 Accrued interest 20,726 27,605 18,363 Other liabilities 302,100 245,940 269,806 Tenant security deposits and prepaid rents 59,294 60,150 57,153
Total liabilities 4,329,251 4,036,306 3,876,946
Common shares 3,780 3,743 3,733 Additional paid-in capital 5,920,931 5,756,738 5,723,326 Accumulated other comprehensive loss (29,789) (30,679) (31,568) Distributions in excess of net income (469,076) (548,843) (532,519)
Total shareholders' equity 5,425,846 5,180,959 5,162,972
Noncontrolling interests 89,063 78,182 71,476
Total liabilities and equity $9,844,160 $9,295,447 $9,111,394
4

Statements of Operations(unaudited and in thousands)
Three Months Ended Six Months EndedJune 30, 2021 June 30, 2020 June 30, 2021 June 30, 2020
Revenues:Rental and related revenue $253,971 $226,374 $512,150 $445,129 General contractor and service fee revenue 17,721 12,137 48,834 19,751
271,692 238,511 560,984 464,880 Expenses:
Rental expenses 18,515 17,557 46,645 36,400 Real estate taxes 41,368 36,763 82,538 73,490 General contractor and other services expenses 14,066 10,406 43,529 16,974 Depreciation and amortization 91,729 86,704 185,302 172,063
165,678 151,430 358,014 298,927 Other Operating Activities:
Equity in earnings of unconsolidated joint ventures 10,590 2,396 26,858 4,935 Gain on sale of properties 95,183 — 116,543 8,937 Gain on land sales 9,900 6,070 11,138 6,205 Other operating expenses (338) (1,546) (1,483) (2,658) Impairment charges — — — (5,626) Non-incremental costs related to successful leases (4,027) (4,034) (6,985) (6,559) General and administrative expenses (15,879) (13,606) (40,096) (35,369)
95,429 (10,720) 105,975 (30,135) Operating income 201,443 76,361 308,945 135,818
Other Income (Expenses):Interest and other income, net 1,673 216 2,136 1,611 Interest expense (21,072) (22,841) (43,579) (46,335) Loss on debt extinguishment (3,938) (14,972) (4,008) (32,778) Gain on involuntary conversion 3,222 1,283 3,222 1,283
Income from continuing operations before income taxes 181,328 40,047 266,716 59,599 Income tax (expense) benefit (3,672) 150 (8,856) 210
Income from continuing operations 177,656 40,197 257,860 59,809
Discontinued operations:Gain on sale of properties — 23 — 71
Income from discontinued operations — 23 — 71
Net income 177,656 40,220 257,860 59,880 Net income attributable to noncontrolling interests (1,839) (400) (2,681) (604)
Net income attributable to common shareholders $175,817 $39,820 $255,179 $59,276 Basic net income per common share:
Continuing operations attributable to common shareholders $0.47 $0.11 $0.68 $0.16 Diluted net income per common share:
Continuing operations attributable to common shareholders $0.47 $0.11 $0.68 $0.16 Weighted average number of common shares outstanding 376,020 368,836 374,850 368,513 Weighted average number of common shares and potential dilutive securities 381,621 372,573 380,334 372,197
5
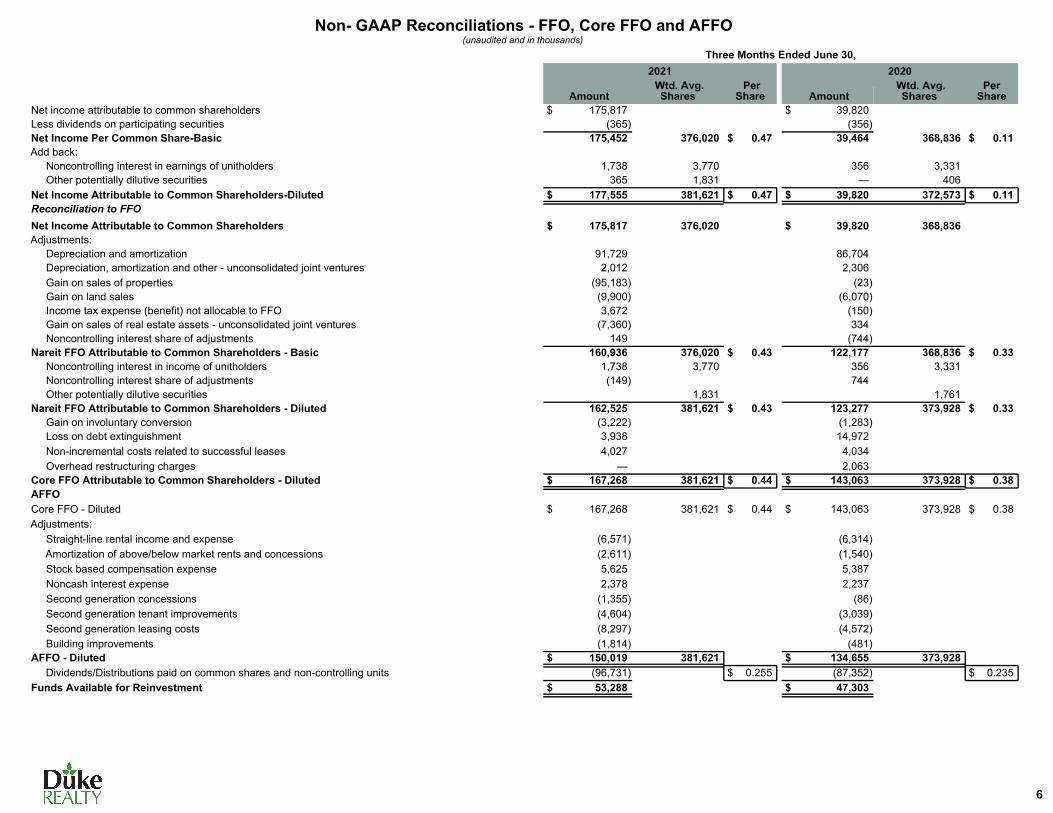
Non- GAAP Reconciliations - FFO, Core FFO and AFFO (unaudited and in thousands)
Three Months Ended June 30,2021 2020
Amount Wtd. Avg.
Shares Per
Share Amount Wtd. Avg.
SharesPer
Share Net income attributable to common shareholders $ 175,817 $ 39,820 Less dividends on participating securities (365) (356) Net Income Per Common Share-Basic 175,452 376,020 $ 0.47 39,464 368,836 $ 0.11 Add back:
Noncontrolling interest in earnings of unitholders 1,738 3,770 356 3,331 Other potentially dilutive securities 365 1,831 — 406
Net Income Attributable to Common Shareholders-Diluted $ 177,555 381,621 $ 0.47 $ 39,820 372,573 $ 0.11 Reconciliation to FFO Net Income Attributable to Common Shareholders $ 175,817 376,020 $ 39,820 368,836 Adjustments:
Depreciation and amortization 91,729 86,704 Depreciation, amortization and other - unconsolidated joint ventures 2,012 2,306 Gain on sales of properties (95,183) (23) Gain on land sales (9,900) (6,070) Income tax expense (benefit) not allocable to FFO 3,672 (150) Gain on sales of real estate assets - unconsolidated joint ventures (7,360) 334 Noncontrolling interest share of adjustments 149 (744)
Nareit FFO Attributable to Common Shareholders - Basic 160,936 376,020 $ 0.43 122,177 368,836 $ 0.33 Noncontrolling interest in income of unitholders 1,738 3,770 356 3,331 Noncontrolling interest share of adjustments (149) 744 Other potentially dilutive securities 1,831 1,761
Nareit FFO Attributable to Common Shareholders - Diluted 162,525 381,621 $ 0.43 123,277 373,928 $ 0.33 Gain on involuntary conversion (3,222) (1,283) Loss on debt extinguishment 3,938 14,972 Non-incremental costs related to successful leases 4,027 4,034 Overhead restructuring charges — 2,063
Core FFO Attributable to Common Shareholders - Diluted $ 167,268 381,621 $ 0.44 $ 143,063 373,928 $ 0.38 AFFO Core FFO - Diluted $ 167,268 381,621 $ 0.44 $ 143,063 373,928 $ 0.38 Adjustments:
Straight-line rental income and expense (6,571) (6,314) Amortization of above/below market rents and concessions (2,611) (1,540) Stock based compensation expense 5,625 5,387 Noncash interest expense 2,378 2,237 Second generation concessions (1,355) (86) Second generation tenant improvements (4,604) (3,039) Second generation leasing costs (8,297) (4,572) Building improvements (1,814) (481)
AFFO - Diluted $ 150,019 381,621 $ 134,655 373,928 Dividends/Distributions paid on common shares and non-controlling units (96,731) $ 0.255 (87,352) $ 0.235 Funds Available for Reinvestment $ 53,288 $ 47,303
6
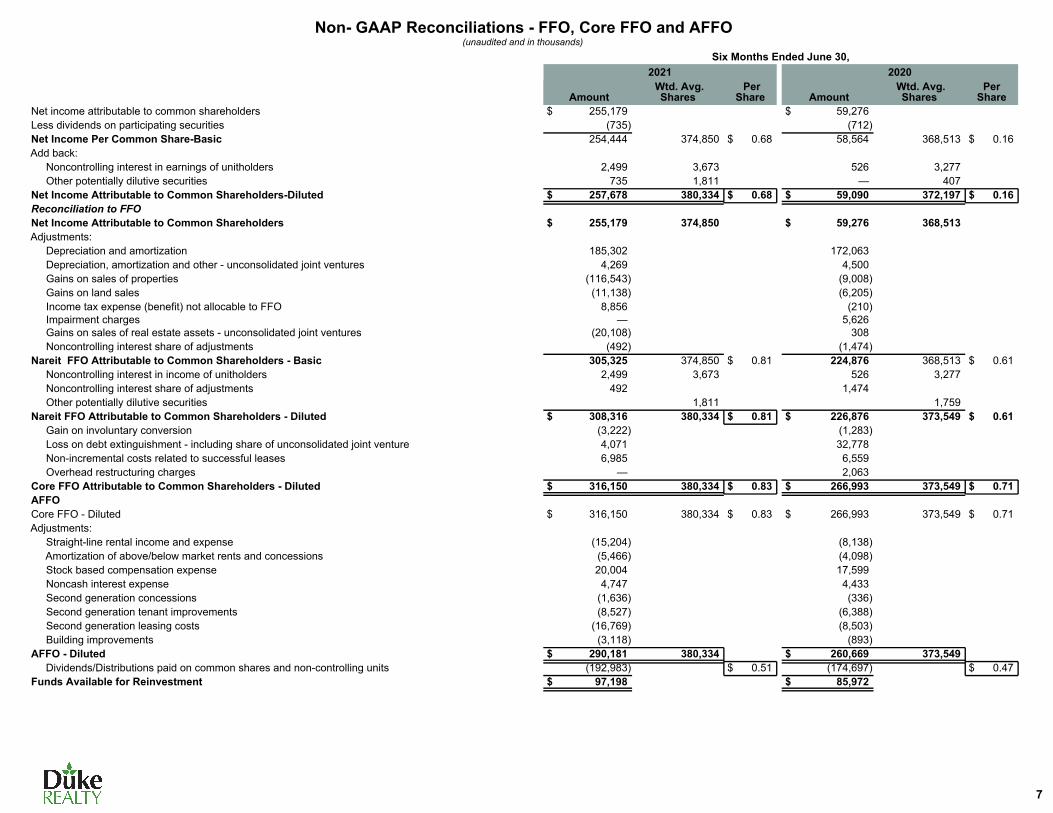
Non- GAAP Reconciliations - FFO, Core FFO and AFFO (unaudited and in thousands)
Six Months Ended June 30,2021 2020
Amount Wtd. Avg.
Shares Per
Share Amount Wtd. Avg.
SharesPer
Share Net income attributable to common shareholders $ 255,179 $ 59,276 Less dividends on participating securities (735) (712) Net Income Per Common Share-Basic 254,444 374,850 $ 0.68 58,564 368,513 $ 0.16 Add back:
Noncontrolling interest in earnings of unitholders 2,499 3,673 526 3,277 Other potentially dilutive securities 735 1,811 — 407
Net Income Attributable to Common Shareholders-Diluted $ 257,678 380,334 $ 0.68 $ 59,090 372,197 $ 0.16 Reconciliation to FFO Net Income Attributable to Common Shareholders $ 255,179 374,850 $ 59,276 368,513 Adjustments:
Depreciation and amortization 185,302 172,063 Depreciation, amortization and other - unconsolidated joint ventures 4,269 4,500 Gains on sales of properties (116,543) (9,008) Gains on land sales (11,138) (6,205) Income tax expense (benefit) not allocable to FFO 8,856 (210) Impairment charges — 5,626 Gains on sales of real estate assets - unconsolidated joint ventures (20,108) 308 Noncontrolling interest share of adjustments (492) (1,474)
Nareit FFO Attributable to Common Shareholders - Basic 305,325 374,850 $ 0.81 224,876 368,513 $ 0.61 Noncontrolling interest in income of unitholders 2,499 3,673 526 3,277 Noncontrolling interest share of adjustments 492 1,474 Other potentially dilutive securities 1,811 1,759
Nareit FFO Attributable to Common Shareholders - Diluted $ 308,316 380,334 $ 0.81 $ 226,876 373,549 $ 0.61 Gain on involuntary conversion (3,222) (1,283) Loss on debt extinguishment - including share of unconsolidated joint venture 4,071 32,778 Non-incremental costs related to successful leases 6,985 6,559 Overhead restructuring charges — 2,063
Core FFO Attributable to Common Shareholders - Diluted $ 316,150 380,334 $ 0.83 $ 266,993 373,549 $ 0.71 AFFO Core FFO - Diluted $ 316,150 380,334 $ 0.83 $ 266,993 373,549 $ 0.71 Adjustments:
Straight-line rental income and expense (15,204) (8,138) Amortization of above/below market rents and concessions (5,466) (4,098) Stock based compensation expense 20,004 17,599 Noncash interest expense 4,747 4,433 Second generation concessions (1,636) (336) Second generation tenant improvements (8,527) (6,388) Second generation leasing costs (16,769) (8,503) Building improvements (3,118) (893)
AFFO - Diluted $ 290,181 380,334 $ 260,669 373,549 Dividends/Distributions paid on common shares and non-controlling units (192,983) $ 0.51 (174,697) $ 0.47 Funds Available for Reinvestment $ 97,198 $ 85,972
7

Balance Sheet Information(unaudited and in thousands)
Real Estate Assets June 30, 2021 December 31, 2020
Buildings and tenant improvements $ 5,658,306 $ 5,812,004
Land and improvements 2,981,167 2,883,674
Other real estate assets (1) 54,192 49,477
Real estate assets per consolidated balance sheets $ 8,693,665 $ 8,745,155
Real estate investments and other assets held for sale (2) $ 435,606 $ 67,946
Other Assets June 30, 2021 December 31, 2020
Notes receivable (1) $ 84,072 $ 2,452
Right of use assets - operating lease 37,216 38,867
Right of use assets - finance lease 37,889 19,239
Goodwill 89,314 89,314
Deferred financing costs on unsecured line of credit 7,358 2,347
Prepaid expenses and other assets (2) 132,543 103,165
Other assets per consolidated balance sheets $ 388,392 $ 255,384
(1) Included as an input on page 27, "Components of Net Asset Value".(2) Includes, but not limited to, purchase deposits, prepaid expenses, furniture and fixtures in corporate and market offices and other assets used for the company's operations. Included as an input on page 27, "Components of Net Asset Value".
Other LiabilitiesJune 30, 2021 December 31, 2020
Non-cash liabilities and deferred revenue $ 134,407 $ 110,844
Lease liabilities - operating lease (1) 41,472 42,874
Lease liabilities - finance lease (1) 38,512 19,430
Operating accruals (2) 49,350 55,956
Costs to complete and other cash obligations (3) 38,359 40,702
Other liabilities per consolidated balance sheets $ 302,100 $ 269,806
(1) The substantial majority of these lease liabilities relate to ground leases upon which we own buildings that are, or will be when completed, valued by income capitalization. These lease liabilities are not included in "Components of Net Asset Value" due to the fact that the cash ground lease payments are included, or will be when completed, in PNOI.(2) Includes, but not limited to, accrued property level expenses such as utilities, payroll and other employee workforce related accruals. Included as an input on page 27, "Components of Net Asset Value".
(3) Included as an input on page 27, "Components of Net Asset Value".
(1) See page 26 for information regarding the composition of other real estate investments. (2) Consists of (i) 14 wholly-owned industrial buildings totaling 4,327 square feet, which are 100% leased, and 15 acres of undeveloped land (representing our remaining properties in St. Louis), which subsequently sold in July, and (ii) seven wholly-owned industrial buildings, and two trailer storage lots, all 100% leased to Amazon that have been, or will be, contributed to a 20%-owned unconsolidated joint venture with CBRE Global Investors ("CBREGI") in three tranches. The first tranche consisted of two buildings totaling 1,256 square feet and one trailer storage lot in Chicago and Atlanta and subsequently closed in July. The second tranche consists of two buildings, totaling 1,364 square feet, and one trailer storage lot in Baltimore and is expected to close late in the third quarter. The third tranche consists of three buildings in Eastern Pennsylvania, Seattle and South Florida, totaling 2,219 square feet, and is anticipated to close in early 2022. See Note 1 on page 27 for additional information on the sales that closed in July.
8
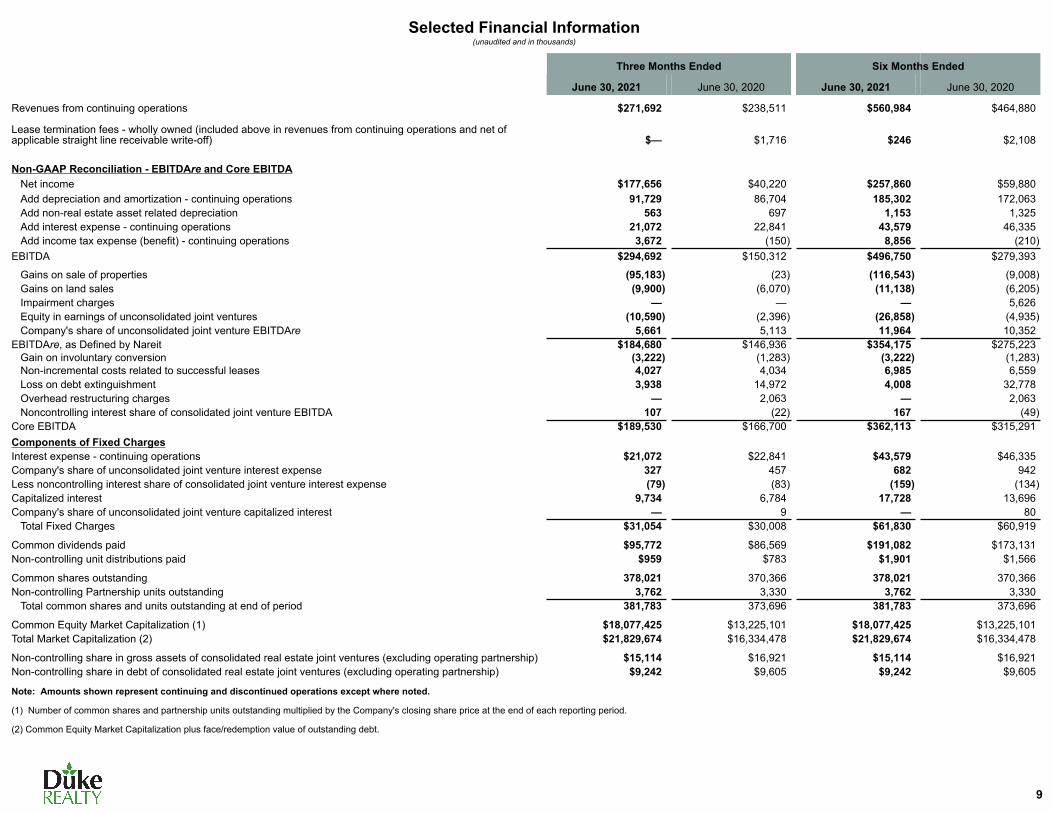
Selected Financial Information(unaudited and in thousands)
Three Months Ended Six Months Ended
June 30, 2021 June 30, 2020 June 30, 2021 June 30, 2020
Revenues from continuing operations $271,692 $238,511 $560,984 $464,880
Lease termination fees - wholly owned (included above in revenues from continuing operations and net of applicable straight line receivable write-off) $— $1,716 $246 $2,108
Non-GAAP Reconciliation - EBITDAre and Core EBITDANet income $177,656 $40,220 $257,860 $59,880 Add depreciation and amortization - continuing operations 91,729 86,704 185,302 172,063 Add non-real estate asset related depreciation 563 697 1,153 1,325 Add interest expense - continuing operations 21,072 22,841 43,579 46,335 Add income tax expense (benefit) - continuing operations 3,672 (150) 8,856 (210)
EBITDA $294,692 $150,312 $496,750 $279,393
Gains on sale of properties (95,183) (23) (116,543) (9,008) Gains on land sales (9,900) (6,070) (11,138) (6,205) Impairment charges — — — 5,626 Equity in earnings of unconsolidated joint ventures (10,590) (2,396) (26,858) (4,935) Company's share of unconsolidated joint venture EBITDAre 5,661 5,113 11,964 10,352
EBITDAre, as Defined by Nareit $184,680 $146,936 $354,175 $275,223 Gain on involuntary conversion (3,222) (1,283) (3,222) (1,283) Non-incremental costs related to successful leases 4,027 4,034 6,985 6,559 Loss on debt extinguishment 3,938 14,972 4,008 32,778 Overhead restructuring charges — 2,063 — 2,063 Noncontrolling interest share of consolidated joint venture EBITDA 107 (22) 167 (49)
Core EBITDA $189,530 $166,700 $362,113 $315,291 Components of Fixed ChargesInterest expense - continuing operations $21,072 $22,841 $43,579 $46,335 Company's share of unconsolidated joint venture interest expense 327 457 682 942 Less noncontrolling interest share of consolidated joint venture interest expense (79) (83) (159) (134) Capitalized interest 9,734 6,784 17,728 13,696 Company's share of unconsolidated joint venture capitalized interest — 9 — 80
Total Fixed Charges $31,054 $30,008 $61,830 $60,919
Common dividends paid $95,772 $86,569 $191,082 $173,131 Non-controlling unit distributions paid $959 $783 $1,901 $1,566
Common shares outstanding 378,021 370,366 378,021 370,366 Non-controlling Partnership units outstanding 3,762 3,330 3,762 3,330
Total common shares and units outstanding at end of period 381,783 373,696 381,783 373,696
Common Equity Market Capitalization (1) $18,077,425 $13,225,101 $18,077,425 $13,225,101 Total Market Capitalization (2) $21,829,674 $16,334,478 $21,829,674 $16,334,478
Non-controlling share in gross assets of consolidated real estate joint ventures (excluding operating partnership) $15,114 $16,921 $15,114 $16,921 Non-controlling share in debt of consolidated real estate joint ventures (excluding operating partnership) $9,242 $9,605 $9,242 $9,605
Note: Amounts shown represent continuing and discontinued operations except where noted.
(1) Number of common shares and partnership units outstanding multiplied by the Company's closing share price at the end of each reporting period.
(2) Common Equity Market Capitalization plus face/redemption value of outstanding debt.
9
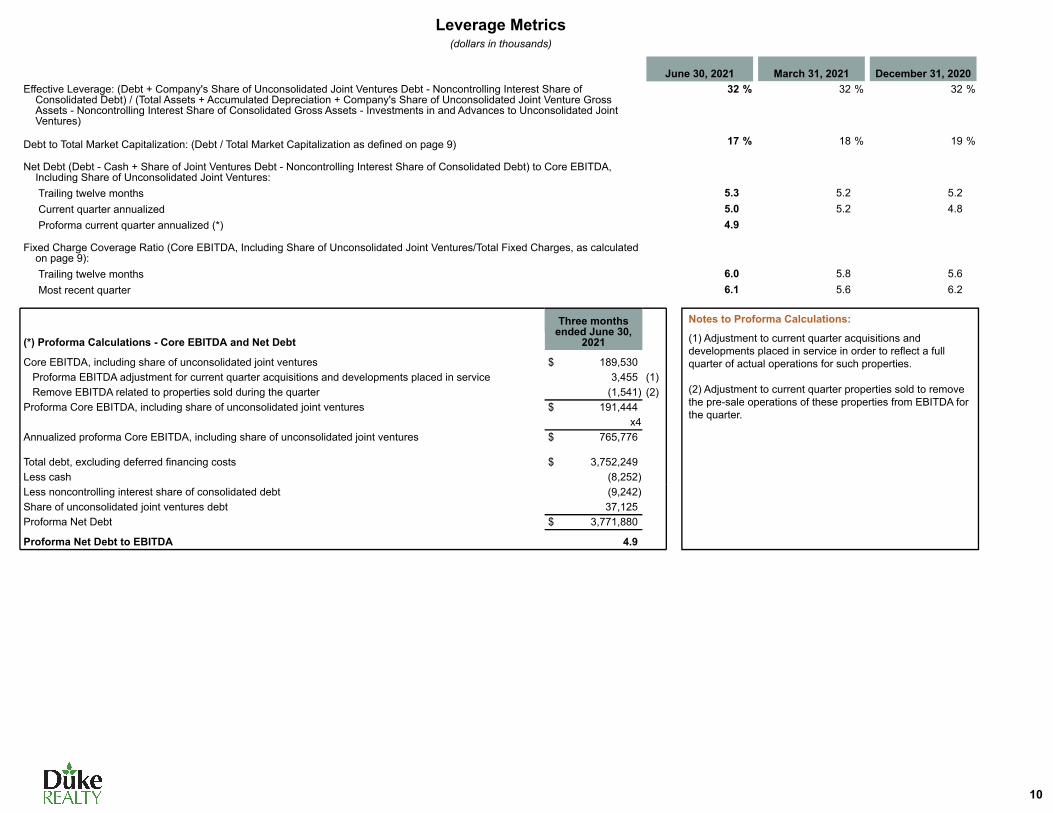
Leverage Metrics(dollars in thousands)
June 30, 2021 March 31, 2021 December 31, 2020Effective Leverage: (Debt + Company's Share of Unconsolidated Joint Ventures Debt - Noncontrolling Interest Share of
Consolidated Debt) / (Total Assets + Accumulated Depreciation + Company's Share of Unconsolidated Joint Venture Gross Assets - Noncontrolling Interest Share of Consolidated Gross Assets - Investments in and Advances to Unconsolidated Joint Ventures)
32 % 32 % 32 %
Debt to Total Market Capitalization: (Debt / Total Market Capitalization as defined on page 9) 17 % 18 % 19 %
Net Debt (Debt - Cash + Share of Joint Ventures Debt - Noncontrolling Interest Share of Consolidated Debt) to Core EBITDA, Including Share of Unconsolidated Joint Ventures:Trailing twelve months 5.3 5.2 5.2 Current quarter annualized 5.0 5.2 4.8 Proforma current quarter annualized (*) 4.9
Fixed Charge Coverage Ratio (Core EBITDA, Including Share of Unconsolidated Joint Ventures/Total Fixed Charges, as calculated on page 9):Trailing twelve months 6.0 5.8 5.6 Most recent quarter 6.1 5.6 6.2
Three months ended June 30,
2021(*) Proforma Calculations - Core EBITDA and Net Debt
Core EBITDA, including share of unconsolidated joint ventures $ 189,530 Proforma EBITDA adjustment for current quarter acquisitions and developments placed in service 3,455 (1)Remove EBITDA related to properties sold during the quarter (1,541) (2)
Proforma Core EBITDA, including share of unconsolidated joint ventures $ 191,444 x4
Annualized proforma Core EBITDA, including share of unconsolidated joint ventures $ 765,776
Total debt, excluding deferred financing costs $ 3,752,249 Less cash (8,252) Less noncontrolling interest share of consolidated debt (9,242) Share of unconsolidated joint ventures debt 37,125 Proforma Net Debt $ 3,771,880
Proforma Net Debt to EBITDA 4.9
Notes to Proforma Calculations:
(1) Adjustment to current quarter acquisitions and developments placed in service in order to reflect a full quarter of actual operations for such properties. (2) Adjustment to current quarter properties sold to remove the pre-sale operations of these properties from EBITDA for the quarter.
10
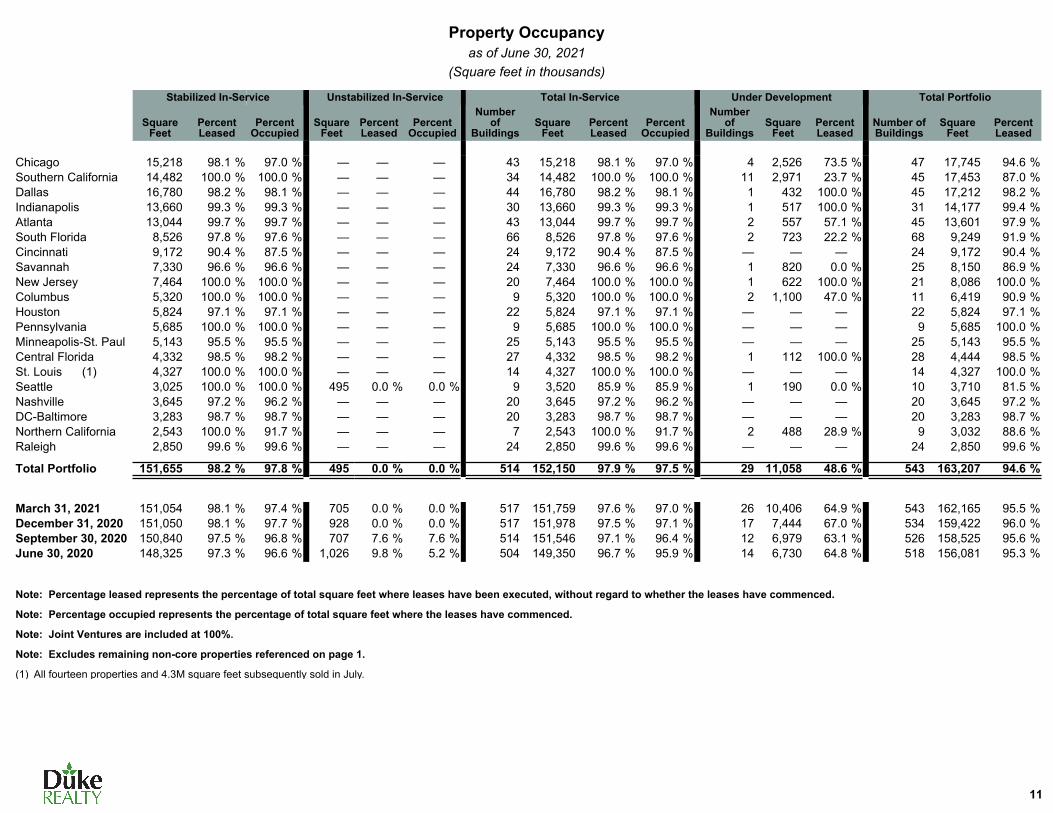
Property Occupancyas of June 30, 2021
(Square feet in thousands)
Stabilized In-Service Unstabilized In-Service Total In-Service Under Development Total Portfolio
Square Feet
Percent Leased
Percent Occupied
Square Feet
Percent Leased
Percent Occupied
Number of
BuildingsSquare
FeetPercent Leased
Percent Occupied
Number of
BuildingsSquare
FeetPercent Leased
Number of Buildings
Square Feet
Percent Leased
Chicago 15,218 98.1 % 97.0 % — — — 43 15,218 98.1 % 97.0 % 4 2,526 73.5 % 47 17,745 94.6 %Southern California 14,482 100.0 % 100.0 % — — — 34 14,482 100.0 % 100.0 % 11 2,971 23.7 % 45 17,453 87.0 %Dallas 16,780 98.2 % 98.1 % — — — 44 16,780 98.2 % 98.1 % 1 432 100.0 % 45 17,212 98.2 %Indianapolis 13,660 99.3 % 99.3 % — — — 30 13,660 99.3 % 99.3 % 1 517 100.0 % 31 14,177 99.4 %Atlanta 13,044 99.7 % 99.7 % — — — 43 13,044 99.7 % 99.7 % 2 557 57.1 % 45 13,601 97.9 %South Florida 8,526 97.8 % 97.6 % — — — 66 8,526 97.8 % 97.6 % 2 723 22.2 % 68 9,249 91.9 %Cincinnati 9,172 90.4 % 87.5 % — — — 24 9,172 90.4 % 87.5 % — — — 24 9,172 90.4 %Savannah 7,330 96.6 % 96.6 % — — — 24 7,330 96.6 % 96.6 % 1 820 0.0 % 25 8,150 86.9 %New Jersey 7,464 100.0 % 100.0 % — — — 20 7,464 100.0 % 100.0 % 1 622 100.0 % 21 8,086 100.0 %Columbus 5,320 100.0 % 100.0 % — — — 9 5,320 100.0 % 100.0 % 2 1,100 47.0 % 11 6,419 90.9 %Houston 5,824 97.1 % 97.1 % — — — 22 5,824 97.1 % 97.1 % — — — 22 5,824 97.1 %Pennsylvania 5,685 100.0 % 100.0 % — — — 9 5,685 100.0 % 100.0 % — — — 9 5,685 100.0 %Minneapolis-St. Paul 5,143 95.5 % 95.5 % — — — 25 5,143 95.5 % 95.5 % — — — 25 5,143 95.5 %Central Florida 4,332 98.5 % 98.2 % — — — 27 4,332 98.5 % 98.2 % 1 112 100.0 % 28 4,444 98.5 %St. Louis (1) 4,327 100.0 % 100.0 % — — — 14 4,327 100.0 % 100.0 % — — — 14 4,327 100.0 %Seattle 3,025 100.0 % 100.0 % 495 0.0 % 0.0 % 9 3,520 85.9 % 85.9 % 1 190 0.0 % 10 3,710 81.5 %Nashville 3,645 97.2 % 96.2 % — — — 20 3,645 97.2 % 96.2 % — — — 20 3,645 97.2 %DC-Baltimore 3,283 98.7 % 98.7 % — — — 20 3,283 98.7 % 98.7 % — — — 20 3,283 98.7 %Northern California 2,543 100.0 % 91.7 % — — — 7 2,543 100.0 % 91.7 % 2 488 28.9 % 9 3,032 88.6 %Raleigh 2,850 99.6 % 99.6 % — — — 24 2,850 99.6 % 99.6 % — — — 24 2,850 99.6 %
Total Portfolio 151,655 98.2 % 97.8 % 495 0.0 % 0.0 % 514 152,150 97.9 % 97.5 % 29 11,058 48.6 % 543 163,207 94.6 %
March 31, 2021 151,054 98.1 % 97.4 % 705 0.0 % 0.0 % 517 151,759 97.6 % 97.0 % 26 10,406 64.9 % 543 162,165 95.5 %December 31, 2020 151,050 98.1 % 97.7 % 928 0.0 % 0.0 % 517 151,978 97.5 % 97.1 % 17 7,444 67.0 % 534 159,422 96.0 %September 30, 2020 150,840 97.5 % 96.8 % 707 7.6 % 7.6 % 514 151,546 97.1 % 96.4 % 12 6,979 63.1 % 526 158,525 95.6 %June 30, 2020 148,325 97.3 % 96.6 % 1,026 9.8 % 5.2 % 504 149,350 96.7 % 95.9 % 14 6,730 64.8 % 518 156,081 95.3 %
Note: Percentage leased represents the percentage of total square feet where leases have been executed, without regard to whether the leases have commenced.
Note: Percentage occupied represents the percentage of total square feet where the leases have commenced.
Note: Joint Ventures are included at 100%.
Note: Excludes remaining non-core properties referenced on page 1.
(1) All fourteen properties and 4.3M square feet subsequently sold in July.
11

Non-GAAP Reconciliations - PNOI and SPNOI(unaudited and in thousands)
Three Months Ended Six Months EndedJune 30, 2021 June 30, 2021
Non-GAAP Reconciliation of PNOI Net Income Attributable to Common Shareholders (Page 5) $ 175,817 $ 255,179 Adjustments related to Nareit FFO Attributable to Common Shareholders - Diluted (13,292) 53,137 Nareit FFO Attributable to Common Shareholders - Diluted (Page 6-7) $ 162,525 $ 308,316 Adjustments related to Core FFO Attributable to Common Shareholders - Diluted 4,743 7,834 Core FFO Attributable to Common Shareholders - Diluted (Page 6-7) $ 167,268 $ 316,150
Add back: Interest expense, continuing operations 21,072 43,579 Add back: non-real estate asset related depreciation 563 1,153 Less: FFO attributable to unconsolidated joint ventures (5,405) (11,405) Add: Company's share of unconsolidated joint venture EBITDAre (Page 9) 5,661 11,964 Adjustments related to noncontrolling interest share of consolidated joint ventures 371 672
Core EBITDA (Page 9) $ 189,530 $ 362,113 General contractor and service fee revenue, net of related expenses (3,655) (5,305) General and administrative expense, excluding severance/restructuring 15,879 40,096 Non-real estate asset related depreciation (563) (1,153) Other operating expenses 338 1,483 Company's share of unconsolidated joint venture EBITDAre (5,661) (11,964) Noncontrolling interest share of consolidated joint venture EBITDA (107) (167) Interest and other income (1,673) (2,136) Revenues not allocable to operating segments (181) (181) Rental expenses and real estate taxes not allocable to operating segments 60 (66) Other adjustments (1) (8,387) (19,132)
PNOI, continuing operations, before joint ventures 185,580 363,588 Less noncontrolling interest share of consolidated joint venture PNOI (313) (606) Plus share of unconsolidated joint venture PNOI 5,382 10,862
PNOI, continuing operations, including share of joint ventures 190,649 373,844 PNOI of sold assets not in discontinued operations (2) (1,054) (3,041) Proforma PNOI adjustments (3) 2,634 4,732
Proforma PNOI (Page 13) $ 192,229 $ 375,535
Non-GAAP Reconciliation of SPNOI - CashIncome from continuing operations before income taxes (Page 5) $ 181,328 $ 266,716
Share of SPNOI from unconsolidated joint ventures 5,019 9,998 PNOI excluded from the "same property" population (22,443) (40,041) Earnings from Service Operations (3,655) (5,305) Rental Operations revenues and expenses excluded from PNOI (9,441) (22,173) Non-Segment Items 16,294 121,309
SPNOI - Cash (Page 16) $ 167,102 $ 330,504
(1) Represents adjustments for straight line rental income (net of collectability reserves) and expense, amortization of above and below market rents, amortization of lease concessions (net of reserve adjustment), intercompany rents and termination fees.(2) Represents all other sold properties that did not meet the criteria to be included in discontinued operations.(3) PNOI is adjusted to reflect a full quarter of operations for properties that were placed in service or acquired during the quarter.
12

Non-GAAP Reconciliation - PNOI(unaudited and in thousands)
Three Months Ended June 30, 2021
Wholly Owned and Joint Venture In-Service Logistics Portfolio: Rental revenues from continuing operations $ 252,511 (1) Rental and real estate tax expenses from continuing operations (59,517) (2) Less: Straight line rental income and expense (6,448) Other adjustments (2,196) (3) PNOI, continuing operations, before joint ventures 184,350 Less: noncontrolling interest share of consolidated joint venture PNOI (273) Share of unconsolidated joint venture PNOI 5,382 PNOI, adjusted for joint ventures 189,459 Less: PNOI from sold properties (not in discontinued operations) (1,054) Proforma property level NOI adjustments 2,634 (4)Proforma PNOI- Total In-Service Logistics Portfolio $ 191,039
PNOI- In-Service Non-Core assets 968 PNOI- Other real estate investments not valued by income capitalization (pages 8 and 27) 222
Total Proforma PNOI $ 192,229
Logistics PNOI in NAV Components (page 27): Proforma PNOI- Total In-Service (as shown above) $ 191,039 Adjustment to exclude PNOI from July Property Sales/Contributions (proceeds included on page 27) (5,602) Adjustment to exclude negative PNOI related to "Stabilized Properties - Economic" 686 (5) Adjustment to exclude negative PNOI from "Stabilized Properties - Pre-Economic" 18 (6) Adjustment to exclude Unstabilized In-Service Properties (6) (7)
Total Stabilized Operating Portfolio Generating Positive NOI (market detail page 14; NAV page 27) $ 186,135
Note: NOI information is for the most recently completed three month period and includes only wholly owned and joint venture in-service properties at the end of the reporting period. Joint venture property NOI is shown at economic ownership percentage.
(1) Rental revenues from continuing operations as included in the segment reporting disclosures in the notes to our consolidated financial statements. Revenues not allocated to reportable segments, which are not included above, totaled $181 for the three months ended June 30, 2021.
(2) Rental and real estate taxes as used in the computation of PNOI from the segment reporting disclosures in the notes to our consolidated financial statements. Rental expenses and real estate taxes not allocated to reportable segments, which are not included above, totaled $60 for the three months ended June 30, 2021.
(3) Represents adjustments to add back intercompany rents and to remove the amortization of above and below market rents, amortization of lease concessions, lease termination fees and PNOI from other real estate investments not valued by income capitalization.
(4) NOI is adjusted to reflect a full quarter of operations for properties that were placed in service or acquired during the quarter.
(5) These properties are included in NAV Components on page 27 in the Real Estate Not Valued by Income Capitalization section at their total gross book basis of $64,965 as of the current quarter ended.
(6) These properties are included in NAV Components on page 27 at an estimated stabilized PNOI amount in the Real Estate Properties Valued by Income Capitalization section.
(7) These unstabilized in-service properties which have been in-service less than one year are included in NAV Components on page 27 at an estimated stabilized PNOI amount in the Real Estate Properties Valued by Income Capitalization section.
13

PNOI and Occupancy Metrics(dollars and SF in thousands and shown at economic ownership %)
MarketNOI at Economic
Ownership % % of NOI
Square Feet at Economic
Ownership %
3-Month Avg. PercentageOccupied
Ending Percentage Occupied
Ending Percentage
LeasedSouthern California $ 22,596 12.1 % 14,482 100.0 % 100.0 % 100.0 %New Jersey 17,975 9.7 % 7,464 100.0 % 100.0 % 100.0 %South Florida 17,457 9.4 % 8,357 99.3 % 99.0 % 99.5 %Chicago 15,194 8.2 % 14,539 97.8 % 98.6 % 99.8 %Dallas 14,065 7.5 % 13,756 98.9 % 98.9 % 98.9 %Atlanta 13,347 7.2 % 13,044 98.8 % 99.7 % 99.7 %Indianapolis 10,791 5.8 % 11,632 99.1 % 99.1 % 99.2 %Cincinnati 8,052 4.3 % 8,723 95.1 % 91.7 % 94.6 %Savannah 8,023 4.3 % 7,330 98.9 % 96.6 % 96.6 %Pennsylvania 7,427 4.0 % 5,685 100.0 % 100.0 % 100.0 %Houston 7,275 3.9 % 5,824 94.6 % 97.1 % 97.1 %Minneapolis-St. Paul 6,624 3.6 % 4,986 98.5 % 98.5 % 98.5 %Central Florida 6,372 3.4 % 4,332 99.1 % 98.2 % 98.5 %Seattle 5,840 3.1 % 3,025 100.0 % 100.0 % 100.0 %DC / Baltimore 5,756 3.1 % 3,283 98.7 % 98.7 % 98.7 %Nashville 5,253 2.8 % 3,645 96.0 % 96.2 % 97.3 %
Columbus 4,980 2.7 % 5,320 100.0 % 100.0 % 100.0 %Raleigh 4,827 2.6 % 2,850 99.6 % 99.6 % 99.6 %Northern California 4,281 2.3 % 2,333 100.0 % 100.0 % 100.0 %
Total $ 186,135 100.0 % 140,610 98.6 % 98.5 % 98.9 %
The following properties have been removed from the market summary above: (i) Fourteen properties in St. Louis (which accounted for $4.3M of quarterly NOI), which were subsequently sold in July, and (ii) 80% of NOI on three properties, representing Tranche 1 of the recently formed joint venture with CBREGI ($1.3M of quarterly NOI) in which we will retain a 20% interest, which were subsequently contributed to this joint venture in July.
NOI from the properties to be contributed as part of Tranches 2 and 3 of the newly formed joint venture is fully included in the table above (see page 8 for additional information).
Note: This schedule provides supplemental information for the stabilized logistics properties generating positive NOI for the three months ended June 30, 2021 as shown on page 13.
Note: Percentage occupied represents the percentage of total square feet where the leases have commenced.
Note: Percentage leased represents the percentage of total square feet where the leases have been executed, without regard to whether the leases have commenced.
14
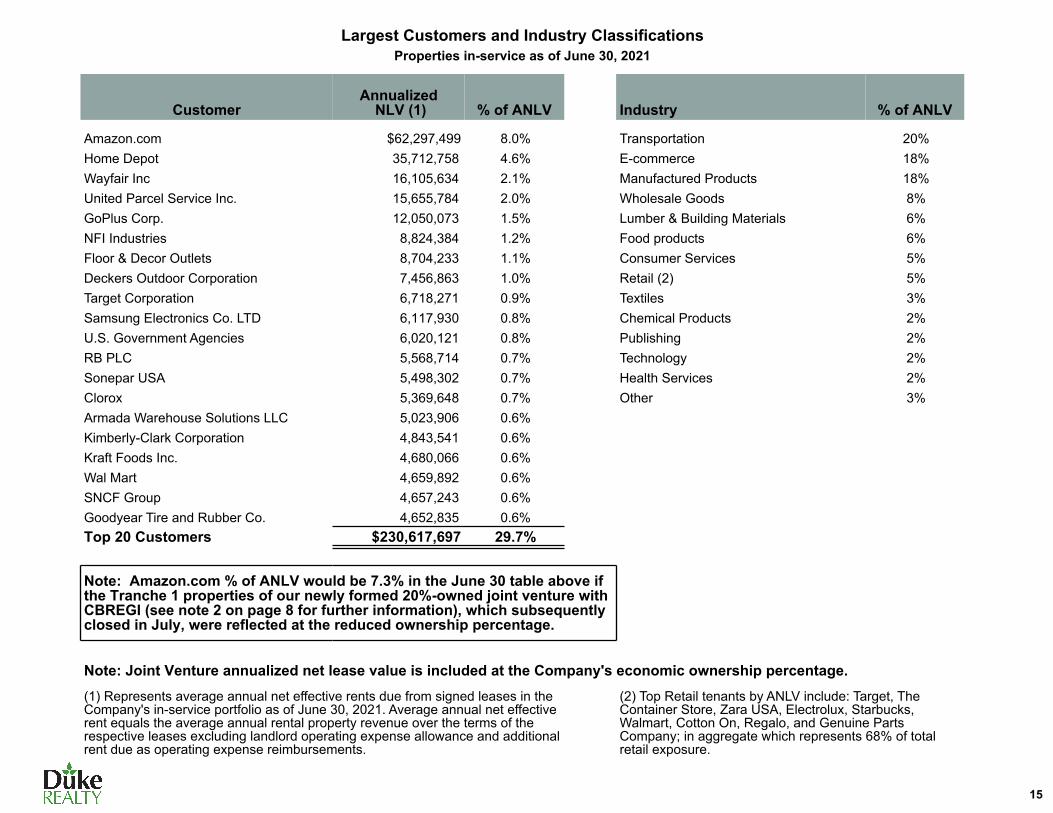
Largest Customers and Industry ClassificationsProperties in-service as of June 30, 2021
CustomerAnnualized
NLV (1) % of ANLV Industry % of ANLV
Amazon.com $62,297,499 8.0% Transportation 20%Home Depot 35,712,758 4.6% E-commerce 18%Wayfair Inc 16,105,634 2.1% Manufactured Products 18%United Parcel Service Inc. 15,655,784 2.0% Wholesale Goods 8%GoPlus Corp. 12,050,073 1.5% Lumber & Building Materials 6%NFI Industries 8,824,384 1.2% Food products 6%Floor & Decor Outlets 8,704,233 1.1% Consumer Services 5%Deckers Outdoor Corporation 7,456,863 1.0% Retail (2) 5%Target Corporation 6,718,271 0.9% Textiles 3%Samsung Electronics Co. LTD 6,117,930 0.8% Chemical Products 2%U.S. Government Agencies 6,020,121 0.8% Publishing 2%RB PLC 5,568,714 0.7% Technology 2%Sonepar USA 5,498,302 0.7% Health Services 2%Clorox 5,369,648 0.7% Other 3%Armada Warehouse Solutions LLC 5,023,906 0.6%Kimberly-Clark Corporation 4,843,541 0.6%Kraft Foods Inc. 4,680,066 0.6%Wal Mart 4,659,892 0.6%SNCF Group 4,657,243 0.6%Goodyear Tire and Rubber Co. 4,652,835 0.6%Top 20 Customers $230,617,697 29.7%
Note: Amazon.com % of ANLV would be 7.3% in the June 30 table above if the Tranche 1 properties of our newly formed 20%-owned joint venture with CBREGI (see note 2 on page 8 for further information), which subsequently closed in July, were reflected at the reduced ownership percentage.
Note: Joint Venture annualized net lease value is included at the Company's economic ownership percentage.(1) Represents average annual net effective rents due from signed leases in the Company's in-service portfolio as of June 30, 2021. Average annual net effective rent equals the average annual rental property revenue over the terms of the respective leases excluding landlord operating expense allowance and additional rent due as operating expense reimbursements.
(2) Top Retail tenants by ANLV include: Target, The Container Store, Zara USA, Electrolux, Starbucks, Walmart, Cotton On, Regalo, and Genuine Parts Company; in aggregate which represents 68% of total retail exposure.
15
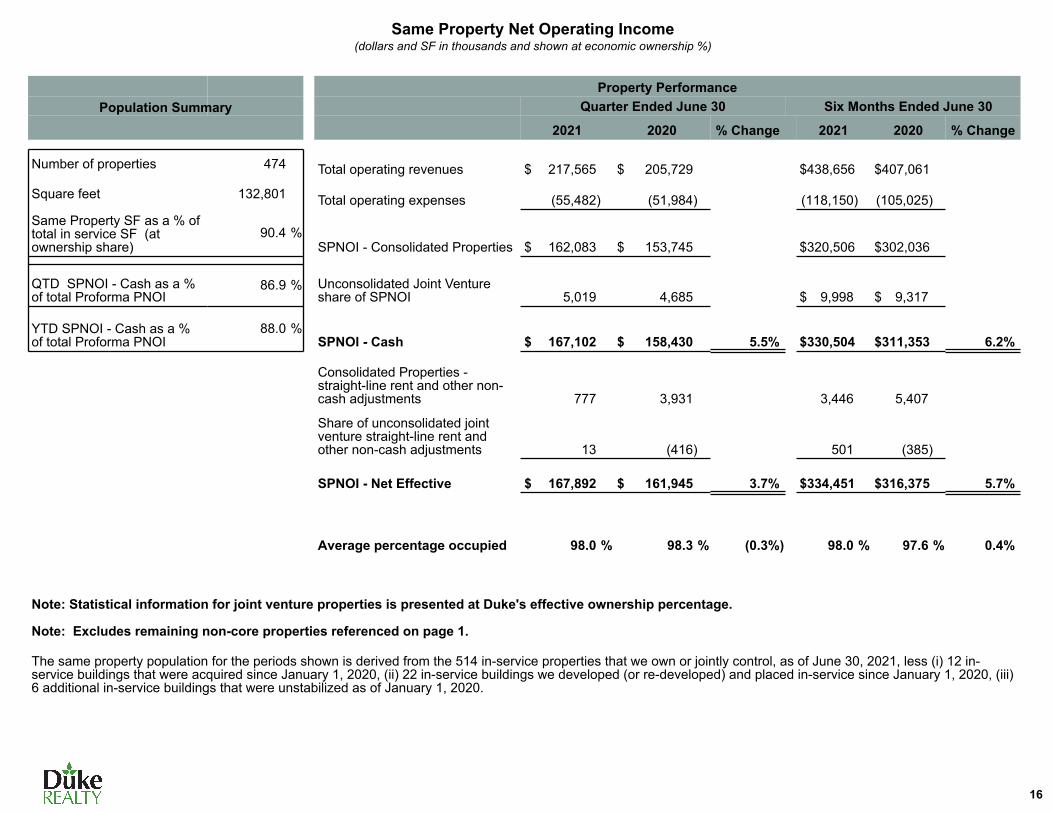
Same Property Net Operating Income(dollars and SF in thousands and shown at economic ownership %)
Population SummaryProperty Performance
Quarter Ended June 30 Six Months Ended June 30
2021 2020 % Change 2021 2020 % Change
Number of properties 474 Total operating revenues $ 217,565 $ 205,729 $ 438,656 $ 407,061
Square feet 132,801 Total operating expenses (55,482) (51,984) (118,150) (105,025) Same Property SF as a % of total in service SF (at ownership share)
90.4 %SPNOI - Consolidated Properties $ 162,083 $ 153,745 $ 320,506 $ 302,036
QTD SPNOI - Cash as a % of total Proforma PNOI
86.9 % Unconsolidated Joint Venture share of SPNOI 5,019 4,685 $ 9,998 $ 9,317
YTD SPNOI - Cash as a % of total Proforma PNOI
88.0 %SPNOI - Cash $ 167,102 $ 158,430 5.5% $ 330,504 $ 311,353 6.2%
Consolidated Properties - straight-line rent and other non-cash adjustments 777 3,931 3,446 5,407
Share of unconsolidated joint venture straight-line rent and other non-cash adjustments 13 (416) 501 (385)
SPNOI - Net Effective $ 167,892 $ 161,945 3.7% $ 334,451 $ 316,375 5.7%
Average percentage occupied 98.0 % 98.3 % (0.3%) 98.0 % 97.6 % 0.4%
Note: Statistical information for joint venture properties is presented at Duke's effective ownership percentage.
Note: Excludes remaining non-core properties referenced on page 1.
The same property population for the periods shown is derived from the 514 in-service properties that we own or jointly control, as of June 30, 2021, less (i) 12 in-service buildings that were acquired since January 1, 2020, (ii) 22 in-service buildings we developed (or re-developed) and placed in-service since January 1, 2020, (iii) 6 additional in-service buildings that were unstabilized as of January 1, 2020.
16

Lease ExpirationsIn-Service Properties as of June 30, 2021
(dollars and square feet in thousands)
Wholly Owned Joint Venture Total In-Service Portfolio
Square FeetAvg. Annual Rental
Revenue (1) Square FeetAvg. Annual Rental
Revenue (1) Square FeetAvg. Annual Rental
Revenue (1)Year of Expiration2021 3,104 $14,520 244 $1,108 3,348 $15,6282022 15,284 64,960 313 1,296 15,597 66,256 2023 15,253 76,981 434 1,883 15,687 78,864 2024 15,258 79,486 646 3,189 15,904 82,675 2025 15,601 85,569 360 1,729 15,961 87,298 2026 15,992 81,219 383 1,746 16,375 82,965 2027 12,644 64,361 260 1,339 12,904 65,700 2028 10,373 65,192 374 1,551 10,747 66,743 2029 8,174 44,811 1,000 3,566 9,174 48,377 2030 8,616 46,562 348 1,747 8,964 48,309
2031 and Thereafter 18,678 131,428 613 2,623 19,291 134,051 138,977 $755,089 4,975 $21,777 143,952 $776,866
Total Square Feet 141,835 5,126 146,961 Percent Leased 98.0 % 97.1 % 98.0 %Average Remaining Lease Term (by SF) 5.5 5.8 5.5 Average Remaining Lease Term (by ANLV) 6.0 5.7 6.0
Note: Joint Venture square feet and dollars shown at the Company's economic ownership percentage.
Note: Excludes remaining non-core properties referenced on page 1.(1) Annualized rental revenue represents average annual base rental payments, on a straight-line basis for the term of each lease, from space leased to tenants at the end of the most recent reporting period. Annualized rental revenue excludes amounts paid by tenants as reimbursement for operating expenses and real estate taxes.
% of Expiring Leases: Total In-Service Portfolio
2%
11% 11% 11% 11% 12%
9% 8%6% 6%
13%
2%
9% 10% 11% 11% 11%
8% 9%6% 6%
17%
% of Leased Square Feet % of Annualized Rental Revenue
2021 2022 2023 2024 2025 2026 2027 2028 2029 2030 Thereafter
17
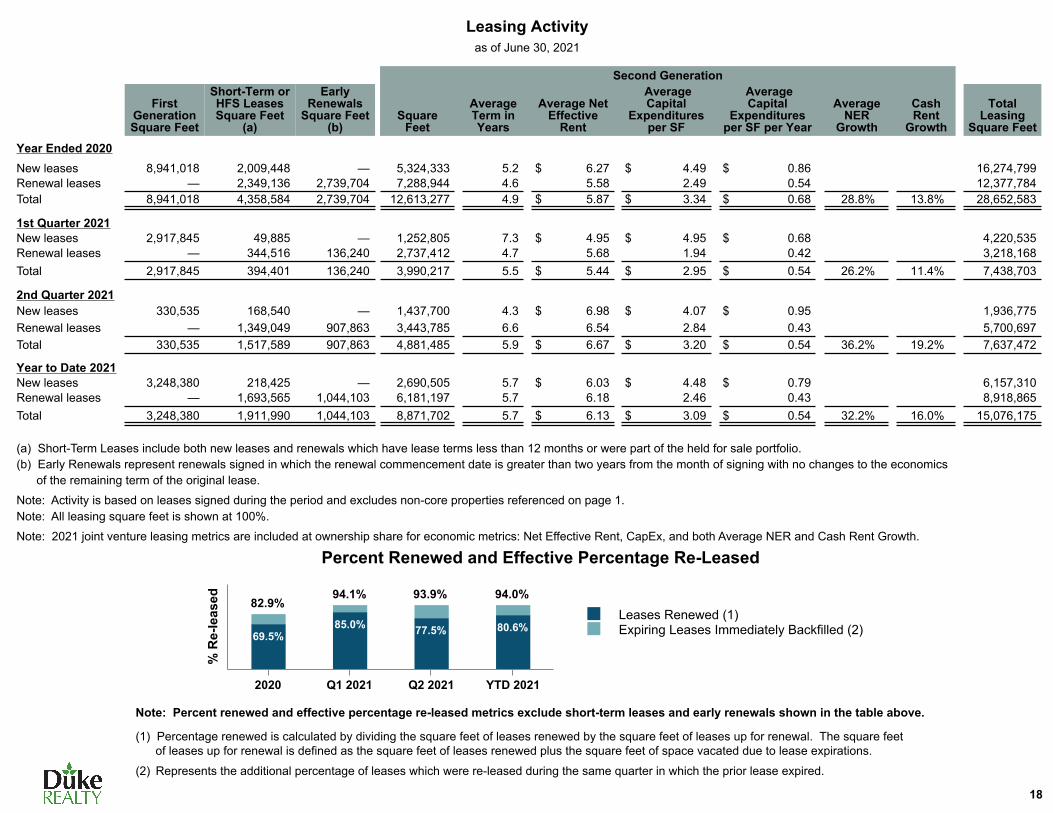
Leasing Activityas of June 30, 2021
Second Generation
First Generation Square Feet
Short-Term or HFS Leases Square Feet
(a)
Early Renewals
Square Feet (b)
Square Feet
Average Term in Years
Average Net Effective
Rent
Average Capital
Expenditures per SF
Average Capital
Expenditures per SF per Year
Average NER
Growth
Cash Rent
Growth
Total Leasing
Square Feet
Year Ended 2020New leases 8,941,018 2,009,448 — 5,324,333 5.2 $ 6.27 $ 4.49 $ 0.86 16,274,799 Renewal leases — 2,349,136 2,739,704 7,288,944 4.6 5.58 2.49 0.54 12,377,784 Total 8,941,018 4,358,584 2,739,704 12,613,277 4.9 $ 5.87 $ 3.34 $ 0.68 28.8% 13.8% 28,652,583
1st Quarter 2021New leases 2,917,845 49,885 — 1,252,805 7.3 $ 4.95 $ 4.95 $ 0.68 4,220,535 Renewal leases — 344,516 136,240 2,737,412 4.7 5.68 1.94 0.42 3,218,168 Total 2,917,845 394,401 136,240 3,990,217 5.5 $ 5.44 $ 2.95 $ 0.54 26.2% 11.4% 7,438,703
2nd Quarter 2021New leases 330,535 168,540 — 1,437,700 4.3 $ 6.98 $ 4.07 $ 0.95 1,936,775 Renewal leases — 1,349,049 907,863 3,443,785 6.6 6.54 2.84 0.43 5,700,697 Total 330,535 1,517,589 907,863 4,881,485 5.9 $ 6.67 $ 3.20 $ 0.54 36.2% 19.2% 7,637,472
Year to Date 2021New leases 3,248,380 218,425 — 2,690,505 5.7 $ 6.03 $ 4.48 $ 0.79 6,157,310 Renewal leases — 1,693,565 1,044,103 6,181,197 5.7 6.18 2.46 0.43 8,918,865 Total 3,248,380 1,911,990 1,044,103 8,871,702 5.7 $ 6.13 $ 3.09 $ 0.54 32.2% 16.0% 15,076,175
(a) Short-Term Leases include both new leases and renewals which have lease terms less than 12 months or were part of the held for sale portfolio.(b) Early Renewals represent renewals signed in which the renewal commencement date is greater than two years from the month of signing with no changes to the economics of the remaining term of the original lease.
Note: Activity is based on leases signed during the period and excludes non-core properties referenced on page 1.Note: All leasing square feet is shown at 100%.
Note: 2021 joint venture leasing metrics are included at ownership share for economic metrics: Net Effective Rent, CapEx, and both Average NER and Cash Rent Growth.
% R
e-le
ased
Percent Renewed and Effective Percentage Re-Leased
82.9%82.9%94.1%94.1% 93.9%93.9% 94.0%94.0%
69.5%85.0% 77.5% 80.6%
Leases Renewed (1)Expiring Leases Immediately Backfilled (2)
2020 Q1 2021 Q2 2021 YTD 2021
(1) Percentage renewed is calculated by dividing the square feet of leases renewed by the square feet of leases up for renewal. The square feet of leases up for renewal is defined as the square feet of leases renewed plus the square feet of space vacated due to lease expirations.
(2) Represents the additional percentage of leases which were re-leased during the same quarter in which the prior lease expired.
Note: Percent renewed and effective percentage re-leased metrics exclude short-term leases and early renewals shown in the table above.
18

$2,385 $4,646
$254,893 $305,155
$5,102
$643,238
$2,533,158
2021 2022 2023 2024 2025 2026 Thereafter
(1) Scheduled amortizations and maturities represent only Duke's consolidated debt obligations.
Debt MaturitiesJune 30, 2021
(in thousands)
Weighted Average Effective Interest
RatesMortgages (1) Unsecured (1)
Credit Facility (2)Year Amortization Maturities Amortization Maturities Total
2021 $ 2,385 $ — $ — $ — $ — $ 2,385 4.84%
2022 4,646 — — — — 4,646 5.18%
2023 4,893 — — 250,000 (3) — 254,893 3.75%2024 5,155 — — 300,000 — 305,155 3.92%
2025 5,102 — — — — 5,102 5.08%
2026 3,238 — — 375,000 265,000 643,238 3.38%2027 1,615 — — 475,000 — 476,615 3.18%
2028 1,307 — — 500,000 — 501,307 4.45%2029 1,359 — — 400,000 — 401,359 3.96%
2030 1,413 — — 350,000 — 351,413 1.86%
2031 1,469 — — 450,000 — 451,469 1.84%Thereafter 3,261 22,734 — 325,000 — 350,995 3.26%
$ 35,843 $ 22,734 $ — $ 3,425,000 $ 265,000 $ 3,748,577 3.29%
Commitment Balance O/S @ 6/30 Maturity * Rate @ 6/30
$1,200,000 $265,000 March 2026 L + .775% (0.86%)
*Date shown is final maturity date including extension options.
Fixed and Variable Rate Weighted Average Interest
RateWeighted Average
Maturity (yrs)Components of Debt BalanceFixed Rate Secured Debt $56,977 4.67% 7.5Fixed Rate Unsecured Debt 3,425,000 3.27% 8.8Variable Rate Debt and LOC (4) 266,600 0.05% 4.7
$3,748,577 3.29% 8.5Deferred Financing Costs (38,097)
Fair Value Adjustments 3,672Total Debt per Balance Sheet $ 3,714,152
(2) Comprised of the following: Total Maturities (in thousands)
19
(3) Our 2023 notes have been called and will be retired in August.(4) Weighted average interest rate excludes credit facility.
(4)
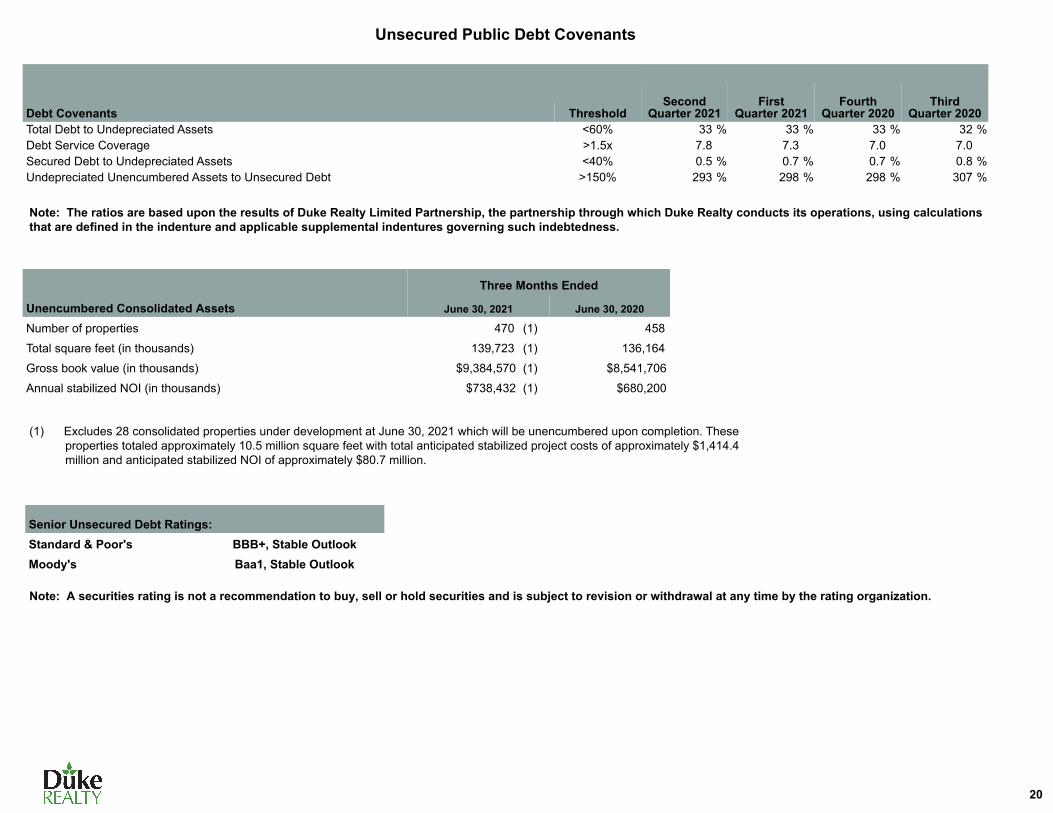
Unsecured Public Debt Covenants
SecondQuarter 2021
FirstQuarter 2021
FourthQuarter 2020
Third Quarter 2020Debt Covenants Threshold
Total Debt to Undepreciated Assets <60% 33 % 33 % 33 % 32 %Debt Service Coverage >1.5x 7.8 7.3 7.0 7.0 Secured Debt to Undepreciated Assets <40% 0.5 % 0.7 % 0.7 % 0.8 %Undepreciated Unencumbered Assets to Unsecured Debt >150% 293 % 298 % 298 % 307 %
Note: The ratios are based upon the results of Duke Realty Limited Partnership, the partnership through which Duke Realty conducts its operations, using calculations that are defined in the indenture and applicable supplemental indentures governing such indebtedness.
Three Months Ended
Unencumbered Consolidated Assets June 30, 2021 June 30, 2020
Number of properties 470 (1) 458
Total square feet (in thousands) 139,723 (1) 136,164
Gross book value (in thousands) $9,384,570 (1) $8,541,706
Annual stabilized NOI (in thousands) $738,432 (1) $680,200
Senior Unsecured Debt Ratings:Standard & Poor's BBB+, Stable OutlookMoody's Baa1, Stable Outlook
Note: A securities rating is not a recommendation to buy, sell or hold securities and is subject to revision or withdrawal at any time by the rating organization.
(1) Excludes 28 consolidated properties under development at June 30, 2021 which will be unencumbered upon completion. These properties totaled approximately 10.5 million square feet with total anticipated stabilized project costs of approximately $1,414.4 million and anticipated stabilized NOI of approximately $80.7 million.
20
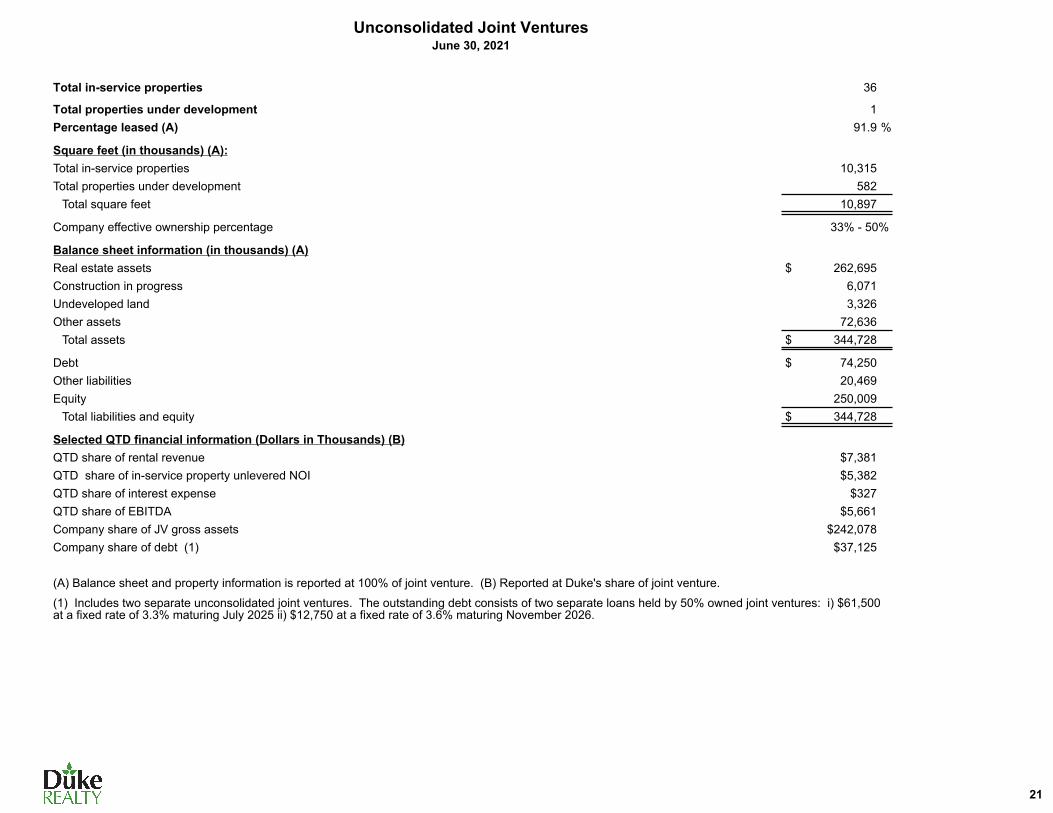
Unconsolidated Joint VenturesJune 30, 2021
Total in-service properties 36
Total properties under development 1 Percentage leased (A) 91.9 %
Square feet (in thousands) (A):Total in-service properties 10,315 Total properties under development 582
Total square feet 10,897
Company effective ownership percentage 33% - 50%
Balance sheet information (in thousands) (A)Real estate assets $ 262,695 Construction in progress 6,071 Undeveloped land 3,326 Other assets 72,636
Total assets $ 344,728
Debt $ 74,250 Other liabilities 20,469 Equity 250,009
Total liabilities and equity $ 344,728
Selected QTD financial information (Dollars in Thousands) (B)QTD share of rental revenue $7,381 QTD share of in-service property unlevered NOI $5,382 QTD share of interest expense $327 QTD share of EBITDA $5,661 Company share of JV gross assets $242,078 Company share of debt (1) $37,125
(A) Balance sheet and property information is reported at 100% of joint venture. (B) Reported at Duke's share of joint venture.
(1) Includes two separate unconsolidated joint ventures. The outstanding debt consists of two separate loans held by 50% owned joint ventures: i) $61,500 at a fixed rate of 3.3% maturing July 2025 ii) $12,750 at a fixed rate of 3.6% maturing November 2026.
21
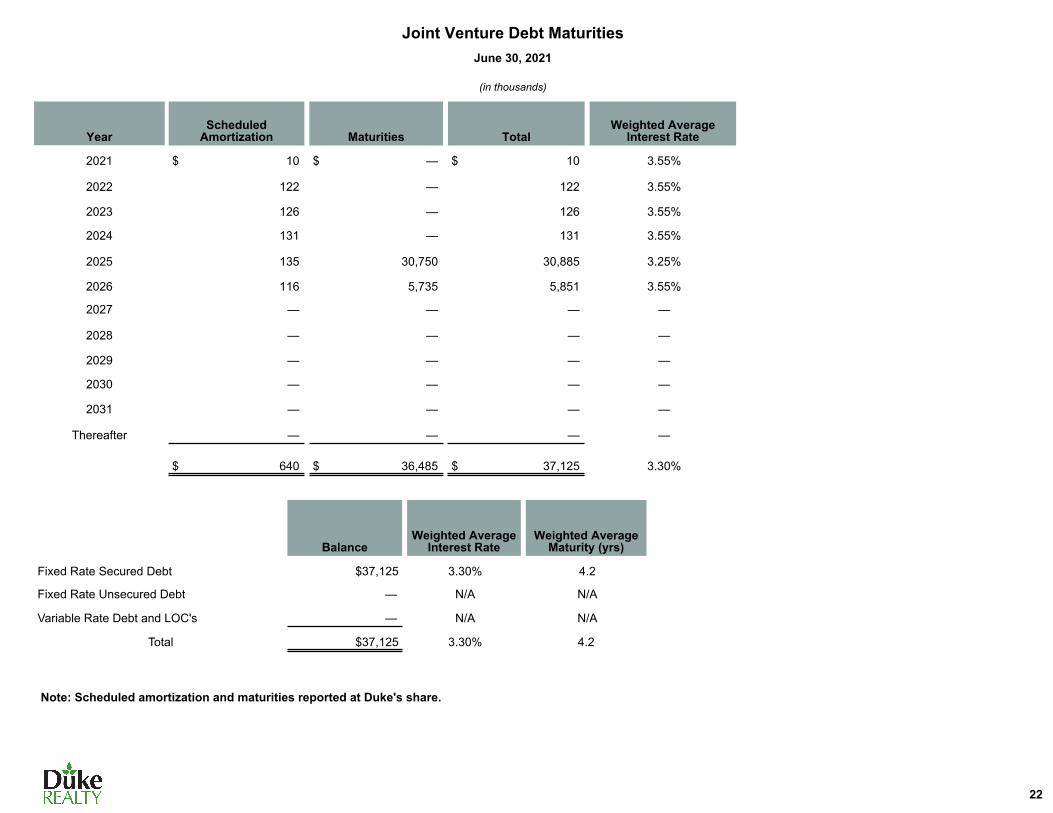
Joint Venture Debt MaturitiesJune 30, 2021
(in thousands)
YearScheduled
Amortization Maturities TotalWeighted Average
Interest Rate
2021 $ 10 $ — $ 10 3.55%
2022 122 — 122 3.55%
2023 126 — 126 3.55%
2024 131 — 131 3.55%
2025 135 30,750 30,885 3.25%
2026 116 5,735 5,851 3.55%
2027 — — — —
2028 — — — —
2029 — — — —
2030 — — — —
2031 — — — —
Thereafter — — — —
$ 640 $ 36,485 $ 37,125 3.30%
BalanceWeighted Average
Interest RateWeighted Average
Maturity (yrs)
Fixed Rate Secured Debt $37,125 3.30% 4.2
Fixed Rate Unsecured Debt — N/A N/A
Variable Rate Debt and LOC's — N/A N/A
Total $37,125 3.30% 4.2
Note: Scheduled amortization and maturities reported at Duke's share.
22

Development Projects Under ConstructionJune 30, 2021
(in thousands)
Initial Projected InitialStabilized Costs Stabilized Stabilized
Square % Costs Remaining Cash GAAPDevelopment Market Own % Feet Leased (Own %) (Own %) Yield Yield
13344 S Main Street Southern California 100% 290 100%
AllPoints Midwest Bldg. 12A Indianapolis 100% 517 100%
Sunridge Blvd Dallas 100% 432 100%
150 Old New Brunswick Road New Jersey 100% 622 100%
10415 8th Street Southern California 100% 121 100%
Park 70 East at West Jeff 6400 Columbus 100% 517 100%
1510 Puyallup Street Seattle 100% 190 0%
Miami 27 Business Park 10310 South Florida 100% 222 72%
728 W. Rider Street Southern California 100% 1,204 0%
13215 Cambridge Street Southern California 100% 147 100% Estimated Value CreationMiami 27 Business Park 10300 South Florida 100% 501 0% Low Mid High
Projected In-Service 3rd Qtr. 2021 4,763 59% $642,084 Value Value Value
6450 Katella Ave Southern California 100% 146 100% Annual Stabilized NOI $82,086 $82,086 $82,086
16825 Murphy Parkway Northern California 100% 347 0% Blended cap rate (1) 3.99% 3.84% 3.69%
Camp Creek 6200 Atlanta 100% 318 100% Implied value (Own %) $2,057,293 $2,137,656 $2,224,553
2000 Centre Court Atlanta 100% 239 0% Value creation (Own %) $622,870 $703,233 $790,130
Projected In-Service 4th Qtr. 2021 1,050 44% $170,157 Margin 43% 49% 55%
Vineyard 1532 Southern California 100% 199 0%
110 North 25th Avenue Chicago 100% 300 0% (1) Midpoint cap rate represents weighted average estimated cap rates. High and low represent sensitivity analysis of +/- 15 basis points.
Tampa Regional Ind Park 13010 Central Florida 100% 112 100%
60 Triple B Trail Savannah 100% 820 0%
10000 Woodward Ave. Chicago 100% 371 0%
RGLP Rail 1417 Columbus 50% 582 0%
10905 Beech Ave Southern California 100% 173 0%
Orange Avenue (3 Buildings) Southern California 100% 163 0%
2256 Junction Ave Northern California 100% 141 100%
Projected In-Service 1st Qtr. 2022 2,861 9% $337,001
6600 W 68th Street Chicago 100% 655 100%
13131 Los Angeles Street Southern California 100% 529 0%
Airport Logistics Center III Chicago 100% 1,200 100%
Projected In-Service 2nd Qtr. 2022 or beyond 2,384 78% $ 285,181 #REF!
Company Total 11,058 49% $ 1,434,423 $ 520,203 5.7 % 6.3%
23

Development Project Deliveries(in thousands)
Wholly Owned Joint Venture Total
Initial Stabilized Initial Stabilized Initial Stabilized
Square Feet
% Leased at Start
% Leased Current
Project Costs
Cash Yield
GAAP Yield
Square Feet
% Leased at Start
% Leased Current
Project Costs
Cash Yield
GAAP Yield
Square Feet
% Leased at Start
% Leased Current
% Occupied Current
Project Costs
Cash Yield
GAAP Yield
2020:
1st Quarter 336 54 % 100 % $ 35,790 5.8 % 6.4 % 211 98 % 100 % $ 17,787 7.7 % 8.6 % 547 71 % 100 % 100 % $ 53,578 6.4 % 7.1 %
2nd Quarter 3,225 45 % 98 % 262,693 6.2 % 6.8 % — — — — — — 3,225 45 % 98 % 98 % 262,693 6.2 % 6.8 %
3rd Quarter 1,484 35 % 100 % 188,189 5.9 % 6.9 % — — — — — — 1,484 35 % 100 % 100 % 188,189 5.9 % 6.9 %
4th Quarter 1,727 100 % 100 % 216,784 5.6 % 6.9 % 358 100 % 100 % 10,411 6.7 % 6.6 % 2,084 100 % 100 % 100 % 227,195 5.7 % 6.9 %
2020 Total 6,772 57 % 99 % $ 703,456 5.9 % 6.8 % 569 99 % 100 % $ 28,198 7.3 % 7.9 % 7,341 61 % 99 % 99 % $ 731,654 6.0 % 6.9 %
2021:
1st Quarter 873 76 % 100 % $ 114,212 5.5 % 5.9 % — — — — — — 873 76 % 100 % 76 % $ 114,212 5.5 % 5.9 %
2nd Quarter 1,494 28 % 100 % 162,337 5.6 % 6.0 % — — — — — — 1,494 28 % 100 % 100 % 162,337 5.6 % 6.0 %
2021 Total YTD 2,367 46 % 100 % $ 276,549 5.6 % 6.0 % — — — — — — 2,367 46 % 100 % 91 % $ 276,549 5.6 % 6.0 %
Note: Square feet for Joint Venture projects is shown at 100%; Project costs & returns included at ownership share.
$731,654
$361,297
2020 Total: 49%
Estimated Value Creation of Deliveries
$162,337
$75,280
Initial Stabilized Project Costs (000s)
Estimated Value Creation (000s)
Q2 2021 : 46%
24
$276,549
$119,596
YTD 2021 : 43%
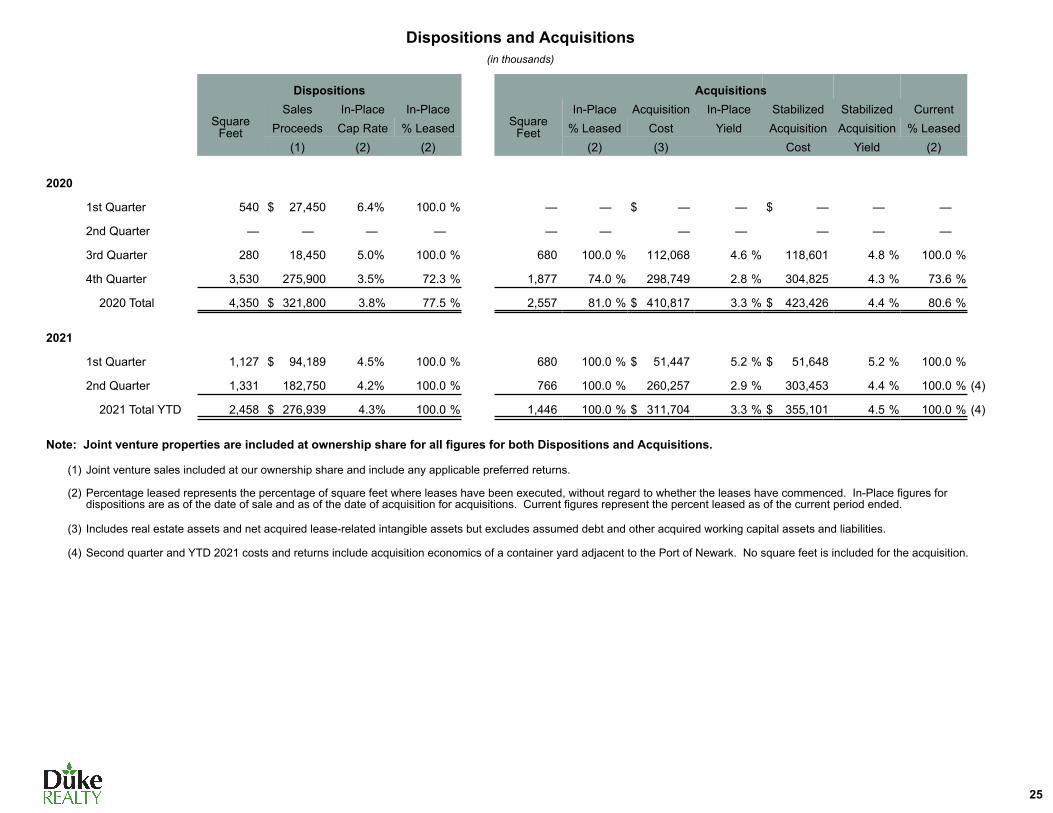
Dispositions and Acquisitions(in thousands)
Dispositions Acquisitions
Square Feet
Sales In-Place In-PlaceSquare
Feet
In-Place Acquisition In-Place Stabilized Stabilized CurrentProceeds Cap Rate % Leased % Leased Cost Yield Acquisition Acquisition % Leased
(1) (2) (2) (2) (3) Cost Yield (2)
2020
1st Quarter 540 $ 27,450 6.4% 100.0 % — — $ — — $ — — —
2nd Quarter — — — — — — — — — — —
3rd Quarter 280 18,450 5.0% 100.0 % 680 100.0 % 112,068 4.6 % 118,601 4.8 % 100.0 %
4th Quarter 3,530 275,900 3.5% 72.3 % 1,877 74.0 % 298,749 2.8 % 304,825 4.3 % 73.6 %
2020 Total 4,350 $ 321,800 3.8 % 77.5 % 2,557 81.0 % $ 410,817 3.3 % $ 423,426 4.4 % 80.6 %
2021
1st Quarter 1,127 $ 94,189 4.5% 100.0 % 680 100.0 % $ 51,447 5.2 % $ 51,648 5.2 % 100.0 %
2nd Quarter 1,331 182,750 4.2% 100.0 % 766 100.0 % 260,257 2.9 % 303,453 4.4 % 100.0 % (4)
2021 Total YTD 2,458 $ 276,939 4.3 % 100.0 % 1,446 100.0 % $ 311,704 3.3 % $ 355,101 4.5 % 100.0 % (4)
Note: Joint venture properties are included at ownership share for all figures for both Dispositions and Acquisitions.
(1) Joint venture sales included at our ownership share and include any applicable preferred returns.
(2) Percentage leased represents the percentage of square feet where leases have been executed, without regard to whether the leases have commenced. In-Place figures for dispositions are as of the date of sale and as of the date of acquisition for acquisitions. Current figures represent the percent leased as of the current period ended.
(3) Includes real estate assets and net acquired lease-related intangible assets but excludes assumed debt and other acquired working capital assets and liabilities.
(4) Second quarter and YTD 2021 costs and returns include acquisition economics of a container yard adjacent to the Port of Newark. No square feet is included for the acquisition.
25

Land Held for DevelopmentJune 30, 2021
Potential BookNet Development Basis
Market Acres Square Feet (000s)
Undeveloped
Southern California 152 3,011,000
Dallas 24 653,000
Northern California 25 453,000
(1) Indianapolis 22 373,000
Chicago 24 348,000
Atlanta 41 342,000
Seattle 12 261,000
Minneapolis-St. Paul 9 221,000
New Jersey 21 220,000 South Florida 9 149,000 Savannah 10 113,000
Total Undeveloped 349 6,144,000 $334,797
Other Real Estate Investments (2)
New Jersey 15 267,000
Northern California 10 220,000
South Florida 10 149,000 Total Other Real Estate Investments 35 636,000 $54,192
(1) Includes 50% share of development land owned in joint ventures as disclosed on page 21.
(2) Consists of underutilized in-fill sites, which may have had buildings/structures on site when we acquired them, that are either (i) under lease to a third party and, after the lease ends, are expected to be redeveloped or will require significant capital expenditures before re-leasing; or (ii) industrial/logistics properties that we intend to re-lease after significant retrofitting and/or environmental remediation is completed.
(3) Based on Book Basis and includes undeveloped and other real estate investments combined.
Purchase/Development Options
Approximately 600 acres which can support the development of 10 million square feet of future development are controlled via purchase options in Columbus, Ohio. These acres and square feet are disclosed at ownership percentage, and are not included in either table of owned land above.
Book Basis GeographicConcentration (3)
97%
2% 1%
Coastal Tier 1 marketsNon-Coastal Tier 1 marketsOther major markets
26

Components of Net Asset ValueJune 30, 2021
(unaudited and in thousands)
Real Estate Properties Valued by Income Capitalization - Current Quarter Services Operations Net Income
Total stabilized properties generating positive NOI (page 13), (A) $ 186,135 Mid-Point of 2021 Full Year Guidance $ 10,000
Stabilized Properties - Future Additional PNOI Other Assets
Commenced Leases in Free Rent Period $ 1,951 Signed Leases Not Commenced for Entire Period 1,194 Cash (2) $ 8,252 Total Embedded PNOI $ 3,145 Restricted Cash Held for Like-Kind Exchange (2) 2,802 Estimated PNOI from remaining lease-up of "Stabilized Properties - Pre-Economic" 445 Accounts Receivable and Construction Receivables (2) 71,388 Additional PNOI - Stabilized Properties (A) $ 3,590 Notes Receivable (4) 84,072
Prepaid Expense and Other Assets (4) 132,543 Total Stabilized PNOI - Sum of (A) above $ 189,725 Subtotal Other Assets $ 299,057
Unstabilized Properties - Estimated PNOI upon Stabilization $ 813 Liabilities Total Debt, excluding deferred financing costs (page 10) $ 3,752,249
Non-Core Real Estate NOI $ 968 Share of JV Debt (page 21) 37,125 Other Tangible Liabilities (5) 376,769 Total Liabilities $4,166,143
Real Estate Not Valued Above by Income Capitalization Outstanding Shares and Share EquivalentsCommon Shares Outstanding (page 9) 378,021
Gross book value of "Stabilized Properties - Economic" with negative NOI (page 13) $ 64,965 Partnership Units Outstanding (page 9) 3,762 Other Potentially Dilutive Securities (page 7) 1,811
Estimated Proceeds from July Property Sales/Contributions (1) $ 413,760 383,594
Development and Land Notes Wholly Owned CIP (2) $ 913,241 (1) Consists of (i) $290 million in net proceeds from the sale of our remaining properties in St. Louis
(see further description on page 8), that were subsequently sold in July and (ii) $124 million, representing our share of the net proceeds from the first tranche of the contribution of properties (leased to Amazon), with our share of joint venture finance proceeds excluded, to a 20%-owned unconsolidated joint venture with CBREGI (see further description on page 8) that subsequently closed in July. All of the NOI from the St. Louis properties, and 80% of the NOI from the first tranche of properties contributed to the new joint venture, is excluded from the section above titled "Real Estate Properties Value by Income Capitalization - Current Quarter".
The expected proceeds from the second and third tranches of properties to be contributed to the new joint venture are not included herein and the NOI from those properties is included in the section above titled "Real Estate Properties Value by Income Capitalization - Current Quarter".
Share of JV CIP 3,036 Estimated Development Value Creation at Own % (page 23) 703,233 Other Real Estate Assets (3) 54,192 Wholly Owned Development Land (2) 333,135 Wholly Owned Sale Land (2) 2,087 Share of JV Land 1,663
$ 2,010,587 (2) As shown on Balance Sheets (page 4).
(3) Book value of "other real estate assets" as described on page 8.
(4) "Notes receivable" and "Prepaid expenses and other assets", as shown on the Other Assets section on page 8.(5) Consists of construction payables, accrued real estate taxes, accrued interest and tenant security deposits (all as separately presented on the Balance Sheets on page 4) plus "operating accruals" and "costs to complete and other cash obligations" as shown on the Other Liabilities section on page 8.
27

28
2021 Range of Estimates
(dollars in millions except per share amounts) Metrics
2020 2021 Range of Estimates Key Assumptions Actual YTD Pessimistic Optimistic
Net Income per Share Attributable to Common Shareholders - Diluted
$0.80 $0.68 $2.13 $2.39 – Previous guidance in a range of $1.86 to $2.24 per share.– Higher gains on property sales in 2021 compared to 2020.
Nareit FFO per Share Attributable to Common Shareholders - Diluted
$1.40 $0.81 $1.62 $1.68 – Previous guidance in a range of $1.60 to $1.70 per share. – Quicker lease-up of new developments. – Less impact from debt transactions in 2021 compared to 2020.– Expense impact of internal leasing costs, $0.02 to $0.04.
Core FFO per Share Attributable to Common Shareholders - Diluted
$1.52 $0.83 $1.69 $1.73 – Previous guidance in a range of $1.65 to $1.71 per share.– Quicker lease-up of new developments.– Lower bad debt expense than previous estimates.– Strong rent growth.
Growth in AFFO - Share Adjusted 6.2% 8.6% 10.1% 13.0% – Previous guidance in a range of 8.0% to 12.3%.– Driven by same factors impacting Core FFO.
Average Percentage Leased(stabilized portfolio)
97.6% 98.2% 97.8% 98.6% – Previous guidance in a range of 97.2% to 98.6%. – Demand exceeding previous estimates.– Less downtime from troubled tenant move-outs than previous
estimates.Average Percentage Leased(In-service portfolio)
97.0% 97.7% 97.1% 97.9% – Previous guidance in a range of 96.3% to 97.7%.– Driven by same factors impacting stabilized portfolio. – Quicker leasing of speculative development.
Same Property NOI - Cash 5.0% 6.2% 4.75% 5.25% – Previous guidance in a range of 4.1% to 4.9%.– Increased occupancy from previous estimates.– Continued strong rent growth, embedded lease escalations.
Same Property NOI - Net Effective 2.8% 5.7% 3.75% 4.25% – Previous guidance in a range of 3.1% to 3.9%.– Less downtime from troubled tenant move-outs than previous
estimates.– Lower straight-line rent bad debt than 2020.
Building Acquisitions(Duke share)
$411 $312 $350 $550 – Previous guidance in a range of $300 to $500.– Coastal markets focus.
Building Dispositions(Duke share)
$322 $277 $1,000 $1,200 – Previous guidance in a range of $900 to $1,100.– Better pricing than previous estimates.– Manage tenant concentration.
Development Starts(JVs at 100%)
$796 $609 $1,100 $1,300 – Previous guidance in a range of $950 to $1,150.– Leasing success driving speculative activity.
Service Operations Income $6 $5 $9 $11 – Previous guidance in a range of $8 to $10.– Third party development.
General & Administrative Expense $58 $40 $65 $61 – Previous guidance in a range of $61 to $57.– Compensation commensurate with performance.– Excludes overhead restructuring costs.
Effective Leverage (Gross Book Basis) 32% 32% 33% 29%Fixed Charge Coverage (TTM) 5.6X 6.0X 5.8X 6.2X – Previous guidance in a range of 5.7X to 6.1X.
Net Debt to Core EBITDA (TTM) 5.2X 5.3X 5.2X 4.8X - Maintain Baa1/BBB+ ratings.