Duff & Phelps Restaurant Monthly Update - October 2016
21
1 October 2016 Restaurant Monthly Update
-
Upload
duff-phelps -
Category
Food
-
view
1.317 -
download
1
Transcript of Duff & Phelps Restaurant Monthly Update - October 2016

1
O c t o b e r 2 0 1 6
Restaurant Monthly Update
Duff & Phelps Restaurant Monthly Update | October 2016
Market Update K E Y
I N F O R M A T I O N
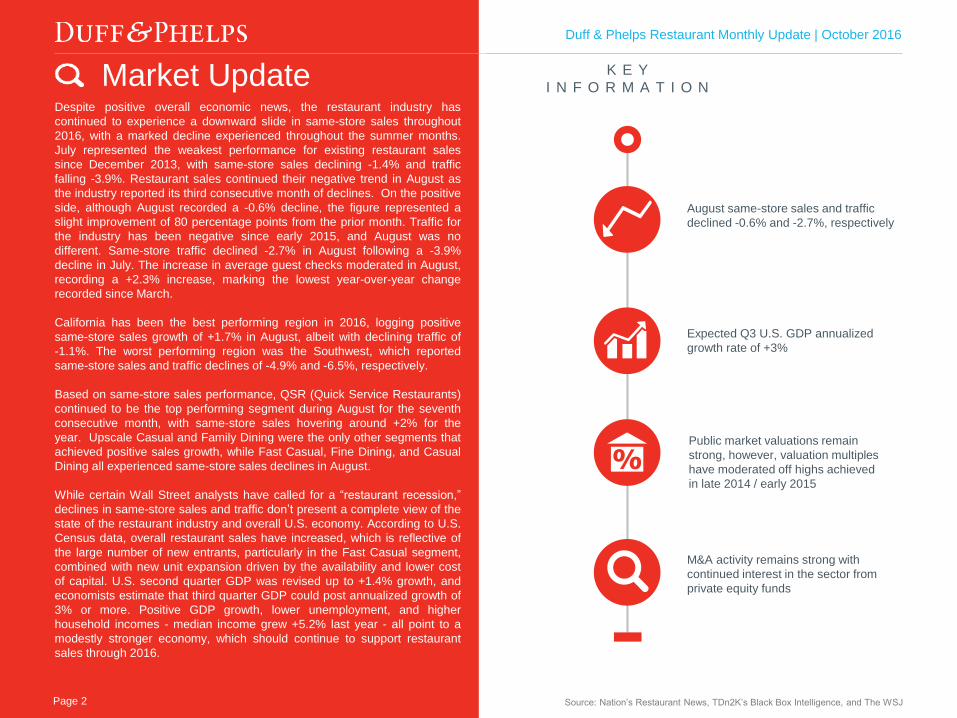
Expected Q3 U.S. GDP annualized
growth rate of +3%
August same-store sales and traffic
declined -0.6% and -2.7%, respectively
Public market valuations remain
strong, however, valuation multiples
have moderated off highs achieved
in late 2014 / early 2015
M&A activity remains strong with
continued interest in the sector from
private equity funds
Despite positive overall economic news, the restaurant industry has
continued to experience a downward slide in same-store sales throughout
2016, with a marked decline experienced throughout the summer months.
July represented the weakest performance for existing restaurant sales
since December 2013, with same-store sales declining -1.4% and traffic
falling -3.9%. Restaurant sales continued their negative trend in August as
the industry reported its third consecutive month of declines. On the positive
side, although August recorded a -0.6% decline, the figure represented a
slight improvement of 80 percentage points from the prior month. Traffic for
the industry has been negative since early 2015, and August was no
different. Same-store traffic declined -2.7% in August following a -3.9%
decline in July. The increase in average guest checks moderated in August,
recording a +2.3% increase, marking the lowest year-over-year change
recorded since March.
California has been the best performing region in 2016, logging positive
same-store sales growth of +1.7% in August, albeit with declining traffic of
-1.1%. The worst performing region was the Southwest, which reported
same-store sales and traffic declines of -4.9% and -6.5%, respectively.
Based on same-store sales performance, QSR (Quick Service Restaurants)
continued to be the top performing segment during August for the seventh
consecutive month, with same-store sales hovering around +2% for the
year. Upscale Casual and Family Dining were the only other segments that
achieved positive sales growth, while Fast Casual, Fine Dining, and Casual
Dining all experienced same-store sales declines in August.
While certain Wall Street analysts have called for a “restaurant recession,”
declines in same-store sales and traffic don’t present a complete view of the
state of the restaurant industry and overall U.S. economy. According to U.S.
Census data, overall restaurant sales have increased, which is reflective of
the large number of new entrants, particularly in the Fast Casual segment,
combined with new unit expansion driven by the availability and lower cost
of capital. U.S. second quarter GDP was revised up to +1.4% growth, and
economists estimate that third quarter GDP could post annualized growth of
3% or more. Positive GDP growth, lower unemployment, and higher
household incomes - median income grew +5.2% last year - all point to a
modestly stronger economy, which should continue to support restaurant
sales through 2016.
Source: Nation’s Restaurant News, TDn2K’s Black Box Intelligence, and The WSJ Page 2
Capital Markets Industry Insights | Q1 2016 Duff & Phelps Restaurant Monthly Update | October 2016
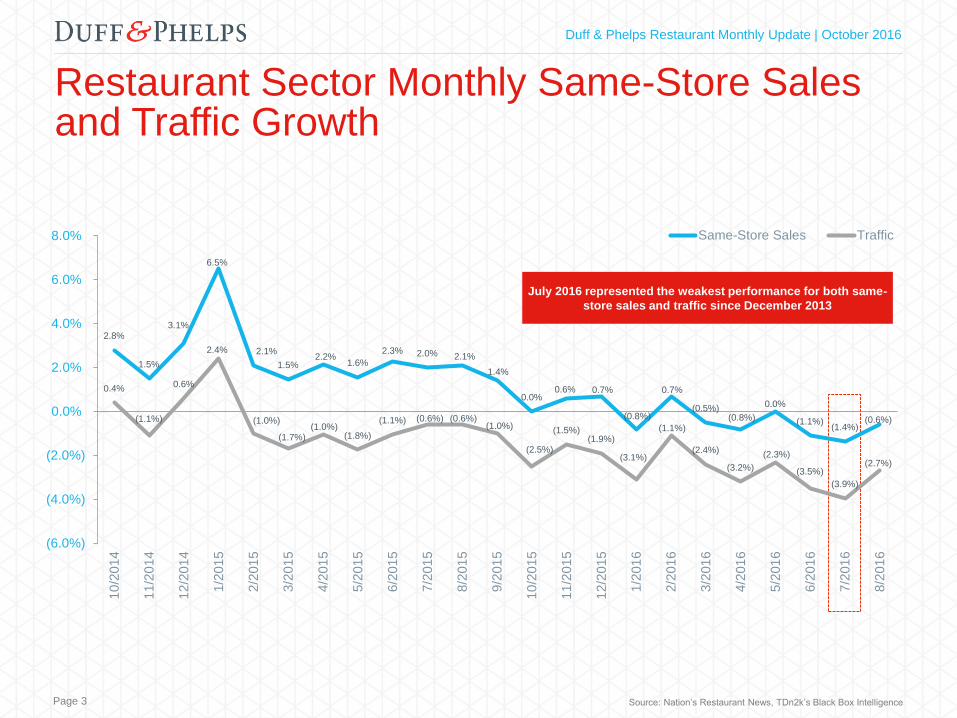
Restaurant Sector Monthly Same-Store Sales and Traffic Growth
2.8%
1.5%
3.1%
6.5%
2.1%
1.5% 2.2%
1.6%
2.3% 2.0% 2.1%
1.4%
0.0% 0.6% 0.7%
(0.8%)
0.7%
(0.5%) (0.8%)
0.0%
(1.1%) (1.4%)
(0.6%)
0.4%
(1.1%)
0.6%
2.4%
(1.0%)
(1.7%) (1.0%)
(1.8%)
(1.1%) (0.6%) (0.6%) (1.0%)
(2.5%)
(1.5%) (1.9%)
(3.1%)
(1.1%)
(2.4%)
(3.2%)
(2.3%)
(3.5%)
(3.9%)
(2.7%)
(6.0%)
(4.0%)
(2.0%)
0.0%
2.0%
4.0%
6.0%
8.0%
10
/20
14
11
/20
14
12
/20
14
1/2
01
5
2/2
01
5
3/2
01
5
4/2
01
5
5/2
01
5
6/2
01
5
7/2
01
5
8/2
01
5
9/2
01
5
10
/20
15
11
/20
15
12
/20
15
1/2
01
6
2/2
01
6
3/2
01
6
4/2
01
6
5/2
01
6
6/2
01
6
7/2
01
6
8/2
01
6
Same-Store Sales Traffic
July 2016 represented the weakest performance for both same-
store sales and traffic since December 2013
Source: Nation’s Restaurant News, TDn2k’s Black Box Intelligence Page 3

Capital Markets Industry Insights | Q1 2016 Duff & Phelps Restaurant Monthly Update | October 2016
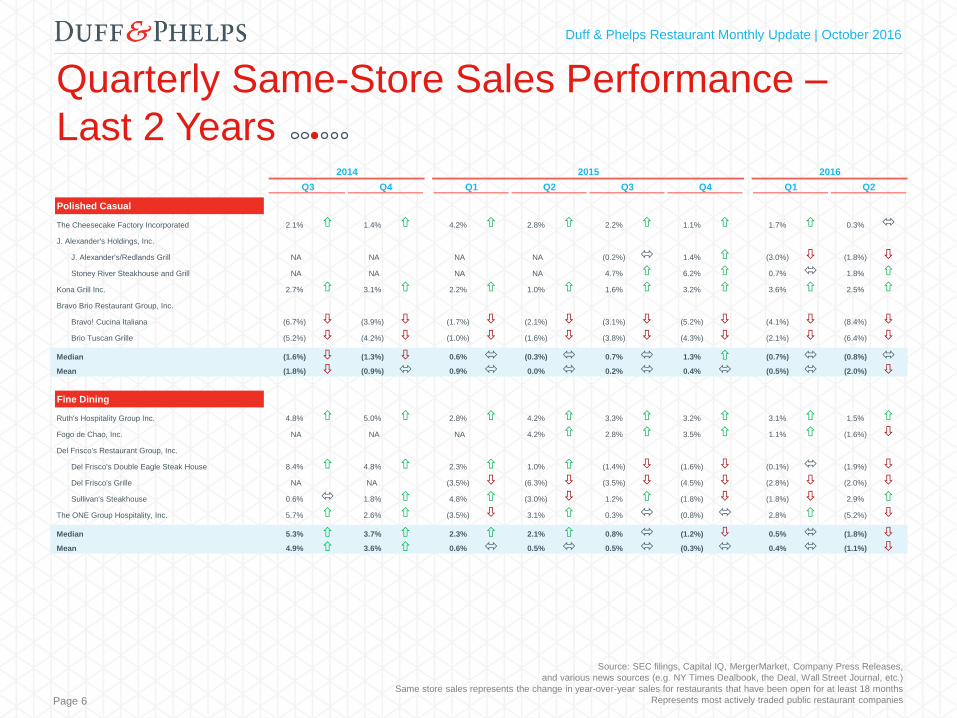
Quarterly Same-Store Sales Performance –
Last 2 Years
Source: SEC filings, Capital IQ, MergerMarket, Company Press Releases,
and various news sources (e.g. NY Times Dealbook, the Deal, Wall Street Journal, etc.)
Same store sales represents the change in year-over-year sales for restaurants that have been open for at least 18 months
Represents most actively traded public restaurant companies Page 4
2014 2015 2016
Q3 Q4 Q1 Q2 Q3 Q4 Q1 Q2
Mass Casual
Cracker Barrel Old Country Store, Inc. 3.3% 7.9% 5.2% 3.8% 2.5% 0.6% 2.3% 3.2%
Brinker International, Inc.
Chili's Grill & Bar 2.3% 4.2% 2.2% 0.1% (1.1%) (2.1%) (3.6%) (1.8%)
Maggiano's Little Italy 0.6% 2.3% 0.1% (0.1%) (1.7%) (1.8%) 0.2% (1.7%)
Bloomin' Brands, Inc.
Bonefish Grill 2.6% 0.7% 0.9% (4.6%) (6.1%) (5.4%) (2.7%) 0.9%
Carrabba's Italian Grill (1.2%) 0.3% 1.9% 0.9% (2.0%) (4.0%) (2.0%) (4.8%)
Fleming's Prime Steakhouse & Wine Bar 4.8% 3.4% 3.0% 3.2% (0.6%) (0.3%) 1.3% (0.8%)
Outback Steakhouse 4.8% 6.4% 5.0% 4.0% 0.1% (2.2%) (1.3%) (2.5%)
DineEquity, Inc.
Applebee's 1.7% 2.8% 2.9% 1.0% (0.5%) (2.5%) (3.7%) (4.2%)
IHOP 2.4% 6.1% 4.8% 6.2% 5.8% 1.4% 1.5% 0.2%
Bob Evans Farms, Inc. 0.0% 3.8% 2.1% (0.3%) (3.2%) (3.6%) (3.0%) (3.2%)
Biglari Holdings Inc. 2.6% 2.9% 6.0% 4.8% 3.0% 3.6% 1.8% (0.7%)
Denny's Corporation 2.4% 4.7% 7.2% 7.3% 6.1% 2.9% 2.5% (0.5%)
Red Robin Gourmet Burgers Inc. 1.4% 4.3% 3.8% 3.6% 3.7% (1.6%) (2.2%) (3.2%)
Ruby Tuesday, Inc. 1.1% (1.0%) (0.3%) (1.7%) 0.6% 0.8% (3.1%) (3.7%)
Luby's, Inc. 0.4% 0.2% 3.1% (1.0%) 0.2% 1.2% 3.1% (0.6%)
Ignite Restaurant Group, Inc.
Brick House Tavern + Tap 7.5% 5.7% 5.4% 2.8% (0.7%) (2.8%) (4.5%) (6.3%)
Joe's Crab Shack (4.4%) (4.5%) (3.8%) (4.0%) (6.6%) (2.9%) (1.3%) (6.8%)
Famous Dave's of America Inc. (2.3%) (4.0%) (4.9%) (9.2%) (9.8%) (10.6%) (7.7%) (6.4%)
Median 2.0% 3.2% 3.0% 1.0% (0.6%) (2.0%) (1.7%) (2.2%)
Mean 1.7% 2.6% 2.5% 0.9% (0.6%) (1.6%) (1.2%) (2.4%)

Capital Markets Industry Insights | Q1 2016 Duff & Phelps Restaurant Monthly Update | October 2016
Quarterly Same-Store Sales Performance –
Last 2 Years
Page 5
2014 2015 2016
Q3 Q4 Q1 Q2 Q3 Q4 Q1 Q2
Specialty Casual
Darden Restaurants, Inc.
Bahama Breeze 1.1% (0.6%) 3.2% 1.7% 1.8% 2.4% 9.9% 5.4%
The Capital Grille 3.9% 5.0% 6.1% 4.4% 7.2% 1.5% 5.3% 1.5%
Eddie V's 2.5% 4.9% 9.6% 5.2% 5.1% 1.1% 4.1% 0.9%
LongHorn Steakhouse 2.8% 2.6% 5.4% 5.2% 4.4% 2.6% 5.2% 1.1%
Olive Garden (1.3%) 0.5% 2.2% 3.4% 2.7% 1.0% 6.8% 1.6%
Seasons 52 (0.3%) 1.2% 5.2% 3.1% 3.9% 4.5% 5.7% 3.7%
Yard House 2.3% 3.7% 5.4% 3.2% 3.4% 1.7% 3.9% 1.4%
Texas Roadhouse, Inc. 5.8% 6.8% 8.7% 8.0% 7.0% 4.4% 4.3% 4.5%
Buffalo Wild Wings Inc. 5.8% 5.5% 6.5% 3.3% 2.6% 1.0% (2.0%) (2.1%)
Dave & Buster's Entertainment, Inc. 8.7% 10.5% 9.9% 11.0% 8.8% 6.0% 3.6% 1.0%
BJ's Restaurants, Inc. 0.3% 1.2% 3.2% 0.5% 2.3% 0.7% 0.6% (0.2%)
Chuy's Holdings, Inc. 3.0% 3.8% 1.9% 3.2% 4.2% 3.2% 3.2% 1.0%
Median 2.7% 3.8% 5.4% 3.4% 4.1% 2.1% 4.2% 1.3%
Mean 2.9% 3.8% 5.6% 4.4% 4.5% 2.5% 4.2% 1.7%
Source: SEC filings, Capital IQ, MergerMarket, Company Press Releases,
and various news sources (e.g. NY Times Dealbook, the Deal, Wall Street Journal, etc.)
Same store sales represents the change in year-over-year sales for restaurants that have been open for at least 18 months
Represents most actively traded public restaurant companies
Capital Markets Industry Insights | Q1 2016 Duff & Phelps Restaurant Monthly Update | October 2016
Quarterly Same-Store Sales Performance –
Last 2 Years
Page 6
2014 2015 2016
Q3 Q4 Q1 Q2 Q3 Q4 Q1 Q2
Polished Casual
The Cheesecake Factory Incorporated 2.1% 1.4% 4.2% 2.8% 2.2% 1.1% 1.7% 0.3%
J. Alexander's Holdings, Inc.
J. Alexander's/Redlands Grill NA NA NA NA (0.2%) 1.4% (3.0%) (1.8%)
Stoney River Steakhouse and Grill NA NA NA NA 4.7% 6.2% 0.7% 1.8%
Kona Grill Inc. 2.7% 3.1% 2.2% 1.0% 1.6% 3.2% 3.6% 2.5%
Bravo Brio Restaurant Group, Inc.
Bravo! Cucina Italiana (6.7%) (3.9%) (1.7%) (2.1%) (3.1%) (5.2%) (4.1%) (8.4%)
Brio Tuscan Grille (5.2%) (4.2%) (1.0%) (1.6%) (3.8%) (4.3%) (2.1%) (6.4%)
Median (1.6%) (1.3%) 0.6% (0.3%) 0.7% 1.3% (0.7%) (0.8%)
Mean (1.8%) (0.9%) 0.9% 0.0% 0.2% 0.4% (0.5%) (2.0%)
Fine Dining
Ruth's Hospitality Group Inc. 4.8% 5.0% 2.8% 4.2% 3.3% 3.2% 3.1% 1.5%
Fogo de Chao, Inc. NA NA NA 4.2% 2.8% 3.5% 1.1% (1.6%)
Del Frisco's Restaurant Group, Inc.
Del Frisco's Double Eagle Steak House 8.4% 4.8% 2.3% 1.0% (1.4%) (1.6%) (0.1%) (1.9%)
Del Frisco's Grille NA NA (3.5%) (6.3%) (3.5%) (4.5%) (2.8%) (2.0%)
Sullivan's Steakhouse 0.6% 1.8% 4.8% (3.0%) 1.2% (1.8%) (1.8%) 2.9%
The ONE Group Hospitality, Inc. 5.7% 2.6% (3.5%) 3.1% 0.3% (0.8%) 2.8% (5.2%)
Median 5.3% 3.7% 2.3% 2.1% 0.8% (1.2%) 0.5% (1.8%)
Mean 4.9% 3.6% 0.6% 0.5% 0.5% (0.3%) 0.4% (1.1%)
Source: SEC filings, Capital IQ, MergerMarket, Company Press Releases,
and various news sources (e.g. NY Times Dealbook, the Deal, Wall Street Journal, etc.)
Same store sales represents the change in year-over-year sales for restaurants that have been open for at least 18 months
Represents most actively traded public restaurant companies

Capital Markets Industry Insights | Q1 2016 Duff & Phelps Restaurant Monthly Update | October 2016
Quarterly Same-Store Sales Performance –
Last 2 Years
Page 7
2014 2015 2016
Q3 Q4 Q1 Q2 Q3 Q4 Q1 Q2
Fast Casual
Chipotle Mexican Grill, Inc. 19.8% 16.1% 10.4% 4.3% 2.6% (14.6%) (29.7%) (23.6%)
Panera Bread Company 1.4% 3.0% 0.7% 1.8% 2.8% 2.3% 4.7% 2.6%
Shake Shack Inc. NA 7.2% 11.7% 12.9% 17.1% 11.0% 9.9% 4.5%
El Pollo Loco Holdings, Inc. 7.9% 7.6% 5.1% 1.3% 0.6% 1.8% 0.7% 2.4%
Zoe's Kitchen, Inc. 5.9% 7.8% 7.7% 5.6% 4.5% 7.7% 8.1% 4.0%
The Habit Restaurants, Inc. NA 13.2% 12.6% 8.9% 2.9% 3.3% 2.0% 4.0%
Noodles & Company 1.7% 1.3% 0.9% 0.1% (0.9%) (1.1%) (0.1%) (1.0%)
Potbelly Corporation 0.5% 3.7% 5.4% 4.9% 3.7% 3.7% 3.7% 1.7%
Fiesta Restaurant Group, Inc.
Pollo Tropical 5.9% 7.7% 6.4% 4.3% 4.2% 0.4% 0.0% (1.4%)
Taco Cabana 3.5% 6.1% 3.8% 5.6% 4.8% 3.3% 1.7% (3.8%)
Wingstop Inc. 12.4% 12.5% 10.7% 9.0% 6.3% 5.9% 4.6% 3.1%
Median 5.9% 7.6% 6.4% 4.9% 3.7% 3.3% 2.0% 2.4%
Mean 6.6% 7.8% 6.9% 5.3% 4.4% 2.2% 0.5% (0.7%)
Source: SEC filings, Capital IQ, MergerMarket, Company Press Releases,
and various news sources (e.g. NY Times Dealbook, the Deal, Wall Street Journal, etc.)
Same store sales represents the change in year-over-year sales for restaurants that have been open for at least 18 months
Represents most actively traded public restaurant companies

Capital Markets Industry Insights | Q1 2016 Duff & Phelps Restaurant Monthly Update | October 2016
Quarterly Same-Store Sales Performance –
Last 2 Years
Page 8
2014 2015 2016
Q3 Q4 Q1 Q2 Q3 Q4 Q1 Q2
Quick Service
McDonald's Corp. (3.3%) (1.7%) (2.6%) (2.0%) 0.9% 5.7% 5.4% 3.1%
Yum! Brands, Inc.
KFC 2.0% 6.0% 7.0% 3.0% 0.0% 3.0% 1.0% 2.0%
Pizza Hut (2.0%) 0.0% (1.0%) 1.0% 0.0% 2.0% 5.0% 0.0%
Taco Bell 3.0% 7.0% 6.0% 6.0% 4.0% 4.0% 1.0% (1.0%)
Restaurant Brands International Inc.
Burger King 3.6% 4.2% 6.9% 7.9% 5.2% 2.8% 4.4% 3.9%
Tim Hortons 6.8% 4.1% 8.9% 7.0% 4.3% 5.8% 5.8% 4.8%
Domino's Pizza, Inc. 7.7% 11.1% 14.5% 12.8% 10.5% 10.7% 6.4% 9.7%
The Wendy's Company 0.8% 1.7% 3.2% 2.2% 3.1% 4.8% 3.6% 0.3%
Jack in the Box Inc. 3.1% 4.4% 8.9% 7.3% 6.2% 1.4% 0.0% 1.1%
Papa John's International Inc. 7.4% 4.1% 6.5% 5.5% 3.0% 1.9% 0.1% 4.8%
Sonic Corp. 3.5% 8.5% 11.5% 6.1% 4.9% 5.3% 6.5% 2.0%
Popeyes Louisiana Kitchen, Inc. 7.2% 10.7% 7.0% 7.9% 5.6% 2.0% 1.1% 0.7%
Bojangles', Inc. 5.3% 7.0% 7.9% 4.4% 4.1% 0.6% 2.0% 0.2%
Del Taco Restaurants, Inc. NA NA 7.7% 6.0% 5.6% 5.8% 3.2% 3.3%
Nathan's Famous Inc. 3.0% (2.0%) (2.8%) (0.7%) 0.5% (1.3%) 0.2% (2.2%)
Papa Murphy's Holdings, Inc. 4.6% 8.4% 5.6% 4.5% 1.4% (3.1%) (2.8%) (4.0%)
Median 3.5% 4.4% 7.0% 5.8% 4.1% 2.9% 2.6% 1.6%
Mean 3.5% 4.9% 6.0% 4.9% 3.7% 3.2% 2.7% 1.8%
Source: SEC filings, Capital IQ, MergerMarket, Company Press Releases,
and various news sources (e.g. NY Times Dealbook, the Deal, Wall Street Journal, etc.)
Same store sales represents the change in year-over-year sales for restaurants that have been open for at least 18 months
Represents most actively traded public restaurant companies

Capital Markets Industry Insights | Q1 2016 Duff & Phelps Restaurant Monthly Update | October 2016
Quarterly Same-Store Sales Performance –
Last 2 Years
Page 9
2014 2015 2016
Q3 Q4 Q1 Q2 Q3 Q4 Q1 Q2
Coffee, Breakfast, & Snacks
Starbucks Corporation 5.0% 5.0% 7.0% 8.0% 9.0% 9.0% 7.0% 4.0%
Dunkin' Brands Group, Inc.
Dunkin' Donuts 2.0% 1.4% 2.7% 2.9% 1.1% 1.8% 2.0% 0.5%
Baskin Robbins 5.8% 9.3% 8.0% 3.4% 7.5% 4.4% 5.0% 0.6%
Jamba, Inc. 3.7% 4.9% 5.0% (5.9%) 6.6% 5.4% (2.1%) 4.2%
Median 4.4% 5.0% 6.0% 3.2% 7.1% 4.9% 3.5% 2.3%
Mean 4.1% 5.2% 5.7% 2.1% 6.1% 5.2% 3.0% 2.3%
Franchisees
Alsea, S.A.B. De C.V. 2.0% 2.4% 6.3% 8.0% 11.4% 10.4% 10.1% 9.6%
Domino's Pizza Enterprises Limited NA NA NA NA NA NA NA NA
Arcos Dorados Holdings, Inc. 7.4% 15.4% 9.4% 8.5% 9.4% 12.0% 15.9% 9.5%
Domino's Pizza Group plc NA NA NA NA NA NA NA NA
Carrols Restaurant Group, Inc. 3.3% 3.6% 8.4% 10.3% 6.5% 5.1% 5.7% 0.7%
Median 3.3% 3.6% 8.4% 8.5% 9.4% 10.4% 10.1% 9.5%
Mean 4.2% 7.1% 8.0% 8.9% 9.1% 9.2% 10.6% 6.6%
Source: SEC filings, Capital IQ, MergerMarket, Company Press Releases,
and various news sources (e.g. NY Times Dealbook, the Deal, Wall Street Journal, etc.)
Same store sales represents the change in year-over-year sales for restaurants that have been open for at least 18 months
Represents most actively traded public restaurant companies
Capital Markets Industry Insights | Q1 2016 Duff & Phelps Restaurant Monthly Update | October 2016
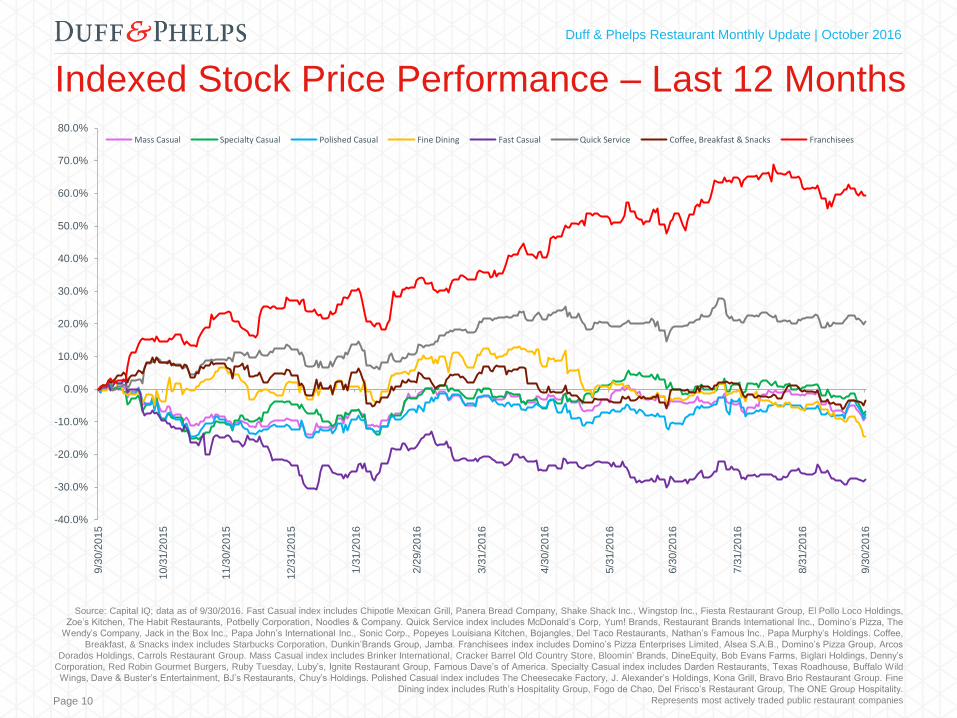
Indexed Stock Price Performance – Last 12 Months
Page 10
-40.0%
-30.0%
-20.0%
-10.0%
0.0%
10.0%
20.0%
30.0%
40.0%
50.0%
60.0%
70.0%
80.0%
9/3
0/2
015
10/3
1/2
015
11/3
0/2
015
12/3
1/2
015
1/3
1/2
016
2/2
9/2
016
3/3
1/2
016
4/3
0/2
016
5/3
1/2
016
6/3
0/2
016
7/3
1/2
016
8/3
1/2
016
9/3
0/2
016
Mass Casual Specialty Casual Polished Casual Fine Dining Fast Casual Quick Service Coffee, Breakfast & Snacks Franchisees
Source: Capital IQ; data as of 9/30/2016. Fast Casual index includes Chipotle Mexican Grill, Panera Bread Company, Shake Shack Inc., Wingstop Inc., Fiesta Restaurant Group, El Pollo Loco Holdings,
Zoe’s Kitchen, The Habit Restaurants, Potbelly Corporation, Noodles & Company. Quick Service index includes McDonald’s Corp, Yum! Brands, Restaurant Brands International Inc., Domino’s Pizza, The
Wendy’s Company, Jack in the Box Inc., Papa John’s International Inc., Sonic Corp., Popeyes Louisiana Kitchen, Bojangles, Del Taco Restaurants, Nathan’s Famous Inc., Papa Murphy’s Holdings. Coffee,
Breakfast, & Snacks index includes Starbucks Corporation, Dunkin’Brands Group, Jamba. Franchisees index includes Domino’s Pizza Enterprises Limited, Alsea S.A.B., Domino’s Pizza Group, Arcos
Dorados Holdings, Carrols Restaurant Group. Mass Casual index includes Brinker International, Cracker Barrel Old Country Store, Bloomin’ Brands, DineEquity, Bob Evans Farms, Biglari Holdings, Denny’s
Corporation, Red Robin Gourmet Burgers, Ruby Tuesday, Luby’s, Ignite Restaurant Group, Famous Dave’s of America. Specialty Casual index includes Darden Restaurants, Texas Roadhouse, Buffalo Wild
Wings, Dave & Buster’s Entertainment, BJ’s Restaurants, Chuy’s Holdings. Polished Casual index includes The Cheesecake Factory, J. Alexander’s Holdings, Kona Grill, Bravo Brio Restaurant Group. Fine
Dining index includes Ruth’s Hospitality Group, Fogo de Chao, Del Frisco’s Restaurant Group, The ONE Group Hospitality.
Represents most actively traded public restaurant companies
Capital Markets Industry Insights | Q1 2016 Duff & Phelps Restaurant Monthly Update | October 2016
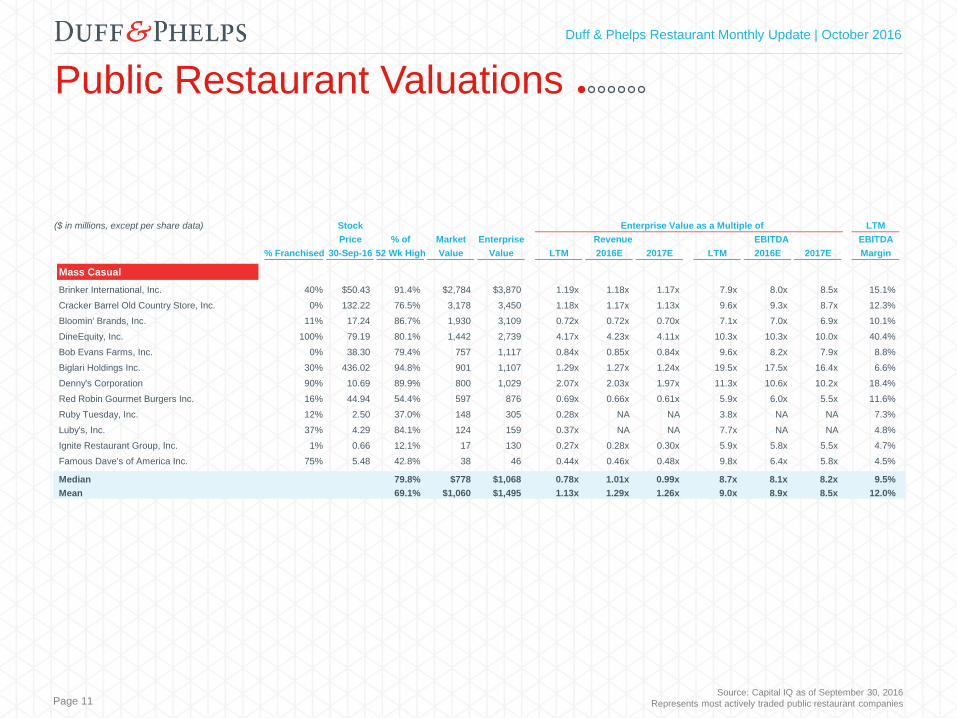
Public Restaurant Valuations
Source: Capital IQ as of September 30, 2016
Represents most actively traded public restaurant companies Page 11
($ in millions, except per share data) Stock Enterprise Value as a Multiple of LTM
Price % of Market Enterprise Revenue EBITDA EBITDA
% Franchised 30-Sep-16 52 Wk High Value Value LTM 2016E 2017E LTM 2016E 2017E Margin REV
Mass Casual
Brinker International, Inc. 40% $50.43 91.4% $2,784 $3,870 1.19x 1.18x 1.17x 7.9x 8.0x 8.5x 15.1%
Cracker Barrel Old Country Store, Inc. 0% 132.22 76.5% 3,178 3,450 1.18x 1.17x 1.13x 9.6x 9.3x 8.7x 12.3%
Bloomin' Brands, Inc. 11% 17.24 86.7% 1,930 3,109 0.72x 0.72x 0.70x 7.1x 7.0x 6.9x 10.1%
DineEquity, Inc. 100% 79.19 80.1% 1,442 2,739 4.17x 4.23x 4.11x 10.3x 10.3x 10.0x 40.4%
Bob Evans Farms, Inc. 0% 38.30 79.4% 757 1,117 0.84x 0.85x 0.84x 9.6x 8.2x 7.9x 8.8%
Biglari Holdings Inc. 30% 436.02 94.8% 901 1,107 1.29x 1.27x 1.24x 19.5x 17.5x 16.4x 6.6%
Denny's Corporation 90% 10.69 89.9% 800 1,029 2.07x 2.03x 1.97x 11.3x 10.6x 10.2x 18.4%
Red Robin Gourmet Burgers Inc. 16% 44.94 54.4% 597 876 0.69x 0.66x 0.61x 5.9x 6.0x 5.5x 11.6%
Ruby Tuesday, Inc. 12% 2.50 37.0% 148 305 0.28x NA NA 3.8x NA NA 7.3%
Luby's, Inc. 37% 4.29 84.1% 124 159 0.37x NA NA 7.7x NA NA 4.8%
Ignite Restaurant Group, Inc. 1% 0.66 12.1% 17 130 0.27x 0.28x 0.30x 5.9x 5.8x 5.5x 4.7%
Famous Dave's of America Inc. 75% 5.48 42.8% 38 46 0.44x 0.46x 0.48x 9.8x 6.4x 5.8x 4.5%
Median 79.8% $778 $1,068 0.78x 1.01x 0.99x 8.7x 8.1x 8.2x 9.5%
Mean 69.1% $1,060 $1,495 1.13x 1.29x 1.26x 9.0x 8.9x 8.5x 12.0%

Capital Markets Industry Insights | Q1 2016 Duff & Phelps Restaurant Monthly Update | October 2016
Public Restaurant Valuations
Page 12 Source: Capital IQ as of September 30, 2016
Represents most actively traded public restaurant companies
($ in millions, except per share data) Stock Enterprise Value as a Multiple of LTM
Price % of Market Enterprise Revenue EBITDA EBITDA
% Franchised 30-Sep-16 52 Wk High Value Value LTM 2016E 2017E LTM 2016E 2017E Margin
Specialty Casual
Darden Restaurants, Inc. 3% $61.32 88.9% $7,861 $8,027 1.16x 1.15x 1.11x 8.9x 8.4x 7.8x 13.0%
Texas Roadhouse, Inc. 17% 39.03 79.7% 2,749 2,712 1.42x 1.35x 1.22x 10.9x 10.2x 9.0x 13.0%
Buffalo Wild Wings Inc. 49% 140.74 70.9% 2,575 2,661 1.37x 1.31x 1.17x 8.9x 8.6x 7.6x 15.4%
Dave & Buster's Entertainment, Inc. 0% 39.18 78.5% 1,648 1,915 2.05x 1.90x 1.70x 8.8x 8.0x 7.2x 23.3%
BJ's Restaurants, Inc. 0% 35.55 74.1% 859 927 0.97x 0.92x 0.84x 7.1x 7.1x 6.5x 13.7%
Chuy's Holdings, Inc. 0% 27.94 74.0% 469 455 1.47x 1.36x 1.16x 11.5x 10.5x 9.2x 12.7%
Median 76.3% $2,112 $2,288 1.39x 1.33x 1.16x 8.9x 8.5x 7.7x 12.0%
Mean 77.7% $2,694 $2,783 1.40x 1.33x 1.20x 9.3x 8.8x 7.9x 11.4%
Polished Casual
The Cheesecake Factory Incorporated 5% $50.06 90.1% $2,313 $2,325 1.07x 1.03x 0.98x 8.6x 8.2x 7.8x 12.5%
J. Alexander's Holdings, Inc. 0% 10.13 83.7% 149 166 0.76x 0.75x 0.67x 7.7x 6.8x 5.7x 9.8%
Kona Grill Inc. 0% 12.57 68.5% 132 146 0.93x 0.83x 0.70x 12.2x 10.8x 7.5x 7.6%
Bravo Brio Restaurant Group, Inc. 1% 4.78 37.8% 70 112 0.27x 0.27x 0.28x 3.6x 4.3x 4.2x 7.5%
Median 76.1% $140 $156 0.84x 0.79x 0.68x 8.2x 7.5x 6.6x 8.7%
Mean 70.0% $666 $687 0.76x 0.72x 0.66x 8.0x 7.5x 6.3x 9.4%
Capital Markets Industry Insights | Q1 2016 Duff & Phelps Restaurant Monthly Update | October 2016
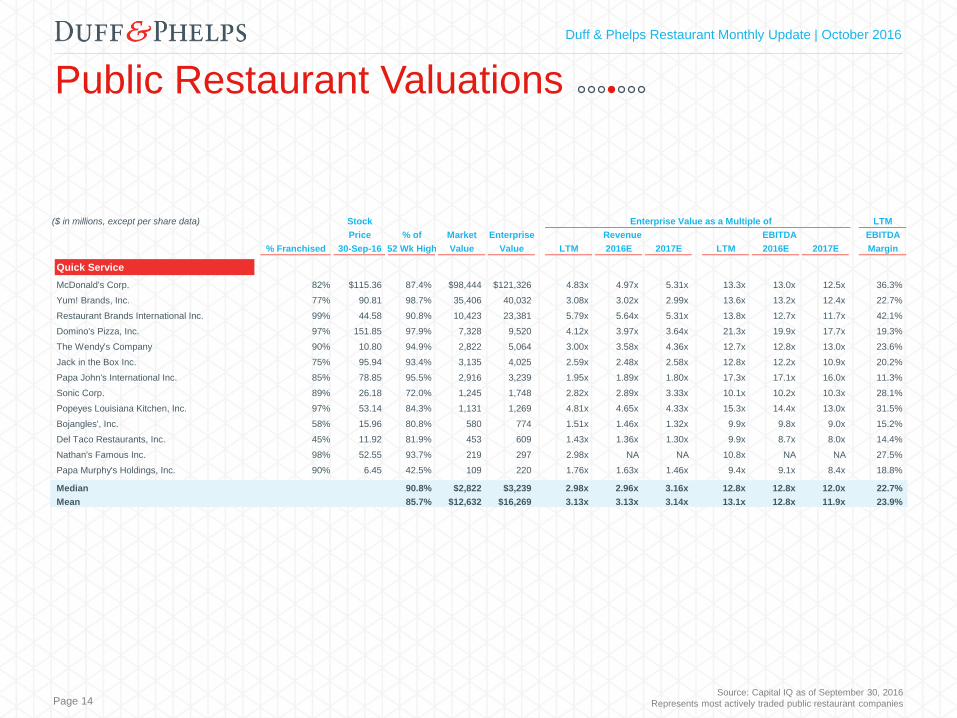
Public Restaurant Valuations
Page 13 Source: Capital IQ as of September 30, 2016
Represents most actively traded public restaurant companies
Capital Markets Industry Insights | Q1 2016 Duff & Phelps Restaurant Monthly Update | October 2016
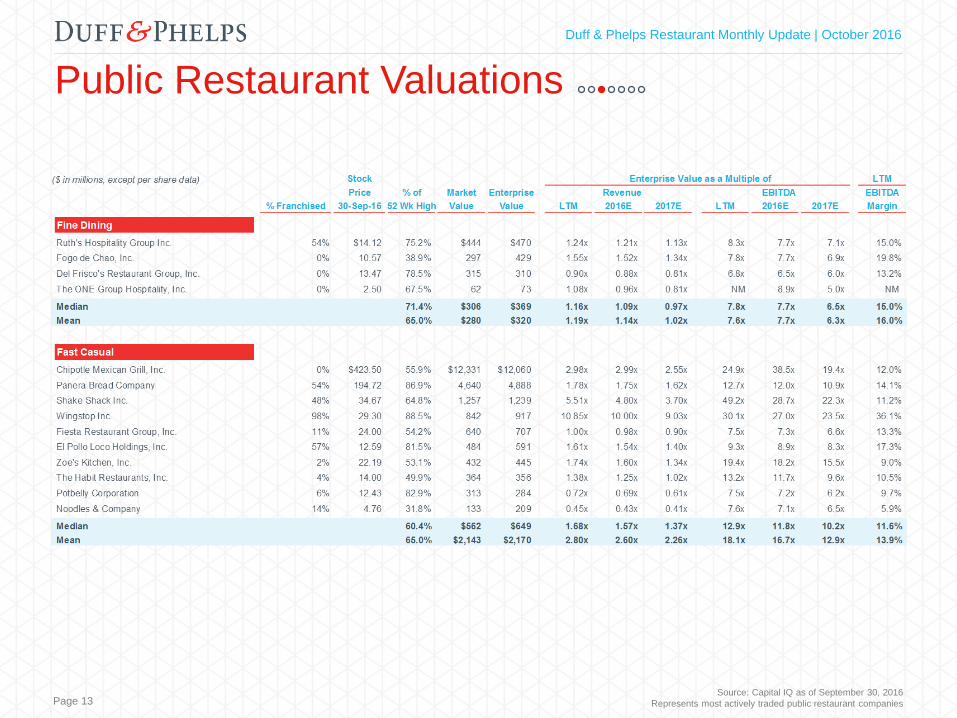
Public Restaurant Valuations
Page 14 Source: Capital IQ as of September 30, 2016
Represents most actively traded public restaurant companies
($ in millions, except per share data) Stock Enterprise Value as a Multiple of LTM
Price % of Market Enterprise Revenue EBITDA EBITDA
% Franchised 30-Sep-16 52 Wk High Value Value LTM 2016E 2017E LTM 2016E 2017E Margin
Quick Service
McDonald's Corp. 82% $115.36 87.4% $98,444 $121,326 4.83x 4.97x 5.31x 13.3x 13.0x 12.5x 36.3%
Yum! Brands, Inc. 77% 90.81 98.7% 35,406 40,032 3.08x 3.02x 2.99x 13.6x 13.2x 12.4x 22.7%
Restaurant Brands International Inc. 99% 44.58 90.8% 10,423 23,381 5.79x 5.64x 5.31x 13.8x 12.7x 11.7x 42.1%
Domino's Pizza, Inc. 97% 151.85 97.9% 7,328 9,520 4.12x 3.97x 3.64x 21.3x 19.9x 17.7x 19.3%
The Wendy's Company 90% 10.80 94.9% 2,822 5,064 3.00x 3.58x 4.36x 12.7x 12.8x 13.0x 23.6%
Jack in the Box Inc. 75% 95.94 93.4% 3,135 4,025 2.59x 2.48x 2.58x 12.8x 12.2x 10.9x 20.2%
Papa John's International Inc. 85% 78.85 95.5% 2,916 3,239 1.95x 1.89x 1.80x 17.3x 17.1x 16.0x 11.3%
Sonic Corp. 89% 26.18 72.0% 1,245 1,748 2.82x 2.89x 3.33x 10.1x 10.2x 10.3x 28.1%
Popeyes Louisiana Kitchen, Inc. 97% 53.14 84.3% 1,131 1,269 4.81x 4.65x 4.33x 15.3x 14.4x 13.0x 31.5%
Bojangles', Inc. 58% 15.96 80.8% 580 774 1.51x 1.46x 1.32x 9.9x 9.8x 9.0x 15.2%
Del Taco Restaurants, Inc. 45% 11.92 81.9% 453 609 1.43x 1.36x 1.30x 9.9x 8.7x 8.0x 14.4%
Nathan's Famous Inc. 98% 52.55 93.7% 219 297 2.98x NA NA 10.8x NA NA 27.5%
Papa Murphy's Holdings, Inc. 90% 6.45 42.5% 109 220 1.76x 1.63x 1.46x 9.4x 9.1x 8.4x 18.8%
Median 90.8% $2,822 $3,239 2.98x 2.96x 3.16x 12.8x 12.8x 12.0x 22.7%
Mean 85.7% $12,632 $16,269 3.13x 3.13x 3.14x 13.1x 12.8x 11.9x 23.9%
Capital Markets Industry Insights | Q1 2016 Duff & Phelps Restaurant Monthly Update | October 2016
Public Restaurant Valuations
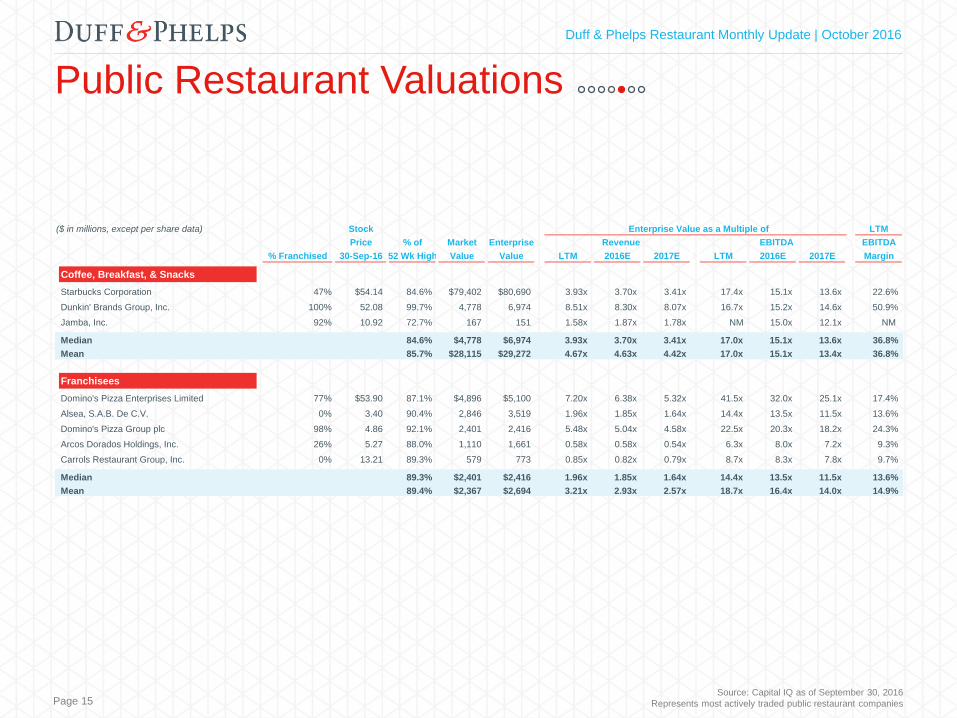
Page 15 Source: Capital IQ as of September 30, 2016
Represents most actively traded public restaurant companies
($ in millions, except per share data) Stock Enterprise Value as a Multiple of LTM
Price % of Market Enterprise Revenue EBITDA EBITDA
% Franchised 30-Sep-16 52 Wk High Value Value LTM 2016E 2017E LTM 2016E 2017E Margin
Coffee, Breakfast, & Snacks
Starbucks Corporation 47% $54.14 84.6% $79,402 $80,690 3.93x 3.70x 3.41x 17.4x 15.1x 13.6x 22.6%
Dunkin' Brands Group, Inc. 100% 52.08 99.7% 4,778 6,974 8.51x 8.30x 8.07x 16.7x 15.2x 14.6x 50.9%
Jamba, Inc. 92% 10.92 72.7% 167 151 1.58x 1.87x 1.78x NM 15.0x 12.1x NM
Median 84.6% $4,778 $6,974 3.93x 3.70x 3.41x 17.0x 15.1x 13.6x 36.8%
Mean 85.7% $28,115 $29,272 4.67x 4.63x 4.42x 17.0x 15.1x 13.4x 36.8%
REV
Franchisees
Domino's Pizza Enterprises Limited 77% $53.90 87.1% $4,896 $5,100 7.20x 6.38x 5.32x 41.5x 32.0x 25.1x 17.4%
Alsea, S.A.B. De C.V. 0% 3.40 90.4% 2,846 3,519 1.96x 1.85x 1.64x 14.4x 13.5x 11.5x 13.6%
Domino's Pizza Group plc 98% 4.86 92.1% 2,401 2,416 5.48x 5.04x 4.58x 22.5x 20.3x 18.2x 24.3%
Arcos Dorados Holdings, Inc. 26% 5.27 88.0% 1,110 1,661 0.58x 0.58x 0.54x 6.3x 8.0x 7.2x 9.3%
Carrols Restaurant Group, Inc. 0% 13.21 89.3% 579 773 0.85x 0.82x 0.79x 8.7x 8.3x 7.8x 9.7%
Median 89.3% $2,401 $2,416 1.96x 1.85x 1.64x 14.4x 13.5x 11.5x 13.6%
Mean 89.4% $2,367 $2,694 3.21x 2.93x 2.57x 18.7x 16.4x 14.0x 14.9%

Capital Markets Industry Insights | Q1 2016 Duff & Phelps Restaurant Monthly Update | October 2016
18.7x
11.2x 11.0x
9.0x
14.6x
10.4x
16.2x
10.0x
21.1x
11.4x
20.1x
13.1x
21.2x
11.3x
17.4x
13.2x
14.0x 14.1x
20.5x
14.9x
17.6x
13.6x
17.4x
16.0x
7.0x
9.0x
11.0x
13.0x
15.0x
17.0x
19.0x
21.0x
23.0x
25.0x
Fast Casual Quick Service Coffee, Breakfast, & Snacks Franchisees
2007 2012 2013 2014 2015 LTM
Source: Capital IQ; based on values at period end, LTM values as of 9/30/2016
Represents most actively traded public restaurant companies
Enterprise Value as a Multiple of EBITDA
Historical Public Restaurant Trends
Page 16
Mean: 12.0x
Mean: 17.1x
Mean: 12.7x
Mean: 17.9x
Capital Markets Industry Insights | Q1 2016 Duff & Phelps Restaurant Monthly Update | October 2016
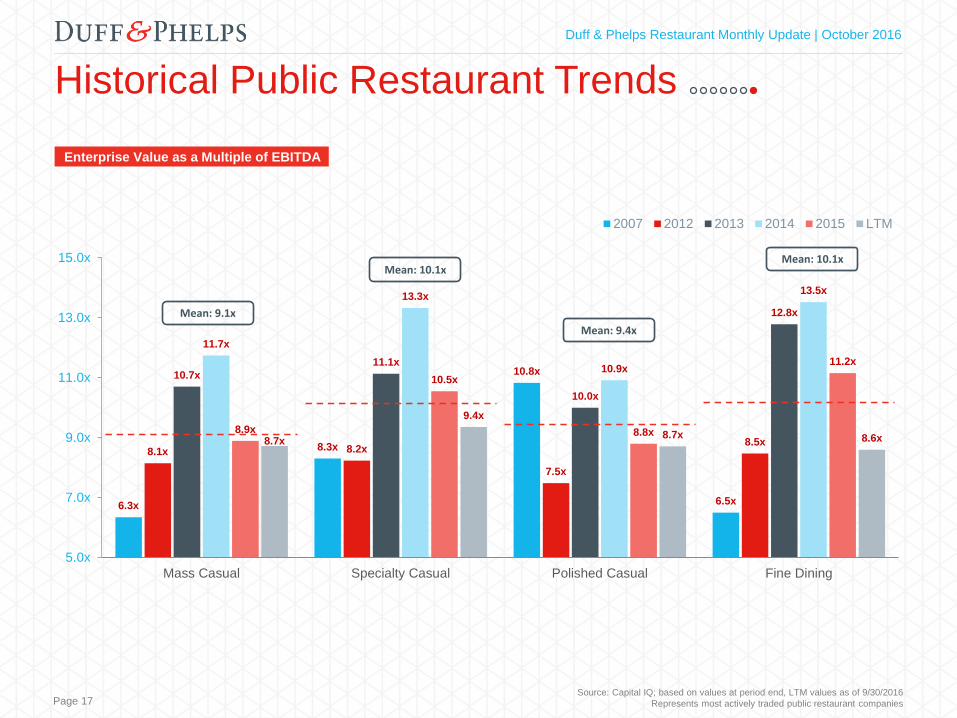
Source: Capital IQ; based on values at period end, LTM values as of 9/30/2016
Represents most actively traded public restaurant companies
Mean: 10.1x
Mean: 9.4x
Mean: 10.1x
Mean: 9.1x
Historical Public Restaurant Trends
Enterprise Value as a Multiple of EBITDA
Page 17
6.3x
8.3x
10.8x
6.5x
8.1x 8.2x
7.5x
8.5x
10.7x
11.1x
10.0x
12.8x
11.7x
13.3x
10.9x
13.5x
8.9x
10.5x
8.8x
11.2x
8.7x
9.4x
8.7x 8.6x
5.0x
7.0x
9.0x
11.0x
13.0x
15.0x
Mass Casual Specialty Casual Polished Casual Fine Dining
2007 2012 2013 2014 2015 LTM

Capital Markets Industry Insights | Q1 2016 Duff & Phelps Restaurant Monthly Update | October 2016
Roark Capital Group acquires Jimmy John’s (September 8)
On September 8, 2016, Jimmy John’s, the Champaign, Illinois-based
fast-casual restaurant chain, sold a majority stake to Roark Capital for
undisclosed terms. The announcement comes nine months after
Founder and CEO James John Liautaud abandoned plans to launch an
IPO. Jimmy John’s currently has more than 2,500 locations generating
$2 billion in system-wide sales. The Company has opened more than
200 locations in each of the last five years, with a new-unit pipeline of
more than 1,100 locations to be opened over the next several years.
Oath Craft Pizza receives $4.5M Series A Funding (September 13)
On September 13, 2016, Oath Craft Pizza, the Boston, Massachusetts-
based fast casual pizza restaurant, closed a $4.5M Series A investment
led by Breakaway Ventures, a Boston-based venture capital firm. The
company currently operates four locations in Massachusetts and will
utilize this funding to further accelerate rapid growth into new
geographic markets, including New York and Washington, DC.
MTY acquires Baja Fresh and La Salsa (September 9)
On September 9, 2016, MTY Food Group, the Canadian franchisor of
quick service restaurants, acquired BF Acquisition Holdings, the Irvine,
California-based operator of Mexican restaurant businesses Baja Fresh
Mexican Grill (“Baja Fresh”) and La Salsa Fresh Mexican Grill (“La
Salsa”), for $27M in cash. BF Acquisition Holdings currently franchises
and operates 162 Baja Fresh and 23 La Salsa restaurants in the US,
Dubai, and Singapore. Duff & Phelps acted as sell-side M&A advisor to
Baja Fresh and La Salsa.
Recent Restaurant M&A Transaction Activity BDT Capital Partners invests in Lou Malnati’s (September 22)
On September 22, 2016, BDT Capital Partners agreed to take a
significant stake in Malnati Organization, a Chicago, Illinois-based casual
pizza restaurant chain that operates under the name Lou Malnati’s
Pizzeria. The company currently operates 46 of its 47 stores within the
Chicago area and will look to utilize the investment to expand the family-
owned concept into new markets within the coming year.
Arlon Group acquires Cicis Pizza (September 7)
On September 7, 2016, Arlon Group completed its acquisition of Cicis,
the Coppell, Texas-based family-friendly pizza buffet restaurant chain.
Since its founding in 1985, Cicis has grown to more than 450 restaurants
in 33 states. As part of the investment, Arlon will partner with Cicis’
management team, led by CEO Darin Harris who has presided over the
brand’s revitalization since joining the company in 2013, to continue
guiding the business.
CenterOak Partners acquires Wetzel’s Pretzels (September 2)
On September 2, 2016, CenterOak Partners completed a majority
investment in Wetzel’s Pretzels, the Pasadena, California-based owner
and franchisor of soft pretzel stores, for an undisclosed sum. Wetzel’s
Pretzels has more than 300 company-owned and franchised locations
in 28 states. The company will remain in Pasadena and will look to
utilize CenterOak’s expertise in the restaurant industry to expand its
geographical footprint.
L Catterton acquires Velvet Taco (September 2)
On September 2, 2016, L Catterton completed a majority investment in
Velvet Taco, the Dallas, Texas-based fast casual taco restaurant.
Concurrent with the investment, L Catterton has initiated a search
process with the founder of Velvet Taco to appoint the next CEO of the
restaurant chain. Velvet Taco will utilize the growth investment to
continue expanding its presence in new and existing markets.
Goode Partners acquires Silver Diner (August 24)
On August 24, 2016, Goode Partners completed a majority investment
in Silver Diner, Inc., the Rockville, Maryland-based operator of classic
American diner concepts, Silver Diner, Silver Diner Airport, and Silver
restaurants. The company operates 15 total locations and will look to
utilize the investment to fund its geographic expansion and accelerate
growth across all three segments of the business. Duff & Phelps acted
as financial advisor to the Board of Silver Diner.
Source: MergerMarket Group Intelligence Page 18

Duff & Phelps Restaurant Monthly Update | October 2016
Recent Wave of Bankruptcies
Company List:
It is no surprise that declining same-store
sales and rising labor costs, employee
turnover and rent expenses have resulted in
the perfect storm for several restaurant chains
burdened with high debt loads and/or
struggling through multiple years of poor
financial performance.
As a result, the industry has experienced
eight major bankruptcy filings in the past
twelve months, with more likely on the
horizon. Many of the recent victims are
familiar with the bankruptcy process with
some having filed for bankruptcy protection
multiple times in their histories.
Source: Nation’s Restaurant News, TDn2K’s Black Box Intelligence, and The WSJ
1) Così (September 2016)
2) Zio’s Italian Kitchen (September 2016)
3) Fox & Hound / Champp’s (August 2016)
4) Logan’s Roadhouse (August 2016)
5) Johnny Carino’s (July 2016)
6) Ovation Brands (March 2016)
7) Black-Eyed Pea (December 2015)
8) Quaker Steak & Lube (November 2015)
9)
Page 19
Capital Markets Industry Insights | Q1 2016 Duff & Phelps Restaurant Monthly Update | October 2016
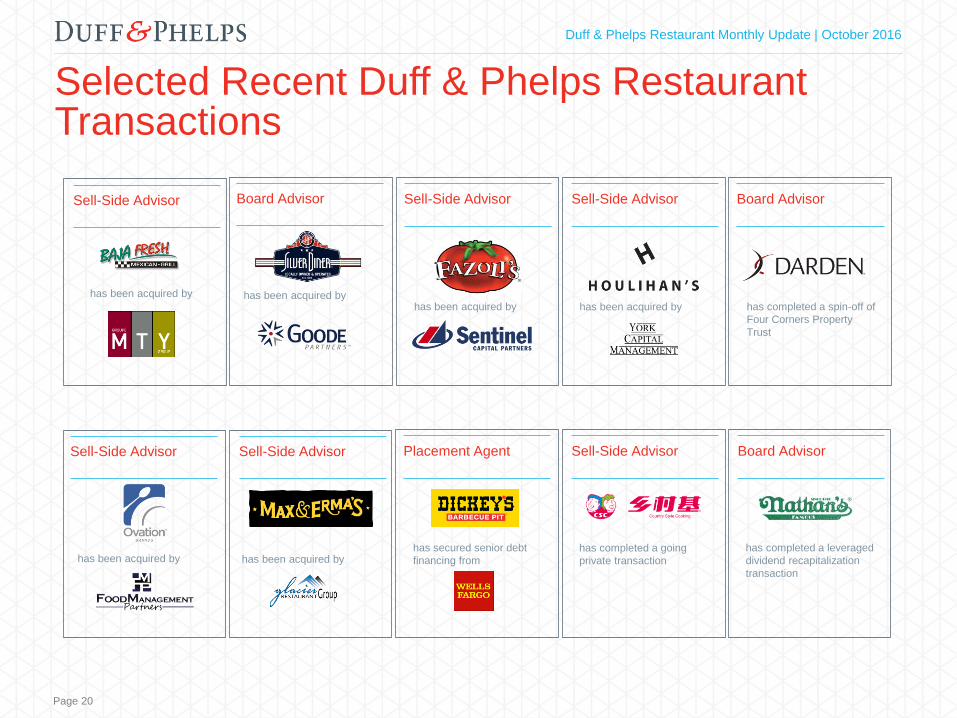
Selected Recent Duff & Phelps Restaurant Transactions
has secured senior debt
financing from has been acquired by
has been acquired by
has been acquired by has completed a going
private transaction
Sell-Side Advisor
Sell-Side Advisor
Placement Agent
Sell-Side Advisor
Sell-Side Advisor
has been acquired by
Board Advisor
has been acquired by
Sell-Side Advisor
has been acquired by
Sell-Side Advisor
has completed a leveraged
dividend recapitalization
transaction
Board Advisor
has completed a spin-off of
Four Corners Property
Trust
Board Advisor
Page 20

Duff & Phelps Restaurant Monthly Update | October 2016
Contact Us
Joshua Benn Global Head of Restaurants
Retail, Consumer and Food
+1 212 450 2840
Darren Gange Managing Director
+1 212 871 9429
Farzad Mukhi Director
+1 424 249 1661
For more information please visit:
www.duffandphelps.com
Duff & Phelps is the premier global valuation and
corporate finance advisor with expertise in complex
valuation, disputes and investigations, M&A, real
estate, restructuring, and compliance and regulatory
consulting. The firm’s more than 2,000 employees
serve a diverse range of clients from offices around
the world.
M&A advisory, capital raising and secondary market advisory services in the
United States are provided by Duff & Phelps Securities, LLC. Member
FINRA/SIPC. Pagemill Partners is a Division of Duff & Phelps Securities,
LLC. M&A advisory and capital raising advisory services are provided in a
number of European countries through Duff & Phelps Securities Ltd, UK,
which includes branches in Ireland and Germany. Duff & Phelps Securities
Ltd, UK, is regulated by the Financial Conduct Authority.
About Duff & Phelps
Copyright © 2016 Duff & Phelps LLC. All rights reserved.
Duff & Phelps Restaurant Monthly | October 2016