Ductile Iron Microstructure by Thermal Analysis - · PDF fileDuctile Iron Microstructure by...
11
All rights reserved 2008 by David Sparkman, MeltLab Systems Ductile Iron Microstructure by Thermal Analysis One promising new technology is the rapid classification of microstructure by thermo analysis. Current technology consists of either pouring a sample with two ears on it for micro analysis or creating a micro lug in the runner system of a mold and digging the lug out for grinding and polishing. Both techniques are “after the fact” or as we often say, “post mortem” since a bad result results in scrapping already poured castings. For a while there has been an analysis method by NovaCast, and now cloned by Elkem to analysis a treated ductile iron sample for the propensity toward shrinkage. But there is so much more that can be learned though thermo analysis. NovaCast identified several characteristics of the thermal curve as pertaining to good castings. First they wanted to see a quick rise in the eutectic temperature as compared to the length of the eutectic arrest (T2 to T3 Ratio). This depended on good nodule count and is soundly based in metallurgy. Second, they looked for a sharp drop in temperature at the end of the eutectic. This shows up as a strong dip in the first derivative, or a sharp peak in the cooling rate. This arrest is due to a large stress in the grain boundaries. The lack of this stress means that shrinkage has relieved the stresses. The stresses may affect fatigue life, but no one has investigated that aspect. For sure, shrinkage will also greatly reduce fatigue life. With some previously published information from MeltLab introducing the concept of the slope of the temperature fall off after eutectic as an indicator of grain size, Elkem has adopted reporting that slope. Additional features in Thermal Analysis The first concept is that not all ductile foundries need the same kind of ductile iron to make quality castings. The treatments by NovaCast and Elkem are aimed at the average foundry making thinner section castings and do not discriminate between hypo-eutectic, eutectic, and hyper-eutectic irons. The published examples all appear as eutectic curves, though closer examination is needed to pick out the near eutectic curves. Let’s start with some definitions of terminology. The term “eutectic” means both lowest melting point, and single arrest. Many may assume that an eutectic curve (single arrest) corresponds with the Iron Carbon phase diagram C.E. of 4.33. This is not always so for two reasons: first, magnesium suppresses the formation of graphite which delays the formation of graphite and allows an austenite liquidus to form higher than 4.33. Second, the instrumentation used by both NovaCast and by Elkem cannot always find an austenitic arrest hidden in a eutectic arrest. Nor do they spot the small graphitic liquidus arrests of extremely hyper-eutectic iron.
Transcript of Ductile Iron Microstructure by Thermal Analysis - · PDF fileDuctile Iron Microstructure by...

All rights reserved 2008 by David Sparkman, MeltLab Systems
Ductile Iron Microstructure by Thermal Analysis
One promising new technology is the rapid classification of microstructure by thermo
analysis. Current technology consists of either pouring a sample with two ears on it for
micro analysis or creating a micro lug in the runner system of a mold and digging the lug
out for grinding and polishing. Both techniques are “after the fact” or as we often say,
“post mortem” since a bad result results in scrapping already poured castings.
For a while there has been an analysis method by NovaCast, and now cloned by Elkem to
analysis a treated ductile iron sample for the propensity toward shrinkage. But there is so
much more that can be learned though thermo analysis.
NovaCast identified several characteristics of the thermal curve as pertaining to good
castings. First they wanted to see a quick rise in the eutectic temperature as compared to
the length of the eutectic arrest (T2 to T3 Ratio). This depended on good nodule count
and is soundly based in metallurgy.
Second, they looked for a sharp drop in temperature at the end of the eutectic. This shows
up as a strong dip in the first derivative, or a sharp peak in the cooling rate. This arrest is
due to a large stress in the grain boundaries. The lack of this stress means that shrinkage
has relieved the stresses. The stresses may affect fatigue life, but no one has investigated
that aspect. For sure, shrinkage will also greatly reduce fatigue life.
With some previously published information from MeltLab introducing the concept of
the slope of the temperature fall off after eutectic as an indicator of grain size, Elkem has
adopted reporting that slope.
Additional features in Thermal Analysis
The first concept is that not all ductile foundries need the same kind of ductile iron to
make quality castings. The treatments by NovaCast and Elkem are aimed at the average
foundry making thinner section castings and do not discriminate between hypo-eutectic,
eutectic, and hyper-eutectic irons. The published examples all appear as eutectic curves,
though closer examination is needed to pick out the near eutectic curves.
Let’s start with some definitions of terminology. The term “eutectic” means both lowest
melting point, and single arrest. Many may assume that an eutectic curve (single arrest)
corresponds with the Iron Carbon phase diagram C.E. of 4.33. This is not always so for
two reasons: first, magnesium suppresses the formation of graphite which delays the
formation of graphite and allows an austenite liquidus to form higher than 4.33. Second,
the instrumentation used by both NovaCast and by Elkem cannot always find an
austenitic arrest hidden in a eutectic arrest. Nor do they spot the small graphitic liquidus
arrests of extremely hyper-eutectic iron.
All rights reserved 2008 by David Sparkman, MeltLab Systems
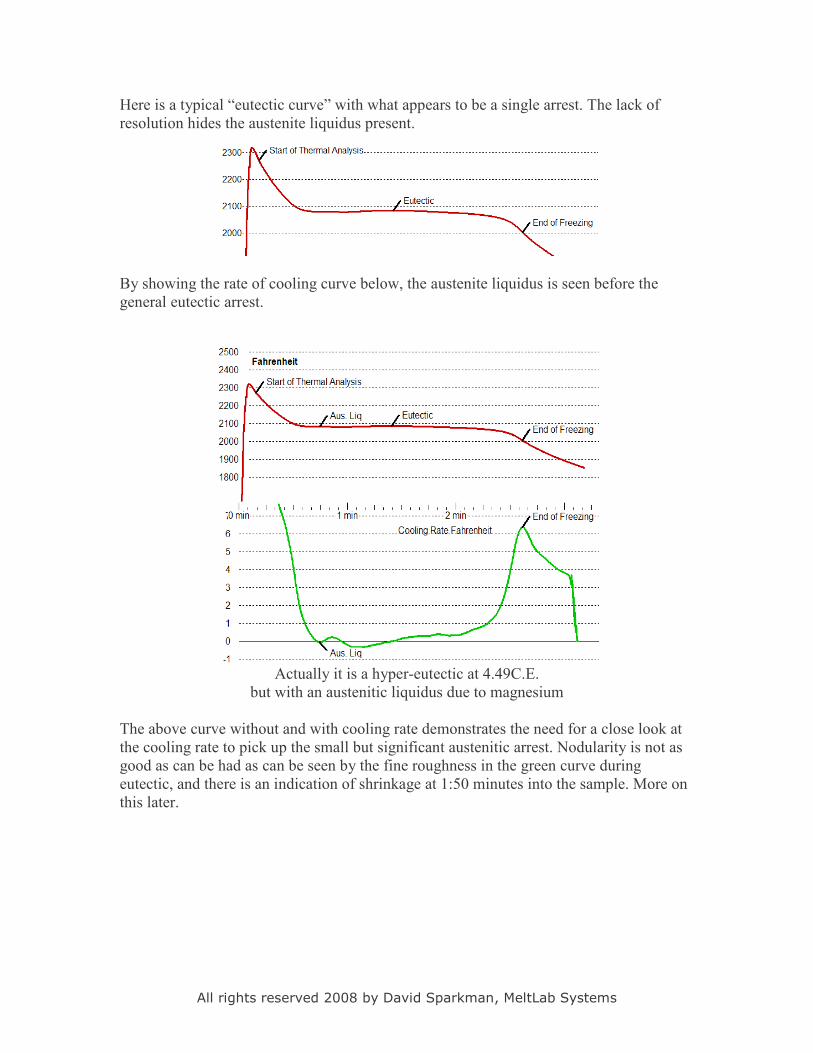
Here is a typical “eutectic curve” with what appears to be a single arrest. The lack of
resolution hides the austenite liquidus present.
By showing the rate of cooling curve below, the austenite liquidus is seen before the
general eutectic arrest.
Actually it is a hyper-eutectic at 4.49C.E.
but with an austenitic liquidus due to magnesium
The above curve without and with cooling rate demonstrates the need for a close look at
the cooling rate to pick up the small but significant austenitic arrest. Nodularity is not as
good as can be had as can be seen by the fine roughness in the green curve during
eutectic, and there is an indication of shrinkage at 1:50 minutes into the sample. More on
this later.

All rights reserved 2008 by David Sparkman, MeltLab Systems
The following curve is a true eutectic curve, even though the C.E. is 4.43%.
Single arrest Ductile Iron with 4.43 C.E.
This kind of iron is idea for normal section castings and provides good shrink control for
reasons to be explained later. Nodularity is quite good in this sample as can be seen by
the smoothness of the green curve.
The final type of curve is a hyper-eutectic arrest with a graphitic liquidus, and often with
an austenitic liquidus as well.
Hyper-eutectic iron with graphitic arrest at 4.60% C.E. and other problems

All rights reserved 2008 by David Sparkman, MeltLab Systems
The graphitic arrest is quite weak, but shows up as a clear arrest in the cooling rate.
Looking only at the red temperature curve, it would be easy to miss. But look at the fall
out. We have a good smooth green curve during the eutectic indicting good nodule shape,
but we have two very bad arrests between eutectic and end of freezing. The first arrest at
2:30 minutes into the analysis is exothermic or heat producing. At this point in the curve,
that indicates a D or E flake formation commonly referred to as carbides. The second
smaller arrest is endothermic or heat adsorbing. This is actually shrinkage forming in the
sample.
Hyper-eutectic iron with graphitic arrest at 4.60% C.E. showing carbide arrest and shrink

All rights reserved 2008 by David Sparkman, MeltLab Systems
Shrink in ductile iron thermo analysis
In steel, the shrinkage rule is 10%. This means that the pattern will be designed for all
dimensions to be 10% over stated so that when the casting cools, it will have shrunk to
near the right size. In ductile iron, graphite occupies between 9 and 11% of the volume,
while in liquid ductile iron, carbon occupies no volume. The miracle of ductile iron is
then that graphite grows in the solidifying material to almost perfectly match the
shrinkage. The key word is “almost’. If we get enough graphite to come out of the liquid
at the right time, we produce sound castings. If not, we find shrinkage in our castings.
The purpose of the gating system is to feed liquid into the cavity as the liquid cools.
Liquid iron at 2200 degrees F has less volume per pound than liquid iron at 2300 degrees
F. We want the gates to freeze off before the graphite starts to grow in the mold cavity.
This traps the increase in volume inside the casting; instead of pushing iron back out into
the runner system and making solid risers. This works best if no significant amount of
graphite comes out in the liquid. Obviously if you do have graphite forming in the liquid
you would expect to find a bimodal distribution in your nodule sizes. There is some
discussion if the larger graphite can also grow in the early austenite arrest and so give rise
to bimodal distribution.
The effect of Pearlite on Shrinkage and the thermal analysis
Second, some carbon does remain in the iron after solidification. Some is in the obvious
form of carbides or pearlite, but some remains in solution below microscopic detection.
This is proven by the effect of heat treating causing an increase in graphite volume even
in fully ferritic irons. Increased nodule counts contribute strongly to more complete
graphitization. And obviously carbide stabilizers decrease graphitization. In the thermo
analysis curve, the prolonged eutectic plateau is a good indicator of the degree of
graphitization, and its counter: an early end of the plateau, a good indication of pearlite
content.

All rights reserved 2008 by David Sparkman, MeltLab Systems
Here are two cooling rates, the top is ferritic iron, and the bottom is pearlitic iron. The
energy production of the top curve is significantly greater toward the end of the eutectic
arrest.
In this example of an 80% pearlite, the End of Graphitization is lifted up to about 1.2
degrees per second rate of cooling. Not near as much graphite came out of this iron.
Please remember that the carbon is still all in the matrix, the pearlite does not form until
1400-1450 F. But because it is still in the matrix as a form of austenite, it’s energy has
not yet been released.
The above two examples show the temperature curve of a pearlitic curve (top) and a
pearlitic curve (bottom).

All rights reserved 2008 by David Sparkman, MeltLab Systems
This is an example of Ferrite ductile (<10% pearlite). The 4th derivative is shown in black
so you can see the bend associated with the end of graphitization. This point is at about
0.4 degrees per second rate of cooling, so the material has been able to maintain a much
flatter eutectic due to higher energy production. Of course the ferritic iron also has higher
nodule count, you don’t want to over inoculate pearlitic iron. It gets soft.

All rights reserved 2008 by David Sparkman, MeltLab Systems
In this ductile sample, I would like to introduce the Steady State Cooling Rate concept.
When no crystallizations or solid state transformations are occurring, then the metal
looses heat at a steady, mathematically describable rate due most exclusively to radiation
and conduction. Here I have drawn straight lines to represent the SSCR of the iron liquid
(SSCRL), and the iron solid (SSCRS). The lines are slightly offset so that you can see
how they parallel the actual readings. In reality the lines show a slight bend and are
logarithmic. The reason for the different slopes is that conductivity and radiation rates
change with structure.
The usefulness of this concept is that these lines can serve as a boundary or delimiter for
energy production. Combined together, they define what in the literature is called the
zero line. Here is an example of how those lines extend to make energy boundaries.

All rights reserved 2008 by David Sparkman, MeltLab Systems
The start of Liquidus is where the curve breaks away from the SSCRL cooling rate and
begins to produce heat. Linking this with the SSCRS gives us the upper boundary for
calculating the energy of solidification, as well as a lower boundary to calculate the
energy adsorbed by the grain boundary solidification. These are very important
measurements for calculating the quality of the ductile iron. Knowing the total energy of
solidification allows us to ratio any arrest such as carbides or shrinkage against the total
energy, and come up with a percentage of energy for each type of arrest. While the
energy for each type of reaction may differ (different specific heats), knowing that one
sample had carbides of 1% of the total energy vs. one with 0.1% of the total energy
allows us to understand the severity of the problem.
Understanding where the lines come from, let’s look at the meaning of the area under the
Solidus point known as the grain boundary stress area (GBSA). This is an endothermic
reaction that sucks up energy due to disorder (stress) in the grain boundaries between
crystals. Sometimes it is quite large, sometimes it is quite small. Nova Cast has used the
height of the point as a shrink indicator based on their studies, and for good reasons.
There should always be stress in the grain boundaries after solidification. In the long
term, heat treating removes these stresses by increasing the amount of graphite present.
But in the short term, there is too little iron for too much volume and there is only one
way to reduce the stress – shrinkage. The shrinkage may take the form of a suck-in on the
top or sides of the thermal analysis cup, or by forming actual shrinkage inside the casting.
The shrinkage shows up on the thermal analysis curve, the suck-in does not.
So a quick estimate of this stress is the height of the Solidus point. But since that can vary
with how well the cup is filled, a better estimate can be the area between the Rate of
Cooling curve and the zero line ratio against the total energy of solidification.

All rights reserved 2008 by David Sparkman, MeltLab Systems
In summary, shrinkage has many causes, graphitic liquids’ can remove significant
amounts of carbon, the carbon/C.E. content may be too low, inoculation can alter when
and how much of the graphite comes out. Pearlitic irons are designed to retain from 0.3 to
0.6% carbon in the matrix which later comes out as between 40 and 80% pearlite. (40%
times 0.8 Carbon in 100% pearlite equals 0.32% retained carbon.)

All rights reserved 2008 by David Sparkman, MeltLab Systems
Statement of thanks (With a slight nod to Bill O’Reilly for an attitude check)
It is customary in research papers to list a biography of all references searched. While this
is a good practice and recommended and even required by those who pass judgment on a
paper’s worthiness, I find it difficult to recommend most research on this subject as they
contain so many errors and misconceptions. While a good grounding in metallurgy is
necessary to understand some of these concepts, and history is an interesting field, the
study of disease and astronomy before the age of the invention of the optical lens by
Galileo produced mostly useless information.
In metallurgical thermo analysis, the lack of clear and sharp derivatives made analysis
only guesswork. A paper by a studied researcher mentioned the elusive graphite arrest. It
is visible in DTA but not in normal thermo analysis. Therefore many researchers do not
believe that you can produce graphite in a liquid in normal foundry iron. But you can see
it with the modern tools of MeltLab.
My Heroes My thanks go out to Jeff Burk, Dick Heine and Bill Shaw for first interesting me in the
possibilities of TA, to Carl Loper for introducing me to grain boundary freezing, to
Toban xxx for an interesting discussion on graphitization of ferritic and pearlitic irons.
And finally to Doru Stephenescu for discussions on the Zero curve.
Now for the Pinhead section My undying gratitude goes to ElectroNite for copying MeltLab’s Solidus Point and for
their continuing hatred and putdowns of MeltLab that have only encouraged me to
embarrass them further. Last overheard from them: “what are we going to do about those
people in Virginia?”
My undying gratitude goes to greedy Minco and OCC for selling our products to a few
customers while secretly having programmers attempt to duplicate MeltLab. Sorry those
products failed.
And finally my fond farewell to NovaCast who through kickbacks (up to 20% according
to one Metallurgist) and other financial incentives, tried to sell an overpriced box (40k+).
They exchanged heavy advertising in the DIS for preferred treatment in making multiple
presentations that included nothing but more advertising. They also succeeded in hiring
away a technical writer/researcher from us to get at MeltLab technology. Their attempt,
with investor money, to control the market for ductile thermo analysis is now coming to
an end. Their promises to investors were just smoke and mirrors. Now that Elkem Metals
(a good company with value in its products) has produced an ATAS Light product (there
is a lawsuit over that), and with the introduction of MeltLab for Ductile, the overpriced
ATAS product will soon, if not already, be history.