Duct Sealing in Large Buildings
31
Duct Sealing in Large Buildings Course No: M02-016 Credit: 2 PDH Steven Liescheidt, P.E., CCS, CCPR Continuing Education and Development, Inc. 9 Greyridge Farm Court Stony Point, NY 10980 P: (877) 322-5800 F: (877) 322-4774 [email protected]
Transcript of Duct Sealing in Large Buildings
Duct Sealing in Large Buildings Course No: M02-016
Credit: 2 PDH
Steven Liescheidt, P.E., CCS, CCPR
Continuing Education and Development, Inc. 9 Greyridge Farm Court Stony Point, NY 10980 P: (877) 322-5800 F: (877) 322-4774 [email protected]

LBNL-42414
1
Sealing Ducts in Large Commercial Buildings with Aerosolized Sealant Particles
M. P. Modera, O. Brzozowski**, F. R. Carrié *, D. J. Dickerhoff,
W. W. Delp, W. J. Fisk, R. Levinson, D. Wang
Abstract
Electricity energy savings potential by eliminating air leakage from ducts in large
commercial buildings is on the order of 10 kWh/m2 per year (1 kWh/ft2). We have tested,
in two large commercial buildings, a new technology that simultaneously seals duct leaks
and measures effective leakage area of ducts. The technology is based upon injecting a
fog of aerosolized sealant particles into a pressurized duct system. In brief, this process
involves blocking all of the intentional openings in a duct system (e.g., diffusers).
Therefore, when the system is pressurized, the only place for the air carrying the aerosol
particles to exit the system is through the leaks. The key to the technology is to keep the
particles suspended within the airstream until they reach the leaks, and then to have them
leave the airstream and deposit on the leak sites. The principal finding from this field
study was that the aerosol technology is capable of sealing the leaks in a large
commercial building duct system within a reasonable time frame. In the first building,
66% of the leakage area was sealed within 2.5 hours of injection, and in the second
building 86% of the leakage area was sealed within 5 hours. We also found that the
aerosol could be blown through the VAV boxes in the second building without impacting
their calibrations or performance. Some remaining questions are (1) how to achieve
sealing rates comparable to those experienced in smaller residential systems; and (2) what
tightness level these ducts systems can be brought to by means of aerosol sealing.
** Ecole Nationale Superieure d’arts et Metiers (ENSAM), Paris, France * On leave from Ecole Nationale des Travaux Publics de l’Etat, Laboratoire des Sciences de l’Habitat, DGCB – URA CNRS 1652, 2 rue Maurice Audin, 69518 Vaulx-en-Velin Cedex, France

LBNL-42414
2
Introduction
Considerable research has been conducted on the leakage levels of various types of ducts
and duct fittings (ASHRAE 1997, Swim and Griggs 1995), and the Sheet Metal
Contractors National Association (SMACNA) even has a manual on HVAC duct leakage
(SMACNA 1985). The SMACNA manual defines the leakage class as a metric to
characterize the leakage area of a duct system. It is based on the leakage airflow rate at
one inch of water (250 Pa) normalized by the duct surface area. According to ASHRAE
(1997), leakage classes of 3 to 12 cfm @ 1” H2O / 100 ft2 are attainable for “commonly
used duct construction and sealing practices” when leakage at connections to grilles,
diffusers, and registers is not considered. However, these values are well below published
values of US field studies.
In-situ measurements of overall duct leakage have been the subject of considerable
research over the past ten years in single-family residential buildings (Cummings et al.
1990, Davis and Roberson 1993, Jump and Modera 1994, Jump et al. 1996, Modera
1993, Modera and Jump 1995, Parker et al. 1993, Proctor and Pernick 1992). The general
consensus that evolves from these papers is that residential duct systems have
considerable leakage (10-20% of fan flow on each side of the fan), and that that leakage
has important impacts on energy use and cooling capacity. Several field studies of duct
leakage in small- or light-commercial buildings (generally less than 900 m2 (10,000 ft2))
have been conducted in California and Florida (Cummings et al. 1996, Delp et al. 1998a,
Delp et al. 1998b). Delp et al. (1998c) report total leakage classes on 33 small-
commercial buildings that range from 130 to 1300 cfm @ 1” H2O / 100 ft2, with a mean
of 447 cfm @ 1” H2O / 100 ft2. Also, these field studies suggest that duct leakage in these
buildings is actually higher than that found in residences, the average leakage in the
supply ducts being about a quarter of fan flow.
Prior investigations on duct leakage in large commercial buildings in the US are very
limited, although testing-and-balancing engineers have numerous anecdotal stories of
high leakage rates in such buildings. The only work easily available is that of Fisk et al.
LBNL-42414
3
(1998) who report ASHRAE leakage classes that range from 60 to 270 cfm @ 1” H2O /
100 ft2 in four ductwork sections of two large commercial buildings. Besides, detailed
analyses based on numerical simulations suggest large energy implications of duct
leakage for this type of buildings. Franconi et al. (1998) estimate that duct leakage results
in an increase in annual fan energy consumption of about 55% based on simulations on a
VAV system with a ducted supply and a ceiling-plenum return. Given that fans in large
commercial buildings consume approximately 30 kWh/m2 per year (3 kWh/ft2) (Modera
et al., 1999), eliminating air leakage from large commercial duct systems would result in
an electricity energy savings potential on the order of 10 kWh/m2 per year (1 kWh/ft2).
This paper reports on the application, in two large commercial buildings, of a new
technology that simultaneously seals duct leaks and measures effective leakage area of
ducts. The technology is based upon injecting a fog of aerosolized sealant particles into a
pressurized duct system. In brief, this process involves blocking all of the intentional
openings in a duct system (e.g., diffusers). Therefore, when the system is pressurized, the
only place for the air carrying the aerosol particles to exit the system is through the leaks.
The key to the technology is to keep the particles suspended within the airstream until
they reach the leaks, and then to have them leave the airstream and deposit on the leak
sites. The use of aerosol particles to seal ductwork from the inside was brought to the
proof-of-concept stage in 1994 by researchers at Lawrence Berkeley National Laboratory
(LBNL) (Modera and Carrié 1996, Carrié and Modera 1998). The technology has been
applied in several thousand residential buildings, some of which have been reported on in
the literature (Modera et al. 1996). Although leaks as wide as 1.6 cm (5/8 inch) can be
sealed with this technique, it is recommended that leaks larger than about 6-7 mm (1/4
inch) be sealed manually before aerosol sealing is performed.
Although aerosol duct-sealing has been successfully tested in natural ventilation shafts, it
is not suitable for many other building cavities such as ceiling-plenum returns or HVAC
rooms. When present, these cavities can account for a large portion of the total HVAC
system leakage (Cummings and Withers 1998) and may have a significant impact on the
system energy use. However, Franconi et al. (1998) have shown that sealing supply leaks

LBNL-42414
4
in large commercial buildings that use the ceiling plenum as a return should result in
significant energy savings.
The first aerosol-based ductwork sealing in a commercial building was completed in
1997, and was performed on a flexduct system connected to a rooftop HVAC packaged
unit on a small office building. Although that sealing process proved to be very
successful, sealing the ductwork in a large commercial building poses previously
unaddressed challenges. Specifically, large commercial buildings contain duct systems
that are larger in cross-section, and considerably longer. Also, large systems may
incorporate equipment within the ductwork, including Variable-Air-Volume (VAV) flow
control boxes, and turning vanes, which might be sensitive to aerosols.
The goals of our research are (1) to assess the applicability of sealing large duct systems
with the aerosol-based sealing technology; and (2) to develop and test the required
sealing equipment and protocols for this type of sealing.

LBNL-42414
5
Methodology
Our methodology consisted of field testing of the sealing technology in two large
commercial buildings, along with limited laboratory investigations of the impacts of
aerosols on VAV performance and operation, and of various taping protocols used to
temporarily seal off diffusers.
Building selection
We performed field tests on isolated sections of ductwork in two commercial buildings,
both of which were constructed of rectangular sheetmetal ducts with external insulation.
One was a Constant-Air-Volume (CAV) system, and the other was a Variable-Air-Volume
(VAV) system with turning vanes and three VAV boxes. Both systems are shown
schematically in Figure 1 and Figure 2, and some of their physical characteristics are
summarized in Table 1.
Isolation of sections of ductwork
In order to perform the sealing process and effective leakage area (ELA) measurement,
the selected sections of ductwork had to be isolated from the building, as well as from
other sections of the ductwork that might contain sensitive components (e.g.,
heating/cooling coils, fans, etc.). The isolation of the ducts from the conditioned portions
of the building was accomplished using a combination of clear tapes designed to
withstand the pressures generated by the aerosol sealing process. Although the tapes were
found to withstand up to 400 Pa at room temperature during laboratory testing at LBNL,
they showed some signs of failure at 200 Pa in Building LS-1 at the elevated
temperatures associated with aerosol sealing. This resulted in the sealing process being
stopped short of completion in Building LS-1. The combination of a different diffuser
design and the use of more-adhesive tape allowed the sealing process to be brought to
completion in Building LS-2 (see Figure 3). To protect other sections of the ductwork and
building from aerosol exposure, barriers made of cardboard and polystyrene panels were
taped in place across the duct section just upstream of the injection point.

LBNL-42414
6
Aerosol injection apparatus
Aerosol injection was achieved using an apparatus that consists of (1) a fan capable of
maintaining the proper airflow in the duct system; (2) several electric resistance heaters;
(3) a counter-rotating-vortex atomization nozzle; (4) a high-pressure fan to drive the flow
through the nozzle; and (5) a peristaltic pump to supply the liquid-suspended sealant
material. The heaters, which provide a total of 6.6 kW of heating, serve to evaporate
away the water in which the sealant material is suspended. The water is evaporated away
so as to create solid sticky particles prior to the mist entering the duct system (suspension
is 12% solids by weight). The fan in the injection apparatus is designed to maintain duct
flow over the range of pressures created in the duct system during sealing. The objective
is to maintain an air velocity on the order of 1 m/s (3.3 ft/s) in the main trunk ducts
during the sealing process. The peristaltic pump maintains a steady flowrate of liquid
through the nozzle.
We used a Mark V (University of Washington) cascade impactor with 10 stages to assess
in the laboratory the particle size distribution generated by the atomization nozzle (Pilat
et al. 1970). Approximately 80% of the mass of these particles have aerodynamic
diameters larger than 5 µm.
Effective Leakage Area measurement
The Effective Leakage Area (ELA) at a reference pressure of 25 Pa is defined as the
effective size of an orifice that would produce the same flow as the sum of the duct leaks
at 25 Pa. It is not the physical area of the hole, but rather the effective area (e.g., the ELA
of a sharp-edged orifice is about 0.6 times its physical area). The ELA of both duct
systems was measured before, after, and during sealing, using the same equipment
employed to perform the sealing, which is connected to the duct system with a tube of
clear 0.65 m (25.5 inch) diameter lay-flat polyethylene tubing (see Figure 4). The ELA
before and after sealing was measured at 25 Pa (0.1 inches H2O) duct pressure by means
of an automated leakage test in which the computer adjusts the fan flow until the duct
pressure is equal to 25 Pa.
LBNL-42414
7
The ELA of the duct system at 25 Pa was also measured continuously by the computer
during the sealing process. This is accomplished by continuously monitoring the flow
through the fan and the pressure in the duct system. The ELA at 25 Pa is obtained by
extrapolating the measured flow down to a pressure of 25 Pa, assuming a flow exponent
of 0.6.
As the ELA tests performed acquire data similar to that obtained according to the
SMACNA HVAC Air Leakage Test Manual (SMACNA 1985), we can also calculate the
leakage class of these duct systems using the SMACNA flow exponent of 0.65. The
SMACNA leakage class is defined as the leakage flow in cfm per 100 ft2 at a pressure
differential of 1" H2O (250 Pa). (Note that the leakage class has dimensions of cfm per
100 ft2.)
Aerosol concentration measurements
We devised a simple method to measure the particle concentration in the air leaving the
duct at several locations in the system. This method does not require expensive aerosol
sampling devices and is fairly easy to use on site. The basic principle behind this
technique is to capture on an impaction plate most of the injector-generated particles
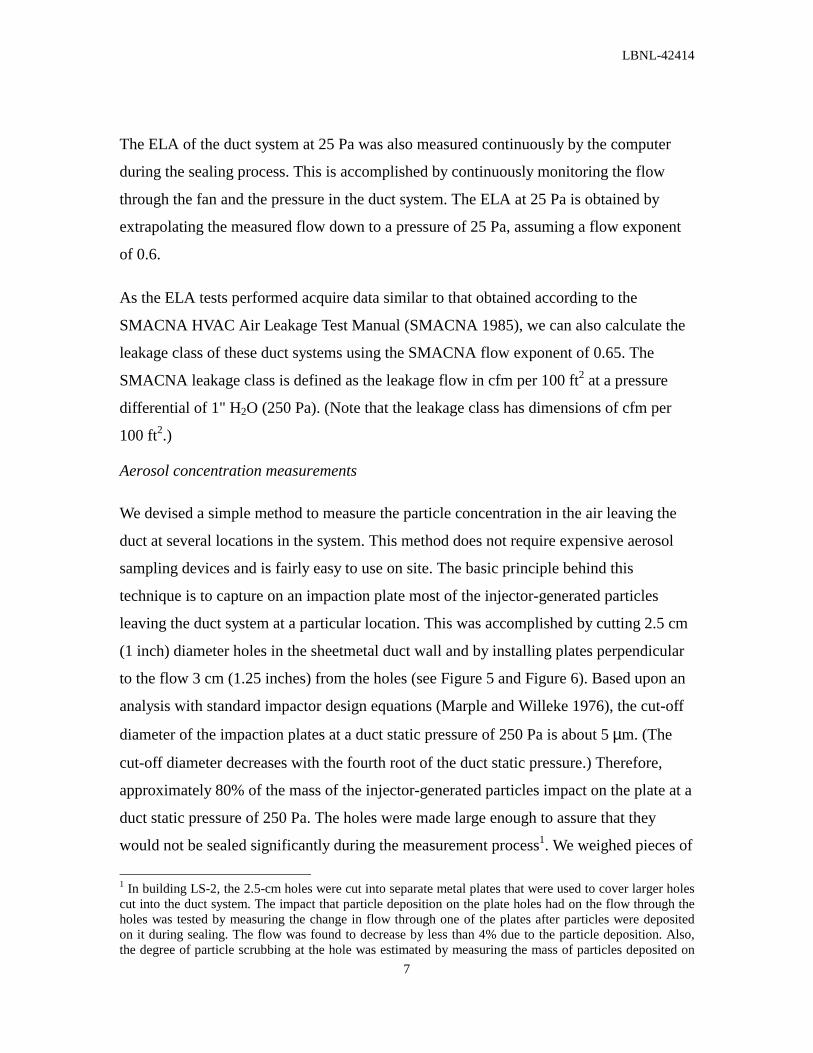
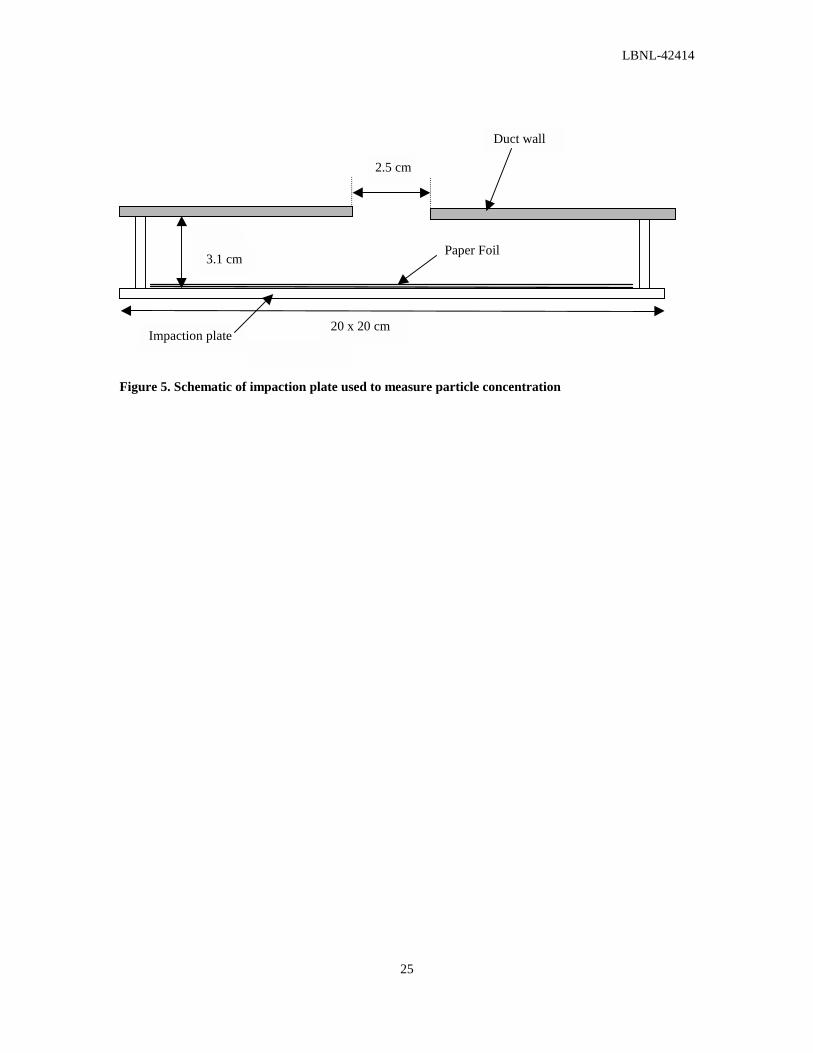
leaving the duct system at a particular location. This was accomplished by cutting 2.5 cm
(1 inch) diameter holes in the sheetmetal duct wall and by installing plates perpendicular
to the flow 3 cm (1.25 inches) from the holes (see Figure 5 and Figure 6). Based upon an
analysis with standard impactor design equations (Marple and Willeke 1976), the cut-off
diameter of the impaction plates at a duct static pressure of 250 Pa is about 5 µm. (The
cut-off diameter decreases with the fourth root of the duct static pressure.) Therefore,
approximately 80% of the mass of the injector-generated particles impact on the plate at a
duct static pressure of 250 Pa. The holes were made large enough to assure that they
would not be sealed significantly during the measurement process1. We weighed pieces of
1 In building LS-2, the 2.5-cm holes were cut into separate metal plates that were used to cover larger holes cut into the duct system. The impact that particle deposition on the plate holes had on the flow through the holes was tested by measuring the change in flow through one of the plates after particles were deposited on it during sealing. The flow was found to decrease by less than 4% due to the particle deposition. Also, the degree of particle scrubbing at the hole was estimated by measuring the mass of particles deposited on

LBNL-42414
8
paper clipped to the inside face of the impaction plates before and after being exposed to
the exiting jet of aerosol particles. In addition, during each measurement period, the
pressure differentials across the holes were monitored. These pressure differentials, along
with orifice-flow equations for the holes, were used to determine the total volume of air
leaving the holes during the measurement periods. The particle concentration leaving the
duct system at a specific location is equal to the measured mass of material deposited on
the paper divided by the total volume of air leaving the hole during that period.
Aerosol deposition on duct walls
Previous experience with sealing of residential duct systems has shown that there are
large variations in sealing rates between different systems, and various possible
explanations for those differences. Namely, particles removed from the airstream by
gravitational settling and turbulent diffusion or particles that escape through the leaks are
not available for sealing the leaks. For this reason, we devised some simplified means for
evaluating the fate of the particles leaving the aerosol spray nozzle.
The first possible removal point for those particles is in the lay-flat plastic tubing used to
connect the injection machine to the duct system. The losses on that tubing were
measured in aggregate by weighing the tubing before and after the injection process.
The ratio of the particle mass concentration at some location in the duct system to the
concentration entering the duct system decreases with distance from the injection point
only because of particle deposition on the duct walls by gravitational settling and
turbulent diffusion. Therefore, this ratio provides us with an indication of the extent of
aerosol deposition on the duct walls. Note, however, that neither the penetration at a
particular point in a duct system—i.e., the fraction of injected particles that are available
for sealing downstream of that location—nor the fractional losses on the duct walls
upstream of that location can be deducted from the concentration measurements only. To
this end, airflow rate measurements would be necessary. However, these measurements
one of the holes. It was found to have represented 3% of the total deposition on that impaction plate. The deposition on that plate was used as a correction factor in the concentration calculations for all of the plates.

LBNL-42414
9
are very difficult to perform on site, particularly in the transient conditions of the sealing
process.
The average mass concentration of the aerosol leaving the duct system was measured at
several locations using the impaction technique described above. The concentration
entering the duct system was calculated from the ratio of the measured air and liquid flow
rates through the injector, multiplied by the ratio of solids mass to total mass in the
injected liquid (0.12), and the fraction of the solid that was not deposited on the lay-flat
tubing.
Register flow measurements
One expected benefit of duct sealing lies in the potential reduction of the fan flow rate,
which can result in substantial energy savings (Franconi et al. 1998). To quantify this
effect, register flow measurements were performed before and after aerosol sealing in
Building LS-2. This was achieved with an LBNL-designed active flow-hood described by
Fisk et al. (1998). It basically consists of a collection hood connected in series with a
variable-speed fan equipped with an integral flow meter. The fan speed was adjusted to
maintain a zero static pressure difference between the interior of the collection hood and
the room air. Therefore, the register flow rate should only be marginally affected by the
presence of the device, the boundary conditions seen by the register being the same with
and without the hood. With this device, we expect to measure the flows at the registers
with an accuracy of ±5%.
To make relevant comparisons, we assured that the airflow measurements were
performed at similar duct system operating conditions, i.e., the fan was turned to full-
speed and the VAV dampers were blocked in fully-open positions.

LBNL-42414
10
Results and Discussion
Measurement of Effective Leakage Areas
The measured ELAs of the two duct systems before and after sealing are summarized in
Table 2.
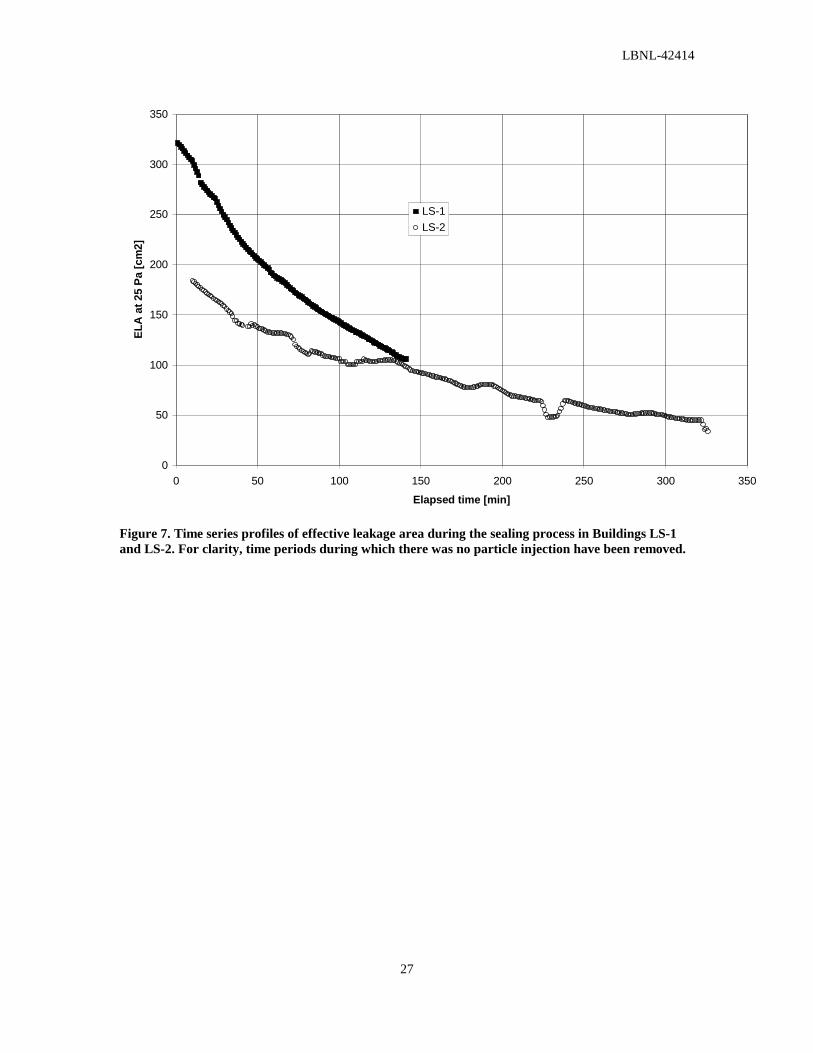
The profiles of measured ELA during the sealing process are presented in Figure 7.
(These profiles are based on flows extrapolated using a flow exponent of 0.6, which
explains the discrepancies between the final ELAs shown in Figure 7 and the post-sealing
ELAs calculated with the airflow rate measurement at 25 Pa reported in Table 2.) These
data are similar to what is provided on a computer screen during the sealing process, the
difference being the units and the combination of two sealing profiles in Figure 7.
It is clear from Figure 7 that the sealing process can be well documented by the hardware
used to do the sealing. However, it is also clear that the sealing process was considerably
more rapid in Building LS-1. There were a number of differences between the two
buildings that could contribute to the observed difference in sealing rates. The two most
obvious differences are that the system in Building LS-2 is both considerably larger and
considerably tighter (in terms of ELA). Figure 7 shows that the sealing rates seem to be
dropping off as the systems become sealed and that Building LS-1 has slightly higher
sealing rates at the overlapping leakage levels for Buildings LS-1 and LS-2. Three
possible explanations for the change in sealing rate with duct tightness are (1) that as the
ELA is reduced the flow through the system is reduced according to the injector fan
curve, with the lower flows for the tighter system resulting in less particle penetration; or
(2) that the smaller leaks are sealed first, leaving the larger leaks with lower sealing
efficiency to be sealed later in the process; or (3) that leaks close to the injection point are
sealed first, which leaves leaks further from the injection point to be sealed, which are
subjected to lower penetration rates.

LBNL-42414
11
Aerosol concentration measurements
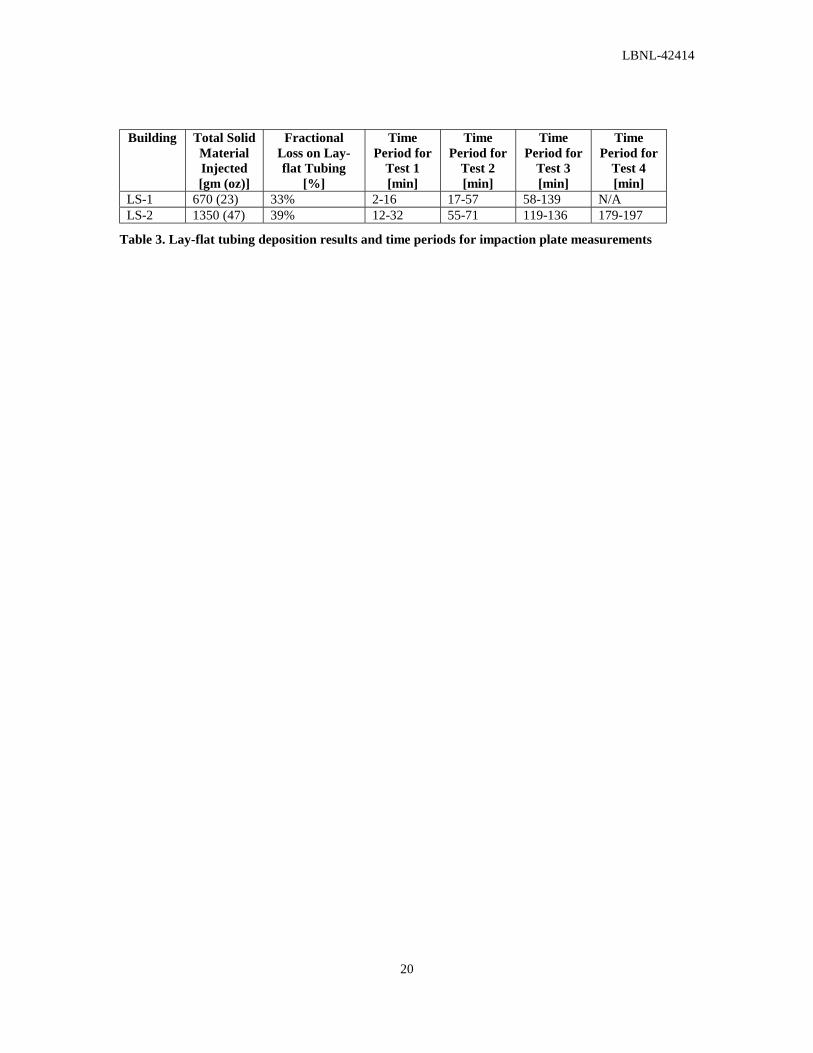
The depositional losses of particles on the lay-flat tubing and time periods for the
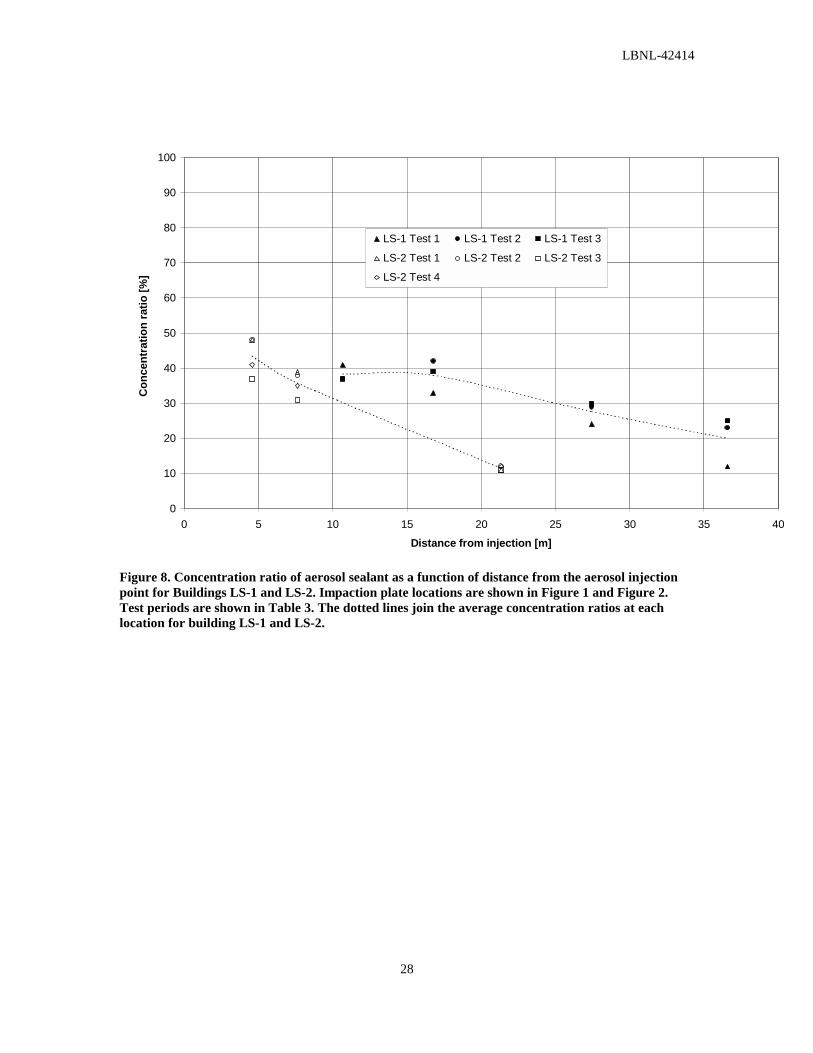
impaction plate measurements are summarized in Table 3. The aerosol concentration
ratios in the duct system from the impaction plates are presented as a function of distance
from the injection point in Figure 8. The concentration ratios in Figure 8 are based on the
concentration of particles entering the duct system (i.e., the losses to the lay-flat tubing
are subtracted prior to calculating the ratio).
Table 3 shows that a significant fraction of sealant material is lost in the lay-flat tubing,
and Figure 8 displays concentration ratios in the range of 10 to 50%. These results
suggest that there is significant deposition in the duct system prior to the sealant material
reaching the leaks. Also, hypothesizing that leaks close to the injection point are sealed
first to explain the lower sealing rates observed later in the sealing process (see Figure 7)
is consistent with the significant decrease in the concentration ratios with distance from
the injection point. On the other hand, Figure 8 suggests that, because the concentration
ratios do not change significantly as the system is sealed, the decreasing sealing rates
with duct tightness are probably not due to lower penetration rates.
Aerosol particles in VAV units
It is of course possible to isolate VAV boxes from aerosol particles by blocking off the
box and injecting on either side. However, the sealing process would be simplified
considerably if we are able to let aerosol particles pass through the VAV units; i.e., the
leaks upstream and downstream of the units could be sealed simultaneously from the
same injection point. For this reason, we injected aerosol-laden air through the three VAV
boxes in Building LS-2. To test for potential detrimental effects of aerosol particle
injection on the performance of the VAV terminal units, the flow calibration of one of the
units in Building LS-2 was tested before and after the sealing process. (The pressure
sensor tubes were pressurized with clean air during the sealing process.) The calibrations
were performed by simultaneously measuring the velocities with a hot-wire anemometer
on a grid within the duct just downstream of the VAV unit while measuring the pressure
signal from the VAV flow sensor. A comparison of pre- and post-sealing VAV calibrations

LBNL-42414
12
is presented in Figure 9, which suggests that the sealing process did not impact the flow
sensor on the VAV box. We also verified that the damper on the VAV unit operated
properly after the sealing process.
A separate laboratory experiment was also performed to assess the influence of the
aerosols on another VAV control unit. Its airflow sensor was calibrated in the laboratory.
The unit was then installed in a laboratory duct system and subjected to aerosol sealant at
an air velocity of 0.5 m/s at the VAV inlet and a dry aerosol concentration of
approximately 0.3 g/m3, typical for a sealing operation. For the experiment, the VAV unit
with its damper fully open was subjected to aerosol flow for two hours. The unit survived
with no discernable ill effects; there was no change in its flow meter calibration, and
damper function was normal.
Impact of duct leakage reduction on register flow rates
The measured register flow rates before and after sealing in Building LS-2 are displayed
in Figure 10. It is noteworthy that the sealing had a very significant impact on the flow
rates of some registers. The relative increase in airflow rate through individual registers
ranges from about -5 to +48%; it is greater than 10% for three registers. The total airflow
rate increased by 5.4%. A statistical analysis was performed to derive the error bounds of
the total airflow rate increase. The accuracy of the active flow-hood being ±5% for each
of the 18 individual measurements (registers 15 and 20 had no flow), the expected
accuracy on the total airflow rate measurement can be estimated by %2.118
%5 = . This
error adds in quadrature as we look at the difference between pre- and post-sealing total
airflow rate measurements. Therefore, the expected absolute error on the airflow rate
increase is ( )2%2.12 = 1.7%. In sum, the total airflow rate increased by 5.4% ±1.7%.

LBNL-42414
13
Conclusions
Our aerosol sealing field trials in two large commercial buildings showed that 66% to
86% of the leakage in the duct systems could be sealed within several hours of aerosol
injection, with no identified adverse impacts from the sealing process. These results
suggest that with the commercially available sealing equipment that we used, we will
often need to isolate sections of entire duct systems in order to seal them. New equipment
and protocol developments (e.g., higher capacity injection units, or multiple injection
units) could increase the size of duct sections that can be sealed.
One expected benefit of duct sealing lies in the potential reduction of the fan flow rate,
which can result in substantial fan energy savings (Franconi et al. 1998; Modera et al.
1999). The fan energy consumption in large office buildings in the US is typically on the
order of 30 kWh/m2 per year (3 kWh/ft2) (Modera et al. 1999). Besides, since the fan
power is somewhere between a quadratic and cubic function of fan flow rate, achieving a
change in the fan flow as low as 5% would result in 10 to 15% savings on the fan energy
use. This suggests energy savings on the order of 3 to 4.5 kWh/m2 per year assuming an
airflow rate change of 5%.
Despite the overall success of the sealing experiments, the aerosol concentration ratios
from the two field trials indicate relatively low particle penetrations on the long duct runs,
which clearly is increasing the time required for sealing. Some options under
consideration to reduce sealing times are (a) producing smaller particles; (b) injecting at
multiple locations along the length of the duct system; (c) using higher flow rates at a
single point in the duct system; or (d) using air extraction at the end of the long duct runs
to improve penetration. Implementation of one of these options may be necessary when
larger and longer sections of ductwork are sealed.
Our measurement data leaves two possible explanations for the decreasing sealing rates
over the course of the sealing process: (1) small leaks are sealed first, leaving larger leaks
that seal less efficiently; (2) leaks close to the injection point are sealed first, which leaves

LBNL-42414
14
leaks further from the injection point to be sealed, which are subjected to lower
penetration rates.
The two field trials presented in this paper indicate that aerosolized sealant particles can
be used to seal ducts in large commercial buildings, with the sealing taking place over
periods of a few hours. Moreover, we conclude that it is possible to blow aerosol sealant
through some VAV boxes without adverse impacts.
On the other hand, there is considerable room for improvement with respect to the sealing
rates achievable with this technology, particularly considering the significant decrease in
measured aerosol concentrations with distance from the injection point. Further research
is needed to assure that aerosol sealing does not damage VAV control units, but the first
results presented in this paper are very promising. Further engineering is also needed to
develop a practical technique for sealing the diffuser grilles during the sealing process.
Modeling is underway to quantify the energy savings available from sealing of different
types of HVAC systems found in large commercial buildings (Franconi et al. 1998).
References
ASHRAE (1997). 1997 ASHRAE Handbook: Fundamentals, American Society of
Heating, Refrigerating, and Air Conditioning Engineers, Inc., Atlanta.
Carrié, F. R. and Modera, M. P. (1998). Particle deposition in a two-dimensional slot from
a transverse stream, Aerosol Science and Technology, 28(3): 235-246.
Cummings, J. B., Tooley, J. J., Jr., and Dunsmore, R. (1990). Impacts of duct leakage on
infiltration rates, space conditioning energy use, and peak electrical demand in Florida
homes, Proceedings of ACEEE Summer Study, Pacific Grove, California, August 1990.
American Council for an Energy Efficient Economy, Washington, D.C.
Cummings, J. B., Withers, C. R., Moyer, N., Fairey, P., and McKendry, B. (1996)
Uncontrolled airflow in non-residential buildings, Florida Solar Energy Center, FSEC-
CR-878-96.

LBNL-42414
15
Cummings, J. B., and Withers, C. R. (1998). Building Cavities Used As Ducts: Air
Leakage Characteristics and Impacts in Light Commercial Buildings. ASHRAE Trans.
104(II) 1998, pp. 743-752.
Davis, B. E. and Roberson, M. R. (1993). Using the “pressure pan” technique to prioritize
duct sealing efforts: a study of 18 Arkansas homes. Energy and Buildings, 20(1): 57-63.
Delp, W. W., Matson, N. E., Tschudy, E., Modera, M. P., and Diamond, R. C. (1998a).
Field investigation of duct system performance in California light commercial buildings.
ASHRAE Trans. 104(II) 1998, TO-98-8-1.
Delp, W. W., Matson, N. E., Dickerhoff, D. J., and Modera, M. P. (1998b). Field
investigation of duct system performance in California small commercial buildings
(round II), Proc. ACEEE Summer Study 1998, pp. 3.105-3.116.
Delp, W. W., McWilliams, J., Dickerhoff, D. J., Wang, D., and Modera, M. P. (1998c).
Thermal distribution losses in light-commercial buildings. What we know, and where we
need to go from here. Lawrence Berkeley National Laboratory, LBNL-42415.
Fisk, W. J., Delp W. W., Diamond, R., Dickerhoff, D. J., Levinson, R., Modera, M. P.,
Nematollahi, M., Wang, D. (2000). Duct systems in large commercial buildings: physical
characterization, air leakage, and heat conduction gains. Energy and Buildings, 32: 109-
119.
Franconi, E., Delp, W.W., and Modera, M. (1998). Impact of duct air-leakage on VAV
system energy use, Lawrence Berkeley National Laboratory, LBNL-42417.
Hinds, W.C. (1982). Aerosol Technology: Properties, behavior, and measurement of
airborne particles. John Wiley & Sons. New York, USA.
Jump, D. A., and M. P. Modera. 1994. Impacts of Attic Duct Retrofits in Sacramento
Houses. Proceedings of the 1994 ACEEE Summer Study on Energy Efficiency in
Buildings, 9:195-203. Washington D. C.; American Council for an Energy Efficient
Economy.
LBNL-42414
16
Jump, D. A., I. S. Walker, and M. P. Modera. 1996. Field Measurements of Efficiency and
Duct Retrofit Effectiveness in Residential Forced Air Distribution Systems. Proceedings
of the 1996 ACEEE Summer Study on Energy Efficiency in Buildings, 1: 147-155.
Washington D. C.; American Council for an Energy Efficient Economy.
Marple, V.A., and Willeke K. (1976). Impactor design. Atmospheric Environment, 10:
981-896.
Modera, M. P. (1993). Characterizing the performance of residential air distribution
systems, Energy and Buildings, 20(1): 65-75. Lawrence Berkeley National Laboratory,
LBL-32532.
Modera, M. P., and Jump, D. A. (1995). Field Measurements of the Interactions Between
Heat Pumps and Duct Systems in Residential Buildings. In Proceedings of ASME
International Solar Energy Conference, March, 1995. Lawrence Berkeley Laboratory,
LBL-36047.
Modera, M. P., Xu, T., Feustel, H., Matson, N., Huizenga, C., Bauman, F., Arens, E., and
Borgers, T. (1999). “Efficient Thermal Energy Distribution in Commercial Buildings”.
Final report to California Institute of Energy Efficiency. Lawrence Berkeley National
Laboratory, LBNL-41365.
Modera, M. P. and Carrié, F. R. (1996). Method and device for producing and delivering
an aerosol for remote sealing and coating, The Regents, University of California. USA,
US Patent N° 5,522,930. Jun. 4, 1996.
Modera, M. P., Dickerhoff, D. J., Nilssen, O., Duquette, H., and Geyselaers, J. Residential
Field Testing of an Aerosol-Based Technology for Sealing Ductwork. Proceedings of
ACEEE Summer Study, Pacific Grove, CA, August 1996, Lawrence Berkeley Laboratory
Report, LBL-38554.
Parker, D., Fairey, P., and Gu, L. (1993). Simulation of the effects of duct leakage and
heat transfer on residential space-cooling energy use, Energy and Buildings 20(2): 7-114.

LBNL-42414
17
Pilat, M., Ensor, D. S., and Bosh, J. C. (1970). Source Test Cascade Impactor,
Atmospheric Environment, 4: 671-679.
Proctor, J. P., and Pernick, R. K. (1992). Getting it right the second time: measured
savings and peak reduction from duct and appliance repairs, Proceedings of ACEEE
Summer Study, Pacific Grove, California, August 1992. American Council for an Energy
Efficient Economy, Washington, D.C.
SMACNA (1985). HVAC Air Duct Leakage Test Manual, Sheet Metal and Air
Conditioning Contractors National Association, Inc. Chantilly, Virginia.
Swim, W. B., and Griggs, E. I. (1995). Duct leakage measurement and analysis. ASHRAE
Trans. 101(I), pp. 274-291.

LBNL-42414
18
Building
ID # Age
[yr.]
Floor Area Served by Sealed
Section [m2 (ft2)]
Duct Surface Area
[m2 (ft2)]
Duct Surface Area /Floor
Area [%]
Number of Diffusers
[-]
Nominal Pre-Sealing
Air Flow [L/s (cfm)]
LS-1 39 220 (2400) 80 (840) 35% 15 750 (1600) LS-2 N/A 470 (5000) 180 (1900) 37% 20 1890 (4000)
Table 1. Building and duct-system characteristics

LBNL-42414
19
Building Pre-Sealing
Duct Leakage ELA at 25 Pa
[cm2 (in2)]
Pre-Sealing Leakage
Class [cfm @ 1”
H2O / 100 ft2]
Post-Sealing Duct Leakage ELA at 25 Pa
[cm2 (in2)]
Post-Sealing Leakage
Class [cfm @ 1”
H2O / 100 ft2]
Percentage Reduction in Leakage
[%]
Duration of Aerosol
Injection [h]
LS-1 320 (50) 230 110 (17) 80 66 2.5 LS-2 190 (29) 60 24 (4) 8 86 5
Table 2. Duct-system leakage results
LBNL-42414
20
Building Total Solid Material Injected [gm (oz)]
Fractional Loss on Lay-flat Tubing
[%]
Time Period for
Test 1 [min]
Time Period for
Test 2 [min]
Time Period for
Test 3 [min]
Time Period for
Test 4 [min]
LS-1 670 (23) 33% 2-16 17-57 58-139 N/A LS-2 1350 (47) 39% 12-32 55-71 119-136 179-197
Table 3. Lay-flat tubing deposition results and time periods for impaction plate measurements

LBNL-42414
21
6 m 30”x10” 4.2 m 7.2 m
65x25 cm
45x25 cm
3.6 m
30x20 cm
35x20 cm
4.8 m
3 m
30x20 cm
5.4 m
30x15 cm
8.4 m
0.4 m
About 9 m
4.0 m
Layflat plastic tubing
Aerosol Injection System
Supply register
Impaction plate 4
Impaction plate 1
Impaction plate 3
Injector location
105x25 cm
Impaction plate 2
Figure 1. Duct layout and aerosol injector installation in Building LS-1

LBNL-42414
22
VAV 3
14 13 12
11 10 9
8 7 6
4 3
2 1
5
16
17
18
19
20
VAV 2
VAV 1
7.8 m
9.1 m
2.0 m
7.5 m
11.7 m
10.6 m
5.7 m
1.8 m 6.0 m 5.5 m
2 m
1.2 m
1.2 m
11.4 m
13.2 m
8.4 m
8.3 m
2.4 m
5.2 m
6 m
HVAC room
Ceiling supply grille
Impaction plate 1
Impaction plate 2
Injector location
Impaction plate 3
15
Figure 2. Duct layout and aerosol injector installation in Building LS-2. Supply diffuser 15 was not connected.

LBNL-42414
23
Figure 3. Sealed diffuser in Building LS-2

LBNL-42414
24
Figure 4. Aerosol injection machine connected to Building LS-2 via 0.65 m (25.5 inch) diameter lay-flat polyethylene tubing
LBNL-42414
25
Duct wall
Paper Foil
2.5 cm
3.1 cm
20 x 20 cmImpaction plate
Figure 5. Schematic of impaction plate used to measure particle concentration

LBNL-42414
26
Figure 6. Impaction plate installed in Building LS-2
LBNL-42414
27
0
50
100
150
200
250
300
350
0 50 100 150 200 250 300 350
Elapsed time [min]
ELA
at 2
5 Pa
[cm
2]
LS-1LS-2
Figure 7. Time series profiles of effective leakage area during the sealing process in Buildings LS-1 and LS-2. For clarity, time periods during which there was no particle injection have been removed.
LBNL-42414
28
0
10
20
30
40
50
60
70
80
90
100
0 5 10 15 20 25 30 35 40
Distance from injection [m]
Con
cent
ratio
n ra
tio [%
]
LS-1 Test 1 LS-1 Test 2 LS-1 Test 3
LS-2 Test 1 LS-2 Test 2 LS-2 Test 3
LS-2 Test 4
Figure 8. Concentration ratio of aerosol sealant as a function of distance from the aerosol injection point for Buildings LS-1 and LS-2. Impaction plate locations are shown in Figure 1 and Figure 2. Test periods are shown in Table 3. The dotted lines join the average concentration ratios at each location for building LS-1 and LS-2.

LBNL-42414
29
0
1
2
3
4
5
6
0 100 200 300 400 500 600
VAV flow sensor signal [Pa]
Ups
trea
m v
eloc
ity [m
/s]
Pre-Sealing dataPost-Sealing dataCurve Fit from Pre-Sealing data
Figure 9. Comparison of pre- and post-sealing calibrations of VAV box in Building LS-2

LBNL-42414
30
0
50
100
150
200
250
1 2 3 4 5 6 7 8 9 10 11 12 13 14 15 16 17 18 19 20
Register number
Airf
low
[L/s
]
-10%
0%
10%
20%
30%
40%
50%
Rela
tive
incr
ease
(%)
Pre-Sealing dataPost-Sealing dataRelative increase
Figure 10. Pre- and post-sealing airflow measurements at the registers in Building LS-2.